Article

Quantitative Analysis of Energy Storage Demand in Northeast China Using Gaussian Mixture Clustering Model

1
Power Economic Research Institute of Jilin Electric Power Co., Ltd., Changchun 130021, China
2
Deepwater Engineering Research Center, Dalian University of Technology, Dalian 116024, China
*
Author to whom correspondence should be addressed.
Energies 2025, 18(2), 226; https://doi.org/10.3390/en18020226
Submission received: 11 December 2024 / Revised: 28 December 2024 / Accepted: 4 January 2025 / Published: 7 January 2025
(This article belongs to the Section A: Sustainable Energy)

Abstract

:
The increased share of new energy sources in Northeast China’s power mix has strained grid stability. Energy storage technologies are essential for maintaining grid stability by addressing peak shaving and frequency regulation challenges. However, a clear quantitative assessment of the region’s energy storage needs is lacking, leading to weak grid stability and limited growth potential. This paper analyzes power supply data from Northeast China and models the stochastic characteristics of new energy generation. A joint optimization model for energy storage and thermal power is developed to optimize power allocation for peak shaving and frequency regulation at minimal cost. The empirical distribution method quantifies the relationship between storage power, capacity, and confidence levels, providing insights into the region’s future energy storage demands. The study finds that under 10 typical scenarios, the demand for peaking power at a 15 min scale is ≤500 MW, and the demand for frequency regulation at a 1 min scale is ≤1000 MW. At the 90% confidence level, the required capacity for new energy storage for peak shaving and frequency regulation is 424.13 MWh and 197.65 MWh, respectively. The required power for peak shaving and frequency regulation is 247.88 MW and 527.33 MW, respectively. The durations of peak shaving and frequency regulation are 1.71 h and 0.38 h. It also forecasts the energy storage capacity in the northeast region from 2025 to 2030 under the 5% annual incremental new energy penetration scenario. These findings provide theoretical support for energy storage policies in Northeast China during the 14th Five-Year Plan and practical guidance for accelerating energy storage industrialization.

1. Introduction

With the rapid development of the global economy, energy and environmental issues have become increasingly prominent. To ensure the sustainable use of non-renewable energy, the International Greenpeace Organization is dedicated to mitigating climate change caused by the combustion of fossil fuels such as coal, oil, and natural gas. Countries around the world are continuously promoting the adjustment of industrial and energy structures, with a strong emphasis on the development of renewable energy. According to the World Energy Statistics Yearbook 2024 [1], global electricity generation increased by 2.5% in 2023, reaching a record high of 29,925 TWh. The share of renewable energy in total electricity generation rose from 29% to 30%. In 2023, the capacity of grid-scale battery energy storage systems reached 56 GW, with nearly 50% of the installed capacity coming from China, indicating China’s active participation in promoting the green and stable development of the energy system [1].
As a region rich in wind energy resources in China, Northeast China has actively promoted the construction of new power systems characterized by high renewable energy penetration and a high proportion of power electronic devices in recent years [2]. The share of electricity generation from new energy sources in Northeast China’s power generation mix has been steadily increasing; however, due to the high uncertainty of renewable energy generation [3,4,5,6], research on the required energy storage capacity for renewable energy integration remains insufficient, posing unprecedented challenges to the stability, economy, and growth potential of the grid [7,8,9,10,11,12]. Energy storage, as a key technology for enhancing the penetration of renewable energy in power systems, is crucial to the stability of the power grid [13]. Accurately assessing the energy storage requirements of the power system is not only key to solving grid peak shaving and frequency regulation issues [14], but also a necessary approach to improving grid economy and growth potential. It can effectively address the uncertainties of the grid system and enhance its regulation capability [15].
The determination of energy storage capacity in power systems mainly depends on the proportion of renewable energy sources and the stochasticity and uncertainty of load power. In recent years, many scholars have conducted extensive research on how to determine the distribution and storage capacity of new energy sources. Zhong Hao et al. [16] proposed a two-layer optimal dispatch model of “distribution network–consumer group-consumer” considering the flexible reserve resources of consumers. Zhang Junlong et al. [17] proposed an equivalent model suitable for frequency dynamic analysis of large-scale power grids and applied it to the simulation example of the East China power grid. Mehrdad Ghahramani et al. [18] proposed an uncertainty modeling method based on Hong’s two-point estimation method for scheduling of power distribution systems. Minimize the functional cost and reserve requirements of the distribution system in the presence of wind power, conventional power generation, and energy storage systems. Alireza Zakariazadeh et al. [19] proposed a stochastic multi-objective economic/environmental operational scheduling method based on the augmented ε-constraint approach for energy dispatch and reserve in a smart distribution system with a high penetration of wind power generation, for minimizing the total operating costs and emissions and generates optimal solutions for the scheduling problem.
The criteria for categorizing typical scenarios in the study of power system energy storage capacity are also distinctive. Cheng-Chien Kuo et al. [20] propose an interactive bi-objective planning for solving value trade-off methods for power generation scheduling, which provides a more yielding set of high-quality optimal solutions with constraints on the environmental and fuel costs inherent in large-scale penetration of wind power. Alireza Soroudi et al. [21] provide an optimal set of solutions for the wind generation scheduling problem using a novel Uncertainty Modeling Technique Classification Criteria approach, which gives new ideas for solving probabilistic problems. Jide Niu et al. [22] provide the simplified computation of a robust model for the design of a building’s cooling source under 3000 uncertain scenarios by a method called Bi-Bin, which provides a new solution idea for simplifying the uncertainty factor.
Currently, quantitative forecasts of the need for new energy storage capacity still vary from region to region. Felix Cebulla et al. [23] derive a range of energy storage needs through extensive sensitivity analysis; and based on the reference [23] study, the relevant near-term storage capacity in the U.S., Europe, and Germany [24] indicates the need for more battery storage for the photovoltaic dominated power grid. A.A. Solomon et al. [25] show that photovoltaic penetration of up to about 90% of the annual demand of the grid can be achieved with the right storage capacity and operational strategy. Madeleine McPherson [26] and J. Haas et al. [27] show that model results are highly dependent on the assumed costs and various initial constraints and that new storage technologies can only be realized if they are technically and economically feasible, and that they can only be used if they have a good performance. Junxiao Zhang et al. [28] proposed a multi-stage planning method for distribution networks, which divides the planning cycle of a distribution network into multiple planning stages and revises the planning scheme for each stage based on the latest information during the planning cycle.
Existing research lacks actual data support and reference strategies for energy storage decommissioning in the northeast, which is insufficient guidance for the development of new energy storage technologies in the region. To address this gap, this study combines the simulation study of new energy generation stochasticity and volatility, typical scenario clustering method, and energy storage capacity determination with the power generation data of the northeast region, to reduce the impact of volatility, optimize the clustering method, quantify the demand for energy storage, and provide a more reasonable theoretical basis for the future development of energy storage.

2. Energy Storage Demand Study Methodology

Based on the actual conditions in Northeast China, this study uses real-world data on the region’s power generation structure as its foundation. Using a stochastic perturbation method based on probability distributions and the Gaussian Mixture Clustering approach, a joint optimization model for energy storage and conventional thermal power is constructed. The empirical distribution method is applied to systematically analyze the quantitative relationships between storage power, capacity, and confidence levels. The study investigates the uncertainty of net load power, the stochastic nature of renewable energy generation, and the characteristics of its volatility. This enables optimal power allocation for energy storage participation in peak shaving and frequency regulation at the lowest operational cost.

2.1. Stochastic and Volatility Model of New Energy Generation Based on Random Perturbations of Probability Distribution

The uncertainty in power systems with high renewable energy penetration primarily arises from renewable energy sources and the load. When renewable energy is treated as a load, the net load can be obtained by subtracting the output of renewable energy from the actual load. In this way, the uncertainty of power is fully captured in the net load. In this section, a float of ±5% is added to the known total amount of new energy generation, and quantile regression is used to generate a set of net load scenarios to express the uncertainty in the net load.
Quantile regression, proposed by Koenker et al. [29], is a data regression method that differs from linear regression. Compared to linear regression, quantile regression requires fewer sample data and makes more efficient use of the available data, providing a more comprehensive representation of the global characteristics of the response variable. It can provide a detailed description of the uncertainty in renewable energy systems through the conditional distribution of the prediction errors. Therefore, we use the quantile regression method to handle the net load errors generated in the data. For a random variable y , it is assumed that the probability of F y y is τ . y τ represents the quantile of the random variable y , and the relationship is expressed as shown in Equation (1).
y τ = { y   |   F ( y ) τ } ,
assuming that the actual and predicted power samples of the net load of the power system with high penetration of renewable energy are matrix and P n l , r , P n l , f . The following linear fitting relationship exists between the actual and predicted power as in Equation (2).
p n l , i , j , τ r = a τ × p n l , i , j f + b τ ,
Among others, p nl , i , j , τ r is p nl , i , j r , the value of the τ quartiles; p nl , i , j r and p nl , i , j f are the number of P n l , r , the P n l , f elements of the sample matrix, respectively, denoting the day’s first i sampling point of the day j . The actual and predicted power at the moment of a τ and b τ are the parameters of the linear fitting equation on τ parameters of the linear fitting equation of; a τ and b τ can be obtained by minimizing Equation (3).
Q P τ = m i n i = 1 I j = 1 J f τ p nl , i , j r p nl , i , j , τ r ,
of which I and J denote the total number of days in the data and the number of points sampled per day, respectively; f τ · is the test function as shown in Equation (4).
f τ x = τ x , x 0 τ 1 x , x < 0 ,
where the τ takes a value τ 1 , τ 2 , … τ k , for the net load predicted power p nl , i , j f When p nl , i , j , τ 1 r , p nl , i , j , τ 2 r , , p nl , i , j , τ k r , a set of quantile points for the actual net load can be obtained by quantile regression fitting.

2.2. Scenario Set-Based Model for Joint Optimized Operation of New Energy Storage and Conventional Thermal Power Generation

The net load data of the power system are characterized by high dimensionality, multiple scenario sets, and high computational complexity. Common clustering methods face issues such as low clustering accuracy and insufficient robustness when handling the net load data of power systems. The central limit theorem allows the actual grid load profile to be approximated as a normal distribution, while the Gaussian clustering model is analytical and mathematically tractable, accurately portraying the mean and fluctuation ranges of the variables; and probabilistic methods are able to quantify the distribution of uncertain variables in the system, assess the risk, and optimize the standby capacity and energy storage allocation. These properties make them an important tool for dealing with the volatility and stochasticity of renewable energy. It is suitable for solving classification problems in the integration of renewable energy scenarios. Therefore, this paper applies a Gaussian mixture model for scenario clustering analysis and optimizes the combined model of energy storage and conventional thermal power based on the results [30].
In the Gaussian mixture clustering model, it is assumed that the sample data are classified into D classes, and the probability of each sample data can be expressed as a linear superposition of the probability of belonging to the D Gaussian distribution, with the expression as in (5).
g x = s = 1 D ω s g x |   μ s , Σ s ,
where ω s is the first s weight coefficient of the Gaussian distribution component; μ s and Σ s are the mean and covariance of the s-th Gaussian distribution component, respectively; g x |   μ , Σ is the probability density function of the Gaussian distribution with mean μ and covariance of the Gaussian distribution with probability density function Σ of the Gaussian distribution with mean and covariance.
The parameters of the Gaussian mixture model are estimated using the expectation-maximization algorithm, which applies the maximum likelihood estimation method during the training process. When the sample size is large, logarithmic transformation of the data probabilities can be applied to avoid the high precision requirements caused by small probability values. Therefore, the objective function for maximizing the log-likelihood function can be expressed by Equation (6).
m a x log g x = m a x log s = 1 D ω s g x |   μ s , Σ s ,
Based on the above method, combined with the research of P. Pinson [31] and Sen Wang [32], and considering the advantages of Gaussian mixture clustering model over K-means clustering model, the typical scene generation method adopted in this paper, the steps are as follows:
Step 1
A nonparametric probabilistic forecasting model determined by quantile regression and interpolated to obtain the τ i , j |   i = 1 , 2 , , I ;   j = 1 , 2 , , J corresponding to the net load power P n l , r for all historical actuals;
Step 2
Will T I , J = τ i , j |   i = 1 , 2 , , I ;   j = 1 , 2 , , J through the probability distribution function will T I , J obeys the transformation of the uniform distribution of J the dimension of the N J μ , Σ Gaussian distribution, where Σ and μ denote the sample mean vector and the sample covariance matrix;
Step 3
Based on the Gaussian mixture clustering model the I scenes are categorized into D typical scenes, and attain the distribution probability of each typical scene ρ typ . The distribution probability of each typical scene is obtained. The inverse probability function will D . The inverse probability function converts a vector of J vector that obeys a Gaussian distribution into a D vector obeying a uniform distribution. The quantile matrix of the predicted power is known using the nonparametric model p nl , τ r , and then linearly interpolated from the resulting D-quantile vector τ i , 1 , τ i , 2 , , τ i , J T matrix consisting of the D-quantile matrix linearly interpolated to obtain the p nl , τ r typical scenarios corresponding to the predicted power sequence P typ , nl set, as shown in Equations (7) and (8). ρ i = p nl , s , 1 , p nl , s , 2 , , p nl , s , J is the distribution probability of s .
P typ , nl = p nl , 1 , 1 , p nl , 1 , 2 , , p nl , 1 , J p nl , 2 , 1 , p nl , 2 , 2 , , p nl , 2 , J p nl , s , 1 , p nl , s , 2 , , p nl , s , J p nl , D , 1 , p nl , D , 2 , , p nl , D , J ,
ρ typ = ρ 1 , ρ 2 , , ρ s , , ρ D T ,
In constructing the optimal operation model, the power uncertainty is first calculated based on a typical set of net load scenarios. To cope with the regulation capability of system uncertainty, this paper starts from the perspective of system peaking and frequency regulation, based on the time scales of 15 min and 1 min as the power regulation time for peaking and frequency regulation, respectively. In addition, this paper assumes that the new energy storage is maximally utilized, and the load demand is satisfied as much as possible.
The net load power obtained from Equation (7) for each scenario is transformed into two types, respectively: one is the net load with the peak tuning time as the period p nl , s , t The second is the net load with the frequency regulation adjustment time as the period p fr , s , t , w . Based on the above two types of net loads, the power system peak and frequency regulation demand power can be calculated from Equations (9) and (10):
p sr , s , t = p nl , s , t i N G α i , t p N , i G ,
p fr , s , t , w = p ul , s , t , w p nl , s , t ,
of which p sr , s , t and p fr , s , t , w are used for peak and frequency demand power of the power system, respectively; α i , t and p N , i G are the rated power and load factor of the conventional units, respectively; N G is a set of conventional unit numbers; t is the value of each adjustment moment for peak; w is the value of each adjustment moment for frequency regulation.

2.3. Empirical Distribution-Based Modeling of Power, Capacity, and Confidence Relationships for Energy Storage

The operating power of the new energy storage system at the minimum operational cost can be obtained through the joint optimization model in Section 2.2. However, as the model does not impose constraints on the capacity of the new energy storage system, imbalances in its charging and discharging are likely to occur. The capacity determined by this method has significant redundancy, leading to low utilization of the new energy storage system and high investment costs. To address this issue, this paper proposes a relationship model based on empirical distribution of storage power, capacity, and confidence, which indirectly reflects the utilization rate of the new energy storage system by describing the extent of its charging and discharging deviations. Based on this, a power correction model for the new energy storage system has been established, which balances both system operational costs and the construction costs of the new energy storage system. Finally, the power and capacity requirements for new energy storage in power systems with high renewable energy penetration are determined based on the corrected power of the new energy storage system.
The peak demand rating power of the new energy storage can be determined based on the maximum value of the peak power of the new energy storage during the operation of the typical scenario throughout the operation time of the typical scenario; the frequency regulation rated capacity of the new energy storage should be determined based on the maximum value of the cumulative charge and discharge of the new energy storage for frequency regulation during the entire operation period. According to the continuous charging and discharging of the new type of energy storage, a new set of Γ s = M l 1 × L s , l = 1 , 2 , , L s , l = 1, 2, ⋯, Ls, where L s denotes the number of continuous charging and discharging sets, and M l denotes the first l setting of the continuous charging and discharging time of the group [32]. Then, the maximum peak demand power p pr ,   s ,   m a x E of the new energy storage and the maximum peak demand capacity p pr ,   s ,   m a x E of the new energy storage are calculated as:
p pr , s , m a x E = m a x t T p pr , s , t E , β ,
E pr , s , m a x E = max M l Γ s E pr , s , M l E E pr , s , M l E = t M l p pr , s , t E , β Δ t ,
where E pr , s , M l E is the cumulative power of continuous charging and discharging peaking of the new energy storage; Δ t is the duration of each peak cycle.
Similarly, in each frequency regulation reserve power adjustment cycle, the rated power requirement for frequency regulation of the new energy storage system can be determined based on the maximum frequency regulation power during its operation in the typical scenario. The rated capacity adjustment requirement for the new energy storage system should be determined based on the cumulative maximum charging and discharging for frequency regulation throughout its entire operation. The maximum demanded power of the new type of energy storage p fr , s , t , m a x E and the maximum demand capacity for frequency regulation E fr , s , t , m a x E are calculated as Equations (13) and (14):
p fr , s , t , m a x E = m a x w Λ t p st , s , t , w E , β p pr , s , t E , β ,
E fr , s , t , m a x E = m a x N t T s , t E pr , s , t , N t E E fr , s , t , N l E = w N l p st , s , t , w E , β p pr , s , t E , β Δ w ,
where Υ s , t = N l 1 × K s , l = 1 , 2 , , K s is the set of consecutive charging and discharging times of the frequency regulation; K s denotes the number of consecutive charge/discharge sets; N l denotes the first l continuous charging or discharging time set; E fr , s , t , N l E is the cumulative power of continuous charging or discharging of the new energy storage for frequency regulation; and Δ w is the duration of each frequency regulation cycle.
The demanded power and frequency regulated demanded capacity of the new energy storage throughout the typical scenario operating time can be calculated by the Equation (15):
p fr , s , m a x E = m a x t T p fr , s , t , max E E fr , s , m a x E = m a x t T E fr , s , t , max E

3. Results and Analysis

The real system data of the power grid in Northeast China is used as the initial condition for the overall model, detailed historical data is shown in Table 1. The objective is to minimize the total cost of generation, peak shaving, and frequency regulation. Constraints include power balance, unit reserve, cost limitations, and energy storage reserves. Based on the model research in this paper, a quantitative analysis of the energy storage demand for the Northeast China power grid is presented.

3.1. Analysis of the Results of the Stochasticity Model and the High-Following Clustering Model

Based on the projected installed capacity of wind and photovoltaic power in the northeast region by 2025, typical daily generation characteristic curves are constructed, assuming that the generation efficiencies of wind and photovoltaic remain constant. The generation volatility is modeled using a normal distribution, and the stochastic fluctuations of new energy generation and load in each scenario are also assumed to follow a normal distribution. Since stochastic simulations produce a large number of scenarios, each containing data on wind, photovoltaic, load, and net load fluctuations at various time points, calculating the energy storage demand for all generated scenarios individually would result in excessive computational effort and inefficiency.
The Gaussian mixture model assumes that all randomly generated scenarios can be represented as linear combinations of multiple Gaussian distributions. It estimates the parameters of each distribution—including the mean, covariance matrix, and weight coefficients—using the expectation-maximization algorithm. During the clustering process, the Gaussian mixture model groups similar scenarios into the same class based on their distribution characteristics, generating a limited number of representative typical scenarios. Each typical scenario captures the main features of its corresponding class. Additionally, the Gaussian mixture model calculates the probability of occurrence for each typical scenario, providing more accurate and comprehensive foundational data for quantifying energy storage demand. This approach not only reduces computational complexity and improves efficiency but also ensures that the scenarios are both representative and scientifically robust. The clustered typical scenario data serve as inputs for detailed analyses of subsequent energy storage requirements for frequency regulation and load balancing. The effectiveness of the Gaussian mixture clustering is illustrated in Figure 1.
The analysis of the demand capacity for new energy storage requires a large amount of operational data; however, overly complex data would significantly increase computation time. Therefore, this study adopts the method proposed in reference [33] to select typical operating conditions that represent the overall system to a certain extent. Figure 2 shows the 15 min power curves under 10 typical operating conditions, and Figure 3 shows the 1 min power curves under the same conditions. The sum of the probabilities of these 10 typical scenarios is 100%, indicating that these scenarios encompass all possible outcomes for the actual load.
In Figure 2 and Figure 3, the blue solid line represents the actual load, while the dashed line represents the predicted load under 10 typical scenarios. Additionally, the 10 typical scenarios are based on probability distributions, so the upper and lower bounds of the entire curve represent the actual predicted power range. Comparing the variation over 24 h, it can be observed that the load is at its minimum between 0 and 5 h, no greater than 9000 MW. After 5 AM, the load increases steadily, reaching the first peak around 11 to 12 AM at about 15,000 MW, followed by a slight decrease in the next two hours. After 1 PM, the load continues to rise, reaching its maximum value of approximately 15,000 MW between 5 and 8 PM, and fluctuates around this value. After 8 PM, the load continuously decreases, and the cycle repeats at 24 h.
From the above load curve changes, it can be seen that the difference between the peak and trough periods is close to 7000 MW, so it is necessary to appropriately configure the new type of energy storage to cooperate with conventional power generation for peak and frequency regulation.

3.2. Calculation of Energy Storage Power Requirements

The predicted output of conventional units is obtained by subtracting the new energy generation prediction curve from the load prediction curve. The frequency regulation power of energy storage is determined by the difference between the actual output of conventional units and the predicted output in each scenario. The peaking power of energy storage is used to solve large-scale and long-time power imbalance, and the minimum technical output of conventional units is considered to calculate the peaking power of energy storage.
According to the joint optimization model constructed in this paper, 10 typical scenarios were simulated for the optimized model. Figure 4a,b shows the peak shaving and frequency regulation power curves for the 10 typical energy storage scenarios, where positive and negative values represent discharge and charge of new energy storage, respectively.
It is easy to see from Figure 4 that the demand for peak shaving power at a 15 min scale is no greater than 3000 MW, and the demand for frequency regulation power at a 1 min scale is no greater than 2000 MW. Due to the maximum power limit of conventional units, when the renewable energy power is low, the system requires new energy storage to provide higher discharge power to participate in peak shaving. Due to the deep peak cost of conventional units, when the renewable energy power is high, the system requires new energy storage to provide higher charge power to participate in peak shaving. In this way, the participation of new energy storage in peak shaving and frequency regulation can be enhanced, ensuring the stability, economy, and reliability of the power grid system.
In addition, for the energy storage frequency modulation power, its volatility is large, but the fluctuating power is relatively small and is used for smoothing out the power imbalance for short periods of time. For the peaking energy storage power, its power volatility is smoother, but the degree of sustained deviation is large, and it is used to smooth the power imbalance of the system for a long period of time, which is consistent with the results of Wang et al. [34].

3.3. Energy Storage Power, Capacity, and Confidence Analysis

The quantile regression method is applied using historical data from the Northeast China power grid to derive the fitting function. Based on this function and the available data, the growth rate of future peak shaving and frequency regulation demands for the Northeast China power grid is predicted. To comprehensively evaluate economic benefits, this study employs a cumulative probability distribution approach. The power demands of the ten scenarios, along with their probabilities, are ranked and accumulated, followed by quantization through curve fitting. The quantization results for peak energy storage power are illustrated in Figure 5a, while those for frequency modulation energy storage power are shown in Figure 5b. The fitting curves effectively encompass all data points, ensuring the precision and reliability of the quantile regression method.
From the forecast comparison of predicted and actual peak shaving and frequency regulation power data from new energy storage, it can be concluded that the cumulative growth rate of the peak shaving power demand for the northeast grid approaches 1.0 after it reaches 2350 MW. Similarly, the cumulative growth rate of the frequency regulation power demand reaches 1.0 when it reaches 900 MW, and remains nearly constant thereafter. This indicates that the maximum peak shaving power demand for the northeast grid is 2350 MW, while the maximum frequency regulation power demand is 900 MW.
Specifically, frequency modulation energy storage power demand is primarily utilized to address short-term frequency fluctuations caused by the variability of new energy generation and load changes. The frequency modulation energy storage system achieves precise regulation of grid frequency through rapid charge and discharge responses, ensuring the stability and reliability of system operations. Notably, the demand for frequency modulation energy storage constitutes 3.25% of the maximum total social load.
In contrast, peak shaving energy storage power demand is significantly higher than that of frequency modulation energy storage. This type of energy storage is mainly employed to address long-term power imbalances, smoothing the power load curve by shaving peaks and filling valleys. It effectively mitigates the impact of the intermittency and volatility of new energy generation on the grid. By charging during periods of low demand and discharging during peak demand, the peak shaving energy storage system not only enhances the utilization efficiency of power resources but also alleviates the regulation burden on conventional thermal power plants. The peak shaving energy storage power demand amounts to 11.77% of the maximum total social load.
The energy storage power curve under typical operating conditions is used to optimize the relationship model between energy storage power, capacity, and confidence level based on empirical distribution. The demand power and demand capacity for new energy storage are considered for each scenario within the 10 typical scenarios. Assuming that the 10 typical scenarios have the same occurrence probability, the probability of each event occurring on any typical day is equal to the original probability divided by 10. Based on the probability of each scenario, the cumulative probability of the demand power is calculated by summing the scenario probabilities from lowest to highest, obtaining the corresponding values between energy storage power, capacity, and cumulative probability. This cumulative probability represents the confidence level that the energy storage power or capacity can meet the demand for new energy storage.
A polynomial fitting method is then used to fit the data points, specifically the data points consisting of energy storage power or capacity and confidence levels. The fitting results are shown in Figure 6, where Figure 6a,b represent the fitting curves of the relationship between the demand capacity for peak shaving and frequency regulation and the confidence level of meeting the demand.
The capacity demand for frequency modulation energy storage is primarily utilized to address short-term frequency instability caused by fluctuations in new energy generation and load. The relatively small capacity demand reflects the system’s key characteristic of rapid response, making it ideal for high-power density energy storage technologies such as lithium-ion batteries or supercapacitors. This capacity ensures the energy storage system can maintain continuous power output over short durations, effectively mitigating frequency fluctuations and supporting the transient stability of the power grid.
In contrast, the capacity demand for peak shaving energy storage is substantially higher. This capacity is primarily required to resolve long-term power imbalances and balance supply and demand by shaving peaks and filling valleys. Peak shaving energy storage systems store energy during periods of low demand and release it during peak periods, smoothing the power load curve and optimizing grid operational efficiency. The capacity demand for peak shaving energy storage corresponds to a continuous discharge duration of approximately 4.25 h, necessitating energy storage systems with high capacity. This makes them well-suited for long-duration energy storage technologies such as flow batteries or compressed air energy storage systems.
From the fitting curves, it can be seen that as power and capacity increase, the confidence level of meeting the energy storage demand also increases. When the confidence level of meeting the new energy storage demand is higher, the rate of change in storage capacity shows a decreasing trend. This indicates that increasing the power or capacity of new energy storage at a higher confidence level results in a larger deviation from the expected effect, meaning that the power or capacity of new energy storage determined by meeting the demand with 100% confidence is not the optimal value. Therefore, in this study, the demand capacity and demand power for new energy storage are determined based on a 90% confidence level of meeting the demand. Similarly, from Figure 6, it can be observed that at a 90% confidence level, the demand capacity for peak shaving and frequency regulation for new energy storage is 9220.56 MWh and 1867.83 MWh, respectively; the demand power for peak shaving and frequency regulation is 2170 MW and 700 MW, reaching 23.53% and 18.98% of the maximum net load of the day, respectively. This also indicates that when operating at the required power, the peak shaving and frequency regulation durations of the new energy storage should be 4.25 h and 1.24 h.
The significant demand for peak shaving energy storage capacity underscores the critical role of energy storage in ensuring the reliable integration of a high proportion of renewable energy into the power grid.

3.4. Sensitivity and Limitations of Results Analysis

In order to analyze the impact of new energy penetration rate on the system level energy storage participation in peak shifting and frequency regulation capacity demand, set the new energy penetration rate of 40~65%, different new energy penetration rates under the power generation accounted for as shown in Table 2.
As the penetration rate of renewable energy increases, the power and capacity demand for energy storage participating in system peak shaving and frequency regulation are also rising. When the renewable energy penetration rate reaches 65%, the power and capacity demand for peak shaving are 3166 MW and 14,235 MWh, respectively, while the demands for frequency regulation are 1005 MW and 347 MWh.
The relationship between the predicted new energy penetration and frequency modulation capacity and frequency from 2024 to 2030 is shown in Figure 7, As the penetration rate increases from 40% to 65%, the required continuous charge/discharge durations for peak shaving are 4.25, 4.05, 4.15, 3.84, 3.84, and 3.86 h, respectively, whereas for frequency regulation, they are 0.21, 0.24, 0.25, 0.30, 0.28, and 0.35 h. These results indicate that with the increasing penetration of renewable energy, the required duration of energy storage for peak shaving gradually increases, while the duration for frequency regulation shows no significant growth trend.
As with the majority of studies, the design of the current study is subject to limitations. The main sources of limitations are research methodology and data sources. The research results of Wang et al. [32,34] show consistent regularity with the results of this paper. Therefore, the typical classification of real scenarios using Gaussian clustering and probabilistic means in the study can improve the representativeness of the sample data. In addition, the data source of the article is Northeast China, so the model in this paper has lower model accuracy in predicting other regions, but it can be improved by correcting the clustering method.

4. Conclusions

In this study, based on the uncertainty of renewable energy and the randomness of system load, considers two times scales for system peak shaving and frequency regulation. It adopts an accurate method to characterize the system net load uncertainty, supported by historical data from the northeastern regional power grid, to predict the future demand for new energy storage installation capacity based on peak shaving and frequency regulation. The following conclusions can be drawn from the predicted results:
(1)
The future capacity demand for new energy storage participating in peak shaving and frequency regulation in the northeastern region of China is predicted, providing theoretical basis and reference support for the energy storage policy formulation during the “14th Five-Year Plan” and “15th Five-Year Plan” periods in Northeastern China;
(2)
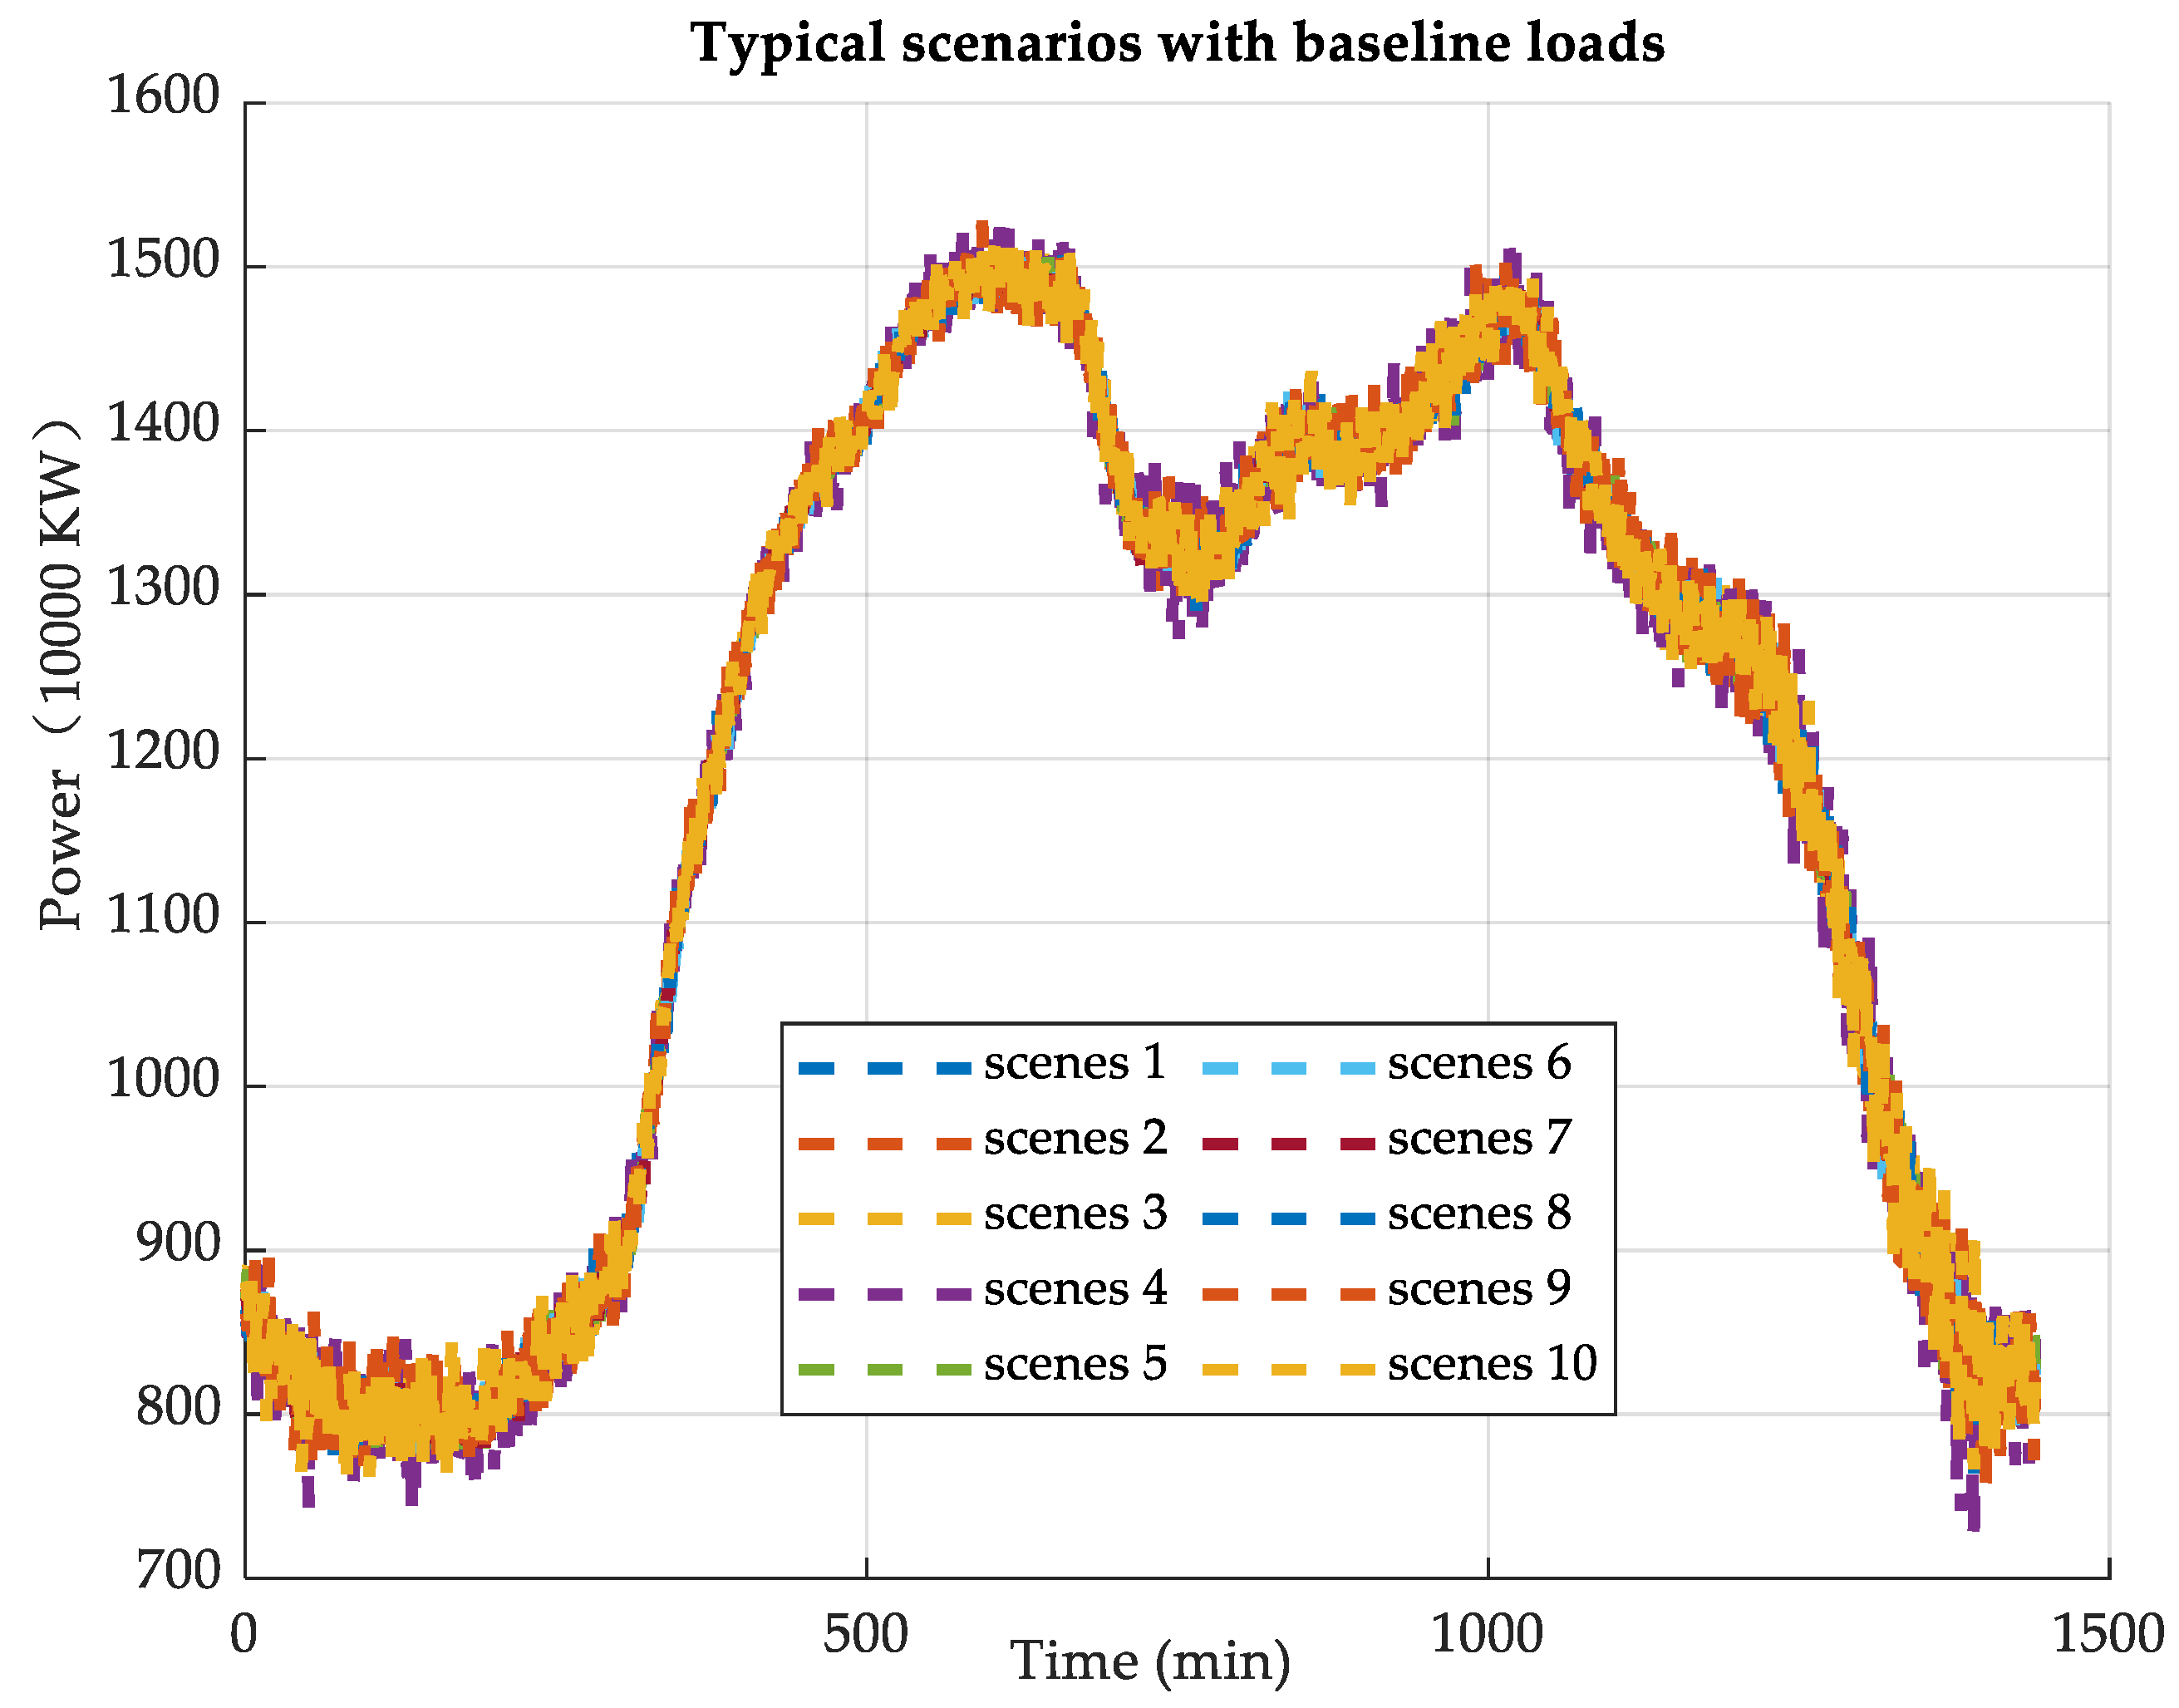
A joint optimization operation model for new energy storage and conventional thermal power, based on the probability distribution of the stochastic disturbance model of renewable energy generation randomness and volatility, divides daily operational scenarios into 10 typical scenarios. It predicts that under these 10 typical scenarios, the demand for peak shaving power at a 15 min scale is no greater than 3000 MW, and the demand for frequency regulation at a 1 min scale is no greater than 2000 MW;
(3)
Based on the empirical distribution of energy storage power, capacity, and confidence level relationship model, combined with the predicted results from 10 typical scenarios, at a 90% confidence level, the demand capacity for peak shaving and frequency regulation for new energy storage is 9220.56 MW h and 1867.83 MW h, respectively; the demand power for peak shaving and frequency regulation is 2170 MW and 700 MW, reaching 23.53% and 18.98% of the maximum net load of the day, respectively. This also indicates that when operating at the required power, the peak shaving and frequency regulation durations of the new energy storage should be 4.25 h and 1.24 h.
(4)
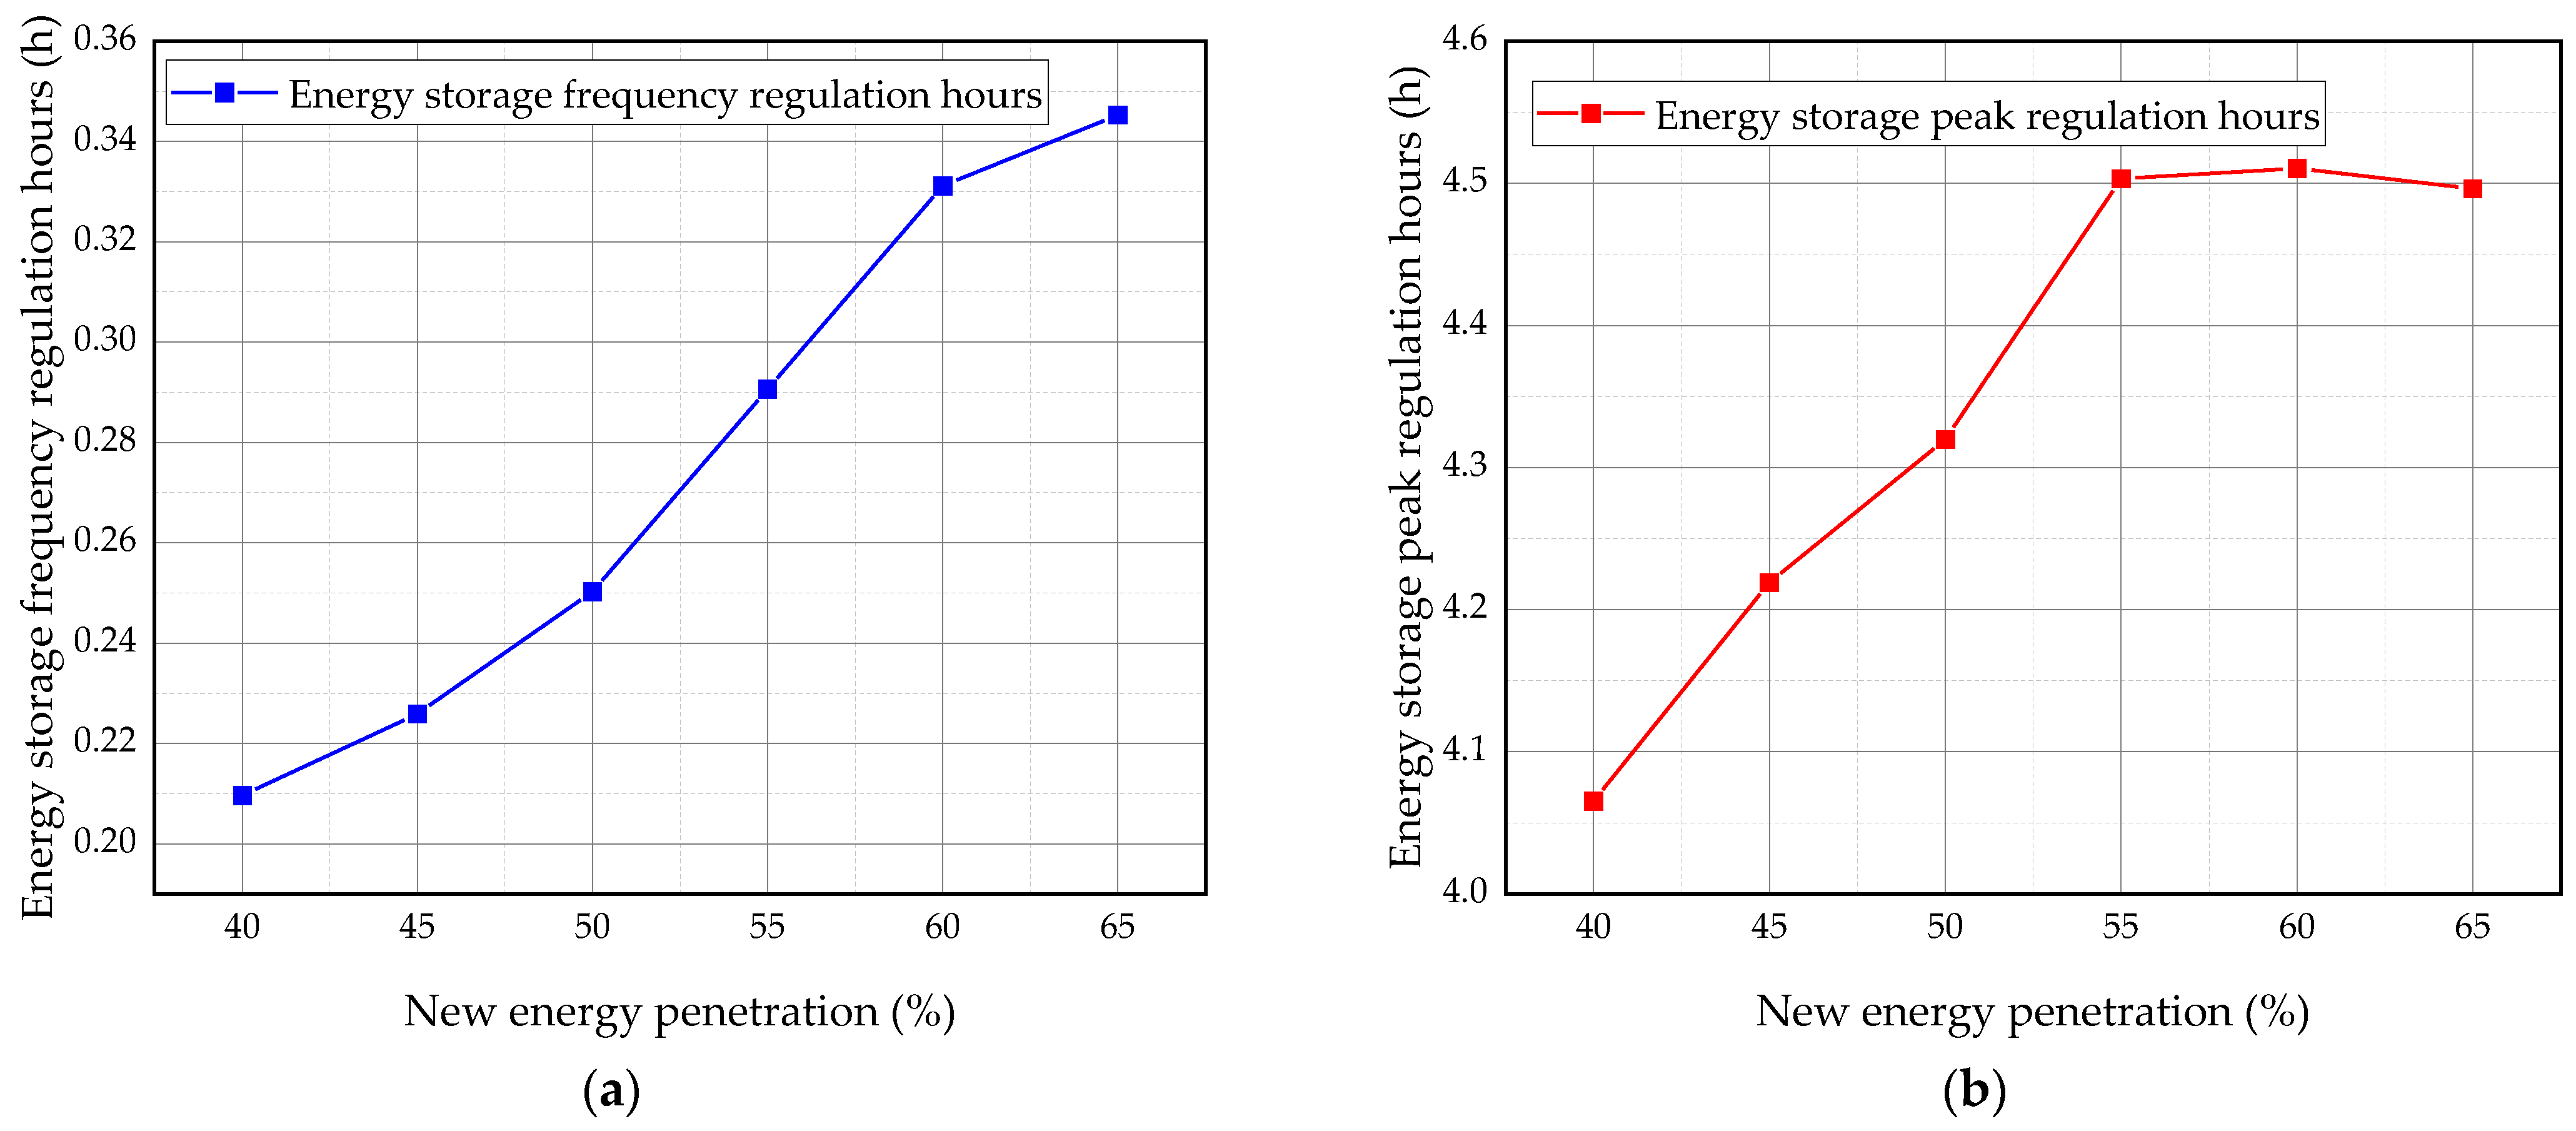
In the case of a new energy penetration rate of a 5% increment per year, the demand for frequency regulation of energy storage systems grows from 126 MW in 2025 to 347 MW in 2030, with an average annual growth rate of nearly 30%. The demand for peaking power increases from 9261 MW in 2025 to 14,235 MW in 2030, with an average annual growth rate of 10%. This indicates that the demand for storage power and capacity for both peaking and frequency regulation will increase significantly in the next five years.

Author Contributions

Conceptualization, Y.Y. and Z.M.; methodology, Z.O.; software, Z.Z.; validation, J.W. and X.X.; formal analysis, X.W.; investigation, Y.S.; resources, D.W.; data curation, D.W.; writing—original draft preparation, Z.Z.; writing—review and editing, Z.M.; supervision, X.X.; project administration, X.W. All authors have read and agreed to the published version of the manuscript.

Funding

This research was funded by the project “Research on Application Scenarios and Development Paths of Grid-Side Energy Storage for New Power Systems in Jilin Province, 2024” (No. SGJLJY00LNJS2400066).

Data Availability Statement

Data available on request due to restrictions privacy. The data presented in this study are available on request from the corresponding author because the modeled data for this study was obtained from the corresponding author, and the raw electrical load data required permission from the first author.

Conflicts of Interest

This study was supported and sponsored by Power Economic Research Institute of Jilin Electric Power Co., Ltd. Deepwater Engineering Research Center, Dalian University of Technology completed the study and informed Power Economic Research Institute of Jilin Electric Power Co., Ltd. of the results, which were published with Power Economic Research Institute of Jilin Electric Power Co., Ltd.'s permission. There are no other conflicts of interest.

References

  1. BP. Energy Institute Statistical Review of World Energy. 2024. Available online: https://assets.kpmg.com/content/dam/kpmg/cn/pdf/zh/2024/08/statistical-review-of-world-energy-2024.pdf (accessed on 30 October 2024).
  2. Zhang, L.; Tang, X.; Wang, Y.; Wang, Y. Selection of New Energy Development Models in Rural Jilin Province under Different Situations. Proc. Bus. Econ. Stud. 2024, 7, 231–237. [Google Scholar] [CrossRef]
  3. Impram, S.; Nese, S.V.; Oral, B. Challenges of renewable energy penetration on power system flexibility: A survey. Energy Strategy Rev. 2020, 31, 100539. [Google Scholar] [CrossRef]
  4. International Energy Agency. Empowering Variable Renewables-Options for Flexible Electricity Systems; OECD Publishing: Paris, France, 2009. Available online: https://iea.blob.core.windows.net/assets/bb6038fa-1aa6-4f47-a926-91af88581284/Empowering_Variable_Renewables.pdf (accessed on 30 October 2024).
  5. Pilpola, S.; Lund, P.D. Analyzing the effects of uncertainties on the modelling of low-carbon energy system pathways. Energy 2020, 201, 117652. [Google Scholar] [CrossRef]
  6. Paltsev, S. Energy scenarios: The value and limits of scenario analysis. Wiley Interdiscip. Rev. Energy Environ. 2017, 6, e242. [Google Scholar] [CrossRef]
  7. Su, H.; Feng, D.; Zhao, Y.; Zhou, Y.; Zhou, Q.; Fang, C.; Rahman, U. Optimization of customer-side battery storage for multiple service provision: Arbitrage, peak shaving, and regulation. IEEE Trans. Ind. Appl. 2022, 58, 2559–2573. [Google Scholar] [CrossRef]
  8. Ralon, P.; Taylor, M.; Ilas, A.; Diaz-Bone, H.; Kairie, K.-P. Electricity Storage and Renewables: Costs and Markets to 2030; International Renewable Energy Agency: Abu Dhabi, United Arab Emirates, 2017; p. 164. [Google Scholar]
  9. Braeuer, F.; Rominger, J.; McKenna, R.; Fichtner, W. Battery storage systems: An economic model-based analysis of parallel revenue streams and general implications for industry. Appl. Energy 2019, 239, 1424–1440. [Google Scholar] [CrossRef]
  10. Alam, M.J.E.; Muttaqi, K.M.; Sutanto, D. A controllable local peak-shaving strategy for effective utilization of PEV battery capacity for distribution network support. IEEE Trans. Ind. Appl. 2017, 51, 2030–2037. [Google Scholar] [CrossRef]
  11. Tian, Y.; Bera, A.; Benidris, M.; Mitra, J. Stacked revenue and technical benefits of a grid-connected energy storage system. IEEE Trans. Ind. Appl. 2018, 54, 3034–3043. [Google Scholar] [CrossRef]
  12. Shi, Y.; Xu, B.; Wang, D.; Zhang, B. Using battery storage for peak shaving and frequency regulation: Joint optimization for superlinear gains. IEEE Trans. Power Syst. 2018, 33, 2882–2894. [Google Scholar] [CrossRef]
  13. Li, J.; Yu, Z.; Mu, G.; Li, B.; Zhou, J.; Yan, G.; Zhu, X.; Li, C. An assessment methodology for the flexibility capacity of new power system based on two-stage robust optimization. Appl. Energy 2024, 376, 124291. [Google Scholar] [CrossRef]
  14. Park, A.; Lappas, P. Evaluating demand charge reduction for commercial-scale solar PV coupled with battery storage. Renew. Energy 2017, 108, 108523–108532. [Google Scholar] [CrossRef]
  15. Fang, G.; Meng, A.; Wang, Q.; Zhou, H.; Tian, L. Analysis of the evolution path of new energy system under polymorphic uncertainty-A case study of China. Energy 2024, 300, 131543. [Google Scholar] [CrossRef]
  16. Zhong, H.; Li, L.; Wang, Q.; Wang, X.; Wang, X. Optimization Dispatch of Distribution Network–Prosumer Group–Prosumer Considering Flexible Reserve Resources of Prosumer. Energies 2024, 17, 5731. [Google Scholar] [CrossRef]
  17. Zhang, J.; Ma, J.; Yang, X.; Wang, J.; Wang, C.; Yu, Y. An Equivalent Model for Frequency Dynamic Analysis of Large Power Grids Based on Regulation Performance Weighting Method. Energies 2024, 17, 5733. [Google Scholar] [CrossRef]
  18. Ghahramani, M.; Nazari-Heris, M.; Zare, K.; Mohammadi-Ivatloo, B. Energy and reserve management of a smart distribution system by incorporating responsive-loads/battery/ wind turbines considering uncertain parameters. Energy 2019, 183, 205–219. [Google Scholar] [CrossRef]
  19. Zakariazadeh, A.; Jadid, S.; Siano, P. Economic-environmental energy and reserve scheduling of smart distribution systems: A multiobjective mathematical programming approach. Energy Convers. Manag. 2014, 78, 151–164. [Google Scholar] [CrossRef]
  20. Kuo, C.C. Generation dispatch under large penetration of wind energy considering emission and economy. Energy Convers. Manag. 2010, 51, 89–97. [Google Scholar] [CrossRef]
  21. Soroudi, A.; Amraee, T. Decision making under uncertainty in energy systems: State of the art. Renew. Sustain. Energy Rev. 2013, 28, 376–384. [Google Scholar] [CrossRef]
  22. Niu, J.; Tian, Z.; Yue, L. Robust optimal design of building cooling sources considering the uncertainty and cross-correlation of demand and source. Appl. Energy 2020, 265, 114793. [Google Scholar] [CrossRef]
  23. Cebulla, F.; Naegler, T.; Pohl, M. Electrical energy storage in highly renewable European energy systems: Capacity requirements, spatial distribution, and storage dispatch. J. Energy Storage 2017, 14, 211–223. [Google Scholar] [CrossRef]
  24. Cebulla, F.; Haas, J.; Eichman, J.; Nowak, W.; Mancarella, P. How much electrical energy storage do we need? A synthesis for the US, Europe, and Germany. J. Clean. Prod. 2018, 181, 449–459. [Google Scholar] [CrossRef]
  25. Solomon, A.A.; Kammen, D.M.; Callaway, D. The role of large-scale energy storage design and dispatch in the power grid: A study of very high grid penetration of variable renewable resources. Appl. Energy 2014, 134, 75–89. [Google Scholar] [CrossRef]
  26. McPherson, M.; Johnson, N.; Strubegger, M. The role of electricity storage and hydrogen technologies in enabling global low-carbon energy transitions. Appl. Energy 2018, 216, 649–661. [Google Scholar] [CrossRef]
  27. Haas, J.; Cebulla, F.; Cao, K.; Nowak, W.; Palma-Behnke, R.; Rahmann, C.; Mancarella, P. Challenges and trends of energy storage expansion planning for flexibility provision in low-carbon power systems—A review. Renew. Sustain. Energy Rev. 2017, 80, 603–619. [Google Scholar] [CrossRef]
  28. Zhang, J.; Wang, C.; Zuo, J.; Gao, C.; Zheng, S.; Cheng, R.; Duan, Y.; Wang, Y. Multi-Stage Rolling Grid Expansion Planning for Distribution Networks Considering Conditional Value at Risk. Energies 2024, 17, 5134. [Google Scholar] [CrossRef]
  29. Roger, K.; Bassett, G. Regression Quantiles. Econometrica 1978, 46, 33–50. [Google Scholar] [CrossRef]
  30. Zhang, J.; Yan, J.; Infield, D.; Liu, Y.; Lien, F.-S. Short-term forecasting and uncertainty analysis of wind turbine power based on long short-term memory network and Gaussian mixture model. Appl. Energy 2019, 241, 229–244. [Google Scholar] [CrossRef]
  31. Pinson, P.; Madsen, H.; Nielsen, H.A.; Papaefthymiou, G.; Klöckl, B. From probabilistic forecasts to statistical scenarios of short-term wind power production. Wind Energy 2009, 12, 51–62. [Google Scholar] [CrossRef]
  32. Wang, S.; Li, F.; Zhang, G.; Yin, C. Analysis of energy storage demand for peak shaving and frequency regulation of power systems with high penetration of renewable energy. Energy 2023, 267, 126586. [Google Scholar] [CrossRef]
  33. Guo, L.; Hou, R.; Liu, Y.; Wang, C.; Lu, H. A novel typical day selection method for the robust planning of stand-alone wind-photovoltaic-diesel-battery microgrid. Appl. Energy 2020, 263, 114606. [Google Scholar] [CrossRef]
  34. Wang, S.; Li, F.; Zhang, G.; Yin, C.; Li, Y. Analysis of system-level energy storage capacity requirements for peak and frequency regulation of new energy high-penetration systems. Electr. Power Autom. Equip./Dianli Zidonghua Shebei 2024, 44. (In Chinese) [Google Scholar] [CrossRef]
Figure 1. Scene clustering based on Gaussian mixture clustering model.
Energies 18 00226 g001
Figure 2. Power curve for 15 min under typical operating conditions.
Energies 18 00226 g002
Figure 3. Power curve for 1 min under typical operating conditions.
Energies 18 00226 g003
Figure 4. Power curve of energy storage under typical operating conditions. (a) Peaking power curve under typical operating conditions. (b) Frequency modulation power curve for typical operating conditions.
Energies 18 00226 g004
Figure 5. The peak shaving and frequency regulation power prediction curve based on quantile regression. (a) Cumulative probability plot of peaking power. (b) Frequency modulation power cumulative probability plot.
Energies 18 00226 g005
Figure 6. Fitted curves for the relationship between power, capacity, and confidence in meeting demand (The dotted line is an auxiliary line to determine the predicted value). (a) Cumulative probability distribution of SOC maxima. (b) Cumulative distribution of SOC maxima.
Energies 18 00226 g006
Figure 7. New energy penetration sensitivity plot. (a) Plot of energy storage frequency regulation hours versus new energy penetration rate. (b) Plot of energy storage peak regulation hours versus new energy penetration rate.
Energies 18 00226 g007
Table 1. Historical installed capacity statistics for Northeast China.
Years201520162017201820192020202120222023
Types
wind power444504.7504.7513.6557.5577.1664.61142.71267.9
photovoltaic7.551.4147.2250.3261.2313.5322.5349.8397.6
conventional utilities379.3384380.7387.3444.5504.4508.5508.5512.5
pumped storage000000140140140
thermal power1603.71610.41640.11703.41643.51659.11603.71599.71613.7
overall load1116.41107.41185.81351.614261486.51545.21589.31699
Table 2. Energy storage demand growth table.
Years202520262027202820292030
New energy penetration40%45%50%55%60%65%
frequency modulation Power (10,000 kW)60.178.884.390.592.7100.5
Peaking power (10,000 kW))227.8235.5244.2256.4287.8316.6
frequency modulation capacity (10,000 kWh)12.617.821.126.330.734.7
Peaking capacity (10,000 kWh)926.1993.61054.91154.61298.11423.5
Disclaimer/Publisher’s Note: The statements, opinions and data contained in all publications are solely those of the individual author(s) and contributor(s) and not of MDPI and/or the editor(s). MDPI and/or the editor(s) disclaim responsibility for any injury to people or property resulting from any ideas, methods, instructions or products referred to in the content.

