Article

A Lifecycle Analysis of a Floating Power Plant Using Biomethane as a Drop-In Fuel for Cold Ironing of Vessels at Anchorage

by
George Mallouppas
1,*,
Angelos Ktoris
1,
Elias Ar. Yfantis
2,
Sotiris Petrakides
3 and
Marios Drousiotis
4
1
Marine and Offshore Science, Technology and Engineering Centre, Cyprus Marine and Maritime Institute, Larnaca 6023, Cyprus
2
Department of Engineering, School of Sciences and Engineering, University of Nicosia, Nicosia 2417, Cyprus
3
InoMob LTD, Paphos 8028, Cyprus
4
Petronav Ship Management Ltd, Limassol 3036, Cyprus
*
Author to whom correspondence should be addressed.
Energies 2025, 18(2), 253; https://doi.org/10.3390/en18020253
Submission received: 12 December 2024 / Revised: 3 January 2025 / Accepted: 4 January 2025 / Published: 8 January 2025
(This article belongs to the Section B: Energy and Environment)

Abstract

:
The purpose of this research article is to perform a greenhouse gas (GHG) impact assessment using a lifecycle analysis of a cold-ironing solution for vessels at anchorage in a retrofitted barge and a marine genset combusting biomethane in dual fuel mode. A lifecycle methodology is developed based on the 4th International Maritime Organization (IMO) GHG study. Eleven impact scenarios are evaluated in terms of CO2 and harmful pollutants (SOx, CO, PM10, PM2.5, NMVOC, and NOx). Vessels operated by Petronav Ship Management Ltd are examined, specifically M/T Alexandria and M/T Astraia. The scenarios reveal CO2 reductions of up to 21% and CO increases of up to 60% due to the combustion of biomethane in dual fuel mode, alongside SOx reductions of up to 20% with increasing biomethane energy substitution. Particulates and NOx decrease due to the utilization of biomethane. This article presents a pragmatic solution for cold ironing for vessels at anchorage with proven lower GHG emissions with the exception of increased CO emissions, therefore the benefits outweigh the drawbacks.

1. Introduction

Decarbonization of the transportation sector (including shipping, aviation, rail, and road) is a complex interdisciplinary problem, and solutions will require collaboration between various stakeholders combined with innovation and regulatory and legislative changes [1]. Transportation accounts for about one-fifth of the global CO2 emissions and ~30% of those in the European Union, while shipping accounts for ~3% of the total greenhouse gas (GHG) emissions [1,2]. Advanced biofuels are a promising solution for the transportation sector (including shipping) due to their high potential to lower CO2 emissions, irrespective of the fact that their share in the total transportation fuel consumption is relatively low [3,4]. They also have the potential to displace substantial amounts of fossil-based fuels due to the large “conceivable” sustainable biomass [5,6].
Potential “low-carbon and zero-carbon fuels” for shipping have different production pathways leading to significant differences in their overall environmental footprint from a lifecycle approach. According to projections included in the 4th IMO GHG Study 2020 [7], ~64% of the total amount of CO2 reduction from shipping in 2050 will be achieved using alternative low- or zero-carbon fuels. Therefore, lifecycle assessments (LCAs) are used for holistic impact assessments and can aid appropriate decision making on advanced biofuels, such as biomethane. Decision making in turn can aid appropriate policy development. The lifecycle of a marine fuel can be divided into two phases: well-to-tank (WtT) and tank-to-wake (TtW) [8]. The WtT (upstream) phase encompasses the upstream fuel production pathway (e.g., feedstock extraction and transport and fuel production and distribution). The TtW (downstream) phase includes fuel combustion emissions for the needs of a vessel.
In LCAs, various activities, processes, and input–output flows are examined to define the system boundaries. As reproduced from Carvalho et al. [8], these encompass:
  • Acquisition and extraction of raw materials;
  • Inputs and outputs in the main process;
  • Transportation and distribution;
  • Production and consumption of energy (fuels, electricity, or heat);
  • Product use and maintenance;
  • Waste disposal;
  • Recycling and recovery of used products.
The purpose of this research article is to assess the envisioned BioCNG-to-CI solution, via an LCA, and the environmental impact of upgraded biogas on its end use. The BioCNG-to-CI solution [9] aims to provide green electrification to ships either at berth or at anchorage. Hence, a floating power plant driven by renewable energy was developed aiming to tackle the principles of circular economy. As part of the project activities, a barge was retrofitted in order to carry a marine engine genset combusting compressed biomethane in dual fuel mode. Transportation of the upgraded biomethane is also achieved via a virtual distribution network, where the engine of a heavy-duty truck has been retrofitted to combust biomethane in dual fuel mode. A virtual distribution network was established due to the currently missing infrastructure in Cyprus to transport compressed methane and the opportunity to cluster individual biogas plants on the island. The genset will provide the electricity needs of a vessel while at anchorage off the Port of Limassol. Thus, the ΒioCNG-to-CI concept will offer a green solution for cold-ironing vessels to be compliant with European directives and international legislation. The ΒioCNG-to-CI concept is presented in Figure 1.
Obaideen et al. [10] analyzed the role of biogas in achieving the Sustainable Development Goals (SDGs), and they determined that it contributes to the achievement of 12 out of 17 SDGs. Namely, the role of biogas increases renewable energy production (SDG 7), reduces climate change impacts (SDG 13), contributes to pollution prevention (SDG 3, SDG 14, and SDG 15), improves agriculture productivity and reduces land use change (SDG 2 and SDG 15), enhances waste management (SDG 11 and SDG 12), creates jobs, improves the economy, and adds value to products (SDG 9 and SDG 8), and aids in treating wastewater (SDG 6). However, the latter is not used as a feedstock in the anaerobic digestion (AD) of pig manure of the BioCNG-to-CI solution. The World Biogas Association [11] highlights that AD can help to solve challenges of nine SDGs: SDG 2 and SDG 15 (by restoring soils via recycling of nutrients, organic matter, and carbon which increases crop yields and substitute firewood with biogas); SDG 3 (by reducing indoor air pollution and treating and recycling wastes); SDG 5 (by reducing household labor in cooking); SDG 6 (by providing decentralized and local treatment of wastes and recycling of biosolids via AD and by reducing carbon loading of wastewater); SDG 7 (by utilizing renewable energy sources for self-generation of electricity and power); SDG 9 (by improving current infrastructures and sustainable industries); SDG 11 (by preventing spread of disease via proper management of waste); SDG 13 (by combating climate change as it improves the availability of renewable energy sources). As such, biomethane, via its upgrading from biogas, can aid in the “circular bioeconomy” which is also in alignment with the SDGs [12]. In addition, circularity is enhanced by a virtual supply chain to valorize waste to produce a renewable source of energy as well as stimulating cooperation between businesses and society [12,13]. This virtuality is also enhanced by a virtual distribution network of biomethane in countries without the necessary infrastructure to distribute natural gas, a solution described in [9]. To achieve circularity and the SDGs it is of utmost importance to examine “regional bioeconomy strategies” which include the engagement of relevant stakeholders and the impact on awareness or acceptability of technology readiness level [14,15].
This research article, via an LCA impact assessment, aims to demonstrate the benefits of the proposed solution in terms of CO2 and other harmful (NOx, SOx, PM10, PM2.5, NMVOC) emission reductions. The assessments are to investigate the environmental impact of biomethane production by upgrading biogas and the virtual distribution network offered by InoMob [16]. The feedstock for biogas production is pig manure from local farms in Cyprus. In total 11 scenarios are examined and compared with a reference scenario, i.e., vessels using their auxiliary engines while at anchorage. In the scenario assessments, two vessels operated by Petronav Ship Management Ltd will be examined, namely M/T Alexandria (IMO number: 9448889) and M/T Astraia (IMO number: 9550589), both oil product tankers.

2. Literature Review

2.1. Biomethane Technology and Transportation (WtT) Compared to Existing LCAs of Biogas-Upgrading Technologies

Mallouppas et al. [6] have performed a SWOT and PESTEL analysis of biogas and biomethane and key barriers to entry with existing alternative fuel competition. The Nordic Roadmap – Future Fuels for Shipping [17] provides a comprehensive review of the open literature published from 2014–2022 and presents key fuels (e.g., hydrogen, ammonia, MDO, HFO, LNG, LBG, biodiesel, biomethanol) with their GHG emissions and lifecycle phases. Biogas production and its upgrading require heat and electricity, with an inherent environmental impact including the potential of methane slipping [18]. Mallouppas et al. [6] mentioned that there are two main conversion routes to produce biomethane by upgrading biogas from biomass feedstocks.
Mallouppas et al. [6] and Sun et al. [19] reviewed the main biogas upgrading processes (i.e., membrane separation, cryogenic separation, pressure swing adsorption, chemical scrubbing, and high-pressure water scrubbing). Note that Florio et al. [20] showed that the membrane upgrading technology, which in turn is the technology also used by InoMob in its upgrading facilities, had a slightly reduced environmental impact than the other upgrading technologies. Ardolino et al. [21] and Suhartini et al. [22] also agreed that the membrane separation technique is particularly effective, with Ardolino et al. [21] specifically highlighting its superior performance over pressure swing adsorption (PSA), which “suffers from high consumption of activated carbon and zeolites”. In addition, the membrane separation technique shows the lowest environmental and health impacts of biogas upgrading, supporting “its potential for scaling up and commercialization” [22].
Almost all biogas-upgrading technologies have methane slip, which increases with an increasing supply of biogas [23]. Methane losses during upgrading reduce efficiency and contribute to greenhouse gas emissions [18]. Also, technologies such as water scrubbing and chemical absorption, which require significant amounts of water and chemicals, negatively impact the environment. The production of waste materials, components, and other equipment at the end of their lifetime such as spent adsorbents, used membranes, and chemical residues, poses disposal challenges. Additionally, emissions of non-methane volatile organic compounds (NMVOCs), CO2, H2S, and other impurities during the upgrading phase impact the air quality and the global warming potential [24]. Moreover, variations in the composition and quality of raw biogas feedstock such as agricultural waste, landfill gas, or wastewater alter the processing efficiency and emissions profiles.
According to Bureau Veritas [25], typical well-to-wheel (WtW) emissions are approximately 200 g CO2,eq/kWh (GWP100). In contrast, e-fuels such as e-methanol, e-methane, and e-ammonia exhibit WtW emissions below 100 g CO2,eq/kWh. Conversely, utilizing conventional and bridging marine fuels, including LNG, LPG, HFO, MGO, and VLSFO, results in WtW emissions exceeding 400 g CO2,eq/kWh (GWP100). Additionally, Zhou et al. [26] noted that biomethane produced from silage maize only achieves a 30% reduction in GHG emissions relative to fossil fuels, primarily due to significant emissions arising from direct and indirect land use changes associated with maize cultivation.
Repele et al. [27] mentioned that the largest impact of biomethane production is due to the use of fossil energy sources. This agrees with Lorenzi et al. [28] and Buivydas et al. [23], who reported that biogas upgrading requires a large amount of electrical energy, which if obtained from non-renewable energy sources will have a high environmental impact. As such they report that if the RES share is high, the environmental impact “tends to decrease rapidly” [28].
Efficient plant operation, which involves maintenance and optimization, along with the integration of renewable energy sources such as solar and wind power and/or carbon capture and storage, can be beneficial for minimizing environmental impacts. Finally, assessing lifecycle greenhouse gas emissions from feedstock collection to biomethane distribution provides a comprehensive view of the technology’s overall environmental footprint. The Cyprus energy mix as of 2021 (71% fossil fuels, 3% oil and oil products, and 26% renewables: wind, solar, and biofuels) and electricity mix (84% oil and petroleum products and 16% renewables) [29] is important information in the LCA study. As such, Buivydas et al. [23] rightfully mention that “the environmental benefits of biomethane production to be investigated depend on the specific circumstances of the production process and the energy systems it displaces”, hence LCAs and conclusions are on a case-by-case basis.
The upgrading pathway followed by InoMob is anaerobic digestion. Note that the feedstock used to produce biogas is pig manure with a high concentration of contaminants (namely hydrogen sulfide, H2S). Hence upgrading biogas to biomethane is required for the removal of the contaminants (i.e., H2S [30]), water vapor, and CO2 to reach the desired specifications [28] and to comply with the EU biomethane quality standard EN 16723:2 [31].
As already mentioned in Section 1, Cyprus does not have a natural gas network, hence the distribution of compressed biomethane via a virtual distribution network is an integral part of the BioCNG-to-CI solution. Note that compression of biomethane for storage and transportation is used during the upgrading process (refer to Figure 2).

2.2. Cold Ironing and Utilization of Biomethane as a Pragmatic Solution (PtW)

Vessels while at berth or at anchorage typically use their auxiliary engines to generate electricity needed for communications, lighting, ventilation, and other onboard equipment [32]. As such the use of auxiliary engines at port “augments” GHG emissions [32]. Cold ironing (CI) or shore-side electricity (SSE) must be provided by European ports to calling ships by 2025 through Directive 2014/94/EU [33]. CI is essential in reducing port emissions, as it allows ships at berth or anchorage areas to draw electricity from the shore, eliminating the need to operate their auxiliary engines. Winkel et al. [32] highlight the benefits of CI from economic and environmental perspectives in Europe. Electrification will be provided to cruise/passenger and container ships with the potential, yet to be decided, to be extended to all vessels. CI will significantly reduce the emissions (CO2 and other pollutants, such NOx and SOx) produced by the auxiliary engines of the vessels to meet the energy needs of passengers and crew during berthing [33,34]. This reduction will improve air quality in both Limassol and Larnaca since both ports are located near the core of the cities. Adding to this, it is beneficial for Cyprus, which suffers from high energy costs due to imported fossil fuel reliance. Note that CMMI’s analysis of the data provided by the Cyprus Port Authority indicated that the peak for power demand can reach up to 40 MW at any point of the year in the scenario that only cruise/passenger and container ships will be included in the “Fit for 55” package [35].
Stolz et al. [34] indicated that the annual emissions of 3M tonnes of CO2 could be avoided if auxiliary power demand at berth is provided by national grids. In addition, they estimate an additional 2M tonnes of CO2 could be avoided by carbon-neutral electricity. Thus, shipping emissions would reduce by 2.2% and 3.7%, respectively [34]. In the same study, the auxiliary energy required for Cyprus is estimated to be 19 GWh, which corresponds to a 0.38% share of CI energy demand (i.e., if auxiliary power production is totally replaced by shore-side electricity) [34]. For Cyprus, the power demand per vessel category and its translation to CI are tabulated in Table 1.
Most studies about CI assess the societal benefits by monetizing the health impact and the payback period on port investments by considering different penetration rates in vessel use [36,37,38,39]. Although the environmental effects of CI are highly dependent on the regional features of the electricity grid that will be connected to the vessels, these prove to be mostly positive when the external costs are evaluated from the onshore standpoint [32,38,39]. In contrast, the results indicated that investment in CI does not lead to health benefits if the electricity grid is predominantly supplied by burning oil, in such a way that the CI provision is even, a less suitable alternative than burning fuel in ship auxiliary engines [32]. Yfantis et al. [35], after analyzing the Cypriot case, illustrate the need for producing green energy from renewable sources if CI facilities are to be provided by Cypriot ports considering the current electricity production blend of the island.
A thorough review of the dual fuel injection strategies has been presented by Mallouppas et al. [30]. The marine genset exploited by Mallouppas et al. [30], and also used in this research study, is a Cummins NT-855-G GenSet engine which was retrofitted with a dual fuel injection (fumigation type) system. The relevant genset retrofits and measurement campaigns are described by Mallouppas et al. [30]. The genset is integrated on a barge for CI provisions on M/T Alexandria and/or M/T Astraia while at anchorage. High methane slipping was observed in the emissions measurements, especially at low loads (see Mallouppas et al. [30] and Mallouppas and Pieri [40]). Different percentages of MDO and biomethane were examined at various loads. Overall SO2 pollutants were observed when increasing the biomethane content (which included H2S; see also Mallouppas et al. [30] and Mallouppas and Pieri [40]). An active carbon filter was introduced in the upgrading to facilitate higher H2S removal rates. Adding to this, MDO has a very low sulfur content. The impact of dual fuel combustion of other pollutants such as NOx, CO and UHC is reported by Mallouppas et al. [30] and Mallouppas and Pieri [40] for engine loads and biomethane energy substitution.
Consequently, this article examines the impact of LCAs for upgrading and transporting upgraded biomethane to M/T Alexandria and M/T Astraia (the two examined vessels) while at anchorage at the Port of Limassol, taking into account various biomethane energy substitution scenarios.

3. Methodology

The International Organization for Standardization (ISO) provides standards for LCA in [41]. These standards describe the four main phases of an LCA: (1) goal and scope definition, (2) inventory analysis, (3) impact assessment, and (4) interpretation.

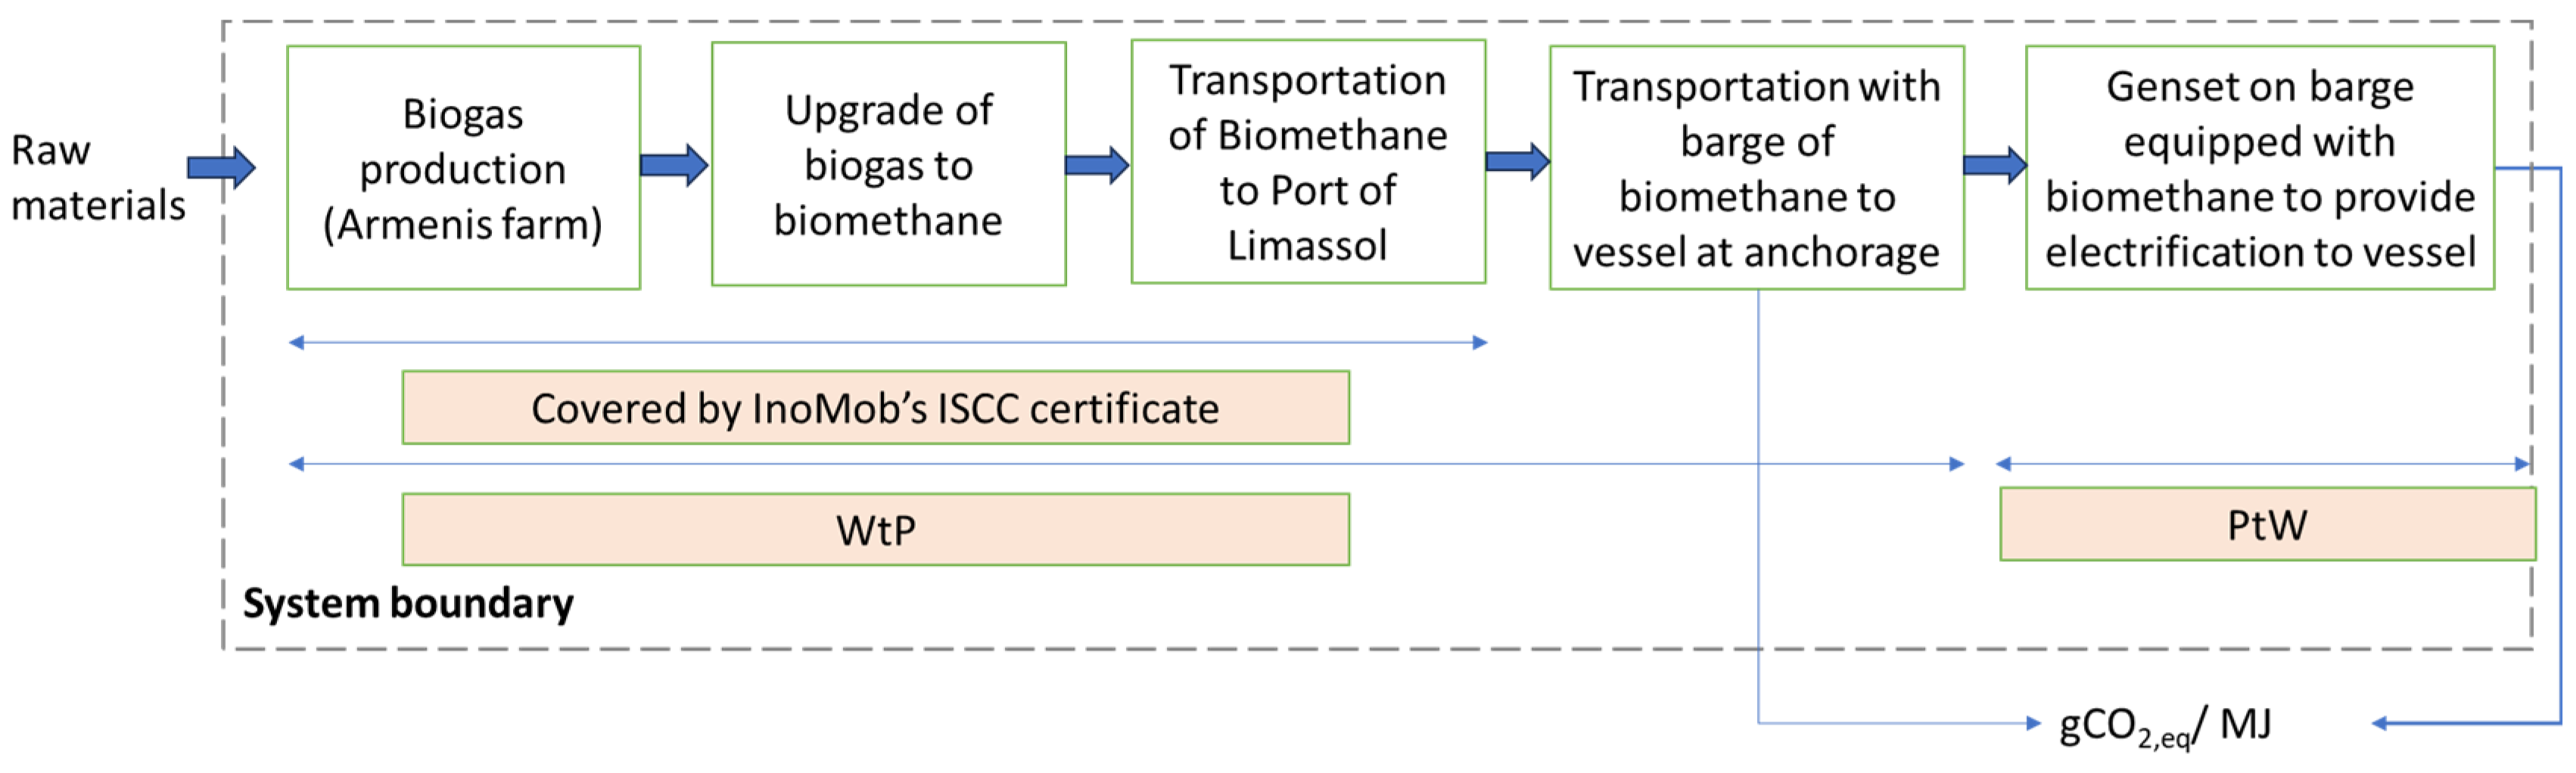
3.1. Scope and Goal Definition of the Current Study

When defining the scope, it is also necessary to define the “functional unit”, which is the metric by which impacts for the LCA are calculated. Functional units can be based on different features of the product such as performance, technical quality, costs, etc. For fuels, a unit of 1 L of fuel or 1 MJ of delivered energy are examples of typical functional units [8]. The functional unit of this study is energy in MJ of transported biomethane (one USRU unit transports 5390 Nm3 biomethane equivalent to ~194,040 MJ). Figure 3 presents the system boundaries, which describe the upstream and downstream activities for the study [8].
The average electrical capacity of both vessels, M/T Alexandria and M/T Astraia, at anchorage is assumed to be 80 kW and 90 kW, respectively. For this report, various scenarios will be assessed to determine the impact of the BioCNG-to-CI solution (the solutions assess the gCO2/MJ and other harmful emissions emitted in 24 h). These scenarios are presented in Table 2.

3.2. Inventory Analysis

3.2.1. WtT Calculations and the International Sustainability & Carbon Certification (ISCC)

The calculation formula to determine the overall GHGs on a well-to-tank (WtT) basis follows the International Sustainability & Carbon Certification [42] and Table 3 explains each term of the equation:
E = n S n e c n , n + e t d , f e e d s t o c k , n + e l , n e s c a , n + e p + e t d , p r o d u c t + e u e c c s e c c r ,
The actual value of etd,product calculation is shown in Table 4 for a delivery radius of 60 km as illustrated in the respective map. Note that InoMob has obtained an ISCC [44,45] for its biomethane-upgrading facilities with reported CO2 emissions of 0.0 gCO2,eq/MJ for a 60 km delivery radius as discussed in Table 4. It is important to mention that for a radius greater than 85 km, which includes all main ports in Cyprus, the CO2 emitted during transportation is positive (0.004 gCO2,eq/MJ). Investigation of larger distances (in terms of radius) is not applicable to the Cypriot case. Accreditation was performed by RINA Services [16].

3.2.2. Emission Factors Used in This Study

The relevant emission factors were obtained from the 4th IMO GHG study report [7] and are reiterated in Table 5 for completeness. Note an active carbon filter has now been integrated into the upgrading unit developed by InoMob. This filter absorbs H2S at higher percentages, leading to an improved biomethane purity (compliant with the EU biomethane protocol EN-16723-2/2017). Therefore, emissions of SOx are assumed to be the same as the ones suggested by the IMO for LNG.
Energy-based emission factors, Efe, are linked with fuel-based emission factors, EFf, as follows [7]:
E F f = E F e s f c b a s e
For the genset operating in dual fuel mode, the specific fuel consumption (sfcbase) can be extrapolated from Figure 4.
The estimated sfcbase at 80 kW and 90 kW are presented in Table 6. These values are used to estimate the emission factors of SOx, CO, PM10, PM2.5, NMVOC, and NOx.
Note that, for the WtP, only emission factors during the transportation of biomethane are taken into account. Other emissions during biogas upgrading are assumed negligible (the upgraded biomethane is compliant with the EU biomethane protocol EN-16723-2/2017). For the genset utilizing biomethane, the emission factors of SOx, CO, PM2.5, PM10, NMVOC, and NOx of liquefied natural gas (LNG) and marine diesel oil (MDO) are used as follows:
E m i s s i o n i = m ˙ M D O     E F e m i s s i o n , i , M D O + m ˙ B i o C H 4     E F e m i s s i o n , i , L N G
where i is SOx, CO, PM10, PM2.5, NMVOC, or NOx. Since biomethane has a zero-carbon footprint, the emissions for CO2 are:
E m i s s i o n C O 2 = m ˙ M D O     E F C O 2 , f , M D O ,

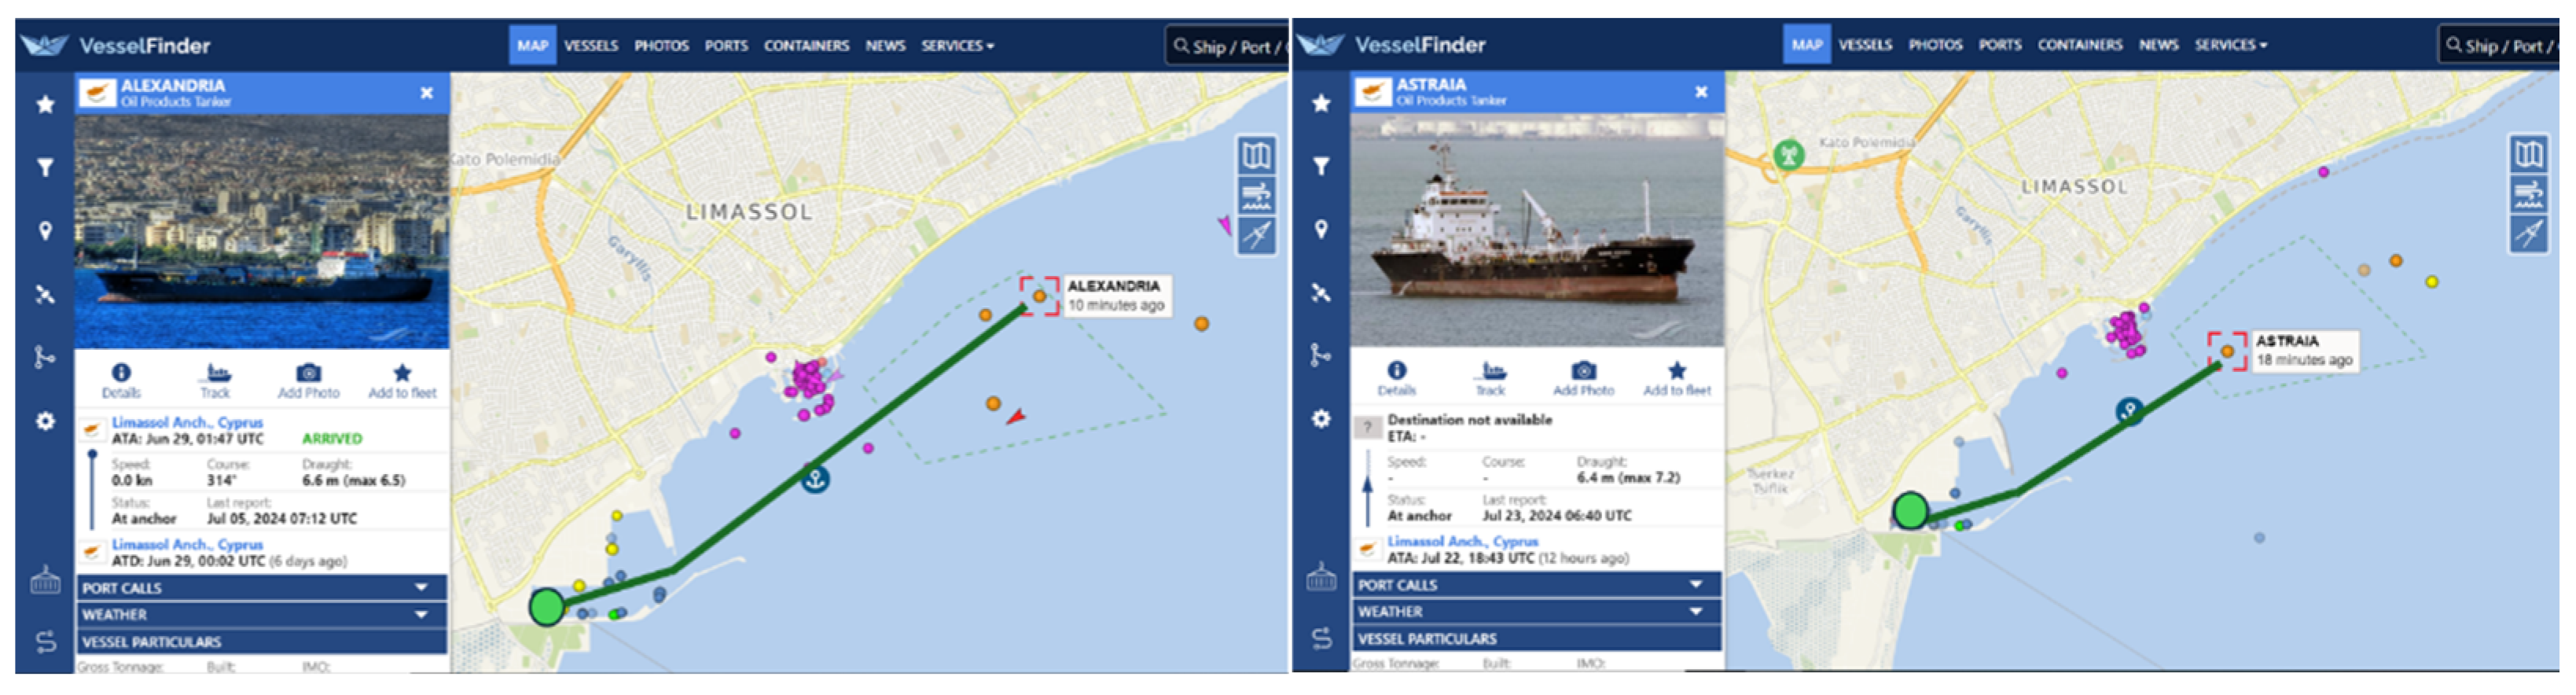
3.2.3. Althaia Barge Propulsion Engines to Transport the Genset to M/T Alexandria and M/T Astraia While at Anchorage

Table 7 provides the barge’s characteristics. The barge is equipped with two 4-stroke turbocharged diesel engines, each with a maximum continuous rating (MCR) of 260 hp (191.23 kW).
As per the 4th IMO GHG study report [7], the total propulsive power of the engines, PME, is estimated as:
P M E = δ w P M E , r e f D i D r e f m S i S r e f n η w η f ,
where δw is the speed correction factor which depends on ship type, where:
δ w = 0.70   f o r   P a s s e n g e r   s h i p s 0.75   f o r   c o n t a i n e r s 1.0   f o r   a l l   o t h e r   s h i p s ,
PME,ref is the total installed power for propulsion, Dref is the reference draught (0.95 m), Di is the instantaneous draught of a vessel (assumed to be 0.9 m after some time in operation, as the vessel’s displacement decreases due to bunkers and biomethane reductions), Sref is the vessel service/reference speed in knots (assumed 6 knots), Si is the instantaneous vessel speed in knots (assumed 5 knots). m = 0.66 and n = 3.0.
ηw is a weather correction factor and is assumed in this study as a calm sea state (i.e., ηw = 0.95). ηf is a fouling correction factor. At the moment, there is no fouling development on the barge (i.e., ηf = 1.0).
Following the 4th IMO GHG study report [7], the fuel consumption of the main engines, FCME, is estimated as:
F C M E = P M E     s f c     Δ t ,
Δt is the time needed to complete the journey as shown in Figure 5 (return trip of Althaia of total distance 10 km). sfc is the specific fuel consumption of the engines and estimated as per Jalkanen et al. [46]:
s f c = s f c b a s e 0.455 E L 2 0.710 E L + 1.280 ,
Note that sfcbase depends on fuel type and built year. EL is the engine load:
E L = m i n P M E P M E , r e f , 85.0 % ,
Minimum is 85% as per Jalkanen et al. [46]. sfcbase is determined from Table 8. For the main propulsion engines of the Althaia barge, an sfcbase = 190 g/kWh is assumed (MDO fuel is used).
Note that the engines as part of the BioCNG-to-CI [9] activities have been refurbished, however, we anticipate a significant derating with said sfc. The fuel consumption is multiplied by the emission factor reported in the 4th IMO GHG study report [7], p. 74, which is 3.206 gCO2/g fuel (emission factor of MDO).
During the transit of the barge, the auxiliary engines of the vessels are in operation. The fuel consumption during anchorage, FCAE, is estimated as:
F C A E = P A E     s f c b a s e     Δ t ,
sfcbase is also assumed to be 190 g/kWh for both vessels. Δt also includes the refueling time of the barge (MDO and biomethane), assumed to be 30 min, and the time required to connect the barge with the vessel, assumed to be 30 min.

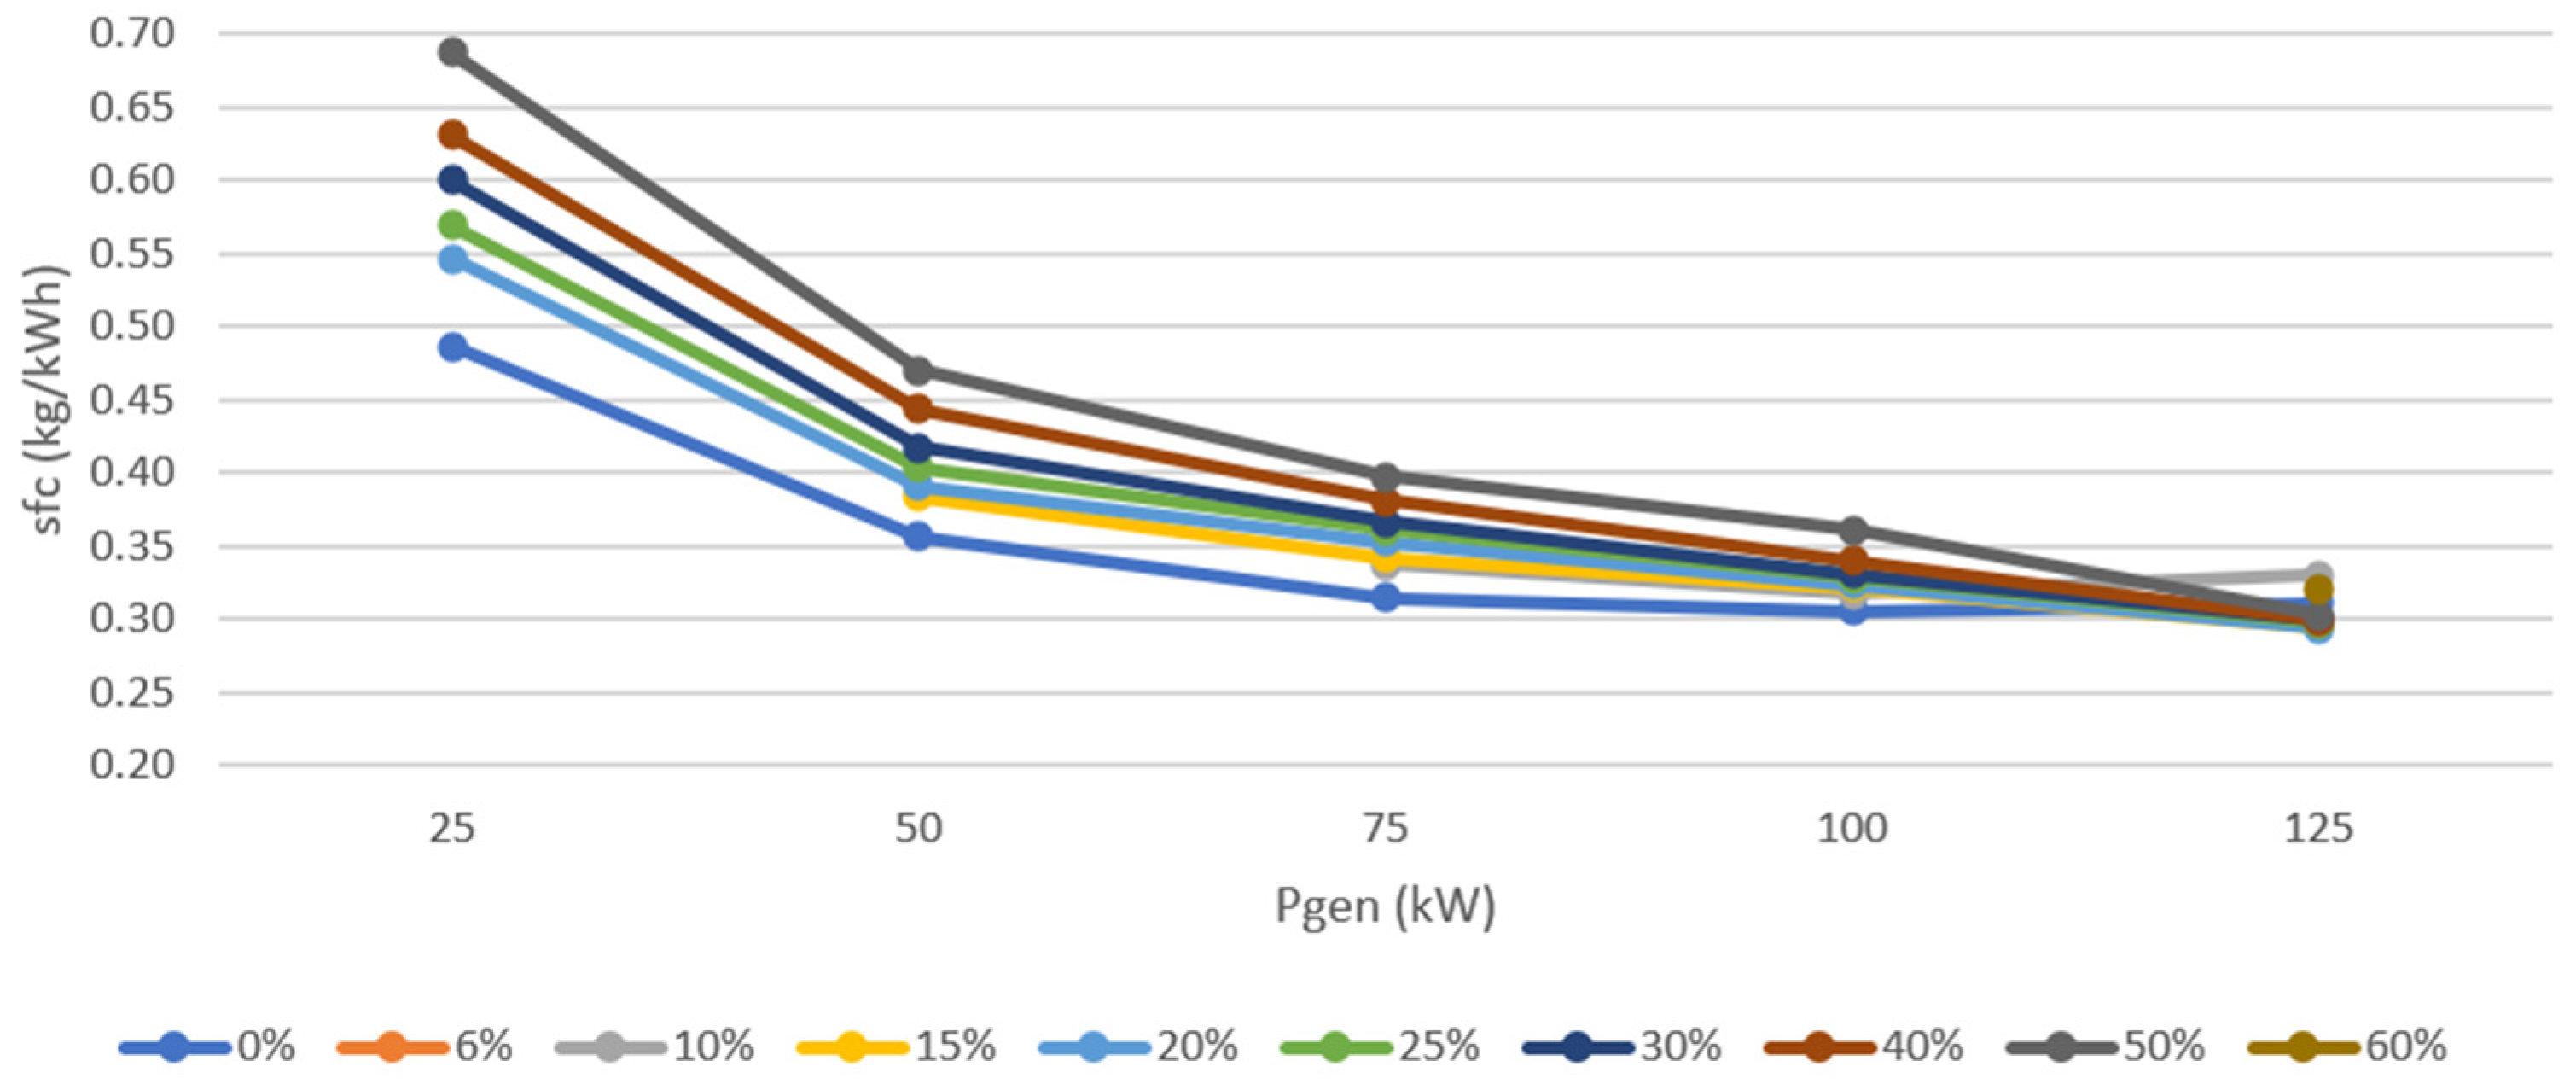
3.2.4. Marine Genset Installed on Barge

In the scope of BioCNG-to-CI, the deliverable by Mallouppas and Pieri [40], and BioCH4-to-Market, the respective deliverable by Mallouppas et al. [30], the diesel and biomethane fuel consumption rates of the generator have been measured. Table 9 presents the measured diesel and biomethane fuel consumption with 75 kW and 100 kW generator loads and biomethane energy substitution. Flow rates are linearly interpolated at 80 kW and 90 kW for the estimated vessels’ needs at anchorage.
The emission factor of biomethane is zero, and the corresponding emission factor of MDO is 3.206 gCO2/g fuel as presented in Table 5. Methane slipping at different powers in different engine load conditions and with biomethane energy substitution is presented in Figure 6. Methane slipping occurs due to the type of injection (fumigated at the intake air manifold).
Note that, during provision of electricity to each examined vessel, the main propulsion engines are switched off and only the dual fuel genset is active to provide each examined vessel with its auxiliary needs. The fuel consumption of the genset is calculated as follows:
F C g e n s e t = F C ˙ g e n s e t     Δ t ,
where  F C ˙ g e n s e t  is the diesel fuel flow rate as reported in the experiments (see Table 9) and Δt is the time the barge provides electricity to the examined vessel. Δt is determined by the amount of biomethane stored onboard Althaia and the biomethane fuel consumption rate provided in Table 9. Note that the barge is anticipated to provide electricity to M/T Alexandria or M/T Astraia for 5 days. Onboard the barge, it is planned to have up to 1434 kg of compressed biomethane (i.e., equivalent to 2000 Nm3).

4. Results and Discussion

Due to assumed biomethane onboard storage (2000 Nm3) and the location of both vessels at anchorage (just outside the Port of Limassol), in scenarios 1–3, the number of return trips of the barge for a total anchorage time of 5 days is one. Note this is irrespective of the vessel since fuel consumptions at 80 kW and 90 kW (the power needs of M/T Alexandria and M/T Astraia, respectively) are similar. With increasing biomethane energy substitution (70% and above) the number of return trips within 5 days is two. Note that biomethane storage on the barge should allow up to 80% substitution with only one refueling.

4.1. Impact Assessment and Interpretation of Scenarios on Biomethane Supplementation on M/T Alexandria

Figure 7 depicts the percentage difference of the calculated emissions (in comparison to the reference scenario) for all examined scenarios for M/T Alexandria. CO2 emissions can be reduced by up to 15% depending on the operating profile of the barge and the anchorage location of the vessel (scenario 11). Note that scenario 11 is a very small distance to the Port of Limassol, indicating that the emissions can be further reduced if vessels are provided with cold ironing while at berth. However, the operational profile of the vessels dictates that cold ironing must be provided while at anchorage as depicted in Figure 5. All harmful emissions are reduced for all examined scenarios apart from CO where the reference case has the least emissions. This is due to the use of biomethane on the genset, which increases with biomethane substitution. Note that the observed trends regarding CO and NOx are in agreement with the measurements reported in Mallouppas et al. [30], Mallouppas and Pieri [40], Papagiannakis [50], Misra et al. [51], p. 332, and Bougessa et al. [52] (up to scenario 6 where different biomethane replacement quantities are examined). In other words, CO emissions increase with increasing biomethane substitution, whilst NOx emissions decrease. As also reported by Papagiannakis [50], CO emissions increase and NOx decrease with increasing biomethane substitution due to the lower in-cylinder temperatures. Injecting biomethane causes local cooling during compression and combustion. Lower in-cylinder temperatures do not allow for CO to fully oxidize to CO2, and NOx emissions are a strong function of temperature (extended Zeldovich reaction mechanism) [53]. This is also observed in the open literature, see Papagiannakis et al. [54], Misra et al. [51], p. 332, Bougessa et al. [52], Di Iorio et al. [55,56], Mustafi et al. [57], and Lounici et al. [58].

4.2. Impact Assessment and Interpretation of Scenarios on Biomethane Supplementation on M/T Astraia

Figure 8 depicts the percentage difference of the calculated emissions (in comparison to the reference scenario) for all examined scenarios for M/T Astraia. CO2 emissions can be reduced by up to 21.69% depending on the operating profile of the barge and the anchorage location of the vessel (scenario 11). Similarly, with M/T Alexandria, all harmful emissions are reduced for all examined scenarios apart from CO where the reference case has the least emissions.

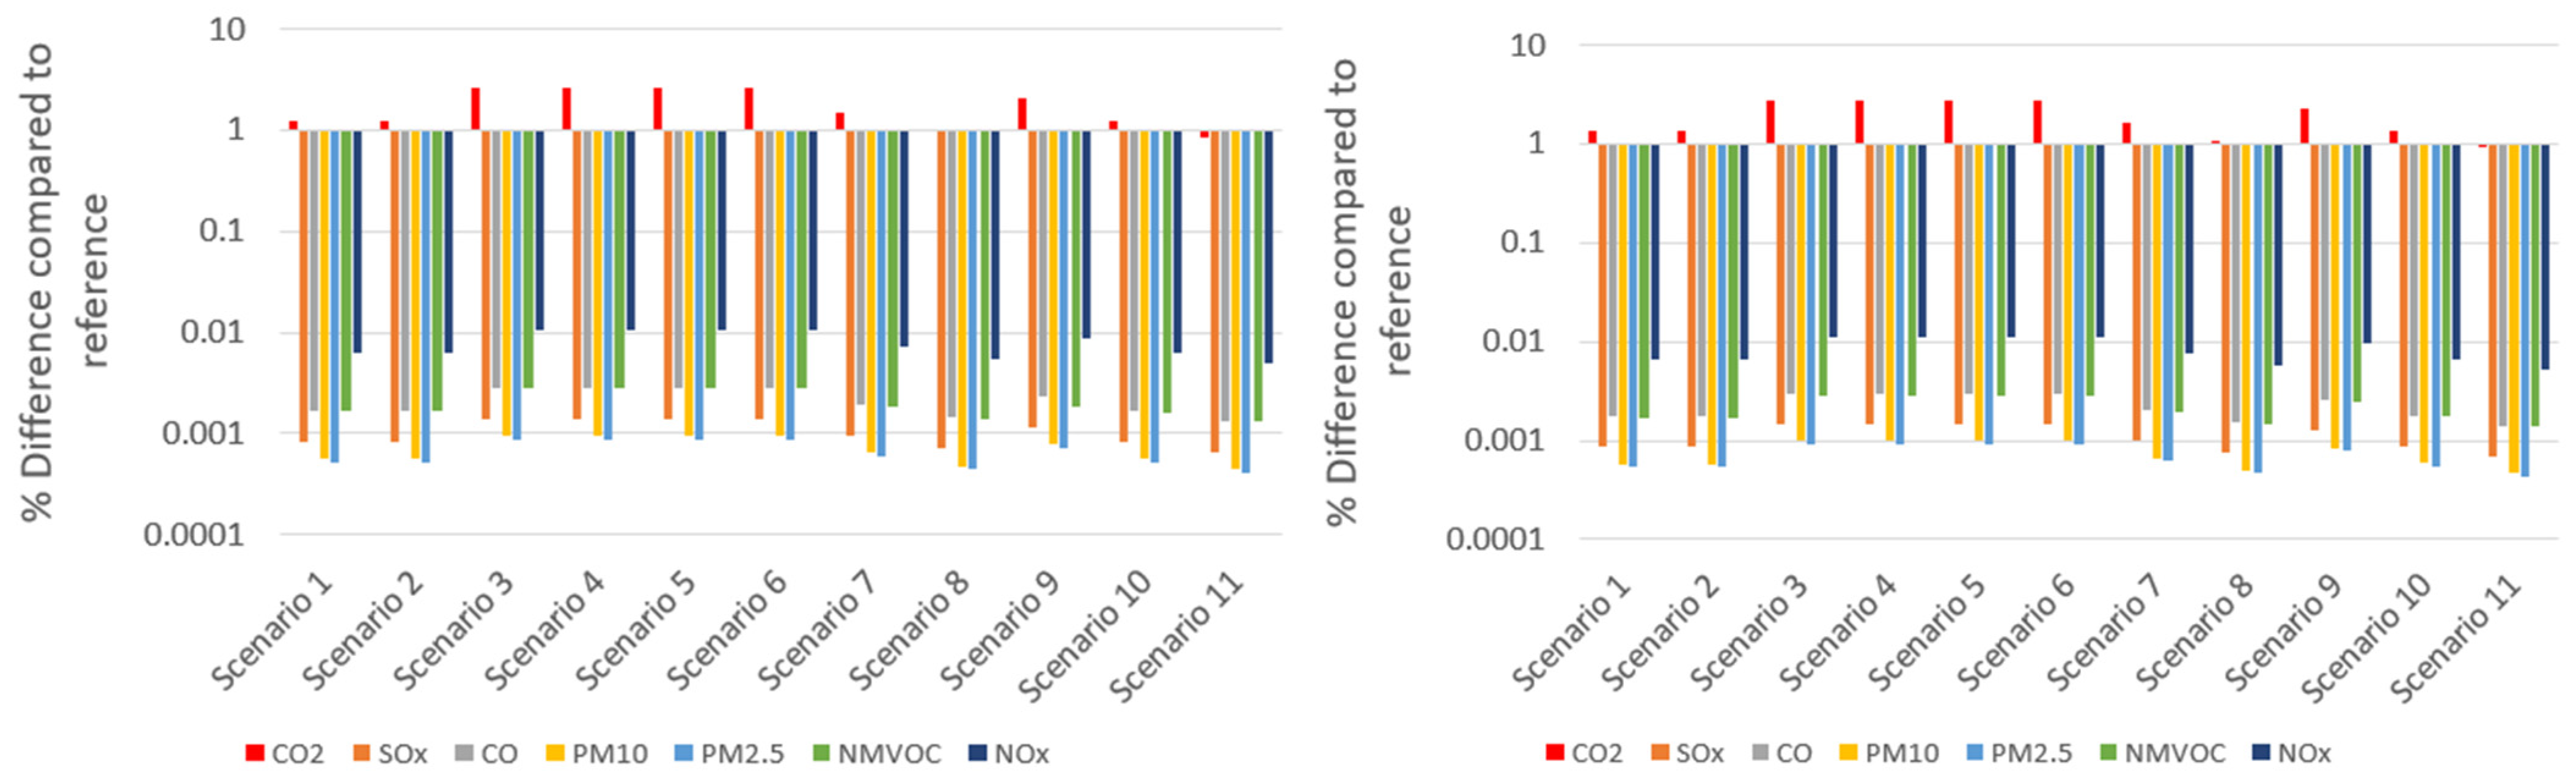
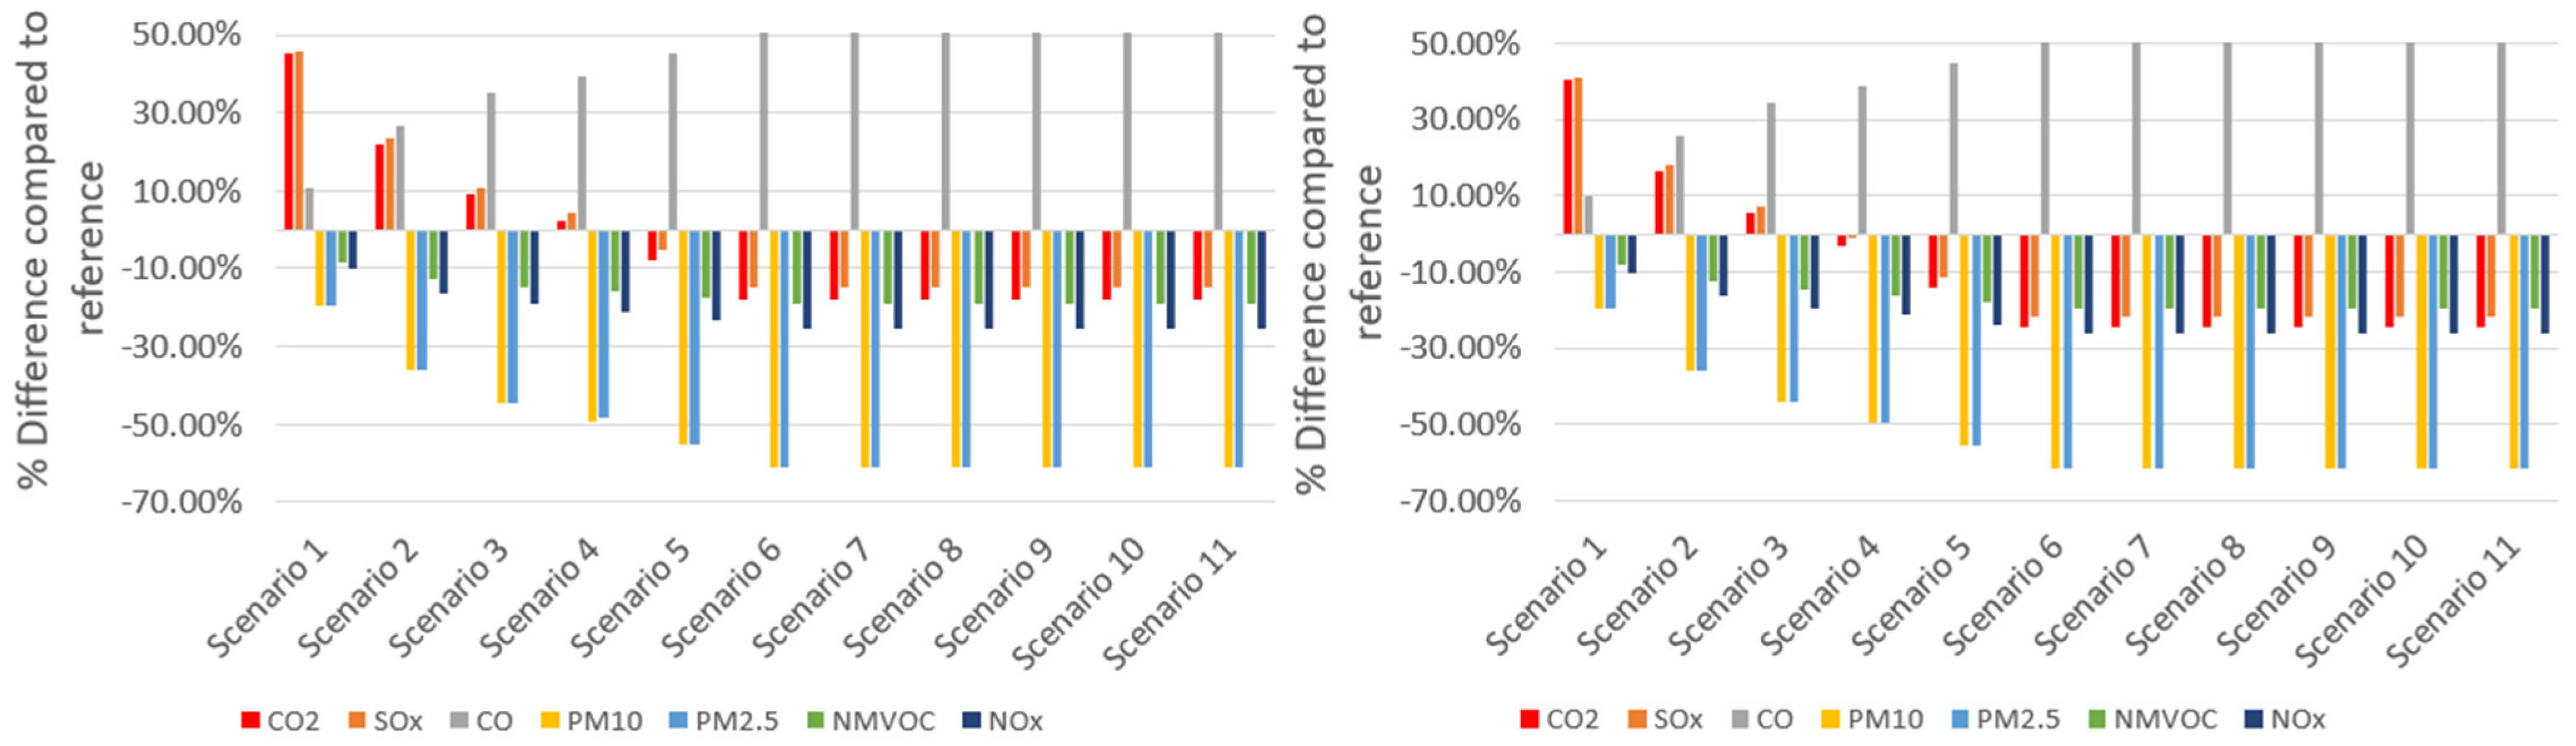
4.3. WtP Impact Assessment and Interpretation of Scenarios for Both Vessels

On a WtP basis (see Figure 9) the impacts on emissions for both vessels are almost identical. The minor differences are due to the different power that the vessels need while at anchorage and when the vessels are waiting for the barge to provide electricity.

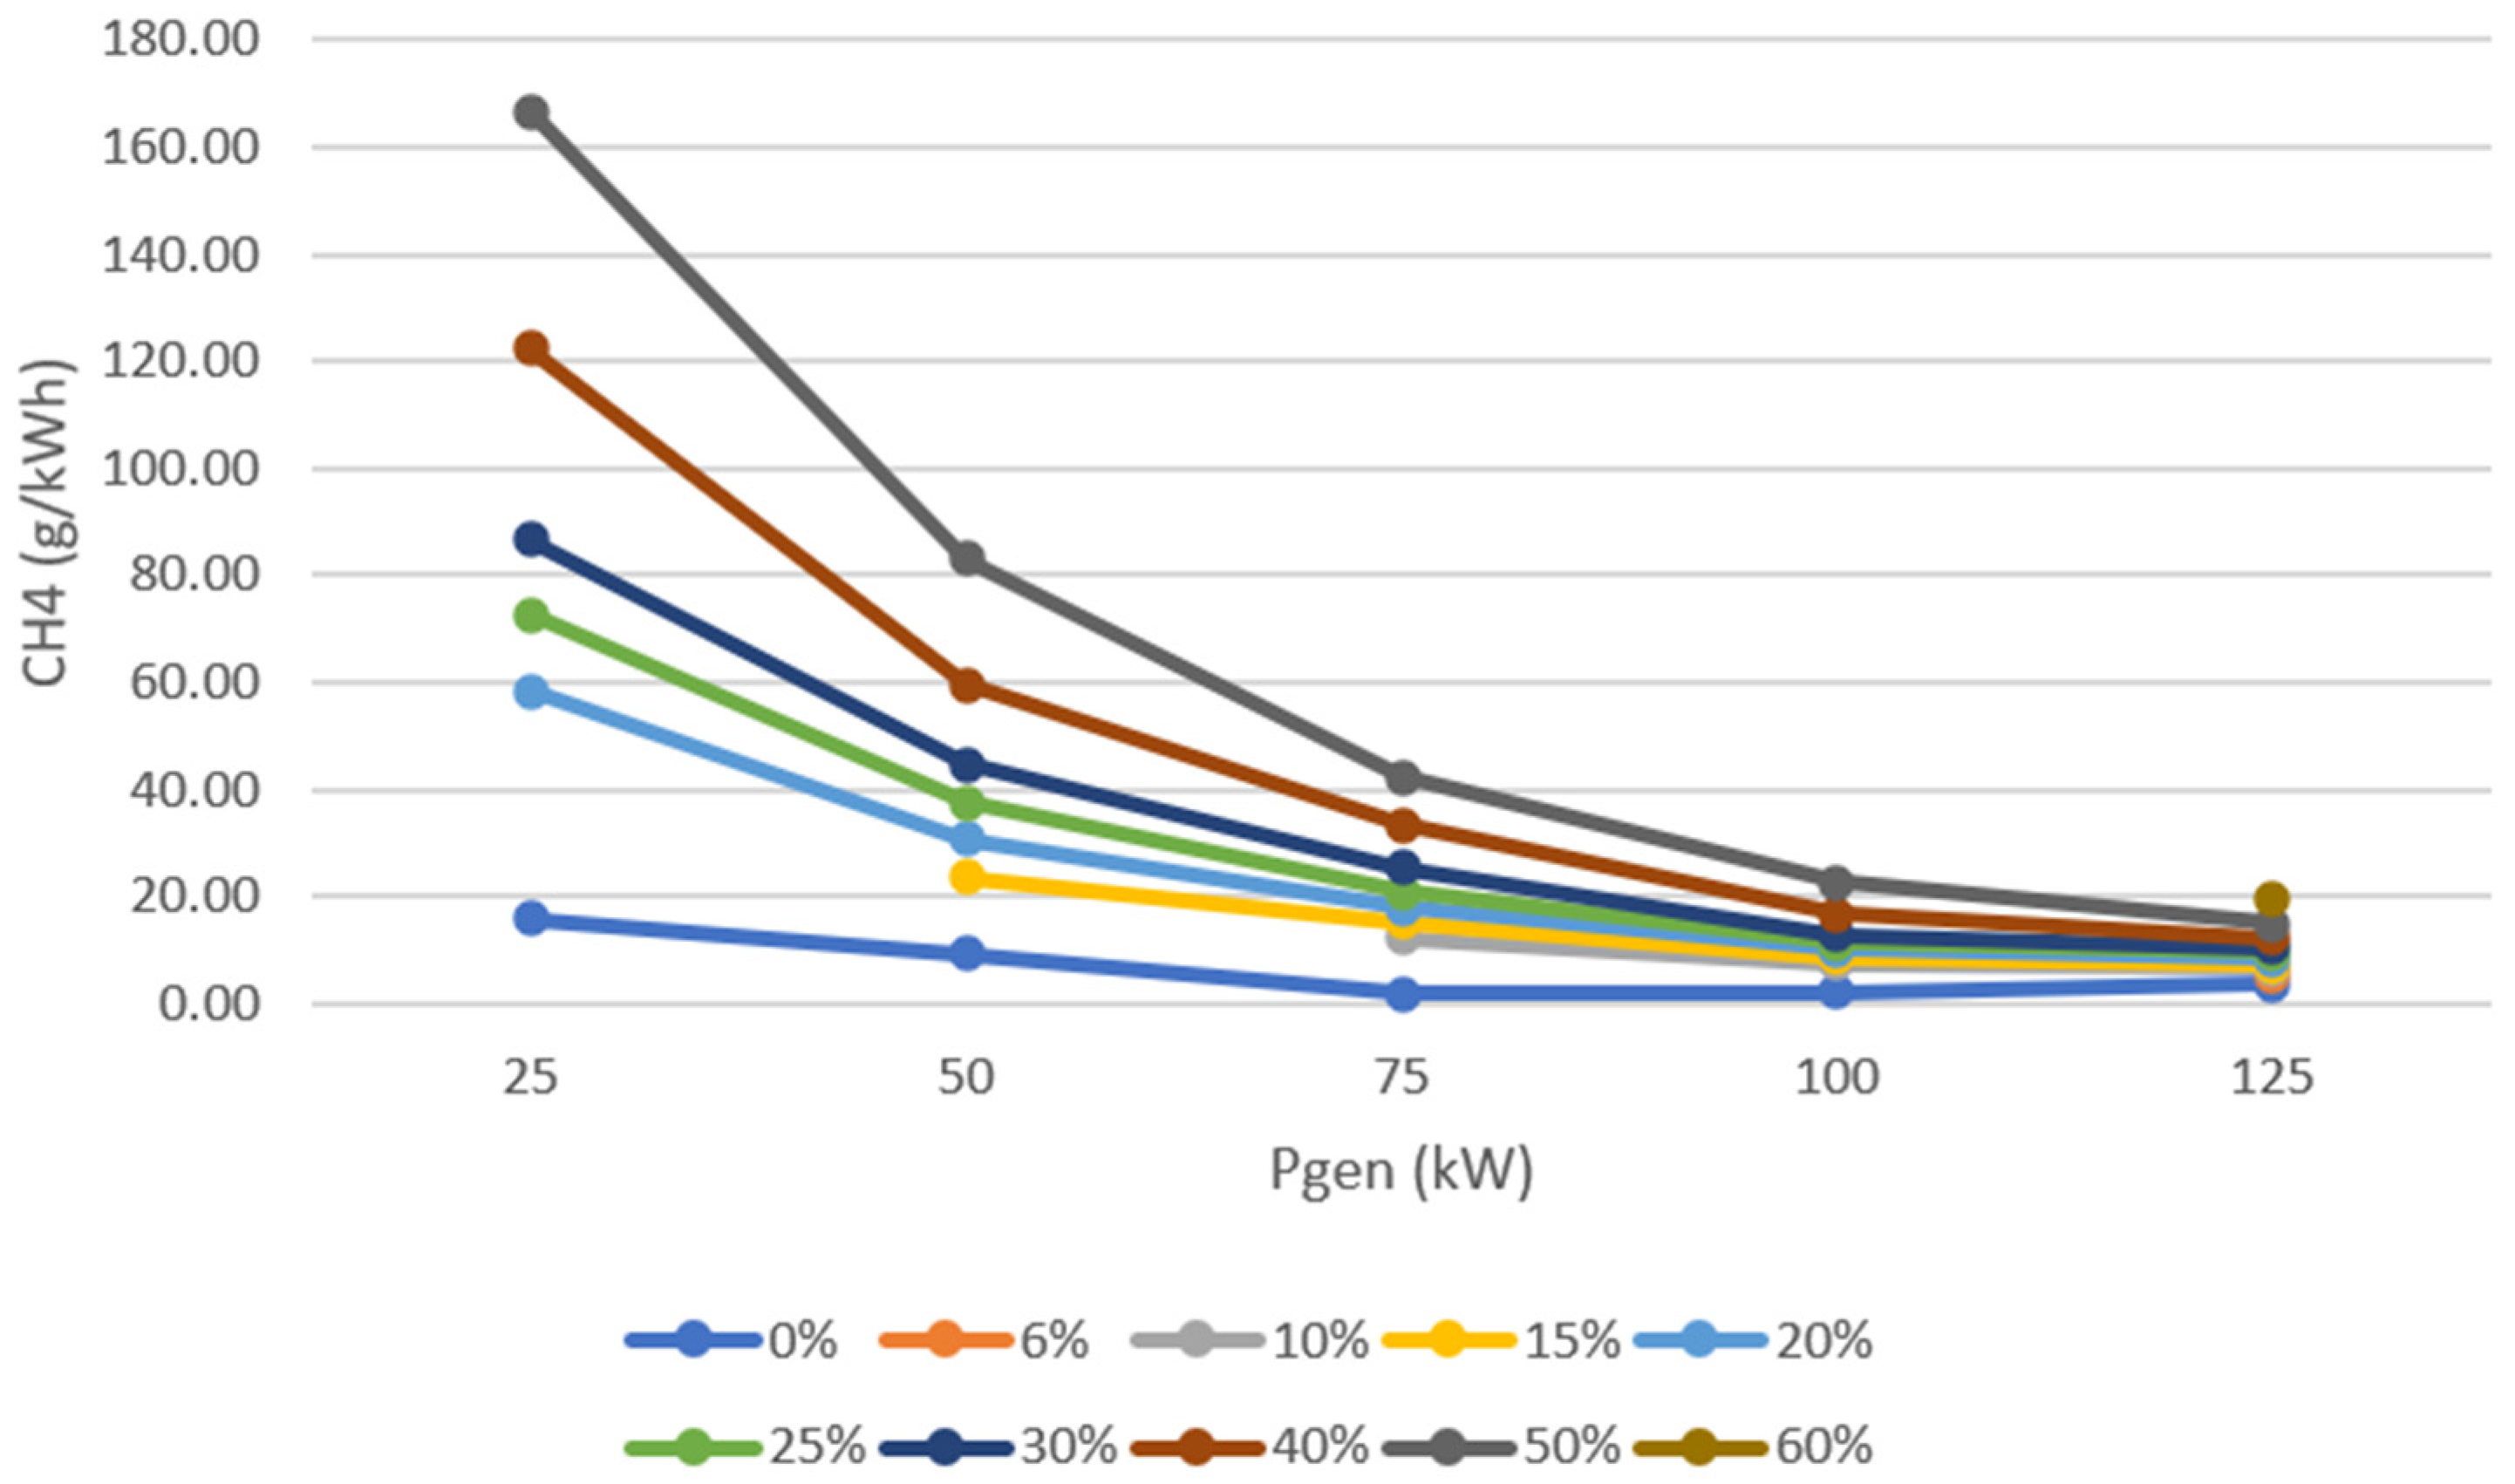
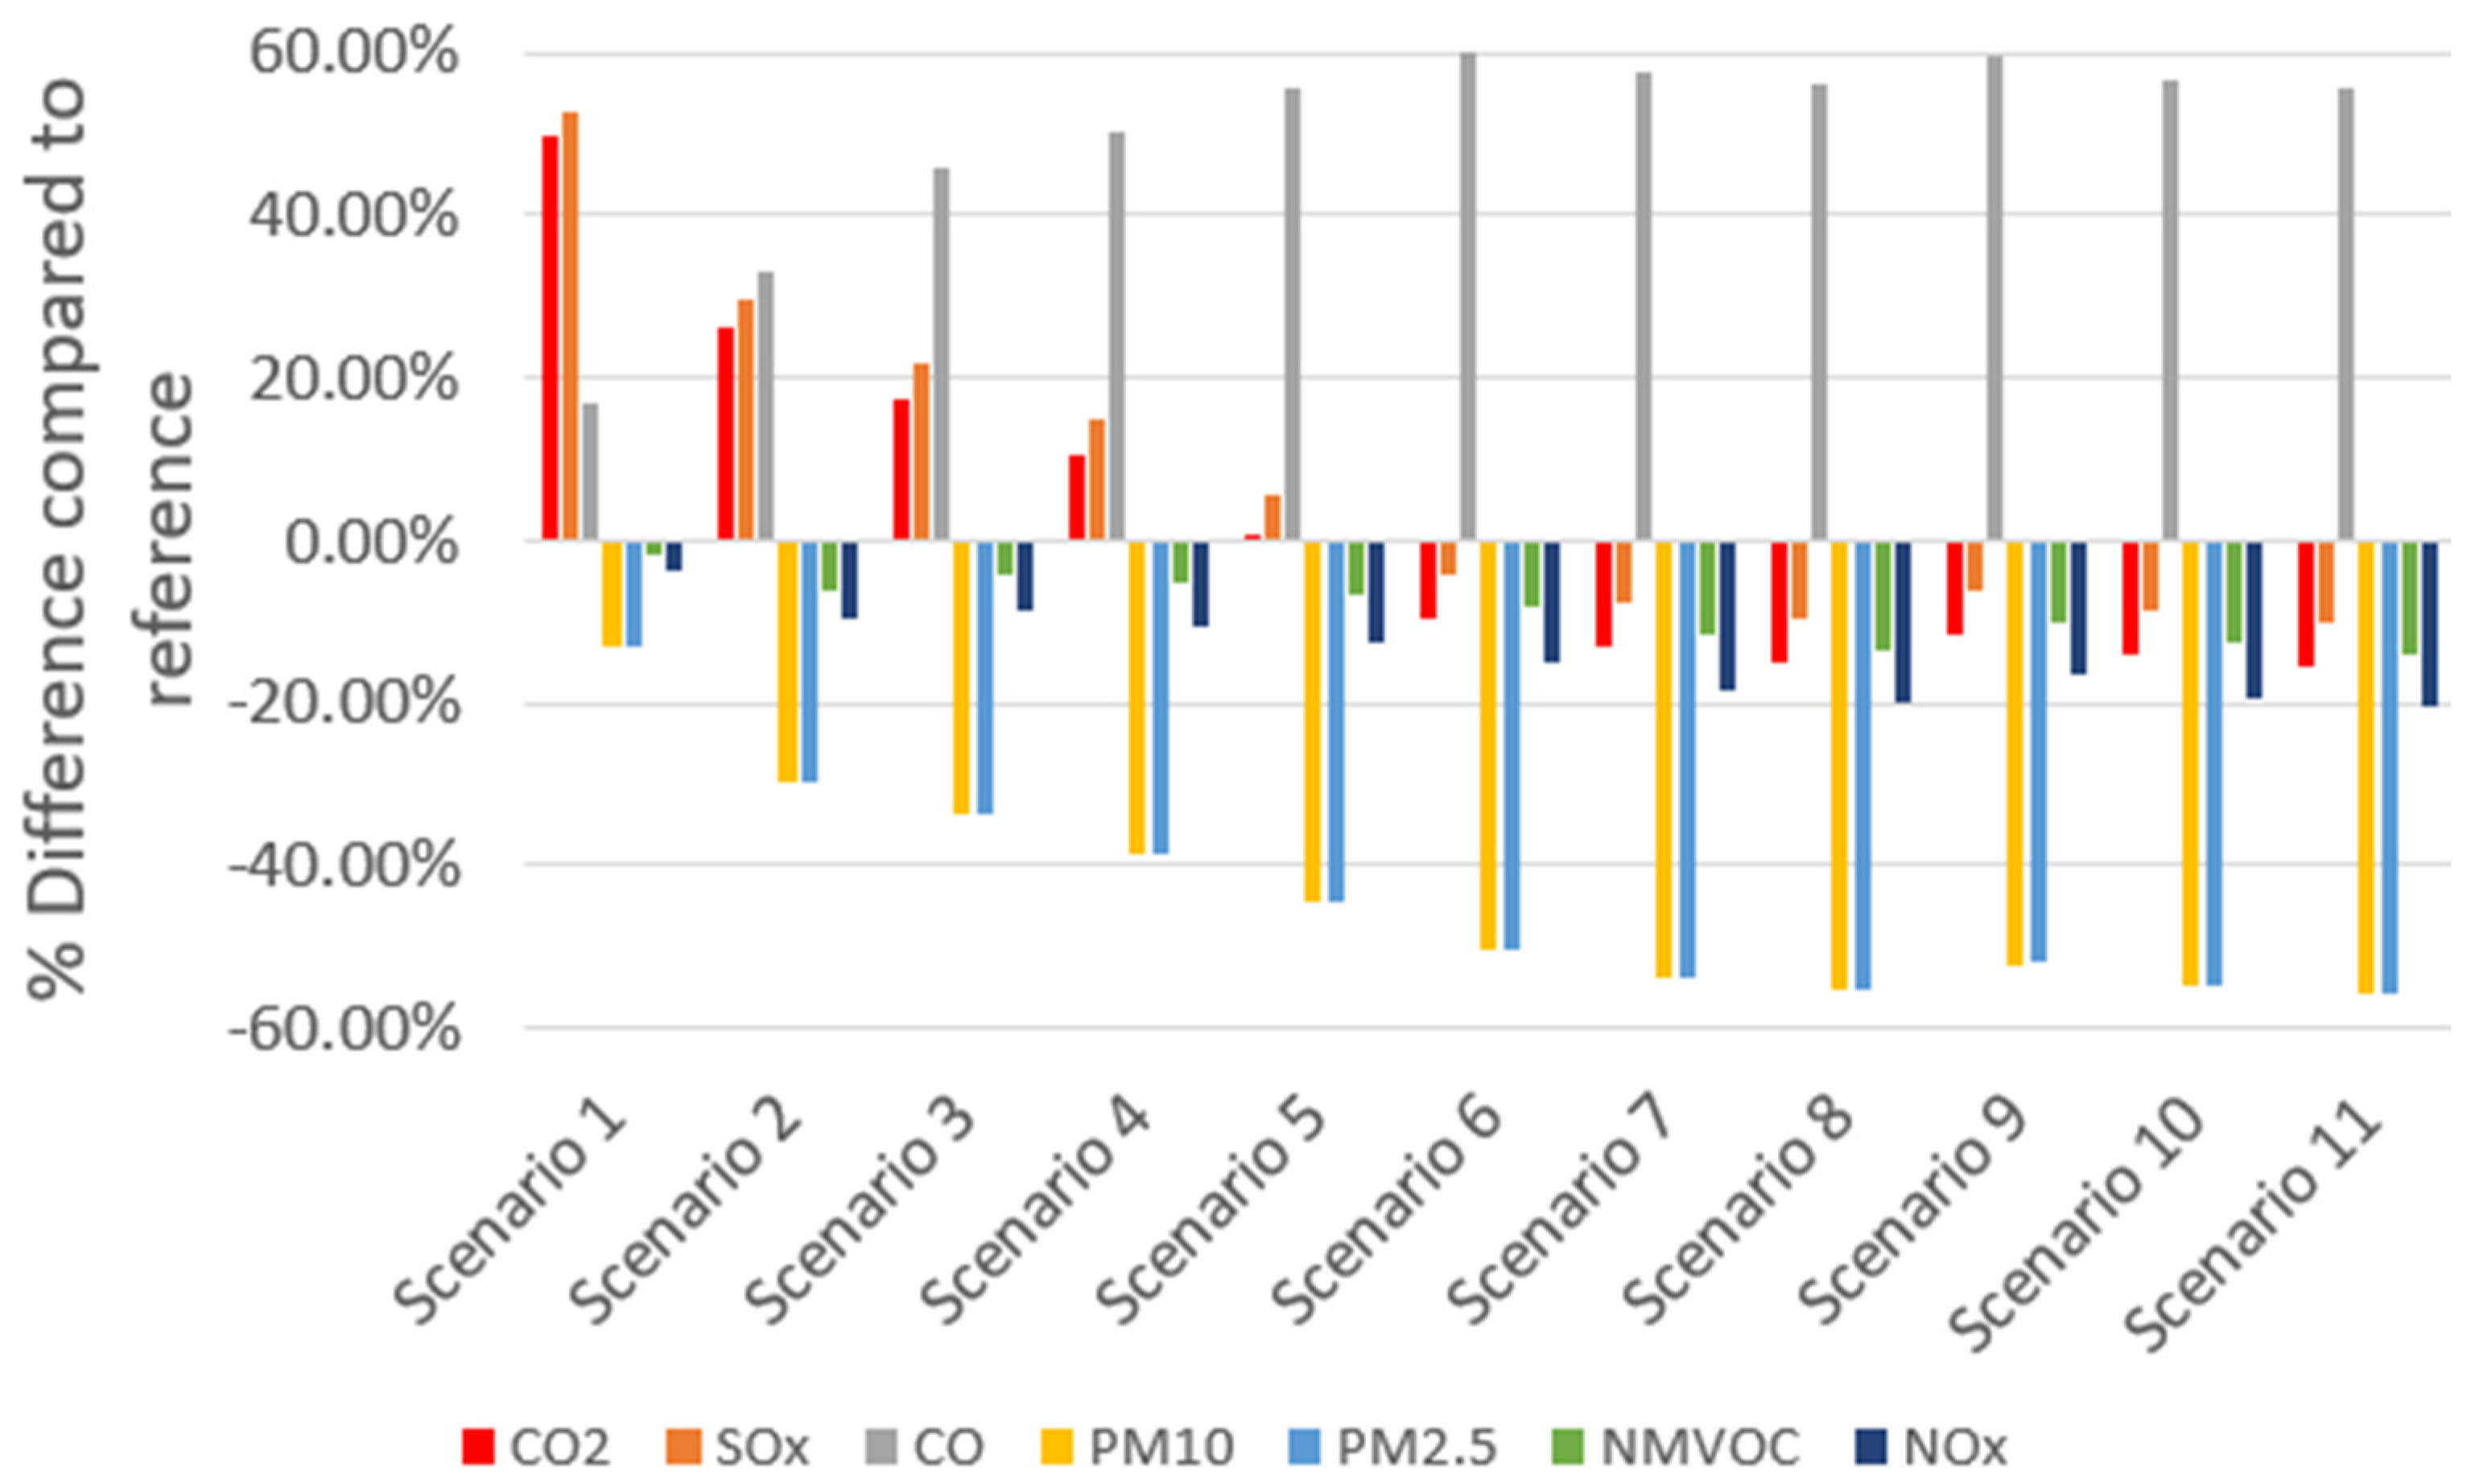
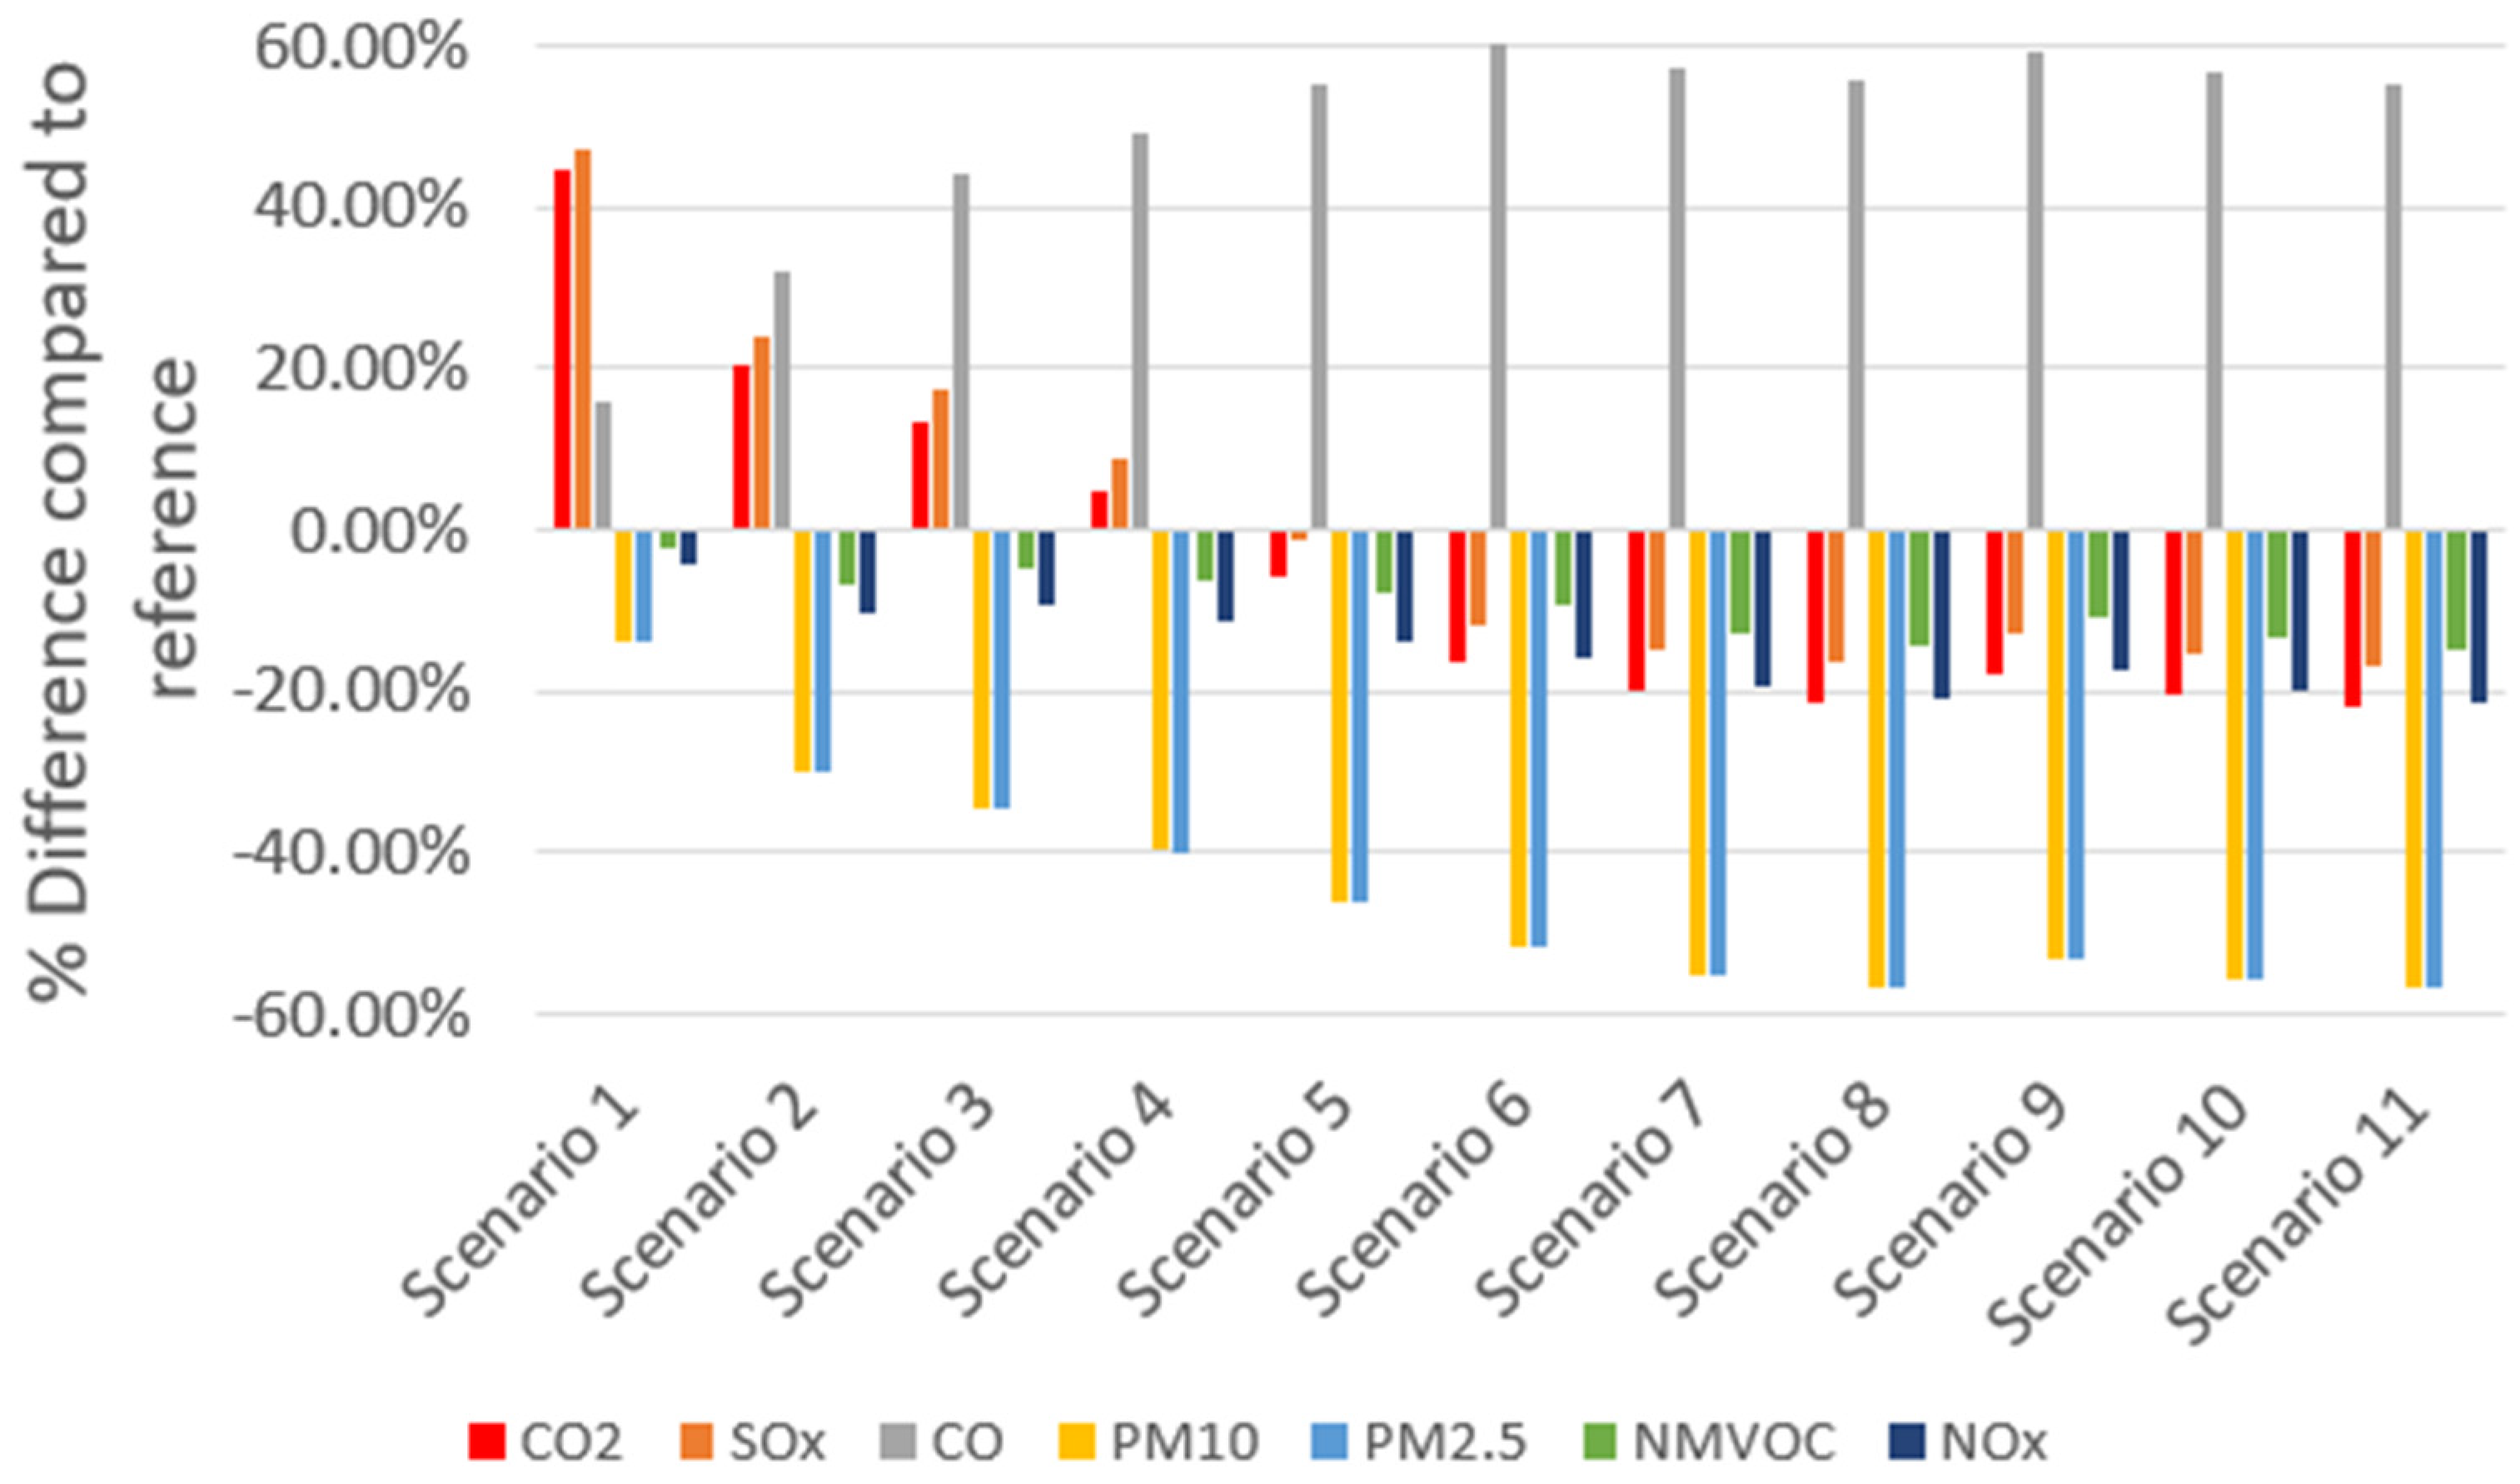
4.4. PtW Impact Assessment and Interpretation of Scenarios for Both Vessels

On a PtW basis (see Figure 10) there are four main observations and conclusions regarding the impact assessments for both vessels:
  • The results for scenarios 6–11 are identical because they have no influence on a PtW basis. The scenarios only examine the impact of barge speed and distance to vessels, which is part of WtP.
  • Scenarios 6–11 utilize 80% biomethane substitution on an energy basis and compared to the reference lead to up to 18.2% and 24.4% CO2 reduction for M/T Alexandria and M/T Astraia, respectively.
  • CO2 emissions increase for scenarios 1–4 and scenarios 1–3 for M/T Alexandria and M/T Astraia, respectively, because for the vessels a 190 g/kWh specific fuel consumption (sfc) is assumed [7], p. 70, however, for the genset real fuel consumption rates are used. In Mallouppas et al. [30] the derating of the genset is clearly illustrated (with an sfc well above 190 g/kWh).
  • CO emissions increase and NOx emissions decrease as expected with dual fuel combustion engines utilizing biomethane. The relevant explanation has been provided in the previous section. Note that, on a PtW basis, the propulsion engines of the barge are switched off, hence only the genset combusting biomethane in dual fuel mode is operating. For the scenarios examining barge service speed and overall distance, the biomethane energy substitution is assumed to be 80%, thus there is no impact on a PtW basis. However, on a WtP basis the impact on CO is small but with a decreasing trend since the overall fuel consumption of the barge decreases (due to the benefits of lower service speed; i.e., slow steaming and smaller overall distances traveled).
  • SOx decrease by up to 20% since the sulfur content in MDO is higher compared to biomethane (refer to emission factors proposed by the IMO on Table 5).

5. Conclusions

This article concerns the research activities of BioCNG-to-CI and presents the lifecycle analysis (LCA) of the proposed solution. Impact scenarios were derived in order to evaluate the CO2 emissions as well as other harmful pollutants (SOx, CO, PM10, PM2.5, NMVOC, and NOx).
Eleven (11) impact scenarios were set up and compared to the reference case examining biomethane substitution on an energy basis, distance from the Port of Limassol to vessel anchorage, and barge service speed. The reference case is defined as the vessels using their auxiliary engines while at anchorage. The impact scenarios depending on each vessel provide up to 15–21% CO2 reduction on a cradle-to-grave analysis.
CO emissions increase by up to 55% when utilizing 80% biomethane energy substitution as also confirmed by direct measurements from the open literature. With the addition of an active carbon filter in the biogas-upgrading process the H2S removal is very high, compliant with the EU biomethane protocol EN-16723-2/2017. Hence SOx emissions reduced by up to 20% with increasing biomethane energy substitution. PM10, PM2.5, NMVOC, and NOx emissions decrease on a WtW basis due to the use of biomethane substitution on an energy basis. Biomethane substitution is utilized by the genset (PtW) as well as the dual fuel truck engine (WtP). Overall reductions for SOx, PM10, PM2.5, NMVOC, and NOx are up to 20%, 17%, 57%, 57%, 15%, and 21%, respectively, by utilizing up to 80% biomethane energy substitution for both examined vessels. These are important reductions considering the Port of Limassol’s close proximity to the urban environment as well as the recent inclusion of the Mediterranean Sea as a Sulfur Emission Control Area (SECA) requiring reductions in SOx emissions.

Author Contributions

Conceptualization, G.M., A.K., E.A.Y. and S.P.; methodology, G.M. and E.A.Y.; validation, all authors; formal analysis, G.M. and A.K.; investigation, G.M. and A.K.; resources, all authors; data curation, all authors; writing—original draft preparation, G.M.; writing—review and editing, all authors; visualization, G.M.; supervision, E.A.Y. and S.P.; project administration, E.A.Y. and S.P. All authors have read and agreed to the published version of the manuscript.

Funding

This research was funded by the European Union—NextGeneration EU, through the Research and Innovation Foundation, under the framework of the project “bioCNG-to-Cold Ironing Beyond Onshore Electrification: A bioCNG Floating Power Plant for Maritime Decarbonization”, CODEVELOP-GT/0322/0014.

Data Availability Statement

The original contributions presented in this study are included in the article. Further inquiries can be directed to the corresponding author.

Acknowledgments

The Cyprus Marine and Maritime Institute (CMMI) has been established as an EU Centre of Excellence in Marine and Maritime Research and Innovation and has received funding from the European Union’s Horizon 2020 research and innovation program within the framework of the CMMI/MaRITeC-X project under grant agreement No. 857586.

Conflicts of Interest

Author Sotiris Petrakides was employed by the company InoMob LTD. Author Marios Drousiotis was employed by the company Petronav Ship Management Ltd. The remaining authors declare that the research was conducted in the absence of any commercial or financial relationships that could be construed as a potential conflict of interest.

References

  1. Mallouppas, G.; Yfantis, E. Decarbonization in Shipping Industry: A Review of Research, Technology Development, and Innovation Proposals. J. Mar. Sci. Eng. 2021, 9, 415. [Google Scholar] [CrossRef]
  2. European Commission. Directive 2003/30/EC of the European Parliament and of the Council of 8 May 2003 on the Promotion of the Use of Biofuels or Other Renewable Fuels for Transport; European Commission: Brussels, Belgium, 2003. [Google Scholar]
  3. Oh, Y.-K.; Hwang, K.-R.; Kim, C.; Kim, J.R.; Lee, J.-S. Recent developments and key barriers to advanced biofuels: A short review. Bioresour. Technol. 2018, 257, 320–333. [Google Scholar] [CrossRef]
  4. Panoutsou, C.; Germer, S.; Karka, P.; Papadokostantakis, S.; Kroyan, Y.; Wojcieszyk, M.; Maniatis, K.; Marchand, P.; Landalv, I. Advanced biofuels to decarbonise European transport by 2030: Markets, challenges, and policies that impact their successful market uptake. Energy Strategy Rev. 2021, 34, 100633. [Google Scholar] [CrossRef]
  5. IEA. Biofuels for Transport, An International Perspective; International Energy Agency: Paris, France, 2004. [Google Scholar]
  6. Mallouppas, G.; Yfantis, E.; Ioannou, C.; Paradeisiotis, A.; Ktoris, A. Application of Biogas and Biomethane as Maritime Fuels: A Review of Research, Technology Development, Innovation Proposals, and Market Potentials. Energies 2023, 16, 2066. [Google Scholar] [CrossRef]
  7. IMO. Fourth Greenhouse Gas Study 2020; International Maritime Organization: London, UK, 2020. [Google Scholar]
  8. Carvalho, F.; O’Malley, J.; Osipova, L.; Pavlenko, N. Key Issues in LCA Methodology for Marine Fuels; International Council on Clean Transportation: Washington, DC, USA, 2023. [Google Scholar]
  9. CMMI. bioCNG-to-Cold Ironing. Cyprus Marine and Maritime Institute. 2023. Available online: https://www.cmmi.blue/biocng-to-cold-ironing/ (accessed on 12 December 2024).
  10. Obaideen, K.; Abdelkareem, M.A.; Wilberforce, T.; Elsaid, K.; Sayed, E.T.; Maghrabie, H.M.; Olab, A. Biogas role in achievement of the sustainable development goals: Evaluation, Challenges, and Guidelines. J. Taiwan Inst. Chem. Eng. 2022, 131, 104207. [Google Scholar] [CrossRef]
  11. World Biogas Association. How to Achieve the Sustainable Development Goals Through Biogas: Factsheet 3. 2018. Available online: https://www.worldbiogasassociation.org/wp-content/uploads/2018/07/WBA-SDGs-Biogas-factsheet-3.pdf (accessed on 3 January 2025).
  12. Catalano, G.; D’Adamo, I.; Gastaldi, M.; Nizami, A.-S.; Ribichini, M. Incentive policies in biomethane production toward circular economy. Renew. Sustain. Energy Rev. 2024, 202, 114710. [Google Scholar] [CrossRef]
  13. Lubańska, A.; Kazak, J.K. The Role of Biogas Production in Circular Economy Approach from the Perspective of Locality. Energies 2023, 16, 3801. [Google Scholar] [CrossRef]
  14. Szarka, N.; Laverde, L.G.; Thrän, D.; Kiyko, O.; Ilkiv, M.; Moravčíková, D.; Cudlínová, E.; Lapka, M.; Hatvani, N.; Koós, Á.; et al. Stakeholder Engagement in the Co-Design of Regional Bioeconomy Strategies. Sustainability 2023, 15, 6967. [Google Scholar] [CrossRef]
  15. Shogole, M.P. 18—Stakeholder engagement and governance issues in applying green principles to the biogas sector. In Innovations in the Global Biogas Industry; Applications of Green Principles; Woodhead Publishing: Cambridge, UK, 2025; pp. 495–509. [Google Scholar]
  16. InoMob Ltd. Renewable Natural Gas (RNG) Supply. InoMob Ltd. Available online: https://www.inomob.eu/renewable-natural-gas-supply/ (accessed on 12 December 2024).
  17. Future Fuels Nordic. Fuel Life-Cycle Assessment Resources. Nordic Roadmap—Future Fuels for Shipping. 2024. Available online: https://futurefuelsnordic.com/fuel-life-cycle-assessment-resources/ (accessed on 8 November 2024).
  18. Hiloidhari, M.; Kumari, S. Chapter 15—Biogas upgrading and life cycle assessment of different biogas upgrading technologies. In Emerging Technologies and Biological Systems for Biogas Upgrading; Academic Press; Elsevier: London, UK, 2021; pp. 413–445. [Google Scholar]
  19. Sun, Q.; Li, H.; Yan, J.; Liu, L.; Yu, Z.; Yu, X. Selection of appropriate biogas upgrading technology-a review of biogas cleaning, upgrading and utilisation. Renew. Sustain. Energy Rev. 2015, 51, 521–532. [Google Scholar] [CrossRef]
  20. Florio, C.; Fiorentino, G.; Corcelli, F.; Ulgiati, S.; Dumontet, S.; Güsewell, J.; Eltrop, L. A life cycle assessment of biomethane production from waste feedstock through different upgrading technologies. Energies 2019, 12, 718. [Google Scholar] [CrossRef]
  21. Ardolino, F.; Cardamone, G.; Parrillo, F.; Arena, U. Biogas-to-biomethane upgrading: A comparative review and assessment in a life cycle perspective. Renew. Sustain. Energy Rev. 2021, 139, 110588. [Google Scholar] [CrossRef]
  22. Suhartini, S.; Nugroho, W.; Putranto, A.; Pangestuti, M.; Rohma, N.; Melville, L. Life cycle assessment of biomethane technology. In Biogas to Biomethane; Woodhead Publishing: Sawston, UK, 2024; pp. 243–275. [Google Scholar]
  23. Buivydas, E.; Navickas, K.; Venslauskas, K. A Life Cycle Assessment of Methane Slip in Biogas Upgrading Based on Permeable Membrane Technology with Variable Methane Concentration in Raw Biogas. Sustainability 2024, 16, 3323. [Google Scholar] [CrossRef]
  24. Kapoor, R.; Ghosh, P.; Kumar, M.; Vijay, V. Evaluation of biogas upgrading technologies and future perspectives: A review. Environ. Sci. Pollut. Res. 2019, 26, 11631–11661. [Google Scholar] [CrossRef]
  25. Bureau Veritas, Marine & Offshore. Alternative Fuels Outlook for Shipping—An Overview of Alternative Fuels from a Well-To-Wake Perspective; Bureau Veritas, Marine & Offshore: Trignac, France, 2022. [Google Scholar]
  26. Zhou, Y.; Swidler, D.; Searle, S.; Baldino, C. Life-Cycle Greenhouse Gas Emissions of Biomethane and Hydrogen Pathways in the European Union; The International Council of Clean Transportation: Washington, DC, USA, 2021. [Google Scholar]
  27. Repele, M.; Paturska, A.; Valters, K.; Bazbauers, G. Life cycle assessment of bio-methane supply system based on natural gas infrastructure. Agron. Res. 2014, 12, 999–1006. [Google Scholar]
  28. Lorenzi, G.; Gorgoroni, M.; Silva, C.; Santarelli, M. Life Cycle Assessment of biogas upgrading routes. Energy Procedia 2019, 158, 2012–2018. [Google Scholar] [CrossRef]
  29. European Union. Cyprus Energy Snapshot. 2021. Available online: https://energy.ec.europa.eu/document/download/24db0005-9efe-4564-bb34-b9db28a3d217_en?filename=CY%202022%20Energy%20Snapshot_rev.pdf (accessed on 12 December 2024).
  30. Mallouppas, G.; Ktoris, A.; Ioannou, C.; Damianou, S. D4.2 Report on the Experimental Results and the Overall Assessment of the Biomethane as a Marine Biofuel Supplement. BioCH4-to-Market, Grant Agreement Number: ENTERPRISES/0521/0162; Cyprus Research Innovation Foundation: Larnaca, Cyprus, 2023. [Google Scholar]
  31. European Standard EN 16723-2; Natural Gas and Biomethane for Use in Transport and Biomethane for Injection in the Natural Gas Network—Part 2: Automotive Fuels Specification. European Commission: Brussels, Belgium, 2017.
  32. Winkel, R.; Weddige, U.; Johnsen, D.; Hoen, V.; Papaefthimiou, S. Shore Side Electricity in Europe: Potential and environmental benefits. Energy Policy 2016, 88, 584–593. [Google Scholar] [CrossRef]
  33. Martínez-López, A.; Romero-Filgueira, A.; Chica, M. Specific environmental charges to boost Cold Ironing use in the European Short Sea Shipping. Transp. Res. Part D 2021, 94, 102775. [Google Scholar] [CrossRef]
  34. Stolz, B.; Held, M.; Georges, G.; Boulouchos, K. The CO2 reduction potential of shore-side electricity in Europe. Appl. Energy 2021, 285, 116425. [Google Scholar] [CrossRef]
  35. Yfantis, E.A.; Mallouppas, G.; Ktoris, A.; Ioannou, C. Fit for 55—Impact on Cypriot Shipping Industry. Preliminary Report—Assessement of the New Measures and Their Effect on the Shipping Industry and the Relevant Cyprus Economy Sectors; Submitted to MECI; Cyprus Marine and Maritime Institute: Larnaca, Cyprus, 2022. [Google Scholar]
  36. Sornn-Friese, H.; Poulsen, R.T.; Nowinska, A.U.; de Langen, P. What drives ports around the world to adopt air emissions abatement measures? Transp. Res. Part D Transp. Environ. 2021, 90, 102644. [Google Scholar] [CrossRef]
  37. Zis, T.; North, R.J.; Angeloudis, P.; Ochieng, W.Y.; Bell, M.G.H. Evaluation of cold ironing and speed reduction policies to reduce ship emissions near and at ports. Marit. Econ. Logist. 2014, 16, 371–398. [Google Scholar] [CrossRef]
  38. Ballini, F.; Bozzo, R. Air pollution from ships in ports: The socio-economic benefit of cold-ironing technology. Res. Transp. Bus. Manag. 2015, 17, 92–98. [Google Scholar] [CrossRef]
  39. Innes, A.; Monios, J. Identifying the unique challenges of installing cold ironing at small and medium ports—The case of aberdeen. Transp. Res. Part D Transp. Environ. 2018, 62, 298–313. [Google Scholar] [CrossRef]
  40. Mallouppas, G.; Pieri, T. D4.2 “Report on Performance Monitoring and Predictive Maintenance Software Tools”—Under Review. BioCNG-to-CI, Grant Agreement Number: CODEVELOP-GT/0322/0014; Cyprus Research Innovation Foundation: Larnaka, Cyprus, 2024. [Google Scholar]
  41. ISO 14044; Environmental Management—Life Cycle Assessment—Requirements and Guidelines. ISO: Geneva, Switzerland, 2006.
  42. ISCC EU 205; GreenHouse Gas Emissions. International Sustainability & Carbon Certification (ISCC): Rutherford, NJ, USA, 2021.
  43. European Commission. Red II—Directive (EU) 2018/2001 of the European Parliament and of the Council of 11 December 2018 on the Promotion of the Use of Energy from Renewable Sources; European Commision: Brussels, Belgium, 2018. [Google Scholar]
  44. ISCC. All ISCC Certificates—InoMob Ltd. Certificate. Available online: https://hub.iscc-system.org//FileHandler/download/certificateFile/NTE5ODNfRVUtSVNDQy1DZXJ0LUlUMjA2LTAwMDAyNjA5 (accessed on 8 November 2024).
  45. ISCC. ISCC Certficate—InoMob LTD ISCC Summary Audit Report. Available online: https://hub.iscc-system.org//FileHandler/download/summaryAuditReportFile/NTE5ODNfRVUtSVNDQy1DZXJ0LUlUMjA2LTAwMDAyNjA5 (accessed on 8 November 2024).
  46. Jalkanen, J.-P.; Johansson, L.; Kukkonen, J.; Brink, A.; Kalli, J.; Stipa, T. Extension of an assessment model of ship traffic exhaust emissions for particulate matter and carbon monoxide. Atmos. Chem. Phys. 2012, 12, 2641–2659. [Google Scholar] [CrossRef]
  47. VesselFinder. VesselFinder—M/T Alexandria. VesselFinder. 5 July 2024. Available online: https://www.vesselfinder.com/?imo=9448889 (accessed on 5 July 2024).
  48. Vessel Finder. VesselFinder—M/T Astraia. Vessel Finder. Available online: https://www.vesselfinder.com/?imo=9550589 (accessed on 5 July 2024).
  49. Net-Zero-Emissions-CI: Towards bioCNG as a Carbon Negative Maritime Power Source. The Project CODEVELOP-REPowerEU/1223/0096 Is Funded by the European Union—NextGenerationEU, Through the Research and Innovation Foundation. 2024. Available online: https://www.cmmi.blue/net-zero-emissions-ci/ (accessed on 12 December 2024).
  50. Papagiannakis, R.G.; Zannis, T.C.; Kotsiopoulos, P.N.; Yfantis, E.A.; Hountalas, D.T.; Rakopoulos, C.D. Theoretical Study of the Effects of Engine Parameters on Performance and Emissions of a Pilot Ignited Natural Gas Diesel Engine. Energy 2010, 35, 1129–1138. [Google Scholar] [CrossRef]
  51. Misra, A.; Yadav, M.S.A.; Singh, G. Proceedings of International Conference in Mechanical and Energy Technology, Smart Innovation, Systems and Technologies 174. In Chapter 30: Methane–Diesel Dual Fuel Engine: A Comprehensive Review; Springer Nature Singapore Pte Ltd.: Singapore, 2020; pp. 327–337. [Google Scholar]
  52. Bouguessa, R.; Tarabet, L.; Loubar, K.; Belmrabet, T.; Tazerout, M. Experimental investigation on biogas enrichment with hydrogen for improving the combustion in diesel engine operating under dual fuel mode. Int. J. Hydrogen Energy 2020, 45, 9052–9063. [Google Scholar] [CrossRef]
  53. Heywood, J.B. Internal Combustion Engine Fundamentals; McGraw Hill International Editions: New York, NY, USA, 1988. [Google Scholar]
  54. Papagiannakis, R.G.; Hountalas, D.T.; Rakopoulos, C.D.; Rakopoulos, D.C. Combustion and Performance Characteristics of a DI Diesel Engine Operating from Low to High Natural Gas Supplement Ratios at Various Operating Conditions; SAE International: Washington, DC, USA, 2008; Volume 2008-01-1392, pp. 1–22. [Google Scholar]
  55. Di Iorio, S.; Magno, A.; Mancaruso, E.; Vaglieco, B.M. Analysis of the effects of diesel/methane dual fuel combustion on nitrogen oxides and particle formation through optical investigation in a real engine. Fuel Process. Technol. 2017, 159, 200–210. [Google Scholar] [CrossRef]
  56. Di Iorio, S.; Magno, A.; Mancaruso, E.; Vaglieco, B.M. Performance, Gaseous and Particle Emissions of a Small Compression Ignition Engine Operating in Diesel/Methane Dual Fuel Mode 2016-01-0771; SAE Technical Paper; SAE International: Washington, DC, USA, 2016; Volume 2016-01-0771. [Google Scholar]
  57. Mustafi, N.N.; Raine, R.R.; Verhelst, S. Combustion and emissions characteristics of a dual fuel engine operated. Fuel 2013, 109, 669–678. [Google Scholar] [CrossRef]
  58. Lounici, M.S.; Loubar, K.; Tarabet, L.; Balistrou, M.; Niculescu, D.-C.; Tazerout, M. Towards improvement of natural gas-diesel dual fuel mode: An experimental investigation on performance and exhaust emissions. Energy 2014, 64, 200–211. [Google Scholar] [CrossRef]
Figure 1. BioCNG-to-CI concept [9].
Energies 18 00253 g001
Figure 2. Upgrading, Storage, and Refueling Unit (USRU) onsite view and its transportation via a trailer.
Energies 18 00253 g002
Figure 3. LCA methodology of assessing the BioCNG-to-CI solution.
Energies 18 00253 g003
Figure 4. Specific fuel consumption (sfc; kg/kWh) of different biomethane blends as a function of generator power.
Energies 18 00253 g004
Figure 5. (Left): Location of M/T Alexandria anchorage, image from VesselFinder [47]. (Right): Location of M/T Astraia, image from VesselFinder [48]. The approximate distance from the Port of Limassol (origin of barge Althaia—green circle) to the anchorage of the two vessels is 5 km.
Energies 18 00253 g005
Figure 6. CH4 slipping with different biomethane blends as a function of generator power. Note: the produced CH4 emissions reported from the dual fuel genset are without diesel/biomethane injection timing optimization. In the Net-Zero-Emissions-CI project [49] an attempt to optimize CH4 slipping through diesel/biomethane injection timing will be made.
Energies 18 00253 g006
Figure 7. Percentage difference of emissions compared to the reference scenario for M/T Alexandria.
Energies 18 00253 g007
Figure 8. Percentage difference of emissions compared to the reference scenario for M/T Astraia.
Energies 18 00253 g008
Figure 9. WtP analysis for both vessels. (Left): M/T Alexandria, (Right): M/T Astraia.
Energies 18 00253 g009
Figure 10. PtW analysis for both vessels. (Left): M/T Alexandria, (Right): M/T Astraia compared to Reference scenarios.
Energies 18 00253 g010
Table 1. Percentage per ship category for Cyprus ports for 2018. Data processed by Stolz et al. [34].
Ship CategoryPercentage of Total Estimated 19 GWh (%)Auxiliary Energy (GWh)
Passenger and cruise ships5.040.9576
Container ships24.424.6398
Bulk carriers9.691.8411
Oil tankers23.644.4916
Chemical tankers23.264.4194
Other ship types5.811.1039
Ro-Ro ships4.650.8835
Vehicle carriers0.780.1482
Gas carriers2.710.5249
Table 2. Description of scenarios to be investigated in the LCA impact assessments. Pgen = 80 kW at anchorage for M/T Alexandria and Pgen = 90 kW at anchorage for M/T Astraia.
Scenario% Biomethane SubstitutionTotal Distance Traveled by Barge Including Return Leg (km)Barge Service Speed (knots)
ReferenceM/T Alexandria and M/T Astraia using their auxiliary engines (MDO)
Scenario 120.010.05.0
Scenario 240.010.05.0
Scenario 350.010.05.0
Scenario 460.010.05.0
Scenario 570.010.05.0
Scenario 680.010.05.0
Scenario 780.05.05.0
Scenario 880.02.55.0
Scenario 980.010.02.5
Scenario 1080.05.02.5
Scenario 1180.02.52.5
Table 3. Parameters in total GHG emission estimations as per ISCC [42]. Note that RED II [43] allows operators to use default values to estimate total emissions. Calculation and values are part of InoMob’s ISCC certificate [44,45].
TypeDescriptionValue
SnShare of feedstock n, in fraction of input to the digestern = 1
ecn,nGHG emissions from the extraction or cultivation of raw materials of feedstock n0.0 gCO2,eq/MJ
etd,feedstock,nEmissions from the transport of feedstock n to the digesterSet to 0.0 gCO2,eq/MJ due to onsite farming—no transport of feedstock
el,nAnnualized (over 20 years) GHG emissions from carbon stock change due to land use change of feedstock nSet to 0.0 gCO2,eq/MJ
esca,nGHG emissions savings from soil carbon accumulation via improved agricultural management of feedstock, nSet to 124.4 gCO2,eq/MJ as per manure credits
epEmissions from processing117.9 + 6.3 = 124.2 gCO2,eq/MJ as per RED II directive Annex C [43] for “Disaggregated default values for biomethane” for wet manure—open digestate (no off-gas combustion)
etd,productEmissions from the transport and distribution of biogas and/or biomethane0.144 gCO2,eq/MJ, see later for calculation
euEmissions from the fuel in use, which is GHG emitted during combustion0.0 gCO2,eq/MJ
eccsGHG emissions savings from carbon capture and storage0.0 gCO2,eq/MJ
eccrGHG emissions savings from carbon capture and replacement0.0 gCO2,eq/MJ
ETotal emissions of fuel−0.056 gCO2,eq/MJ
For simplicity total emissions rounded to 0.0 gCO2,eq/MJ
Table 4. etd,product calculation for a delivery radius of 60 km.
TypeValueComments
On road delivery radius from production site to Port of Limassol60 kmEnergies 18 00253 i001
Amount of upgraded biomethane per delivery5390 Nm3Equivalent to 194,040 MJ
Diesel truck consumption for 60 km delivery radius60 × 0.49 + 60 × 0.25 = 44.4 L0.49 L/km (fully loaded); 0.25 L/km (empty); as per ISCC EU Annex I [42].
Corresponding CO2 emissions from diesel truck44.4 × 3.14 = 139.4 kgCO2,eq/LEmission factor for diesel 3.14 as per ISCC EU Annex I [42].
Emissions in gCO2,eq/MJ139.4 kgCO2,eq/L × 1000/194,040 = 0.72 gCO2,eq/MJ
InoMob’s current biomethane GHG footprint (0.0 gCO2,eq/MJ) as per InoMob’s ISCC.
Dual fuel track uses 80% biomethane and 20% dieseletd,product = 0.72 × 20% = 0.144 gCO2,eq/MJThe engine of the truck has been retrofitted to combustion biomethane in dual fuel mode
Table 5. Energy-based and fuel-based emission factors, reproduced from the 4th IMO GHG study report [7]. * Assumed Tier 3 engines are used. CO2 = carbon dioxide, CO = carbon monoxide, SOx = sulfur oxides, PM10 = particulate matter with a diameter of 10 μm, PM2.5 = particulate matter with a diameter of 2.5 μm, NMVOC = non-methane volatile organic compounds, NOx = nitrogen oxides (the combination of NO + NO2).
Fuel TypeFuel-Based Emission FactorsEnergy-Based Emission Factors
CO2
[gCO2/g Fuel]
SOx
[gSOx/g Fuel]
CO
[gCO/kWh]
PM10
[gPM10/kWh]
PM2.5
[gPM2.5/kWh]
NMVOC
[gNMVOC/kWh]
NOx
[gNOx/kWh]
HFO3.1140.05080.5401.39 *92% of PM100.5272.0 *
MDO3.2060.00140.5400.19 *0.5272.0 *
LNG2.7503.17 × 10−51.040.01 *0.4001.3 *
Table 6. Estimated sfcbase at 80 kW and 90 kW and corresponding % biomethane substitution.
% Biomethane Substitutionsfcbase [kg/kWh]
at Pgen = 80 kW
sfcbase [kg/kWh]
at Pgen = 90 kW
0.00.3130.309
20.00.3470.335
40.00.3730.357
50.00.3900.375
60.00.4050.385
70.00.4200.397
80.00.4340.409
Table 7. Althaia barge characteristics.
Althaia Characteristics
Length16.75 m
Beam5.02 m
Depth1.75 m
Draft0.95
Displacement70 t
Design/reference speed6 knots
Service speed5 knots
Table 8. Estimated specific fuel consumption, sfcbase, per built year of a vessel obtained from the 4th IMO GHG study report [7], p. 70.
Built Year ≤ 19831983 < Built Year ≤ 2000Built Year > 2000
sfcbase (g/kWh)Residual fuel (HFO)
205.0185.0175.0
Distillate fuel (MDO)
190.0175.0165.0
Table 9. Diesel and biomethane fuel consumption and air flow rates with 75 kW and 100 kW generator power and biomethane energy substitution. Flow rates linearly interpolated at 80 kW and 90 kW for each vessel’s electrical needs at anchorage. At 80 kW and 90 kW, beyond 50% a line of best fit is used to estimate the fuel consumption.
Pgen (kW)Energy Substitution (%)Diesel Fuel Consumption (kg/h)Biomethane Consumption (kg/h)
750.022.640.0
20.021.134.30
30.019.596.83
40.017.809.66
50.015.8212.80
1000.029.400.00
20.025.985.10
30.023.718.10
40.021.4111.29
50.019.5115.13
Linearly interpolated
80 (M/T Alexandria)0.023.990.00
20.022.104.46
30.020.417.08
40.018.529.99
50.016.5613.27
60.015.5315.37
70.013.9918.03
80.012.4420.69
90 (M/T Astraia)0.026.690.00
20.024.044.78
30.022.067.59
40.019.9610.64
50.018.0414.20
60.016.5316.42
70.014.7319.26
80.012.9222.09
Disclaimer/Publisher’s Note: The statements, opinions and data contained in all publications are solely those of the individual author(s) and contributor(s) and not of MDPI and/or the editor(s). MDPI and/or the editor(s) disclaim responsibility for any injury to people or property resulting from any ideas, methods, instructions or products referred to in the content.

