Abstract
In the European Union, coal consumption in the power industry has been declining over time. Energy sources such as renewable energy, nuclear energy, and natural gas are being used on an increasing scale. Despite this, fossil fuels continue to be an important pillar of the energy industry in many countries around the world. There are various methods for diagnosing the combustion process, and one of them is based on a fibre-optic system for monitoring changes in flame intensity. Thanks to its innovative design, it allows information to be extracted from the flame under conditions of high temperatures and high dusting. The article presents an analysis of measurement signals for the recognition of states of flame intensity resulting from changes in the operating point of a power boiler. Trends in the flame that occur during the combustion process, which exceed the ranges specified by experts, can cause disturbances in combustion stability. The measurement data after preprocessing were classified using artificial neural networks to determine the conditions for flame stability. Based on the recurrent neural network models used, a classification accuracy of more than 99% was achieved. This allowed for the recognition of flame states in the combustion process.
1. Introduction
The coal combustion process can be considered as the combustion of its single particle or pulverised coal. In the power industry, the most common combustion method is implemented in a turbulent pulverised flame. A mixture of fuel, with pulverised coal or its mixture with biomass, along with air, is delivered to the combustion chamber by burners and then burned in a turbulent flame [1,2].
In the power industry, biomass processing can be carried out as combustion [3,4], co-firing [5,6], and gasification [7,8]. The process of co-firing coal and biomass requires special technological solutions and depends on the type of biomass. Typically, fluidised bed boilers are used for this process. Such boilers can also be used for the direct combustion of biomass. During the process of co-firing in power boilers, it is possible to use fuel in the amount of several percent of biomass along with coal fluid using vortex burners. At the output of these burners, the mixture of biomass and pulverised coal moves in a turbulent motion, so the flame is also turbulent. Describing the movement of particles in such a flame is so complex that a formal description of it, leading to a mathematical model that makes it possible to use it to control the combustion process in real time, is virtually impossible. Therefore, the approach through the use of flame pulsation using a fibre-optic monitoring system [9,10,11,12] in such a complex process becomes a particularly important diagnostic problem. The diagnostics of combustion processes is a particularly significant problem due to their complexity. In many areas of industry, by expanding technological installations, efforts are being made to reduce production costs. In industrial installations, including those used in the power industry, the large-scale use of measurement and automation equipment is observed. In addition, these systems are becoming increasingly complex. Plant failures are characterised by the fact that a large number of different signals are transmitted to the process operators in a relatively short period of time. This phenomenon is called the state propagation process, and in installations used in the power industry, a few to a dozen signals can occur [13].
The power boiler is the most important element of the process of electricity or heat generating using coal or its mixture with biomass. The combustion process in it must meet high technological, environmental, and economic parameters. The fulfilment of these conditions is directly related to the operation of such facilities. Emerging disturbances in the combustion process can result in temporary or long-term disruptions to the process.
As a result, such conditions can lead to the reduction in productivity or even to the stopping of the process [14,15]. If the flame disappears in the burner, the most dangerous result can be an uncontrolled explosion in the combustion chamber. Disturbances in the stability of the combustion process can lead to environmental hazards, as well as pose a danger to human life.
For such complex processes as combustion, it is important to use automatic diagnostics. This has a direct impact on reducing the time to detect and localise a disturbance. Quickly communicated and precise diagnostic information about a disorder in the combustion process makes it possible to apply safety measures to avoid or reduce the possible consequences of a failure.
There are various methods of technical diagnostics of combustion processes. Their main task is to meet the goals set for combustion process diagnostics in terms of technology, economy, and environmental protection. The choice of the diagnostics procedure for an industrial process depends on its model. In the case of combustion, which is a highly complex process, diagnostics procedures ignoring the process model and based on pattern recognition are often used. The diagnostics options presented describe a general approach. For processes characterised by complexity, diagnostics procedures can be developed to consider all aspects. Due to combustion product emissions, the formation of CO, CO2, NOx, SOx, and other compounds must be reduced [16,17,18]. There are various methods of reducing the formation of excessive combustion products realised within the combustion chamber (primary methods), which, for example, can include low-emission combustion [19,20]. On the other hand, secondary methods are used outside the combustion chamber. Adding biomass to the fuel also contributes to reducing the formation of nitrogen and sulphur oxides appearing as a result of combustion. From the analysis, it should be concluded that by using various methods of reducing emissions, the ecological aspect of the combustion process is increased. These methods do not replace the need for monitoring and diagnostics of the combustion process of pulverised coal and its mixtures with biomass.
Due to the use of low-emission combustion technology, a fibre-optic flame monitoring system could be used for diagnostics, allowing information to be obtained from the most sensitive zone of the flame [9,10,11,12]. This system allows for the extraction of many important parameters from the flame but does not replace the need to analyse these results. There are many methods for processing measurement data [21,22,23]. Various methods including wavelet analysis [24,25,26,27], fuzzy neural networks [28,29], and recurrent neural networks [30,31,32,33,34,35,36,37] are used in solving diagnostic problems in industrial processes. Recurrent neural networks (RNNs) are derived from unidirectional neural networks [38,39]. In RNNs, data from a sequence of input vectors are read by the network and modelled over time. A distinctive feature of RNNs is that it exhibits a high ability to process time series. In addition, fuzzy neural networks are based on fuzzy inference and are considered to be models that are flexible, interpretable, modifiable, and validatable [40,41,42]. Therefore, recurrent and fuzzy networks can be used to analyse data from the combustion process. This paper proposes the analysis of flame intensity signals in the frequency domain and the use of neural networks to recognise flame states. Article [28] presents the results of an experimental study of flame condition recognition in the combustion process. The scope of the study includes a statistical analysis, an examination of the correlation of signals from channels 1–4 of the measurement probe, an analysis of the occurrence of trends in flame intensity signals, prediction using the ARMA model, and a binary and multi-class classification of flame states using fuzzy neural networks. In order to seek the highest possible accuracy in classifying flame states, this paper proposes the analysis of flame intensity signals using selected artificial neural network models for flame state recognition. The data measured were subjected to classification using selected multilayer perceptron (MLP), long short-term memory (LSTM) cells, and convolutional LSTM (ConvLSTM) network models.
2. Materials and Methods
2.1. Combustion Process Monitoring System
The study of changes in the flame intensity was carried out on a laboratory bench, which consists of the combustion chamber and an integrated pulverised coal burner [28]. In the experiment carried out, two types of fuel were burned—the pulverised coal and the mixture of pulverised coal and biomass. A fibre-optic flame monitoring system developed at the Department of Electronics at the Lublin University of Technology [10,11,12] was used for diagnostics of the combustion process. This system allows for a non-invasive measurement of flame parameters in real time. Figure 1 shows a schematic of the fibre-optic flame monitoring system.
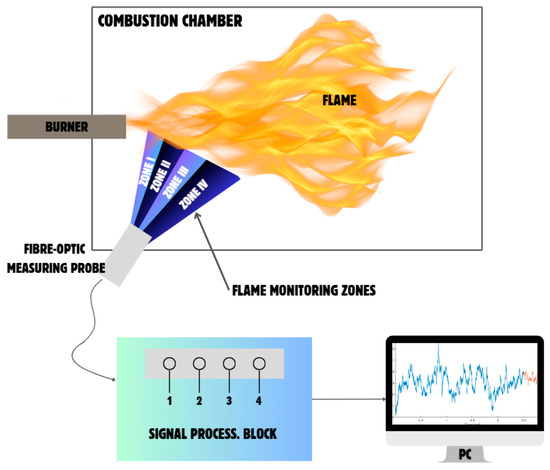
Figure 1.
Fibre-optic flame monitoring system [28].
Figure 1 shows a schematic structure of the fibre-optic flame monitoring system. In the construction of this system, it is necessary to distinguish the fibre-optic measurement probe and the signal-processing block. Figure 2 presents the measurement probe (Figure 2a) and the fibre-optic head (Figure 2b), which is the most important component of this system. This head consists of a bundle of optical fibres. In addition, the design of the probe used for the tests allows for measurements to be performed in high-temperature, high-vibration, and dusty conditions. The measurement probe, using an inspection hole, is placed in the combustion chamber near the burner so that the fibre-optic head can record measurement data from the flame in different monitoring zones along its axis. Flame monitoring zones 1–4 are marked in Figure 1 and are located at different distances from the burner face. Another component of the measurement system is the signal-processing block, which consists of four twin signal paths. The flame monitoring system used a modified silicon photodetector that recorded wavelengths from 200 to 1100 nm. The optical fibres used were made of quartz glass. The measurement data recorded from the flame are sent to the signal-processing block and are then converted into an electronic signal for further analysis.
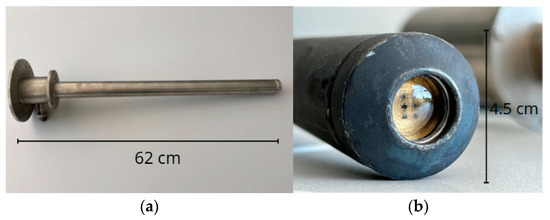
Figure 2.
(a) Fibre-optic measuring probe; (b) fibre-optic head.
Flame tests were conducted using the fibre-optic flame monitoring system for two types of fuel. The parameter recorded was the flame intensity, which is an amplitude measure of the signal recorded by the detector. In addition, the flame intensity is proportional to its temperature and is measured in the visible-to-near-infrared region (depending on the spectral characteristics of the detector).
2.2. Measurement Data Acquisition
The combustion process in the flame may display short-time trends of a linear or nonlinear nature. The power dispatch requires fast responses to their demand and therefore, flame swaps may appear in the combustion process. This depends on the demand of the power dispatch for rapid changes, which can cause trends in the flame. The occurrence of these trends is related to the change in the operating point during the regulation of the power that is generated by the power boiler. These changes can contribute to an increase in undesirable combustion products, e.g., NOx, SOx, or CO. In extreme cases, the flame may go out when adjusting the minimum load of less than 50% of the power.
Studies on changes in flame intensity in the combustion of fuels consisting of 100% pulverised coal and 80% coal mixed with 20% biomass (shredded straw) were carried out under such conditions as the fixed fuel composition, excess air ratio of λ = 0.85, and thermal power of 400 kW. In addition, for a thermal output of 400 kW, the mass of the fuel being fed with pulverised coal or its mixture with biomass was determined, and for this amount of fuel, the amount of air required was determined for the assumed excess air factor λ. Also, the amount of fed air and fuel was controlled, and temperatures in the combustion chamber were measured using thermocouples.
For both fuel compositions, the measurement time and the number of samples recorded were kept the same. Each dataset contained more than 2 million samples from four channels of the fibre-optic probe, which were recorded at the rate of 1000 samples. The data were recorded as a time series. Due to the turbulent combustion in the flame, we analysed the frequency of its flickering. Previous research has led to the conclusion that we can use measurements from 1 flame monitoring zone for analysis due to the fact that this zone is the most sensitive to the variability of input signals. Figure 3 presents the selected time series of the flame intensity, which represent measurements for 1 zone for different rates of change in the operating point of the object. Signals 1, 7, and 14 represent coal-pulverised fuel and signals 4, 23, and 29 represent fuel mixtures of 80% coal with 20% biomass.
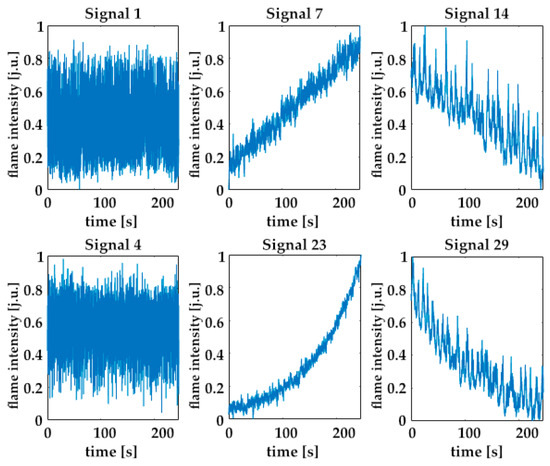
Figure 3.
Trends in flame intensity signals for 100% pulverised coal fuel and its mixture with biomass.
2.3. Pre-Processing of Measurement Data
Measurement data of flame intensity have already been used to perform flame state classification using fuzzy neural networks [28]. This article describes in detail the pre-processing of flame measurement signals, which included the limitation of the measurement data to the first flame monitoring zone due to the highest information content and sensitivity of this zone. Normalisation of the time series of flame intensity was carried out. Then, due to the large number of samples (more than 2 million), a downsampling operation was performed by an integer factor of n = 10, which reduces the sampling rate of the signal. Downsampling did not affect the distribution of the flame’s time series and did not cause the loss of important information included in the signal. The next step was to check and determine the trends in the flame’s time series. The measurement data were then transfered into a neural network model to solve the flame state classification problem.
2.4. Classification of Flame States Using Neural Networks
Recurrent neural networks (RNNs) are derived from unidirectional neural networks [38,39], and data from a sequence of input vectors are read by the network and modelled over time. A characteristic feature of RNNs is that it shows a high ability to process a time series. Multilayer preceptron (MLP) is one of the most popular neural networks that can be used in the classification and prediction of large learning sets. This neural network can be used for image processing, pattern recognition, and time series analysis. Therefore, recurrent neural networks can be used to analyse data from the combustion process.
Neural networks were used to solve the problem of classifying flame intensity measurement data in the form of a time series. Three models were created to classify flame states using MLP, LSTM cells, and ConvLSTM. Figure 4 shows the diagrams of the models used for a binary and multi-class classification of flame states.
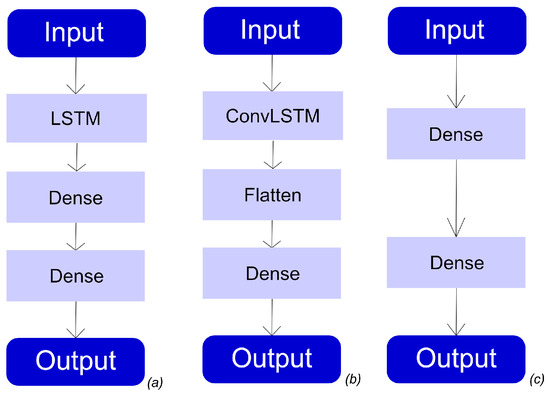
Figure 4.
Diagrams of the models used in the classification of flame states. (a) LSTM, (b) ConvLSTM, and (c) MLP.
The LSTM model used to classify flame states consisted of an input layer, a defined sequential LSTM model, and an output layer. Based on the literature, the optimal length of the time series sequence was found to be 200–400 samples [15,32], due to the fact that for the LSTM model the measurement data were divided and prepared in the form of [samples, time steps, features]. The obtained number of samples was 1410 (training set) and 600 (test set); the time step was equal to 200. The LSTM layer used had 200 units. The next element in the model structure was the first of the dense layers used, for which 150 neurons were specified. The second dense layer had a defined sigmoidal (binary classification) or softmax (multi-class classification) activation function. The following functions were chosen as the loss function: binary_crossentropy for the binary classification and categorical_crossentropy for the multi-class classification.
The ConvLSTM2D layer used in the model required transforming the input data to the dimension of [samples, time steps, rows, columns, features]. Accordingly, the flame signal samples were divided into subsequences. Columns were defined as the number of time steps of a given subsequence, and the number of rows was defined as 1. In addition, 128 filters were used, and the activation function is relu. A flatten layer was then applied to flatten the model output. The dense layer had a specific sigmoidal or softmax activation function and a binary_crossentropy or categorical_crossentropy loss function.
The sequential MLP model was created to classify flame states in the combustion process. This model consists of one dense hidden layer and an output layer used to predict flame classes. The input data were transformed using the reshape function to the dimension of [samples, features]. For the first dense layer, 150 neurons were identified. As in previous structures, the last dense layer used a sigmoidal or softmax activation function, as well as a binary_crossentropy or categorical_crossentrop loss function.
The above models were trained for 200 epochs. The models that were fitted to the training data were then tested on the test set.
After preprocessing the measurement data, the next step is to classify the states of the combustion process using the methods discussed above. The recognition of flame states is performed in two cases of both binary and multi-criteria classification. In the first case, trained neural network models make predictions on whether the analysed flame signal represents a stable or unstable state. For multi-criteria classification, the trained models make predictions in terms of 6 classes. Class 0 is considered to be a stable flame and classes 2–6 represent the different states of the flame, with 1—flame with increasing exponential trend; 2—flame with exponential decreasing trend; 3—flame with increasing linear trend; 4—flame with decreasing linear trend; and 5—state of fading flame. The measurement dataset used to train and test the neural networks totaled 402,000 observations. The data were divided into a training set of 282,000 samples (70.15%) and a test set of 120,000 samples (29.85%).
To evaluate the parameters of neural networks, the following parameters were chosen
- The true positive rate (TPR), calculated as
- Specificity, the true negative rate (TNR) is expressed by the following relationship:
- Accuracy, ACC, which is determined by the following formula:
- Precision (PRE) is calculated as
- The F1 score is expressed as follows:
3. Results
Selected neural networks were used to solve the problem of classifying measurement data of flame intensity, which are in the form of time series. Three models were created to classify flame states using multilayer perceptron (MLP), LSTM cells, and ConvLSTM.
Normalised confusion matrices were determined for each structure considered in terms of binary classification (Figure 5).
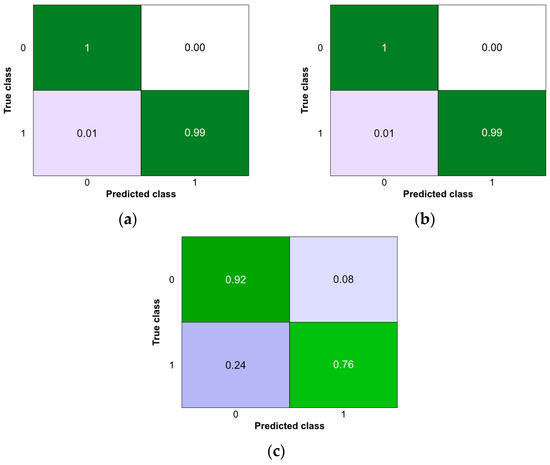
Figure 5.
Binary classification confusion matrices for models (a) ConvLSTM, (b) LSTM, and (c) MLP.
Based on the confusion matrices, the model parameters were determined to assess the quality of classification of stable and unstable states in the combustion of coal dust and biomass (Table 1).

Table 1.
Binary classification quality measures for ConvLSTM, LSTM, and MLP models.
Figure 6 shows the testing results of the ConvLSTM, LSTM, and MLP models for the binary classification of flame intensity signals.
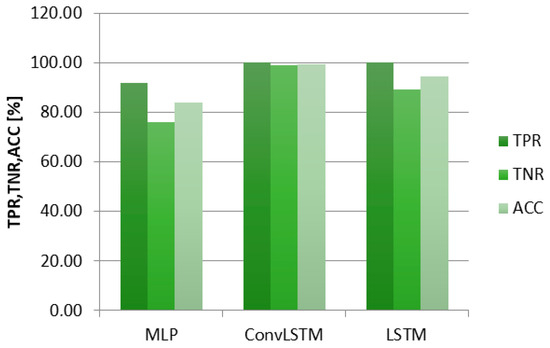
Figure 6.
Comparison of the neural network model testing results for binary flame state classification.
In the case of binary classification, the highest accuracy of selected RNN structures ACC = 99.64% was achieved for the ConvLSTM model. On the other hand, the worst result ACC = 83.85% was achieved for the MLP model. The highest recognition of true positive, TP, parameters was obtained for the ConvLSTM and LSTM models. Additionally, for multi-class classification, the normalised confusion matrices were created, which present the distribution of TPs, TNs, FPs, and FNs. The classification results for the used neural network structures are presented in Figure 7. The ConvLSTM model showed the highest number of true positive cases.
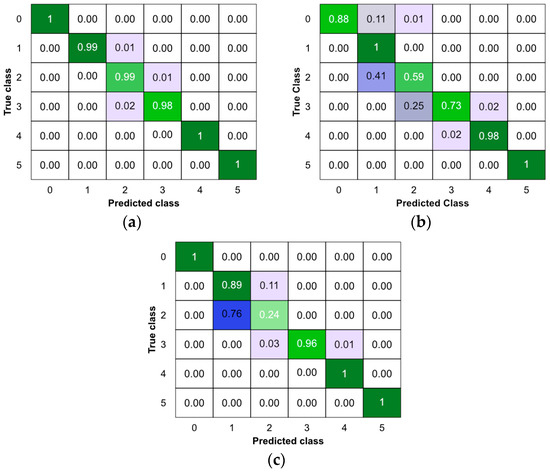
Figure 7.
Multi-class classification confusion matrices for models (a) ConvLSTM, (b) LSTM, and (c) MLP.
For the models solving the problem of the multi-class classification of flame states in the combustion process, the parameters given in Figure 8 and Table 2 were determined.
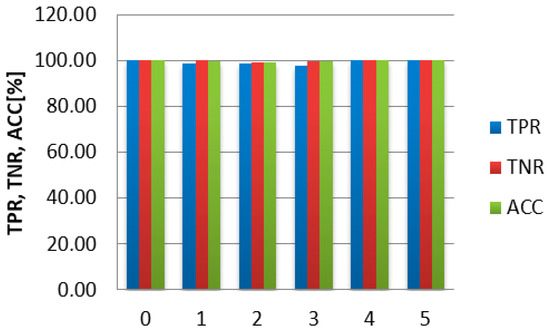
Figure 8.
Classification results of the ConvLSTM model for flame states 0–5.

Table 2.
Selected quality measures for binary classification models ConvLSTM, LSTM, and MLP.
In the case of the multi-class classification of flame states, the highest accuracy was achieved by the ConvLSTM model (ACC = 99.73%). For all models, the highest values of the sensitivity parameter were achieved for classes 2, 4, and 5. The lowest values of the sensitivity parameter were obtained for classes 2 and 3 for the LSTM and MLP models. For the precision parameters and F1 score, the highest values were obtained for the ConvLSTM model.
Figure 9 shows a comparison of the classification accuracy parameter of individual recursive models used to recognise flame states.
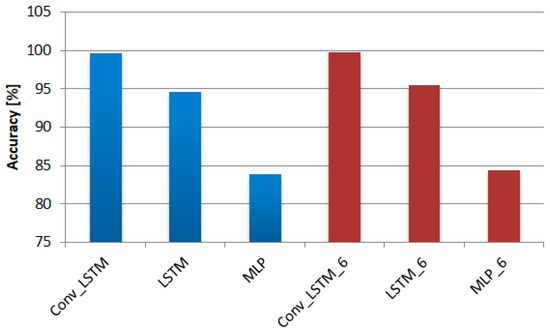
Figure 9.
Comparison of classification accuracy of RNN models.
Chosen fuzzy neural network structures were used for the binary and multi-class classification of flame states. A comparison of the classification accuracy of these models is shown in Figure 9. The highest classification accuracy value was obtained for the ConvLSTM model and was equal ACC = 99.64% for binary classification and ACC = 99.74% for multi-class recognition.
In addition, data of flame intensity measurements were used to carry out the classification of flame states using fuzzy neural networks [28]. Based on the analyses performed, the ANFIS model with grid partitioning (GP) showed the highest classification value ACC = 95.46% for binary classification and ACC = 79.08% for multi-class recognition.
Figure 10 shows a comparison of classification accuracy for all models used for flame state recognition. Models to which the extension _6 has been added indicate structures for multi-class classification for flame signal recognition for classes 0–5.
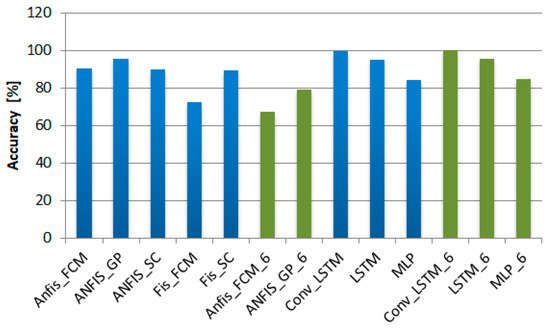
Figure 10.
Comparison of classification accuracy of models used for flame state classification.
Selected structures of fuzzy neural networks, recurrent neural networks, and MLP were used to solve the problem of recognising flame states in the combustion of coal dust and its mixture with biomass. Thirteen different classification models were created. Among them, eight models solved the problem of binary classification and five models were used for multi-class classification. The highest accuracy was achieved for the ConvLSTM model.
4. Discussion
The combustion process in power boilers is expected to have high efficiency, stable process parameters, and low operating costs. Actions taken to analyse fuel composition, flame processes, and combustion products are intended to meet technical, economic, and environmental requirements. When flame instability occurs in the combustion process, it is an indication that the process is not working properly and can lead to serious emergency conditions, i.e., the disappearance or retreat of the flame into the burner. In addition, the occurrence of flame instabilities causes a reduction in the efficiency of the combustion process. Previous papers by the authors show that flame instability results in reduced efficiency, which consequently causes the occurrence of underburned carbon particles and the appearance of undesirable gaseous combustion products such as CO.
In combustion processes where the flame is the source of information, changes in process parameters can be seen in the shortest time through changes in flame parameters. For the use of flames in diagnostics, it is necessary to use a fibre-optic monitoring system, the most important elements of which are a fibre-optic measuring probe and a signal-processing block. Measurement data acquired in this way are subjected to further analysis.
In this article, the classification of flame states was carried out using selected artificial neural network models. Thus, the highest recognition accuracy result of the flame state was obtained for the ConvLSTM recurrent neural network model for classifying stable and unstable flame states (99.64%) and six flame states (99.74%). These results were compared with a previously conducted classification using fuzzy neural networks [25], which achieved the highest accuracy of flame state recognition for the ANFIS_gridPartition model for recognising stable and unstable states (95.46%).
From a practical point of view, the use of fuzzy neural networks in combustion process diagnostics provides the opportunity to validate and modify the models used. These models have high flexibility and are interpretable. In addition, due to their numerous advantages, fuzzy neural networks can be an important component of the combustion process diagnostic system.
On the other hand, recurrent neural networks are perfect in solving problems of classification and the prediction of time series. The results show that by using the ConvLSTM model, it was possible to achieve binary and large-class classification with an accuracy of more than 99%. In addition, the approach can be applied to a real-time flame control system in the future and does not require changes in the design of the fibre-optic measurement system.
5. Conclusions
This article presents an improved approach to the recognition of flame states in the combustion process. To achieve this goal, selected artificial neural network models were used, and flame state classification was carried out for two types of pulverised coal fuel and its mixture with biomass. Multilayer perceptron (MLP), LSTM cell, and ConvLSTM network models were used to recognise the different states of the flame in the combustion process.
The combustion process taking place in power boilers is expected to have high efficiency, stable process parameters, and low operating costs. The measures taken in the analysis of fuel composition, flame processes, and combustion products are designed to meet technical and economic requirements. Changes in parameters in the combustion process can be observed in the shortest time based on changes in the parameters of the flame. For flame diagnostics during the combustion process, it is necessary to use a fibre-optic monitoring system, the most important elements of which are a fibre-optic measuring probe and a signal-processing block. Measurement data obtained in such a way are subjected to further analysis.
Recurrent neural networks were used to recognise the different states of the flame during combustion process. The test results were compared with previously published results of flame classification using fuzzy neural networks. The measurement data were divided into two sets, namely training (70%) and test (30%) ones.
The flame was classified due to two flame features (binary classification) and due to six flame features (multi-class classification). The trained models were tested on test sets. In the case of fuzzy neural network models, the highest classification accuracy of 95.46% was achieved for the ANFIS_gridPartition model for the recognition of stable and unstable states and 79.08% for the recognition of six features of the flame. Recurrent neural networks in the classification of time series of flame intensity achieved the highest classification accuracy equal 99.64% for the ConvLSTM model for the recognition of two flame states and 99.74% for six flame states. The developed algorithm recognises the occurrence of trends in flame signals, and the results of the obtained tests can be used in the diagnostics of the combustion process in industrial conditions. Fuzzy neural networks, despite their many advantages, such as flexibility, interpretability, and possibility of validation and modification, achieved lower classification accuracy values than the Conv LSTM model in recurrent neural networks.
The results of this study can be used in flame control systems in the combustion process. Based on the results obtained, an increase in the accuracy of flame change recognition was achieved. In addition, the proposed approach does not require changes in the design of the fibre-optic measurement system but can be implemented in the software processing of the measurement data. In the future, it is planned to develop a programme that recognises flame states, which can be used during real-time measurements. At the same time, the developed models could be used in diagnostic systems under industrial conditions, which could automatically send information about the flame state to the process operator.
Author Contributions
Conceptualization, W.W. and Ż.G.; methodology, W.W. and Ż.G.; software, Ż.G.; validation, W.W. and Ż.G.; formal analysis, W.W.; investigation, Ż.G.; resources, B.I. and B.Y.; data curation, Ż.G.; writing—original draft preparation, Ż.G.; writing—review and editing, W.W.; visualisation, B.I. and B.Y.; supervision, W.W.; project administration, B.I.; B.Y.; W.W. and Ż.G. All authors have read and agreed to the published version of the manuscript.
Funding
The research leading to these results has received funding from the commissioned task entitled “VIA CARPATIA Universities of Technology Network named after the President of the Republic of Poland, Lech Kaczyński,” under the special purpose grant from the Minister of Education and Science, contract no.MEiN/2022/DPI/2575, as part of the action “In the neighborhood—interuniversity research internships and study visits.”
Data Availability Statement
Data are contained within the article.
Conflicts of Interest
The authors declare no conflicts of interest.
Correction Statement
This article has been republished with a minor correction to the Funding statement. This change does not affect the scientific content of the article.
References
- Jarosiński, J. Techniki Czystego Spalania; Wydawnictwo Naukowo-Techniczne: Warszawa, Poland, 1996. [Google Scholar]
- Kordylewski, W. Spalanie i Paliwa; Oficyna Wydawnicza Politechniki Wrocławskiej: Wrocław, Poland, 2008. [Google Scholar]
- Nunes, L.J.R.; Matias, J.C.O.; Catalão, J.P.S. Biomass combustion systems: A review on the physical and chemical properties of the ashes. Renew. Sustain. Energy Rev. 2016, 53, 235–242. [Google Scholar] [CrossRef]
- Slavu, N.; Alabid, M.; Sandru, M.; Dinca, C. A techno-economic assessment of biomass combustion with CO2 capture technology. Comput. Aided Chem. Eng. 2023, 52, 3219–3225. [Google Scholar] [CrossRef]
- Sahu, S.G.; Chakraborty, N.; Sarkar, P. Coal-biomass co-combustion: An overview. Renew. Sustain. Energy Rev. 2024, 39, 575–586. [Google Scholar] [CrossRef]
- Variny, M.; Varga, A.; Rimár, M.; Janošovský, J.; Kizek, J.; Lukáč, L.; Jablonský, G.; Mierka, O. Advances in Biomass Co-Combustion with Fossil Fuels in the European Context: A Review. Processes 2021, 9, 100. [Google Scholar] [CrossRef]
- Rauch, R.; Hrbek, J.; Hofbauer, H. Biomass Gasification for Synthesis Gas Production and Applications of the Syngas. Wiley Interdiscip. Rev. Energy Environ. 2014, 3, 343–362. [Google Scholar] [CrossRef]
- Yang, H.; Chen, H. Ø Biomass gasification for synthetic liquid fuel production. In Woodhead Publishing Series in Energy, Gasification for Synthetic Fuel Production; Luque, R., Speight, J.G., Eds.; Woodhead Publishing: Sawston, CA, USA, 2015; pp. 241–275. [Google Scholar] [CrossRef]
- Wojcik, W.; Surtel, W.; Smolarz, A.; Kotyra, A.; Komada, P. Optical fiber system for combustion quality analysis in power boilers. Sel. Pap. Int. Conf. Optoelectron. Inf. Technol. 2001, 4425, 517. [Google Scholar] [CrossRef]
- Wójcik, W. Fiber–optic system for monitoring the combustion process. PAK 2007, 53, 24–28. [Google Scholar]
- Wójcik, W.; Kotyra, A.; Komada, P.; Golec, T. Światłowodowy układ do wykrywania rodzaju spalanego paliwa w przemysłowych kotłach energetycznych. In Proceedings of the VIII Konferencja Światłowody i Ich Zastosowanie, Białowieża, Poland, 23–23 January 2002; pp. 455–458, ISBN 83-88229-32-X. [Google Scholar]
- Wójcik, W. Optical fibre system for flame monitoring in energetic boilers. Technol. Appl. Light. Proc. SPIE 1997, 3189, 74–82. [Google Scholar]
- Korbicz, J.; Kościelny, J.M.; Kowalczuk, Z.; Cholewa, W. Diagnostyka procesów. Modele. Metody Sztucznej Inteligencji. Zastosowania; WNT: Warszawa, Poland, 2002. [Google Scholar]
- Smolarz, A.; Kotyra, A.; Wójcik, W.; Ballester, J. Advanced diagnostics of industrial pulverized coal burner using optical methods and artificial intelligence. Exp. Therm. Fluid Sci. 2012, 43, 82–89. [Google Scholar] [CrossRef]
- Sawicki, D. Ocena Procesu Spalania Węgla i Biomasy z Wykorzystaniem Analizy Obrazu; Wydawnictwo Politechniki Lubelskiej: Lublin, Poland, 2015. [Google Scholar]
- Anders, L.; Leckner, B.; Mattisson, T. A fluidized-bed combustion process with inherent CO2 separation; application of chemical-looping combustion. Chem. Eng. Sci. 2001, 56, 3101–3113. [Google Scholar]
- Hu, Y.; Naito, S.; Kobayashi, N.; Hasatani, M. CO2, NOx and SO2 emissions from the combustion of coal with high oxygen concentration gases. Fuel 2000, 79, 1925–1932. [Google Scholar] [CrossRef]
- Mollo, M.; Kolesnikov, A.; Makgato, S. Simultaneous reduction of NOx emission and SOx emission aided by improved efficiency of a Once-Through Benson Type Coal Boiler. Energy 2022, 248, 123551. [Google Scholar] [CrossRef]
- Kordylewski, W. Niskoemisyjne Techniki Spalania w Energetyce; Oficyna Wydawnicza Politechniki Wrocławskiej: Wrocław, Poland, 2000. [Google Scholar]
- Lefebvre, A.H. The Role of Fuel Preparation in Low-Emission Combustion. J. Eng. Gas Turbines Power 1995, 117, 617–654. [Google Scholar] [CrossRef]
- Hotra, O.; Kulyk, M.; Babak, V.; Kovtun, S.; Zgurovets, O.; Mroczka, J.; Kisała, P. Organisation of the Structure and Functioning of Self-Sufficient Distributed Power Generation. Energies 2024, 17, 27. [Google Scholar] [CrossRef]
- Zhou, L.; Song, Y.; Ji, W.; Wei, H. Machine learning for combustion. Energy AI 2022, 7, 100128. [Google Scholar] [CrossRef]
- Cellier, A.; Lapeyre, C.J.; Öztarlik, G.; Poinsot, T.; Schuller, T.; Selle, L. Detection of precursors of combustion instability using convolutional recurrent neural networks, Combust. Flame 2021, 233, 111558. [Google Scholar] [CrossRef]
- Grądz, Ż. Selected aspects in the analysis of the combustion process using wavelet transform. Inform. Autom. Pomiary Gospod. Ochr. Sr. 2020, 10, 52–55. [Google Scholar] [CrossRef]
- Gradz, Ż.; Wojcik, W.; Kotyra, A. Analysis of changes in flame luminosity for process diagnostics. In Proceedings of the 2019 International Interdisciplinary PhD Workshop (IIPhDW), Wismar, Germany, 15–17 May 2019; pp. 84–88. [Google Scholar] [CrossRef]
- Hotra, O.; Kovtun, S.; Dekusha, O.; Grądz, Ż. Prospects for the Application of Wavelet Analysis to the Results of Thermal Conductivity Express Control of Thermal Insulation Materials. Energies 2021, 14, 5223. [Google Scholar] [CrossRef]
- Hotra, O.; Kovtun, S.; Dekusha, O.; Grądz, Ż.; Babak, V.; Styczeń, J. Analysis of Low-Density Heat Flux Data by the Wavelet Method. Energies 2023, 16, 430. [Google Scholar] [CrossRef]
- Grądz, Ż.; Wójcik, W.; Gromaszek, K.; Kotyra, A.; Smailova, S.; Iskakova, A.; Yeraliyeva, B.; Kumargazhanova, S.; Imanbek, B. Application of Fuzzy Neural Networks in Combustion Process Diagnostics. Energies 2024, 17, 212. [Google Scholar] [CrossRef]
- Huang, X.; Wang, H. Modelling of Combustion Process Characteristics of a 600 MW Boiler by T-S Fuzzy Neural Networks. In Proceedings of the 2009 International Conference on Energy and Environment Technology, Guilin, China, 16–18 October 2009; pp. 737–740. [Google Scholar] [CrossRef]
- Yadav, V.; Casel, M.; Ghani, A. Physics-informed recurrent neural networks for linear and nonlinear flame dynamics. Proc. Combust. Inst. 2023, 39, 1597–1606. [Google Scholar] [CrossRef]
- Sujatha, K.; Bhavani, N.P.G.; Srividhya, V.; Karthikeyan, V.; Jayachitra, N. Soft sensor with shape descriptors for flame quality prediction based on LSTM regression. Real-Time Data Anal. Large Scale Sens. Data 2020, 6, 115–138. [Google Scholar] [CrossRef]
- Omiotek, Z.; Smolarz, A. Combustion process monitoring based on flame intensity time series. Proceedings of the Institution of Mechanical Engineers. Part I. J. Syst. Control Eng. 2020, 235, 809–822. [Google Scholar]
- ElSaid, A.E.R.; Benson, S.; Patwardhan, S.; Stadem, D.; Desell, T. Evolving recurrent neural networks for time series data prediction of coal plant parameters. Lect. Notes Comput. Sci. 2019, 11454, 488–503. [Google Scholar] [CrossRef]
- Lyu, Z.; Jia, X.; Yang, Y.; Hu, K.; Zhang, F.; Wang, G. A comprehensive investigation of LSTM–CNN deep learning model for fast detection of combustion instability. Fuel 2021, 303, 121300. [Google Scholar] [CrossRef]
- Jadidi, M.; Di Liddo, L.; Dworkin, S.B. A Long Short-Term Memory Neural Network for the Low-Cost Prediction of Soot Concentration in a Time-Dependent Flame. Energies 2021, 14, 1394. [Google Scholar] [CrossRef]
- Ren, J.; Wang, H.; Chen, G.; Luo, K.; Fan, J. Predictive models for flame evolution using machine learning: A priori assessment in turbulent flames without and with mean shear. Phys. Fluids 2021, 33, 55113. [Google Scholar] [CrossRef]
- Bhattacharya, C.; Ray, A. Thresholdless Classification of chaotic dynamics and combustion instability via probabilistic finite state automata. Mech. Syst. Signal Process. 2022, 164, 108213. [Google Scholar] [CrossRef]
- Geron, A. Uczenie maszynowe z użyciem Scikit-Learn i TensorFlow; Wydawnictwo Helion SA.: Gliwice, Poland, 2020. [Google Scholar]
- Patterson, J.; Gibson, A. Deep learning–Praktyczne Wprowadzenie; Wydawnictwo Helion SA.: Gliwice, Poland, 2018. [Google Scholar]
- Zadeh, L. Fuzzy sets. Inf. Control 1965, 8, 338–353. [Google Scholar] [CrossRef]
- Riza, L.; Bergmeir, C.; Herrera, F.; Benitez, J. FRBS: Fuzzy rule-based systems for classication and regression in r. J. Stat. Softw. 2015, 65, 1–30. [Google Scholar] [CrossRef]
- Quteishat, A.; Lim, C.P. A modified fuzzy min-max neural network with rule extraction and its application to fault detection and classification. Appl. Soft Comput. 2008, 8, 985–995. [Google Scholar] [CrossRef]
Disclaimer/Publisher’s Note: The statements, opinions and data contained in all publications are solely those of the individual author(s) and contributor(s) and not of MDPI and/or the editor(s). MDPI and/or the editor(s) disclaim responsibility for any injury to people or property resulting from any ideas, methods, instructions or products referred to in the content. |
© 2025 by the authors. Licensee MDPI, Basel, Switzerland. This article is an open access article distributed under the terms and conditions of the Creative Commons Attribution (CC BY) license (https://creativecommons.org/licenses/by/4.0/).