Article

Flexible Reconfiguration for Optimal Operation of Distribution Network Under Renewable Generation and Load Uncertainty

1
Department of Electrical Engineering, Faculty of Engineering, University of Zanjan, Zanjan 45371-38791, Iran
2
The Bradly Department of Electrical and Computer Engineering, Virginia Polytechnic Institute and State University, Blacksburg, VA 24061, USA
*
Author to whom correspondence should be addressed.
Energies 2025, 18(2), 266; https://doi.org/10.3390/en18020266
Submission received: 26 November 2024 / Revised: 2 January 2025 / Accepted: 5 January 2025 / Published: 9 January 2025
(This article belongs to the Section F: Electrical Engineering)

Abstract

:
The primary objective when operating a distribution network is to minimize operating costs while taking technical constraints into account. Minimizing the operational costs is difficult when there is a high penetration of renewable resources and variability of loads, which introduces uncertainty. In this paper, a flexible, dynamic reconfiguration model is developed that enables a distribution network to minimize operating costs on an hourly basis. The model fitness function is to minimize the system costs, including power loss, voltage deviation, purchased power from the upstream network, renewable generation, and switching costs. The uncertainty of the load and generation from renewable energies is planned to use their probability density functions via a scenario-based approach. The suggested optimization problem is solved using a metaheuristic approach based on the coati optimization algorithm (COA) due to the nonlinearity and non-convexity of the problem. To evaluate the performance of the presented approach, it is validated on the IEEE 33-bus radial system and TPC 83-bus real system. The simulation results show the impact of dynamic reconfiguration on reducing operation costs. It is found that dynamic reconfiguration is an efficient solution for reducing power losses and total energy drawn from the upstream network by increasing the number of switching operations.

1. Introduction

Modern distribution network (DN) operation is strongly impacted by the communication and automatic control infrastructures, high penetration of renewable resources, and installation of advanced metering and remote-controlled switches (RCSs) [1,2]. Renewable resources, such as solar and wind, depending on environmental conditions and their output power, are alternatives. These changes result in more dynamics and stochastic demeanors that happen in a DN, and the network structure needs to be modified from time to time so that the grid can react to fluctuations and improve the system operation. Hence, to answer the time-dependent loads and variable generation of renewable resources, network reconfiguration is proposed for system performance [3].
Reconfiguration is the process of altering the topology and some of its structural properties in the distribution network via deactivating the open/closed mechanism of sectionalizing and tie switches [4]. Commonly, reconfiguration in distribution networks is used for loss reduction, reliability, voltage profile improvement, and load balance [4]. In some cases, cyberattack issues can also result in reconfiguration [5]. Reconfiguration is divided into dynamic reconfiguration (DR) and static reconfiguration (SR), depending on the selected time period [6]. In SR, the optimal configuration is determined at a specific time with a fixed operation point for the studied network during the whole period, but DR considers the time-dependent essence of distribution networks, which makes it suitable for real-time applications. Both SR and DR problems are multi-objective and combinatorial optimization problems; also, they are nonlinear, with many electrical and topological constraints. The many components in a DN, along with their uncertainties, add to the complexity of the DR problem. Many algorithms are proposed for reconfiguration, subdivided into heuristic, meta-heuristic, and mathematical [3,6]. Meta-heuristic algorithms have been widely used in reconfiguration problems compared to the other two methods. These approaches involve intelligent search and iterative generation processes and are highly flexible. However, the investigation period is significant because the global optimum is not guaranteed [3,6].
DR formulates multi-period (or decomposition) problems [6,7,8] and complete dynamic problems [9,10,11,12,13,14,15,16]. The complete method considers all the periods, but the decomposition method selects certain multi-periods. The complete dynamic method has a large computational burden due to the number of variables and multiple periods; hence, decomposition models try to reduce the number of computations by classifying the periods of the complete model. Therefore, the response of this method depends on the number of the selected periods, which is an approximate model [17].
The multi-group flight slime mold algorithm (MFSMA) is used for multi-period DR [6]. In this paper, the daily load curve is divided into several categories based on the changes in the load amplitude; then, the optimal configuration of each period is determined. Decomposition DR is modeled based on load balance, power loss, and voltage stability, considering the time-varying load. In [7], the improved fuzzy C-means clustering (FCMC) algorithm divided the daily load curve into optimal reconfiguration time intervals. Decimal particle swarm optimization (PSO) is used to solve decomposition DR. A heuristic method based on switch opening and branch exchanging is introduced in [8], which is used for multi-hour stochastic reconfiguration under PV and load uncertainties. PV stochastic output was modeled via average irradiation. The proposed multi-hour method is a compromise between hourly and daily reconfiguration, which decreases the number of switches.
The valence of hourly reconfiguration with solar and wind energy resources is analyzed by [10]. This study develops a mathematical model to minimize total daily losses through hourly network reconfigurations. The model is implemented in GAMS and solved using MOSEK’s mixed-integer optimization method [10]. References [9,13] present multi-objective complete DR in automated distribution systems, which include the effect of reliability, switching operation, and power loss on the DR process. In [13], a mixed-integer linear programming (MILP) optimization model is developed for DR using the ‘‘path-switch-to-switch” modeling of distribution networks. The Lagrangian dual problem is developed to solve the determined MILP model. Reference [9] introduces a novel integrated optimization algorithm for the DR problem solution, using the grey wolf optimizer (GWO) and PSO. Time-varying load and electricity prices with the effect of dispatchable DG are considered for generalizing the proposed approach. Reference [11] introduces a hybrid algorithm to improve the exactitude and speed of dynamic reconfiguration. This algorithm employs parallel computation with variable population size. Reliability improvement and loss minimization are the objective functions of the proposed method.
Based on the deep learning algorithm, DR reduces the cost of switching operations and power loss of the distribution network [12]. The proposed method is based on the historical control data and the status of the real-time system. The main advantage of this method is determining the reconfiguration period according to the changes in operational costs, load demand, and DG output. In [14], a multi-objective sparrow search algorithm is presented for DR in an active distribution network, considering changes in load, electricity price, and DG output. This paper minimizes the power loss, voltage deviation, and cost. Reference [15] introduces a dynamic and static multi-objective reconfiguration scheme for a distribution system. A static plan is applied for a seasonal or yearly period, but for an hourly period, dynamic reconfiguration is performed. Although uncertainties are not involved, this paper considers a battery energy storage system and photovoltaic (PV) DG with optimum sizing during reconfiguration. The optimal radial structure is selected by maximization of loading and minimization of voltage deviation and losses. In [16], reconfiguration and consideration of three-phase load flow are used to improve three-phase balance in the presence of DG. This paper studies the time variation of load and DG without stochastic behaviors. A multi-objective molecular differential evolution algorithm is used to solve the problem. Reference [17] proposes a method for an automated distribution network (a network with remote and automated switches) for determining the best multi-period reconfiguration plan. Reconfiguration is represented as a weighted graph problem, and a backward dynamic programming algorithm is used to solve it. The graph nodes and arcs represent different static network configurations at different periods and costs of switching actions, respectively.
A risk-based DR method was proposed, which improves the hosting capacity of a distribution network under load and generation uncertainty [18]. In [19], DR, renewable energy sources, and energy storage systems were coordinated to reduce the operation cost of active distribution network. In [20], the impact of a mobile energy storage system and DR in a distribution system for active and reactive power coordination is studied. In this reference, a mixed-integer second-order cone programming (MISOCP) model is used for optimization. The proposed MISOCP model guarantees a globally optimal solution. In [21], dynamic network reconfiguration was used together with a traditional reactive power compensation device to improve the voltage quality. A novel graph reinforcement learning-based approach for the dynamic reconfiguration of active distribution networks with integrated renewable energy is proposed in [22]. An improved particle swarm optimization (IPSO) algorithm is presented to address the problem of dynamic distribution feeder reconfiguration in the presence of energy storage systems, distributed generation units, and solar photovoltaic arrays in [23]. The dynamic distribution network model with distributed power generation is established in [24], aiming to minimize active power loss and voltage deviation. The problem is solved using IMODBO combined with the K-means++ clustering algorithm.
Most of the reported works consider power loss and switching costs as the economic objective function for DR and neglect the uncertainty of renewable generation, upstream networks, and renewable resources’ power cost. Therefore, a more appropriate objective function is needed to investigate the optimal operation of the distribution network considering the time-varying generation and load. To solve this problem, this study proposes a method to select a set of open switches to consider the cost of total generation power (upstream network and renewable generation), power loss, voltage deviation, and switching. Table 1 compares the DR approaches for the current study. The main contributions are as follows:
(1)
Considering the effect of DR on the optimal operation of the distribution network.
(2)
Considering the hourly variations and stochastic characteristics of renewable generation (wind and solar) and load.
(3)
Improving the operating cost function of the distribution network by utilizing voltage deviation, renewable generation, and switching costs.
(4)
Using the coati optimization algorithm (COA) to solve the DR problem for optimal operation of the distribution network.
The rest of this research is as follows: Section 2 presents the proposed approach and Section 3 describes the solution methodology based on the Coati optimization algorithm. Section 4 provides the results of the simulation. Section 5 consists of the conclusions.

2. Proposed Approach

2.1. Scenario-Based Uncertainty Representation

Three uncertain quantities are considered as (1) wind-DG output power, (2) solar-DG output power, and (3) active and reactive power loads. The probabilistic models for the power generated by DG and the real and reactive power demand are described below.

2.1.1. Probabilistic Wind Power Modeling

Wind speed is not constant and has an intermittent nature. Hence, the power product of wind-DG is considered an indistinct variable. Thus, the Weibull probability distribution function is selected to explain the random movement of wind velocity during the predetermined period using historically recorded data. The Weibull distribution method regarding wind speed vt (m/s) at time “t” is presented in the following [25,26,27,28].
f ( v t ) = k t λ t v t λ t k t 1 e v t λ t k t
k t = σ v t μ v t 1.086 ,
λ t = μ v t γ ( 1 + 1 k t ) .
where kt and λt represent shape and scale variables at the time section “t”, correspondingly. γ describes the Gamma function and μvt and σvt represent the average and standard deviation (SD) of wind velocity at “t”.
Change in wind velocity is segregated into various distances called scenario distances to represent generated power from wind-DG in the role of the parameter with several states. The probability of every scenario and the average valence of wind velocity in the respective scenario is measured [27,29].
π w , t s c = v s , t , s c v e , t , s c f ( v t ) d v t ,
v w , t s c = 1 π w , t s c v s , t , s c v e , t , s c v t · f ( v t ) d v t ,
where πw,tsc, vw,tsc, vs,tsc, and ve,tsc represent probability, the average of wind velocity, and the starting and ending point of the interval in the scth scenario at the tth time section, respectively. Finally, wind-DG power output (Pvw,tsc) and mean wind velocity (vw,t) in scenario sc at the time “t” is measured [27]:
P v w , t s c = 0 v w , t > v o u t c u t 0 v w , t < v i n c u t v w , t v i n c u t v r v i n c u t P r W D G v i n c u t v w , t < v r P r W D G v r v w , t < v o u t c u t ,
where vincut, voutcut, vr, and PrWDG are the cut-in velocity, cut-off velocity, nominal velocity, and rated power of wind-DG on bus n, respectively.

2.1.2. Probabilistic Solar Power Modeling

Beta PDF models stochastic behavior for solar radiation. The distribution of radiation st (kW/m2) at time “t” is given by the following [25,30]:
f ( s t ) = γ α t + β t γ α t γ β t s α t 1 ( 1 s t ) β t 1 ,
β t = ( 1 μ s t ) μ s t ( 1 μ s t ) σ s t 2 1 ,
α t = μ s t β t ( 1 μ s t ) .
Beta PDF is a continuous parameter, which is segregated into several states to measure the resulting power in PV DG. The probability of solar radiation for each state is measured as follows:
π s , t s c = s s , t , s c s e , t , s c f ( s t ) d s t ,
s a , t s c = 1 π s , t s c s s , t , s c s e , t , s c s t . f ( s t ) d s t ,
where πs,tsc, sa,tsc, ss,t,sc, and se,t,sc represent probability, average solar irradiance, the starting and ending spot of the distance in the scth scenario at time “t”, respectively. Therefore, the resulting power of the PV array for scenario sc at the tth time segment (PSa, tSc), considering the ambient temperature, solar irradiance, and the characteristics of the module itself, are expressed as follows [30].
T C , t s c = T A , t + s a , t s c ( N O T 20 0.8 ) ,
I t s c = s a , t s c I S C + K I ( T C , t s c 25 ) ,
V t s c = V O C K V T C , t s c ,
P s a , t s c = N P V F F V t s c I t s c ,
F F = V M P P I M P P V O C I S C .
In this representation, TC,tsc and TA,t are cell and ambient temperatures (°C) at the tth time and scth states; KI and KV represent current and voltage temperature coefficients (A/°C and V/°C); NOT represents the rated working temperature of the cell (°C); NPV represents the total number of PV modules; FF represents the fill factor; VOC and ISC denote open-circuit voltage (V) and short-circuit current (A); and VMPP and IMPP denote voltage (V) and current (A) at the highest power point, correspondingly.

2.1.3. Probabilistic Load Modeling

The load uncertainty in the power system is represented with a normal (Gaussian) PDF [25]. The PDF of the load is separated into infinite intervals like wind velocity and solar irradiance within the scenario-based method. For each of them at time “t”, the probability (πln,tsc) and mean demand (lna,tsc) in the bus “n” are calculated as follows [31]:
π l n , t s c = l n , t , s c min l n , t , s c max 1 σ l n t 2 π e ( l n , t μ l n t ) 2 2 ( σ l n t ) 2 d l n , t ,
l n a , t s c = 1 π l n , t s c l n , t , s c min l n , t , s c m a c l n , t σ l n t 2 π e ( l n , t μ l n t ) 2 2 ( σ l n t ) 2 d l n , t ,
where ln,t is the real or reactive power load at the nth bus, while σlnt and μlnt are the standard deviations and mean of ln,t, respectively; ln,t,scmin and ln,t,scmax are the starting and ending points of the interval in the scth load scenario. Moreover, index t shows the distinct time portion.
After probabilistic modeling and producing an appropriate amount of load, wind-DG, and PV output power uncertainty scenarios, the scenarios generate the combined load–wind–PV model, giving an independent relationship among them and multiplying probabilities in each scenario. The probability of the scth combination load–wind–PV scenario at time t (πC,tsc) is obtained as follows [30,32]:
π C , t s c = π l n , t s c × π w , t s c × π s , t s c

2.2. Objective Function

This research focuses on stochastic dynamic reconfiguration to minimize the operation cost of the distribution network at a 24 h time horizon. This objective includes the cost of power losses (Closs), voltage deviation (CVD), switching operations (CSW), energy absorbed from the upstream network (Cupn), generated energy by PV-DG (CPV), and wind-DG (Cwind). The objective function is formulated as follows:
Cos t ( X ) = t = 1 24 C t l o s s + C t V D + C t u p n + C t P V + C t W i n d + C t S W ,
X = [ S W 1 S W 2 S W N S W ] ,
S W j = [ S W j 1 S W j 2 S W j 24 ] j 1 , 2 , , N S w } ,
C t l o s s = λ t l o s s s c = 1 N t s c π C , t s c j = 1 N b k j r j l j , t , s c ,
C t V D = λ t V D s c = 1 N t s c π C , t s c i = 1 N B V r a t e d V i , t , s c 2 ,
C t u p s = λ t u p s s c = 1 N t s c π C , t s c i = 1 N u p s P t , i , s c u p s ,
C t P V = λ t P V s c = 1 N t s c π C , t s c i = 1 N P V P t , i , s c P V ,
C t W i n d = λ t W i n d s c = 1 N t s c π C , t s c i = 1 N W i n d P t , i , s c W i n d ,
C t S W = λ t S W j = 1 N b S W j , ( t 1 ) i n i S W j , t r e c .
where X represents the decision variable vector and SWj is the jth set of open switches. λlosst, λupst, λPVt, and λWindt are the electricity loss price, upstream network, PV-DG, and wind-DG at time t, respectively. λVDt is the penalty factor of voltage deviation and λSWt is the switching operation cost at time t. In Equation (23), Nsct represents the general number of scenarios at time t; Nb denotes the number of branches; rj and lj,t,sc denote the resistance and squared current magnitude of branch j at time t in the scth scenario, correspondingly; and kj is the topographical condition of the branches. kj = 1 if branch j is close and kj = 0 if branch j is open. In (24), NB represents the general number of buses, Vrated represents the rated voltage, and Vi,t,sc denotes the real voltage in bus i at time t in the scth scenario. In (25)–(27), Pupst,i,sc, PPVt,i,sc, and PWindt,i,sc are the energy absorbed from ith upstream network, ith PV-DG, and ith wind-DG, respectively. Nups, NPV, and NWind are the upstream networks, PV-DG, and wind-DG, respectively.
In (28), SWinij,(t−1) and SWrecj,t are the statuses of the jth RCS in the initial and reconfiguration structure between t and (t − 1). In both cases, SWj = 1 if RCS j is closed and kj = 0 if RCS j is open.

2.3. Constraints

The objective functions (23)–(27) are restrained by the next constraints.

2.3.1. Power Balances

P t , i , s c V t , i , s c j = 1 N B V t , j , s c Y i j cos ( δ t , i , s c δ t , j , s c θ i j ) = 0 ,
Q t , i s c V t , i , s c j = 1 N B V t , j , s c Y i j sin ( δ t , i , s c δ t , j , s c θ i j ) = 0 ,
where Pt,i,sc and Qt,i,sc represent the active and reactive power constituents in the ith bus at time t in the scth scenario. δt,i,sc and Vt,i,sc represent the angle and magnitude for voltage in the ith bus at time t in the scth scenario, correspondingly. Yij and θij denote the magnitude and angle for branch admittance between the ith and jth buses, correspondingly.

2.3.2. Bus Voltage

The voltage of the network should be in the permitted range at all times.
V i ( min ) V t , i V i ( max ) i = 1 , 2 , , N B
Vi(min) and Vi(max) represent the minimum and maximum voltage ranges of the ith bus at time t, respectively.

2.3.3. Distribution Feeder VA Constraint

L M V A , t , j L M V A , j M a x j = 1 , 2 , , N b
LMVA,t,j and LMVA,jMax are the actual and maximum power flowing over the jth line at time t, respectively.

2.3.4. Output Power of DGs

0 P D G , t , i P D G , t , i max ,
0 Q D G , t , i Q D G , t , i max ,
PmaxDG,t,i and QmaxDG,t,i denote the maximum active and reactive power in the ith DG at time t, respectively.

2.3.5. Radial Structure of the Distribution Network

The network topology should be radial when the reconfiguration is performed.
N b , t = N B t N s u b ,
Nsub and NBt are the number of substations and buses, respectively. Also, Nb,t is the number of branches with close switches at the tth time interval.

2.3.6. Number of Switching

The total number of switching operations (NSWRCSj) for each RCS must not violate the maximum number of possible switching operations (NSWmax) in a 24 h time horizon.
N R C S j S W = t = 1 24 S W j , t S W j , t 1
N R C S j S W N max S W

3. Solution Methodology

Evolutionary algorithms are commonly used for optimization problems; hence, in this paper, a new algorithm called coati optimization [33], was used for operation cost minimization based on stochastic DR.

3.1. Coati Optimization Algorithm (COA)

The COA tries to represent the natural habits of coatis [33]. These behaviors are a hunting strategy for iguanas and an escape strategy from predators, and are simulated as follows.

3.1.1. Initialization

Create a random position for every member of the population using the following equation:
X i : x i j = L B j + r ( U B j L B j ) i = 1 , 2 , , N j = 1 , 2 , , m
where UBj and LBj are the upper band and lower band of the jth decision variable, respectively.

3.1.2. Hunting Strategy for Iguanas (Position Updating Phase 1)

Modeling the hunting behavior of the coati involves dividing the population (N) into two equal groups. The first group climbs to the top of the tree to move the iguana, and the second group waits on the ground to hunt the iguana. The mathematical model of the first category is expressed as follows [33]:
X i P 1 : x i j P 1 = x i j + r ( iguana j I x i j ) i = 1 , 2 , , N 2 , j = 1 , 2 , , m
When the iguana drops to the ground, its position is randomly determined. Then, the second group of coatis starts searching based on this position, as described in the following [33]:
I g u a n a g r o u n d : I g j g r o u n d = L B j + r ( U B j L B j )
X i P 1 : x i j P 1 = x i j + r ( I g j g r o u n d I x i j ) , f I g j g r o u n d < f i x i j + r ( x i j I g j g r o u n d ) , e l s e i = N 2 + 1 , N 2 + 2 , , N j = 1 , 2 , , m
After the new positions are determined, the process of updating the positions is carried out as follows [33]:
X i = X i P 1 , f i P 1 < f i X i , e l s e
where XP1i, xP1i,j, and fP1i are the new locations for the ith coati, its jth dimension, and its objective function value, respectively. Iguana shows the situation of the finest member of the coati group. I is an integer and is randomly chosen between 1 and 2, and r is a random real digit in the interval [0, 1]. IgGround, IgGroundj, and FIgGroundj are the randomly generated positions for the on-the-ground iguana, its jth dimension, and its fitness function value, respectively [33].

3.1.3. Escape Strategy from Predators (Position Updating Phase 2)

This step simulates the behavior of the coati when encountering a predator. When a hunter assails a coati, the beast changes its place. With this movement, the coati is placed in a safe position and close to the previous position. This feature shows the ability of the algorithm to perform local searches. This step is expressed with the following mathematical relationship [33]:
L B j l o c a l = L B j I t e r , U B j l o c a l = U B j I t e r I t e r = 1 , 2 , , I t e r max
X i P 2 : x i j P 2 = x i j + ( 1 2 r ) ( L B j l o c a l + r ( U B j l o c a l L B j l o c a l ) ) i = 1 , 2 , , N j = 1 , 2 , , m
X i = X i P 2 , f i P 2 < f i X i , e l s e
where XP2i, xP2i,j, and fP2i are the new positions for the ith coati, its jth dimension, and its objective function value in the second updating phase, respectively. Iter is the present iteration and Itermax is the maximum number of iterations.

3.1.4. Repetition Process of COA

Following the completion of the first and second phases of updating the coati’s position in the search space, the process continues until the last iteration of the algorithm using Equations (39)–(45) [33].
Figure 1 shows the entire process of the COA as pseudo code.

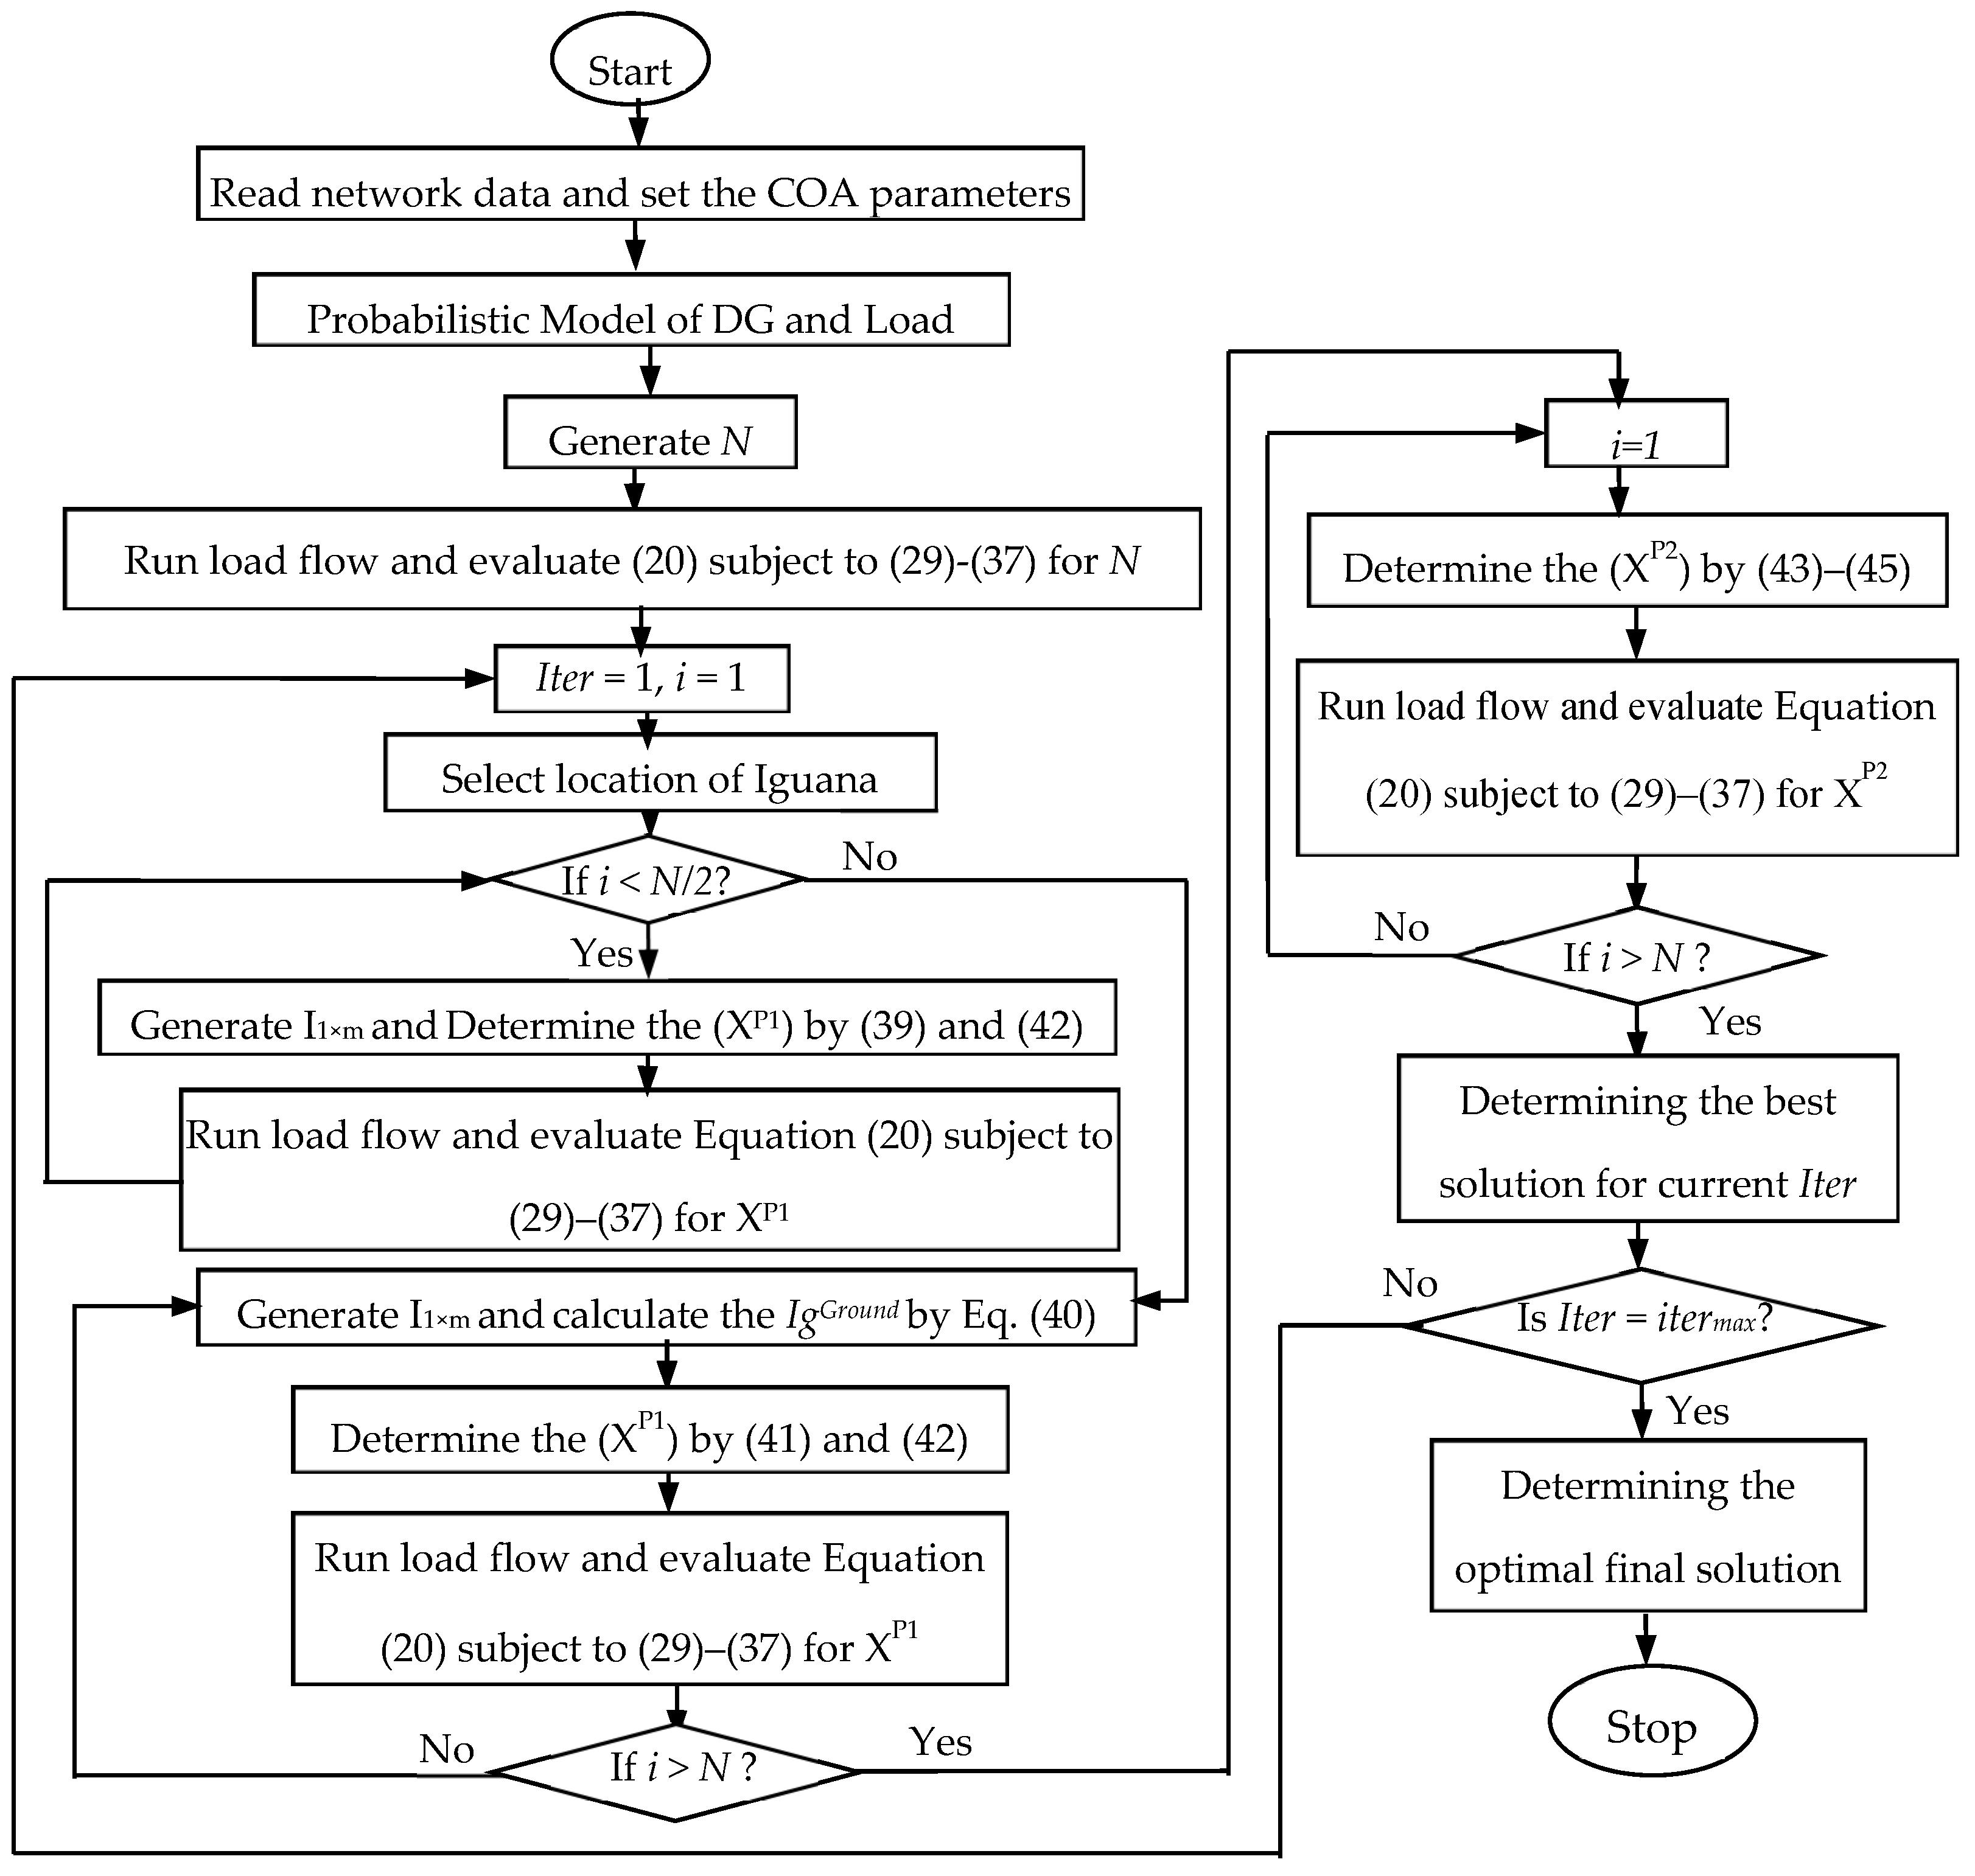
3.2. Implementation of the COA for DR

The implementation of the COA for DR is shown in Figure 2. The proposed method is started by reading the network data and setting the COA parameters. Then, the probabilistic model of DG and load in a 24 h period are created using wind speed and solar irradiance data. Afterward, a random population of N solutions is generated for 24 h as decision variables. For each individual from N, the COA changes the network configuration according to SWj and updates the system’s bus data using a probabilistic model of DG and load. In this paper, load flow is used and integrated into the solution process to calculate branch currents, bus voltage, and cost function evaluation. In the next step, the COA operators (hunting and escape from predators) are applied to all individuals, and their new position is determined. The fitness of individuals is evaluated, and constraints are verified; noncompliance results in penalties and exclusion. This iterative process continues until a predefined maximum iteration (itermax) count is reached. The optimal solution, representing the lowest operational cost for the DR problem, is derived from the best-performing SWj in the final time segment.

4. Case Study and Discussion

In this section, the DR for optimal operation in the IEEE 33-bus test system is simulated using the presented approach. Our approach is evaluated using an Intel Core i3 CPU with 1.9 GHz and 4 GB of RAM by MATLAB R2016b software.

4.1. Case Study Network Overview (IEEE 33-Bus)

The test network is a modified IEEE 33-bus system adopted from [10,34], and is shown in Figure 3. The system under consideration is a 12.66 kV hypothetical network with a total load capacity of 3.525 MW and 2.3 MVar. It comprises 33 buses and 37 branches, where branches S1–S32 represent sectional switches, and S33–S37 correspond to tie-line switches [35]. Power flow calculations are performed per unit, with Sbase = 10 MVA and Vbase = 12.66 kV.
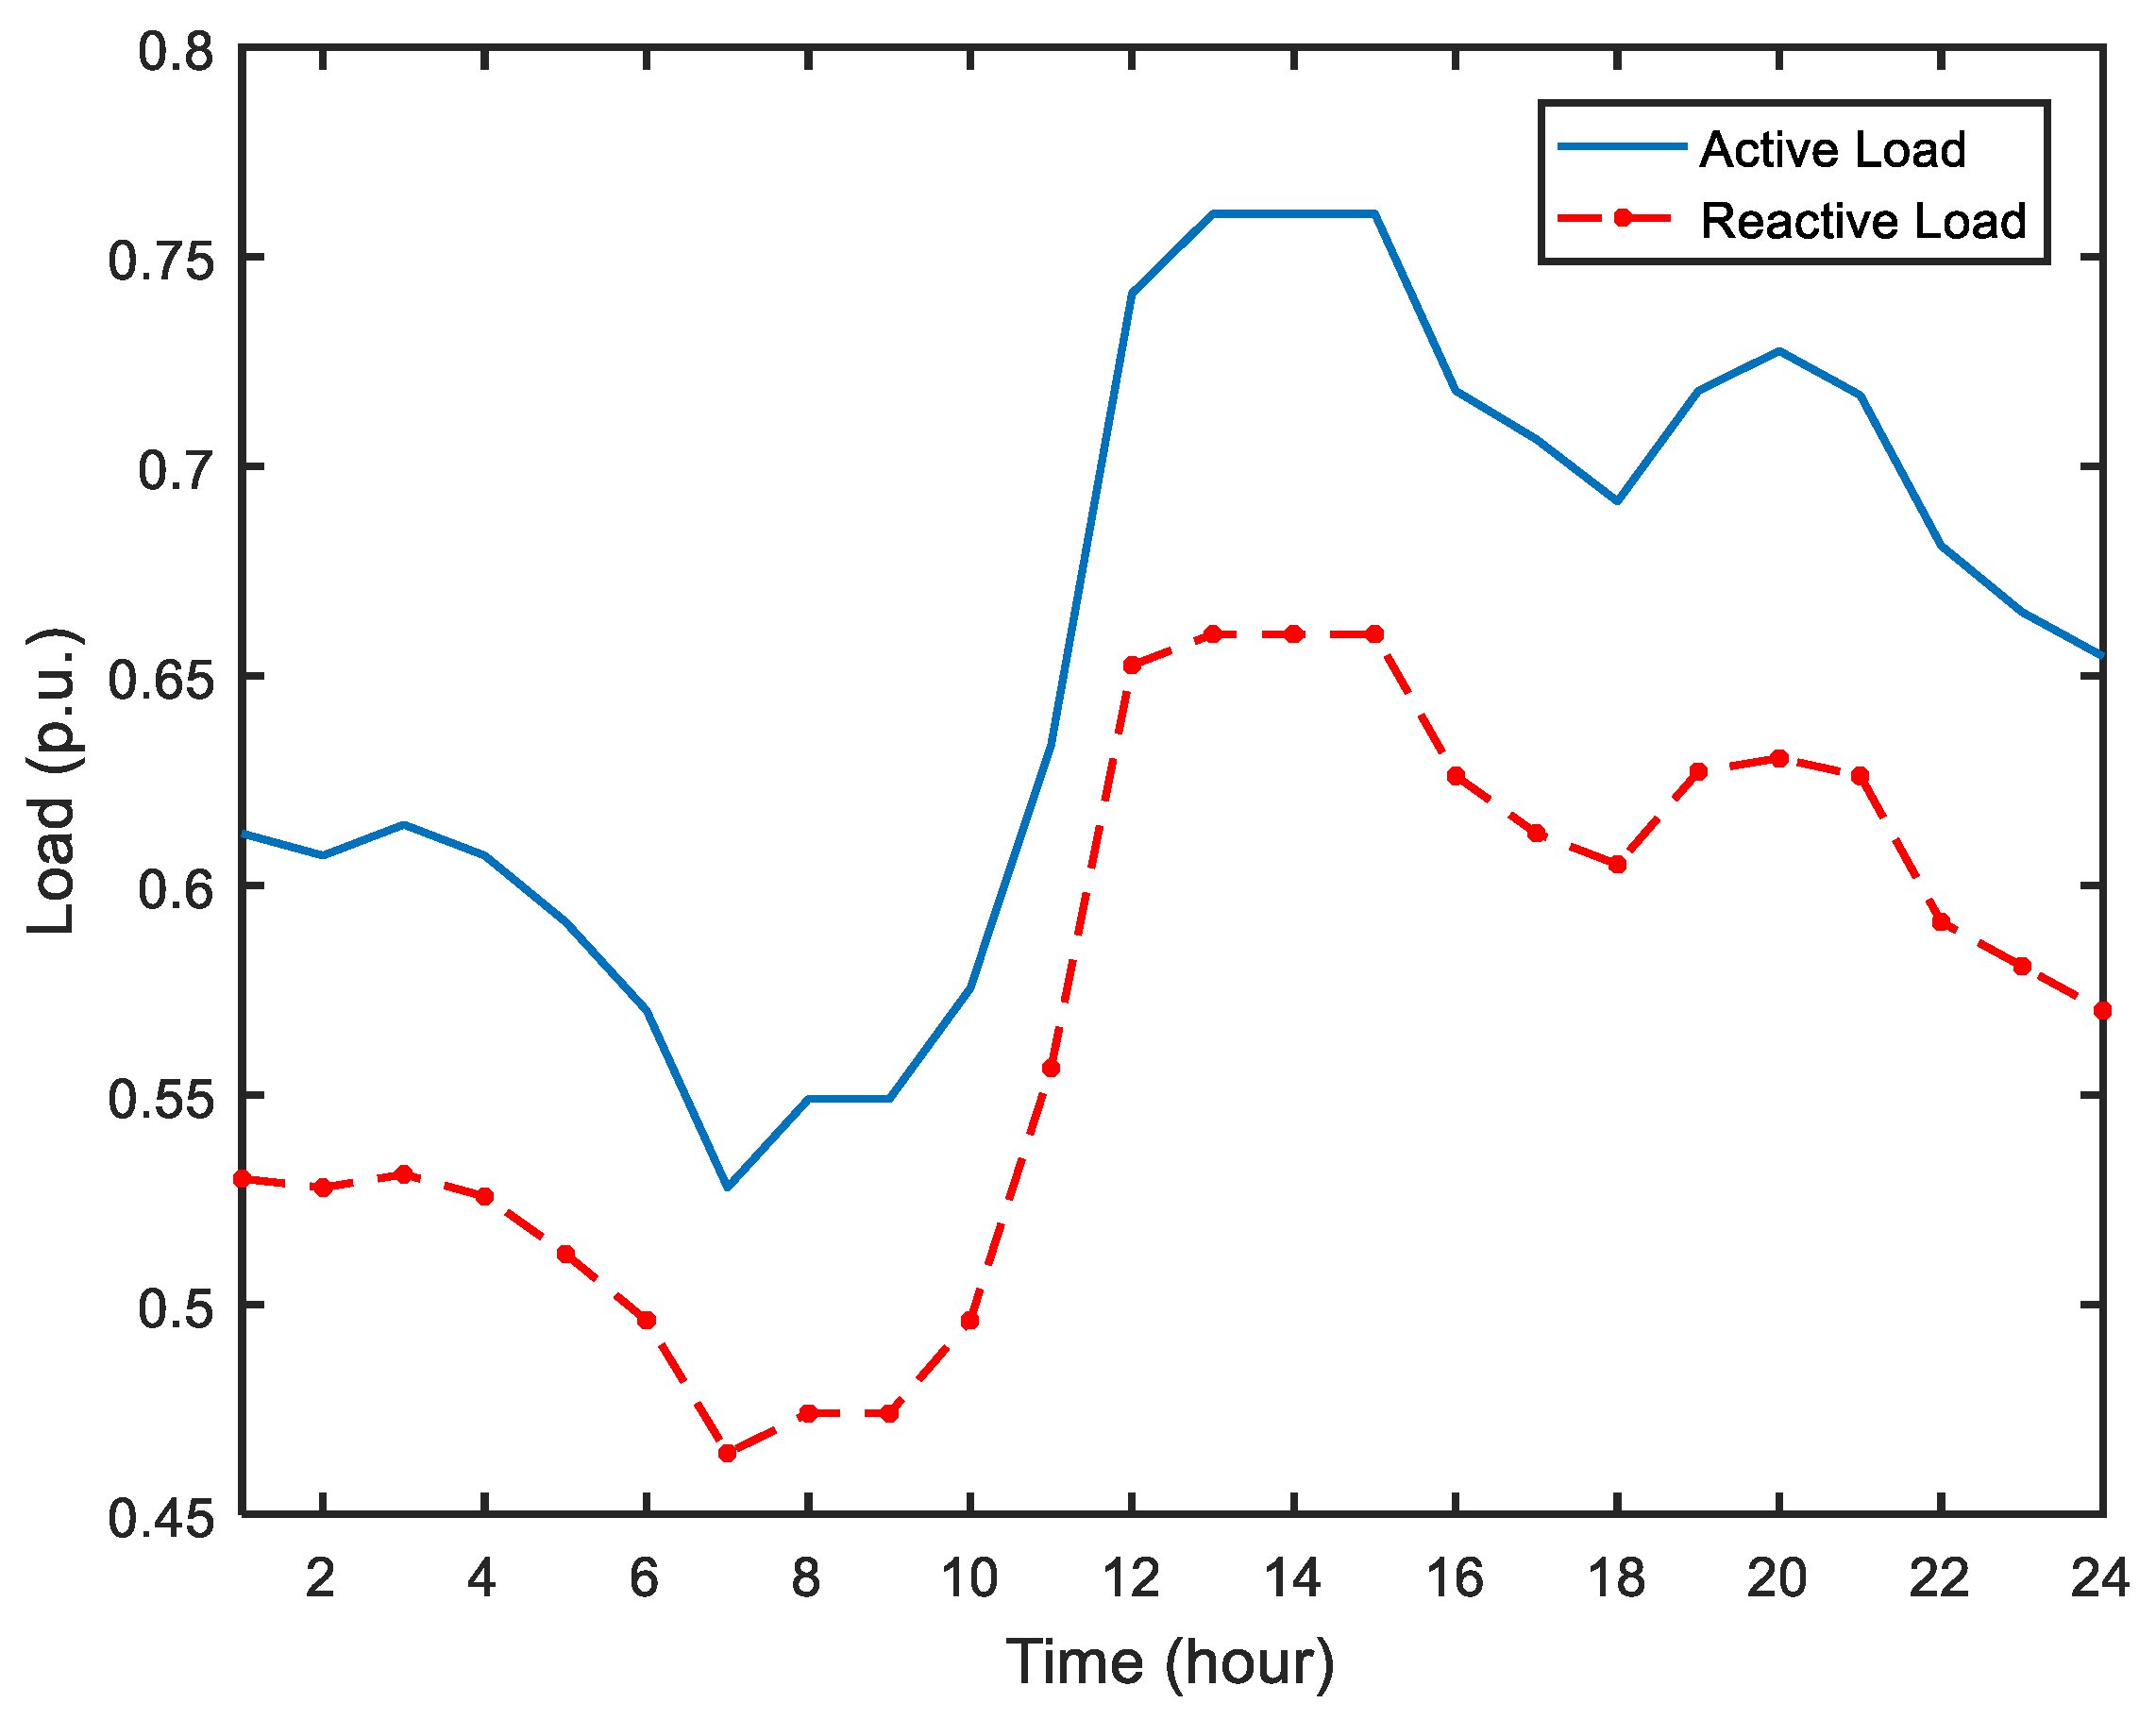
The renewable generation size and location data are available in Table 2 [10]. Other data, such as wind-DG and PV module parameters, are taken from [25]. Also, the mean and standard deviation of wind speed and solar irradiance for modeling their uncertainties are shown in Figure 4 [36]. The network 24 h load profile used in this paper is illustrated in Figure 5.
The load is supposed to be normally dispersed about its average, with a coefficient of variance of 2%. At each time segment, the number of scenarios for load, wind-DG, and PV uncertainty are 3, 5, and 3, respectively. In this paper, distributed generations are administered within the state of a fixed power factor (pf) (with a lagging pf of 0.85 for wind-DG and unit pf for PV). Smaller and larger limits of the voltage intensity of the nodes are determined as follows: Vmin = 0.95 p.u. and Vmax = 1.05 p.u. The energy price of the upstream network, wind-DGs, and PVs is shown in Figure 6. It is assumed that the cost of each switching action (λSW) is USD 1 [2]. The maximum number of possible switching operations (NSWmax) in a 24 h time horizon is four [2]. Also, the price of power losses (λloss) and voltage deviation (λVD) is 400 USD/MWh and 0.72 USD/p.u., respectively [37].

4.2. Discussion (IEEE 33-Bus)

The performance of the proposed COA for the reconfiguration problem was evaluated by comparing the results of the algorithm with other references, as shown in Table 3. In this table, reconfiguration is performed for power loss reduction in nominal loading conditions and without DG. The analysis in Table 3 indicates that the optimal configuration achieved by the COA is similar to the results attained in other references.
In order to analyze the DR effect on the optimal operation of the distribution network, four different cases are studied, as follows:
Case 1: The initial configuration; open switches include S33, S34, S35, S36 and S37.
Case 2: Optimal operation with static reconfiguration for maximum load and without renewable generation.
Case 3: Optimal operation with static reconfiguration for maximum load along with renewable generation with nominal power.
Case 4: Optimal operation with DR considering load and renewable generation variations under their uncertainty (proposed method).
Table 4 shows the final operation scheme for all cases examined. This table shows the open switches, the total operating costs, and the partial terms of Equation (20) for all cases. Comparing all cases indicates that the total operation cost without reconfiguration is relatively high (USD 2799.20). In Case 2, the open switches are S7, S9, S14, S32, and S37, and the operating cost is USD 2635.45. In Case 3, the open switches are S7, S10, S14, S30, and S37, and the operating cost is USD 2649.57. In Case 4, the network has two optimal configurations. The first configuration corresponds to the period 1–14 h and is achieved by opening switches S7, S10, S14, S30, and S37. The second configuration corresponds to the period 15–24 h. In this period, switches S7, S9, S14, S32, and S37 are open. In Case 4, the total operating costs amount to USD 2626.39.
As expected, the total cost in Case 4 is better than in the static reconfiguration (Case 2 and Case 3). However, the total cost for the number of switches (USD 10) is higher than in the static reconfiguration (USD 8). The results show that the lowest costs for losses and energy from the upstream grid belong to Case 4. Furthermore, the costs for energy generation from renewable generation are the same in all four cases.
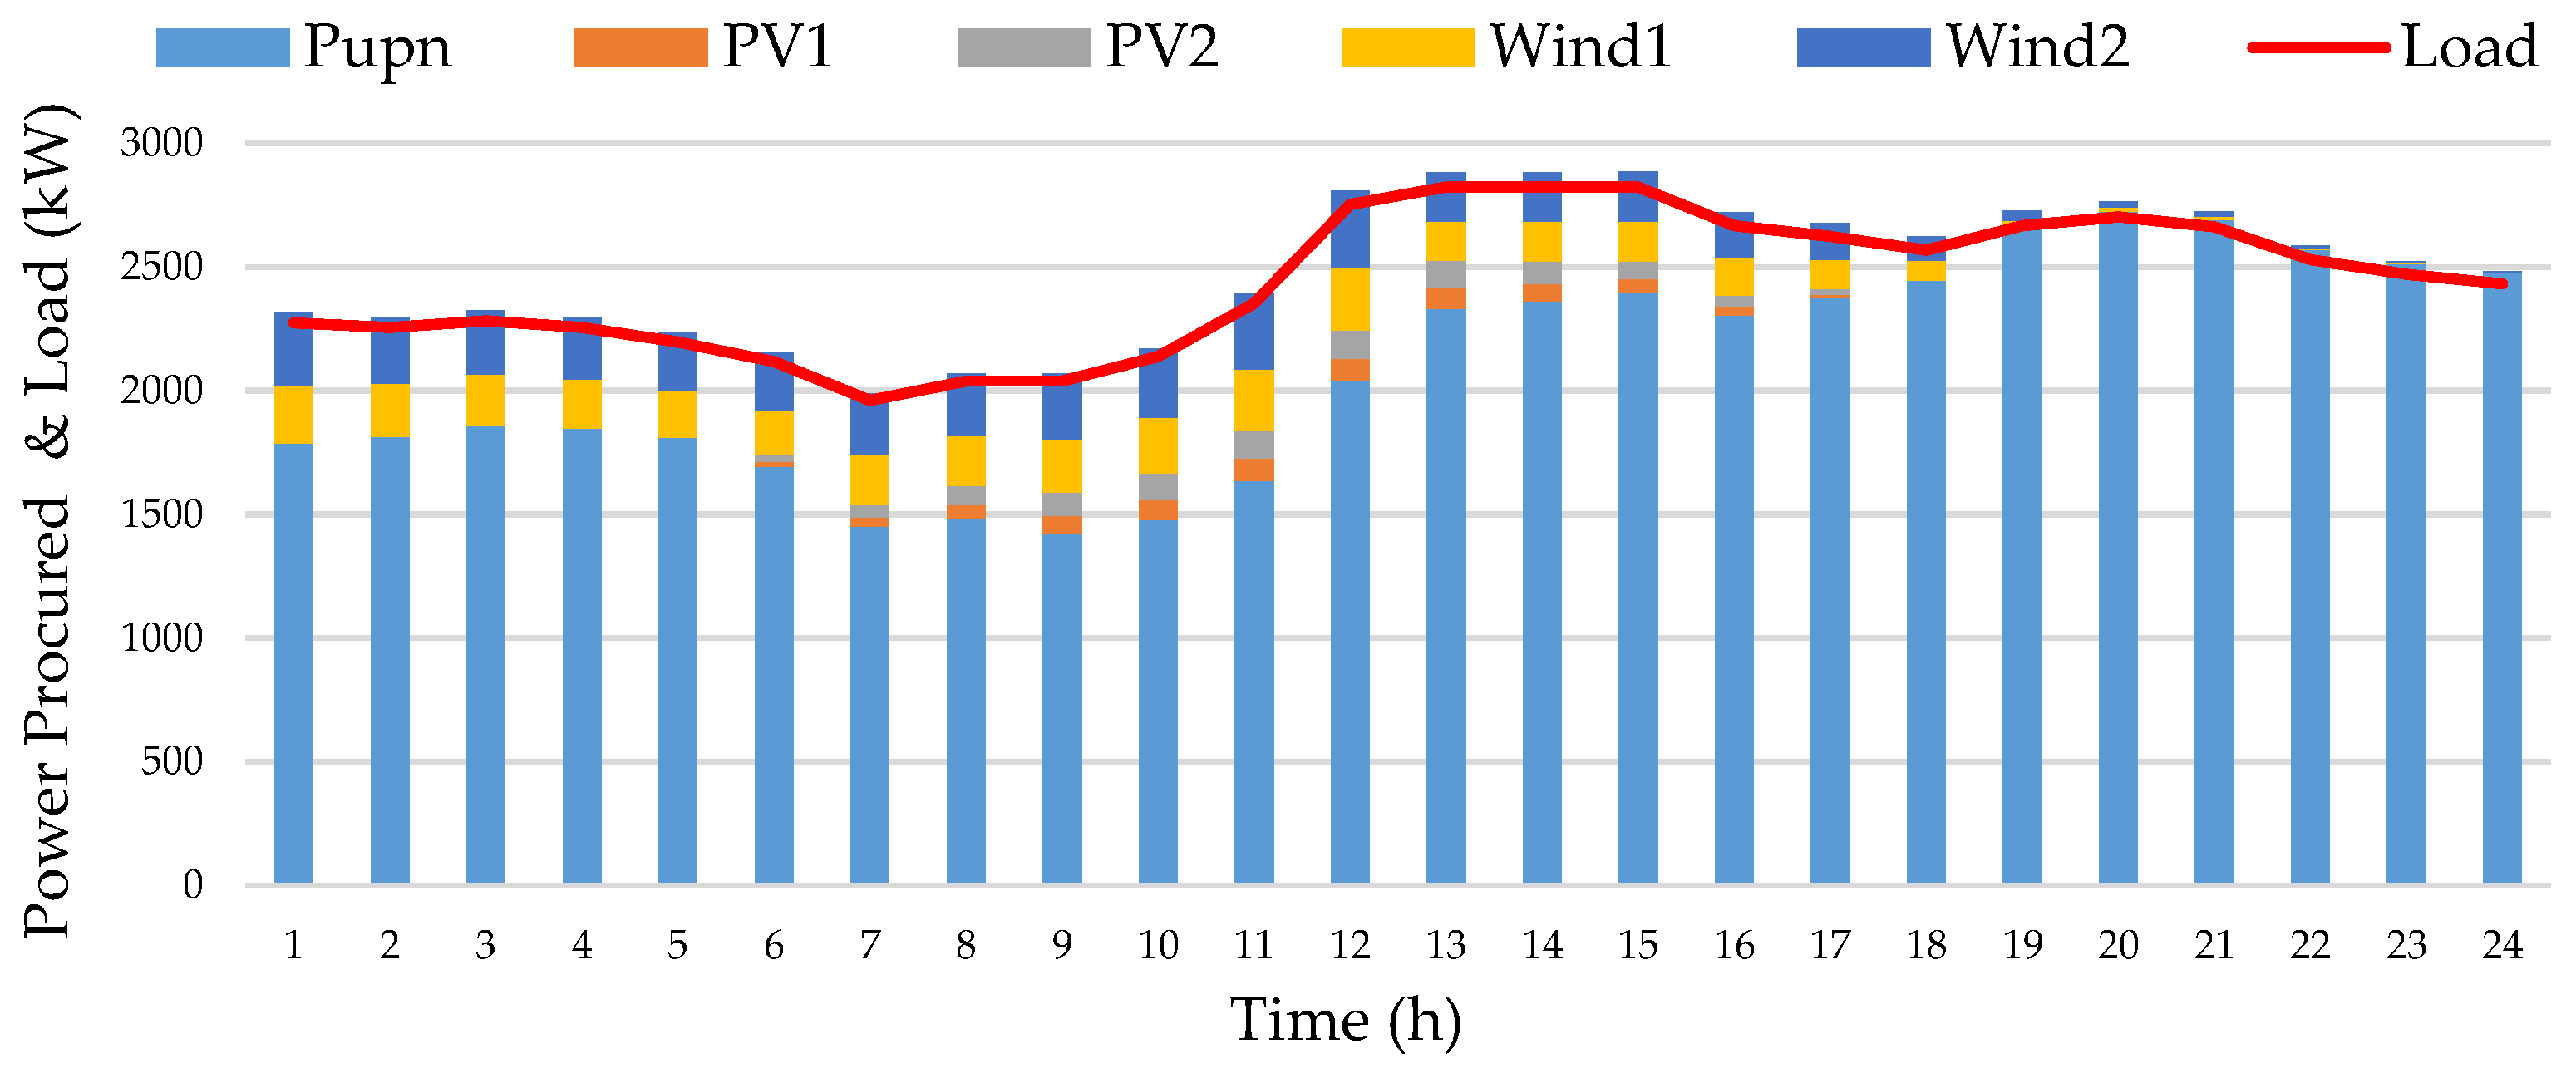
Table 5 shows the optimal hourly electricity purchase from the upstream grid and renewable generation. The results for all study cases show that the maximum power purchase from the upstream network is reached at 20:00. The output power of the wind turbines reaches its peak at 12:00. This value is 63% of the nominal output. PVs reach the peak of output power in hour 11, which is 26% of the nominal output.
Table 6 shows the costs for the purchased electricity. It can be seen that the minimum of Cupn is USD 1857.53 and is reached by DR in Case 4. Figure 7 presents the optimal power procured from the upstream network and renewable generation with load profile for Case 4.
The total power procured from the upstream network during 24 h is shown in Figure 8. Dynamic reconfiguration reduces the total power consumption.
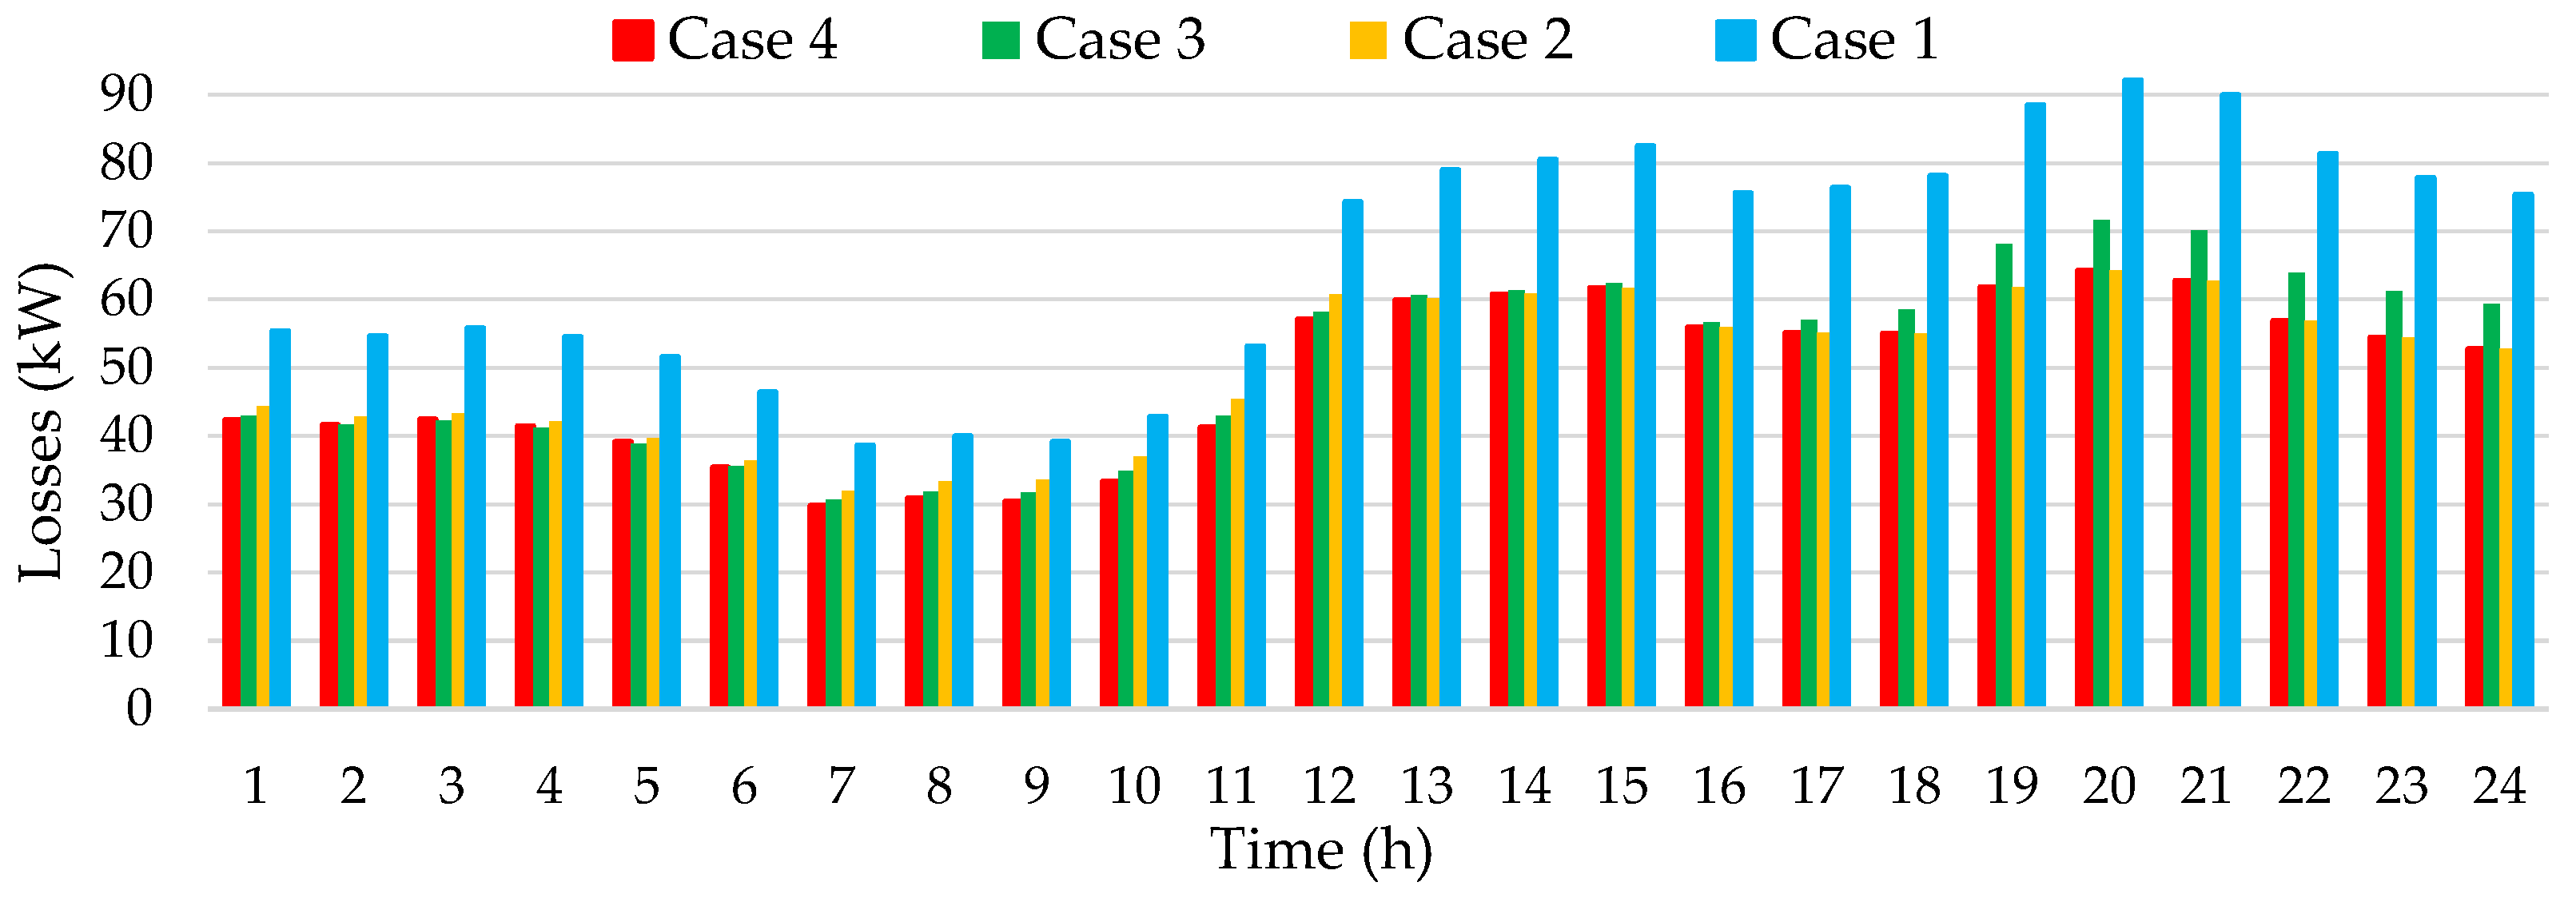
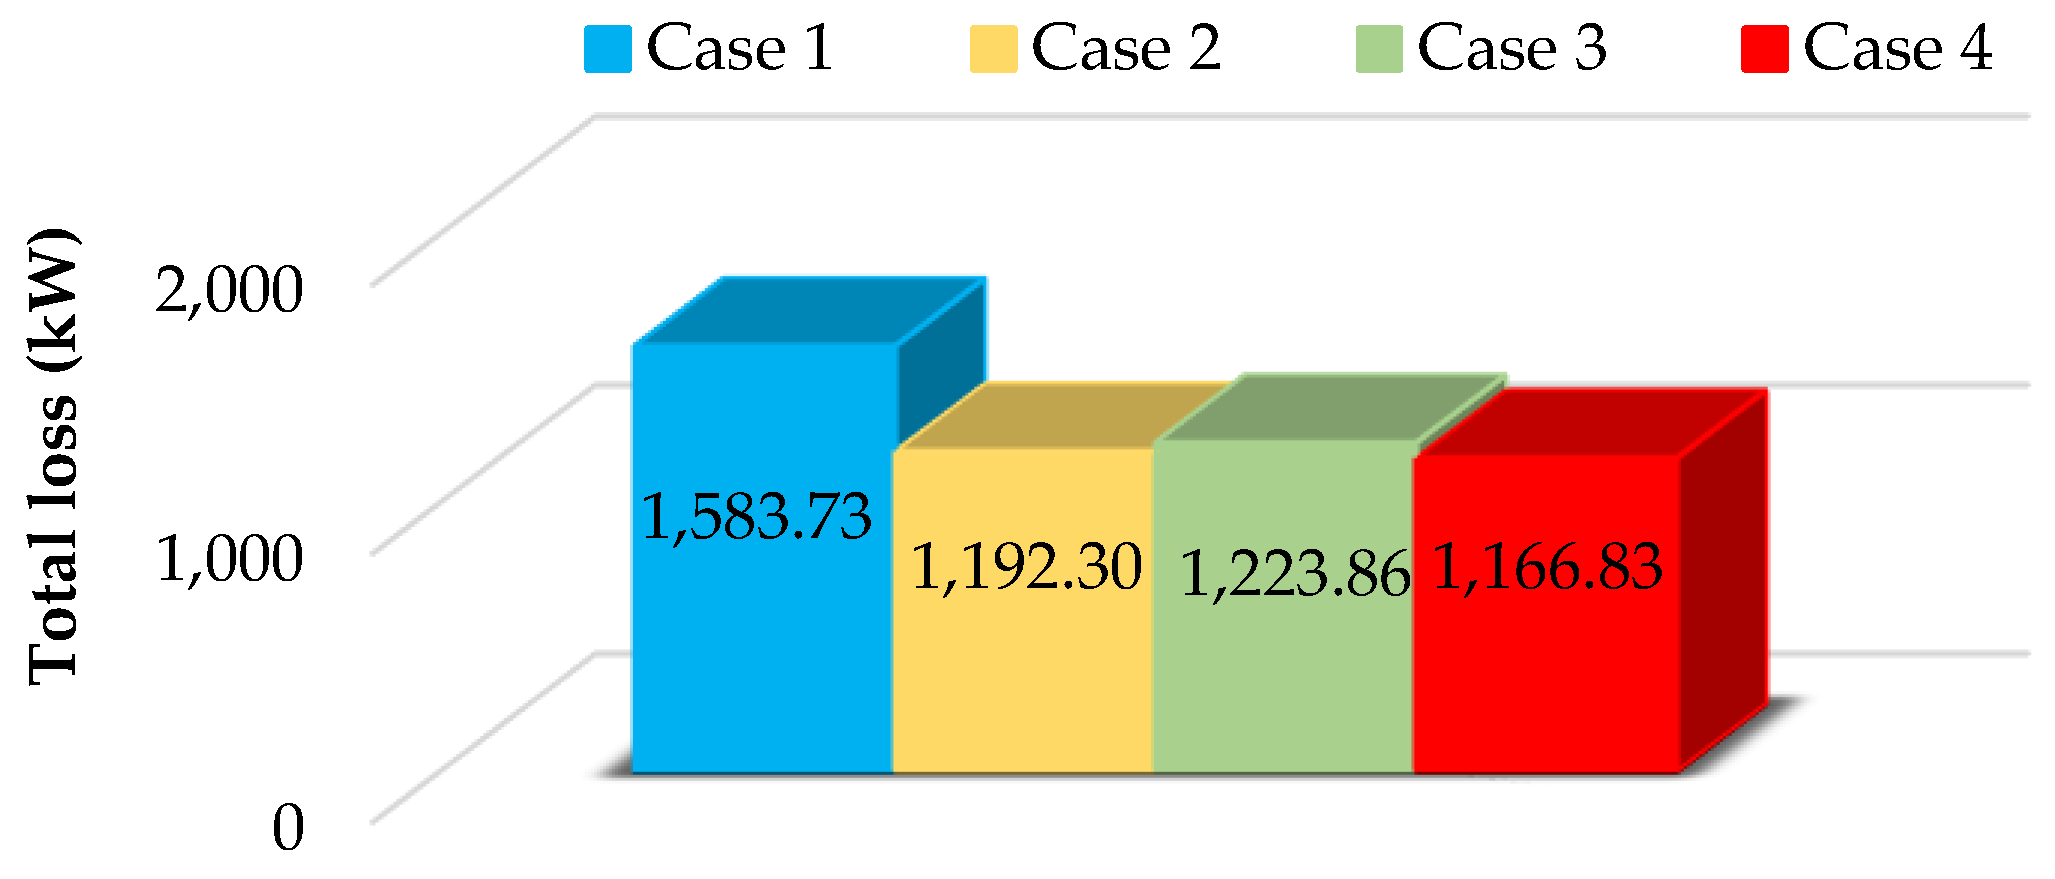
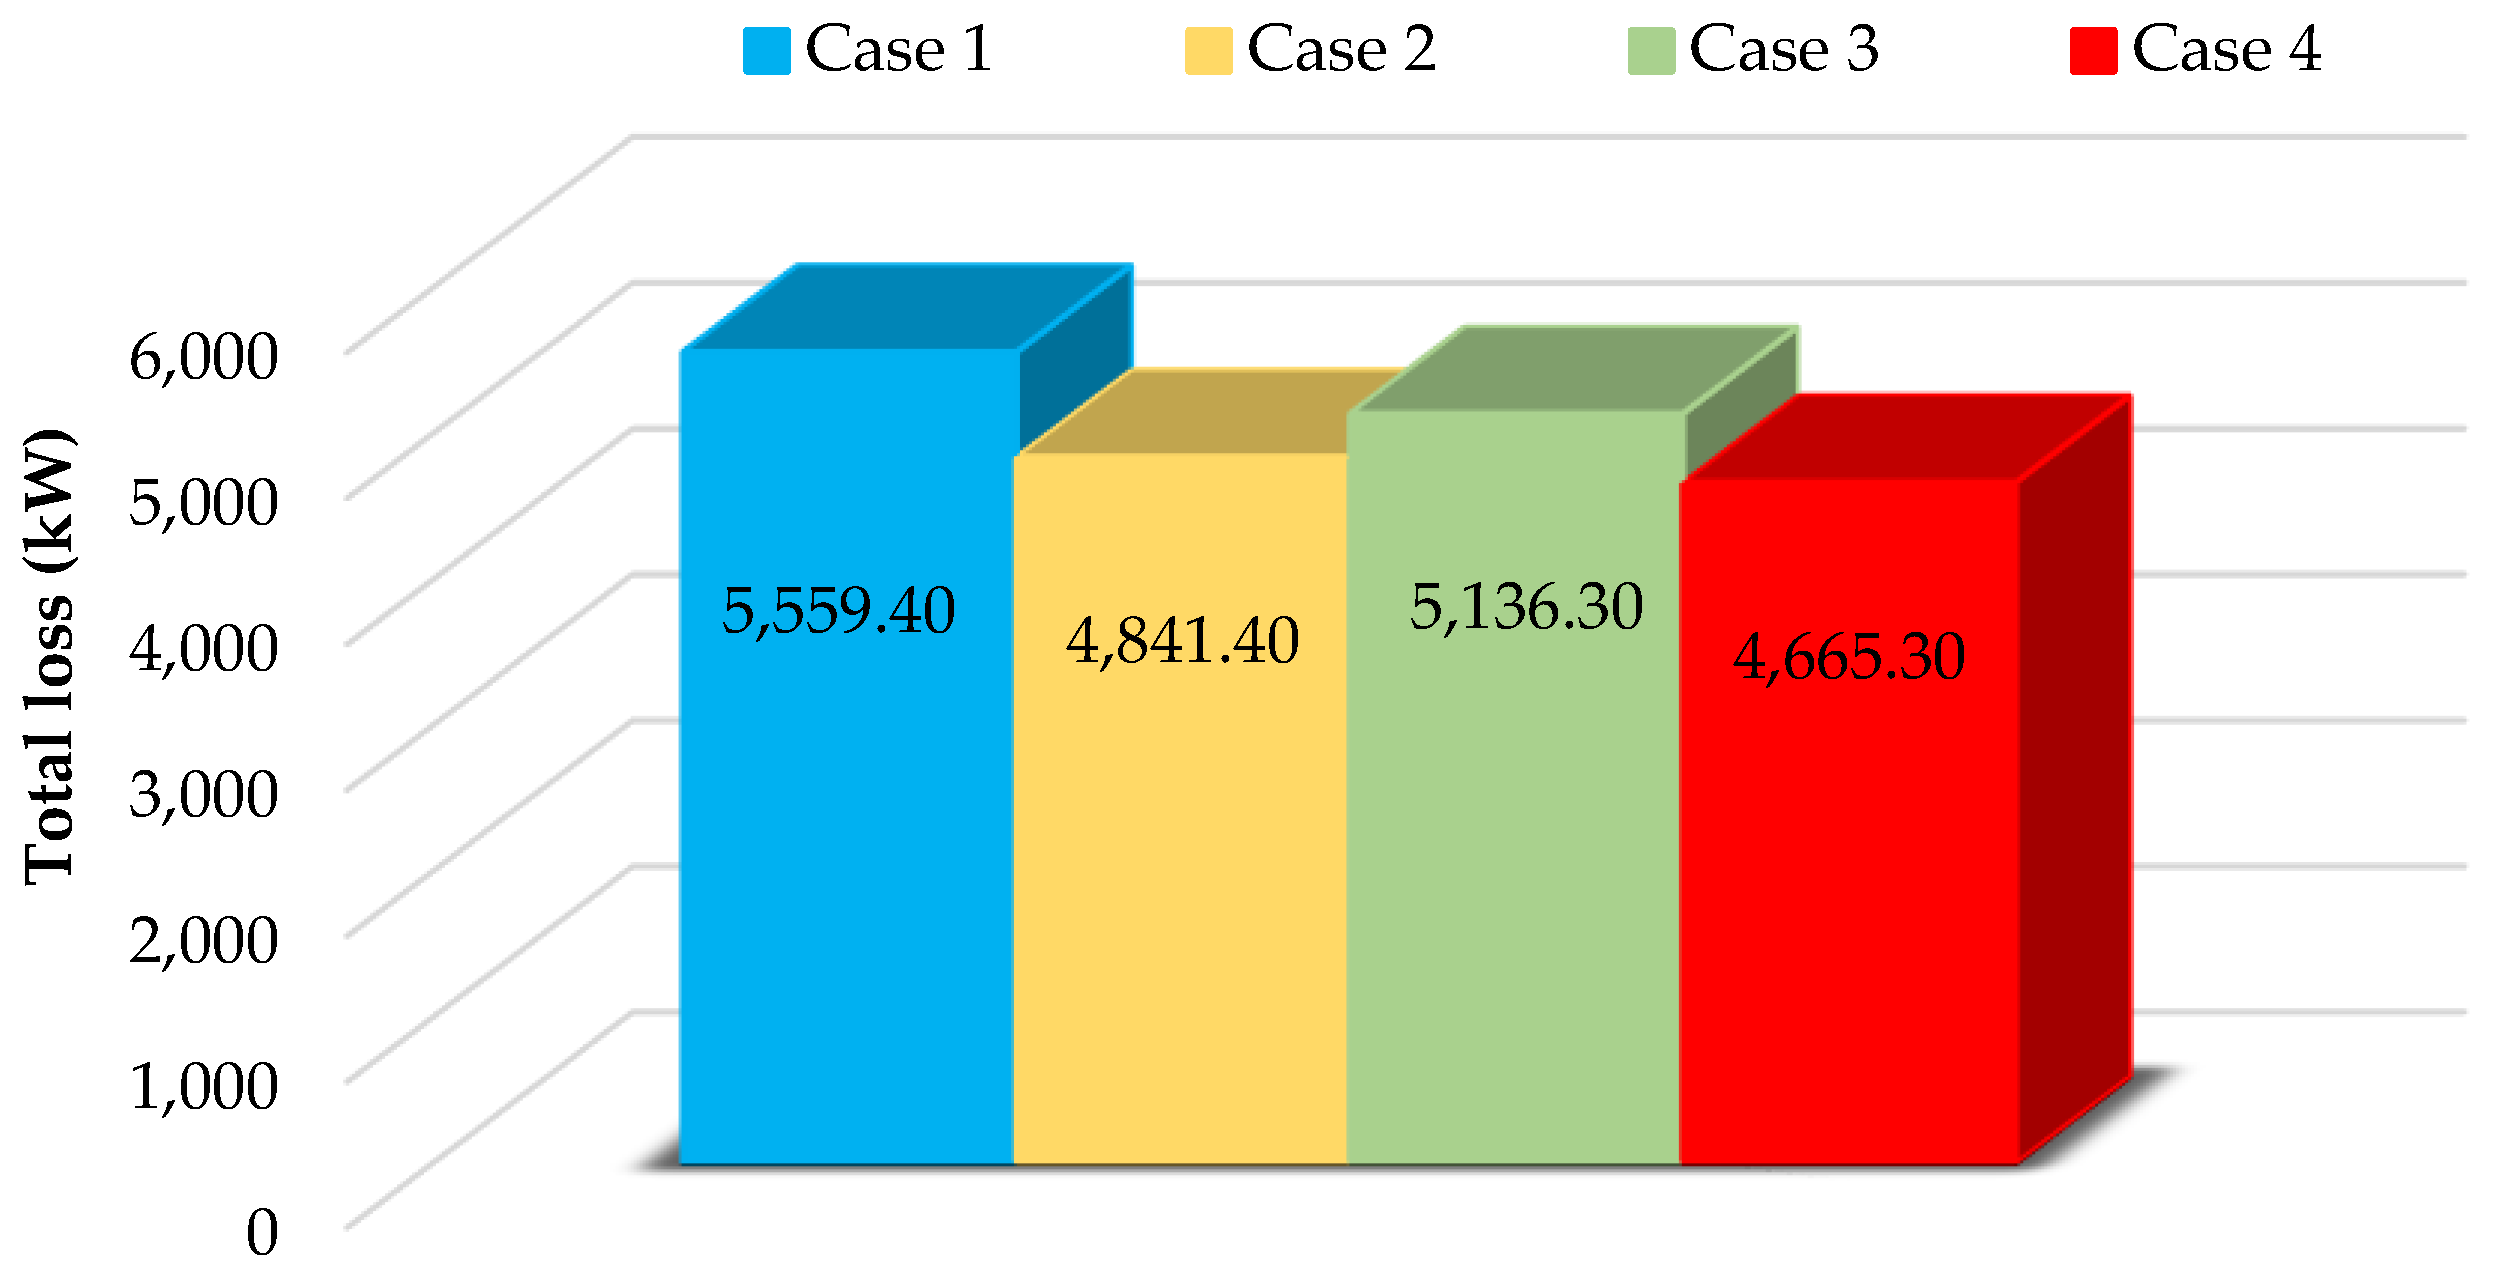
The optimum value of the hourly cost of active power loss for the studied cases is given in Table 7. Figure 9 and Figure 10 compare the hourly and total active power loss. It is clear that dynamic reconfiguration (Case 4) reduces the Closs by up to 26.31%, 2.14%, and 4.66% compared to Case 1, Case 2, and Case 3, respectively.
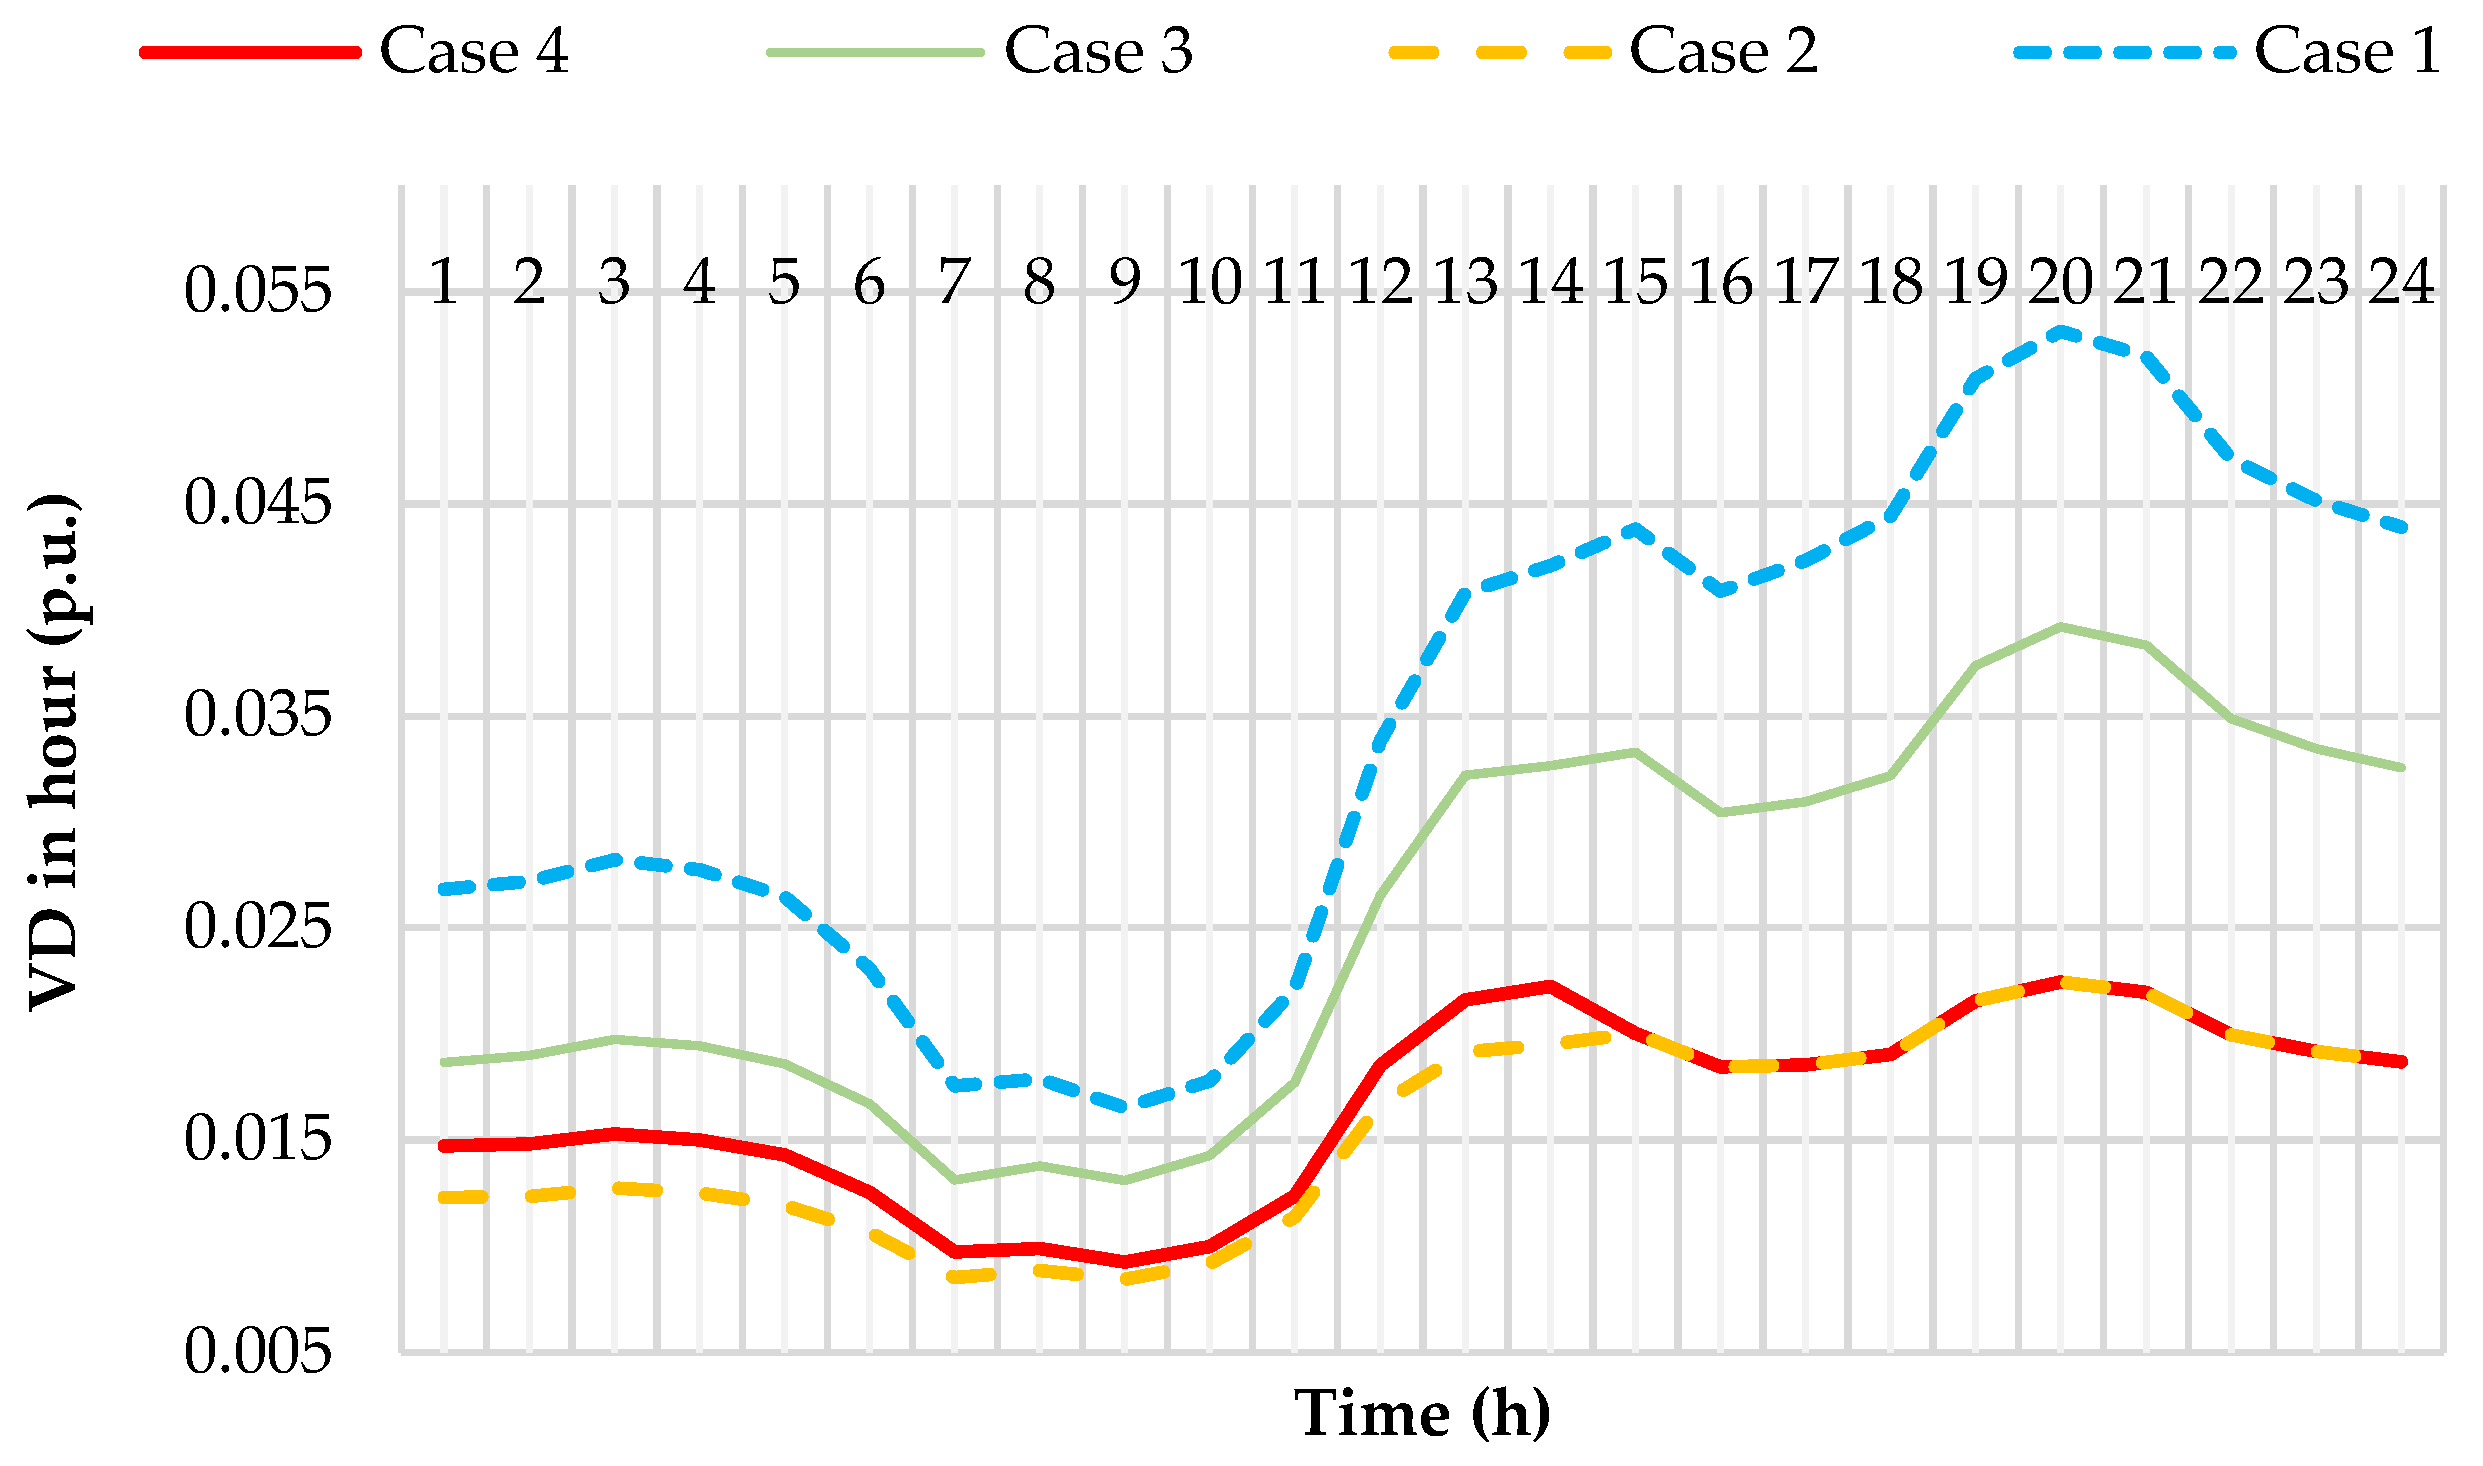
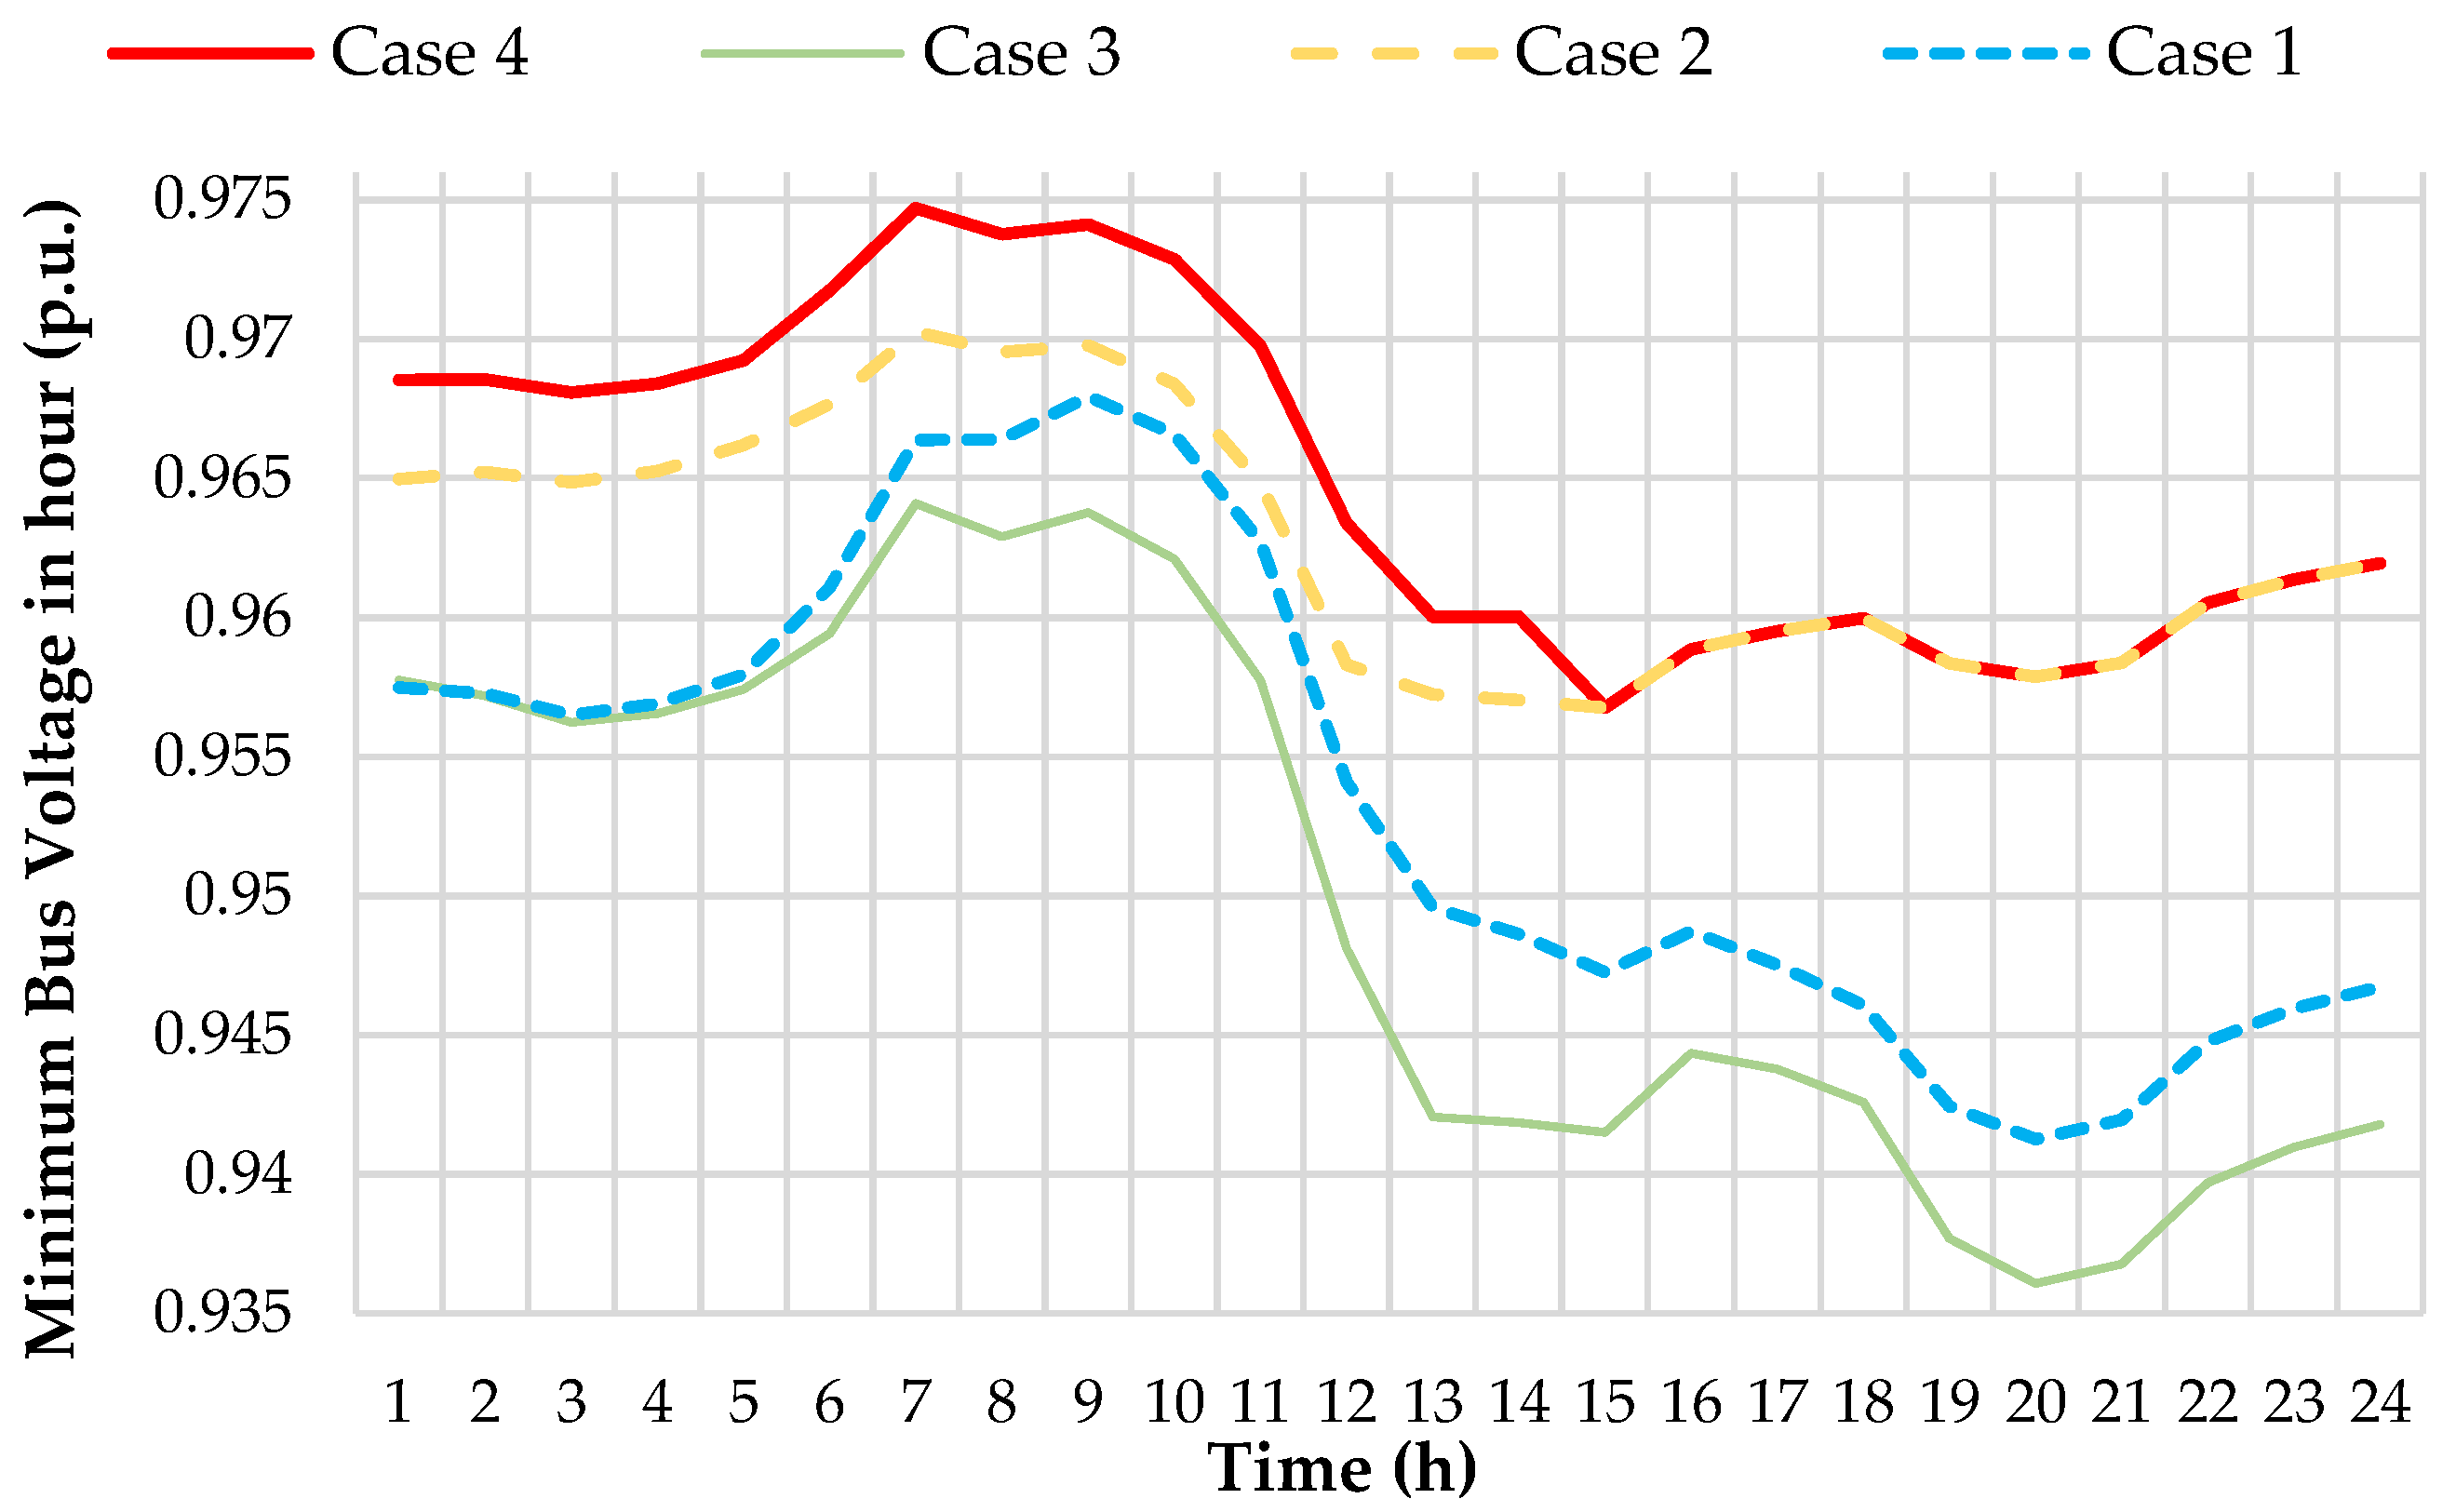
Figure 11 shows the hourly variation in the VD of all investigated configurations based on the predicted load profile. The results show that dynamic reconfiguration outperforms Case 1 and Case 2 and has characteristics similar to those of Case 2 in more hours. The minimum bus voltage profiles during the 24 h time horizon are displayed in Figure 12. It can be observed that Case 4 leads to better results for the minimum bus voltage.

4.2.1. Comparison Test of COA with PSO

The effectiveness of the COA for the dynamic reconfiguration of a distribution network was verified in this study by comparing the solution results for the IEEE 33-bus system using the PSO algorithm.
Table 8 shows a comparison between the COA and PSO. COA has the lowest total cost of the two algorithms for dynamic reconfiguration. PSO increases the switching cost during reconfiguration. The COA has good performance for Closs. This validates the COA’s excellence in generating solutions for a variety of objectives. It has superior performance in comparison to PSO.
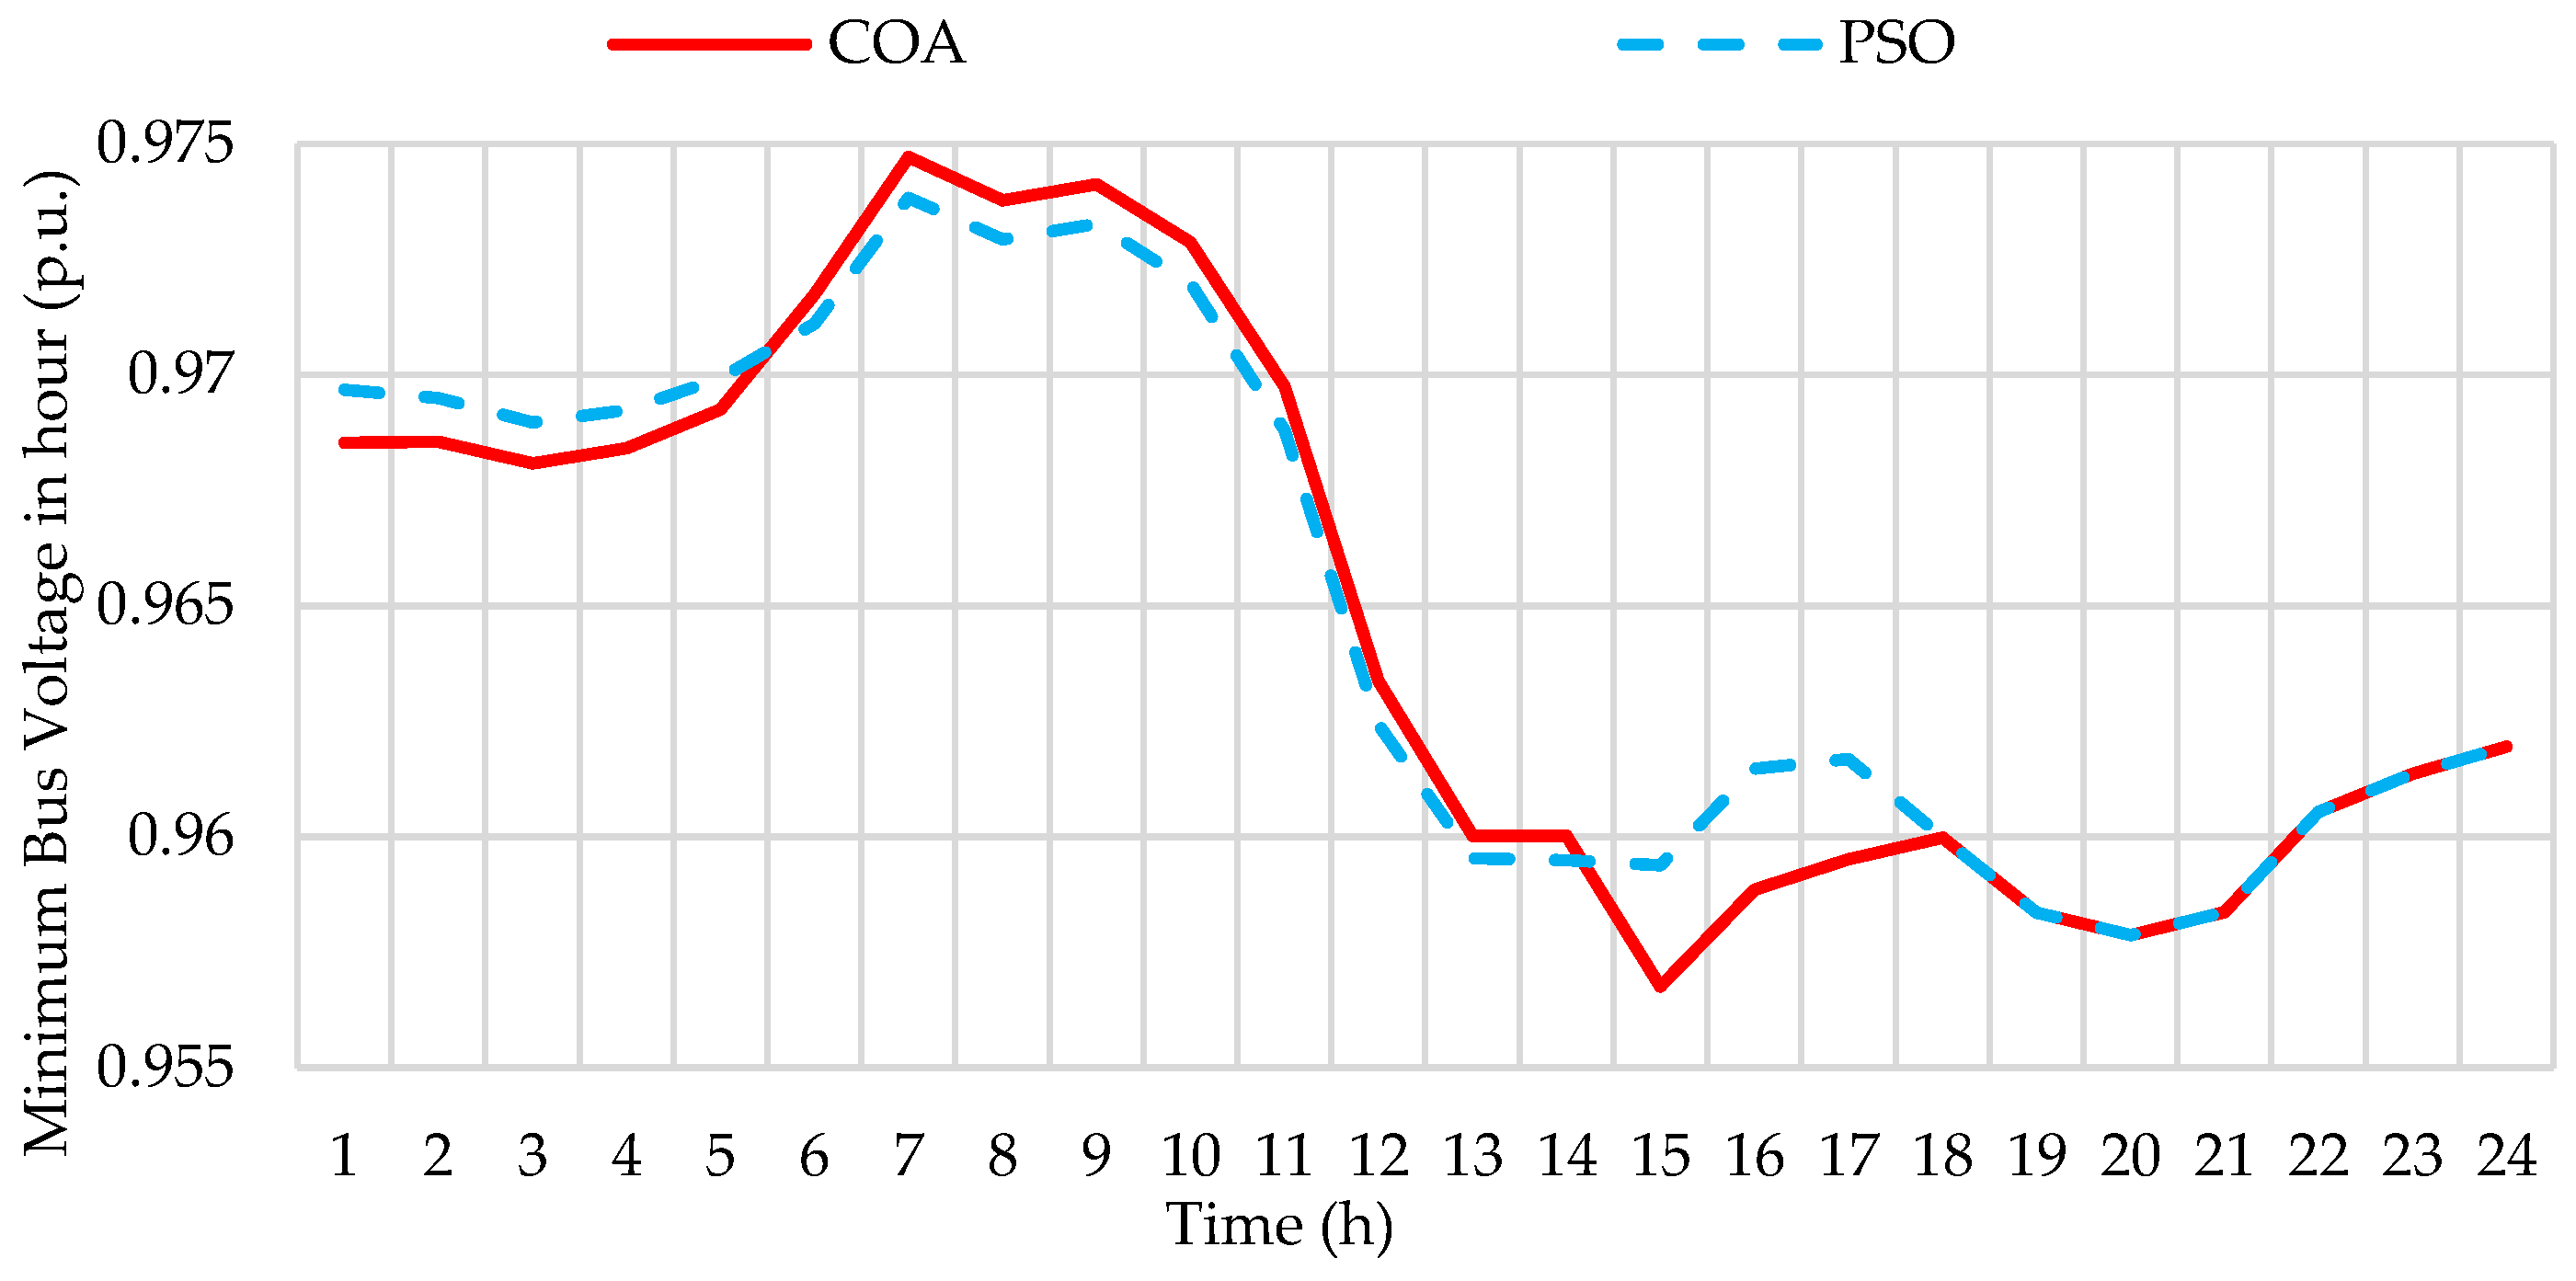
The minimum bus voltage profile comparison during the 24 h time horizon is displayed in Figure 13. It can be observed that COA and PSO lead to similar results for the minimum bus voltage.

4.2.2. Reliability Analysis

The expected amount of energy not being provided to the consumer load point due to unexpected outage occurrences is defined as Expected Energy Not Supplied (EENS). The EENS is an important parameter in the reliability determination of distribution systems, and it is calculated by using the failure rate in each branch and the number of interrupted loads due to failure. The following equations were used to compute the EENS:
E E N S t = s c = 1 N t s c π C , t s c i = 1 N B E E N S t , i
E E N S t , i = j = 1 n b ( i ) λ j r j L t , i
where nb(i) is the number of branches, the outage of which can cause a failure at the ith bus; λj and rj are the average failure rate and average failure duration of the jth element in set nb(i), respectively; and Lt,i is the average load in bus i at time t [34].
Figure 14 shows the hourly variation in the EENS for all the studied configurations based on the forecasted load profile. The results show that dynamic reconfiguration has better efficiency than fixed configurations.
In Table 9, the average and total values of the EENS are presented for the studied reconfigurations. It is clear that dynamic reconfiguration (Case 4) reduces the EENS compared to Case 1, Case 2, and Case 3.

4.3. Case Study Network Overview (TPC 83-Bus)

The second test system evaluated is the Taiwan Power Company (TPC) distribution network, represented in Figure 15. This system consists of 96 branches, incorporating 83 sectional switches and 13 tie-line switches. Detailed information about this system is available in [41]. In its initial configuration, switches numbered S84–S96 are initially open. The network operates at a nominal voltage of 11.4 kV and is designed to handle a load of 28.35 MW and 20.7 MVar. Power flow calculations are performed per unit, with Sbase = 10 MVA and Vbase = 11.4 kV.
The renewable generation size and location data are available in Table 10. Other factors such as load profile, wind speed, solar irradiance, etc., are similar to the IEEE 33-bus system.

4.4. Discussion (TPC 83-Bus)

The effectiveness of the COA in addressing the reconfiguration problem for power loss reduction under nominal loading conditions and without DG was assessed by comparing its results with other references, as shown in Table 11. The analysis of Table 11 indicates that the optimal configuration achieved by the COA is similar to the results attained in other references. The initial value of active power losses (without reconfiguration) is 531.99 kW.
The DR effect on the optimal operation of the TPC 83-bus are studied in four different cases, similar to IEEE 33-bus test system.
Table 12 shows the final operation scheme for all cases examined. Comparing all cases indicates that the total operation cost without reconfiguration is relatively high (USD 18,751.93). In Case 2, the operating cost is USD 18,455.35. In Case 3, the operating cost is USD 18,574.61. In Case 4, the network has two optimal configurations. The first configuration corresponds to the period 1–19 h and is achieved by opening switches S7, S34, S39, S41, S55, S62, S72, S83, S86, S88, S89, S90, and S92. The second configuration corresponds to the period 20–24 h. In this period, switches S7, S14, S34, S39, S42, S55, S62, S72, S83, S86, S88, S90, and S92 are open. In Case 4, the total operating costs amount to USD 18,378.23. As expected, the total cost in Case 4 is better than in the static reconfiguration (Case 2 and Case 3).
Figure 16 compares the total active power loss. It is clear that dynamic reconfiguration (Case 4) reduces the losses up to 16.08%, 3.64%, and 9.17% compared to Case 1, Case 2, and Case 3, respectively.

5. Conclusions

This paper introduces a method for the operation of a distribution network using flexible dynamic reconfiguration that takes into account renewable generation and load uncertainty. The uncertainty was modeled using a scenario-based method. The operation cost was optimized by minimizing the costs for power losses, voltage deviations, switching operations, energy taken from the upstream grid, and energy generated by PV-DG and wind-DG. The effectiveness of the proposed method was evaluated using the IEEE 33-bus test system and TPC 83-bus system in conjunction with the COA approach. Four different cases were examined to illustrate the impact of dynamic reconfiguration on the optimal operation of the distribution network. The simulation results revealed that the proposed dynamic reconfiguration could provide significant gains in total cost reduction compared to static reconfiguration. Dynamic reconfiguration proved to be an effective approach for reducing power losses and minimizing total energy purchases from the upstream network, achieved by increasing switching operations under similar conditions.

Author Contributions

B.E.: conceptualization, formal analysis, methodology, and writing—original draft. H.A.: methodology and writing—review. R.N.: supervision, methodology, visualization, and writing—review and editing. S.J.: supervision and writing—review and editing. All authors have read and agreed to the published version of the manuscript.

Funding

This research received no external funding.

Data Availability Statement

The authors confirm that the data supporting the findings of this study are available within the article.

Acknowledgments

The authors would like to acknowledge the support received from the Substation Company (SSCO).

Conflicts of Interest

The authors declare no conflicts of interest.

Abbreviations

COA Coati Optimization algorithm
DN Distribution Network
DG Distributed Generation
RCSs Remote-Controlled Switches
DR Dynamic Reconfiguration
SR Static Reconfiguration
MFSMA Multi-group Flight Slime Mold Algorithm
FCMC Fuzzy C-Means Clustering
PSO Particle Swarm Optimization
MILP Mixed-Integer Linear Programming
GWO Grey Wolf Optimizer
MISOCP Mixed-Integer Second-Order Cone Programming
IMODBO Improved Multi-Objective Dung Beetle Optimizer

References

  1. Ehsan, A.; Yang, Q. State-of-the-art techniques for modelling of uncertainties in active distribution network planning: A review. Appl. Energy 2019, 239, 1509–1523. [Google Scholar] [CrossRef]
  2. Golshannavaz, S.; Afsharnia, S.; Aminifar, F. Smart distribution grid: Optimal day-ahead scheduling with reconfigurable topology. IEEE Trans. Smart Grid 2014, 5, 2402–2411. [Google Scholar] [CrossRef]
  3. Amini, H.; Mehrizi-Sani, A.; Noroozian, R. Passive Islanding Detection of Inverter-Based Resources in a Noisy Environment. Energies 2024, 17, 4405. [Google Scholar] [CrossRef]
  4. Alqahtani, M.; Marimuthu, P.; Moorthy, V.; Pangedaiah, B.; Reddy, C.R.; Kumar, M.K.; Khalid, M. Investigation and Minimization of Power Loss in Radial Distribution Network Using Gray Wolf Optimization. Energies 2023, 16, 4571. [Google Scholar] [CrossRef]
  5. Amini, H.; Mehrizi-Sani, A.; Liu, C.C. Substation Cyberattack Detection and Mitigation in a High-Noise Environment. In Proceedings of the IEEE Power & Energy Society Innovative Smart Grid Technologies Conference (ISGT), Washington, DC, USA, 19–22 February 2024. [Google Scholar]
  6. Pan, J.-S.; Wang, H.-J.; Nguyen, T.-T.; Zou, F.-M.; Chu, S.-C. Dynamic reconfiguration of distribution network based on dynamic optimal period division and multi-group flight slime mould algorithm. Electr. Power Syst. Res. 2022, 208, 107925. [Google Scholar] [CrossRef]
  7. Cao, H.; Gao, C.; Chen, P.; He, X.; Dong, Z.; Lin, L. Distribution Network Dynamic Reconfiguration Based on Improved Fuzzy C-Means Clustering with Time Series Analysis. IEEJ Trans. Electr. Electron. Eng. 2022, 17, 174–182. [Google Scholar] [CrossRef]
  8. Zhan, J.; Liu, W.; Chung, C.; Yang, J. Switch opening and exchange method for stochastic distribution network reconfiguration. IEEE Trans. Smart Grid 2020, 11, 2995–3007. [Google Scholar] [CrossRef]
  9. Azizivahed, A.; Narimani, H.; Fathi, M.; Naderi, E.; Safarpour, H.R.; Narimani, M.R. Multi-objective dynamic distribution feeder reconfiguration in automated distribution systems. Energy 2018, 147, 896–914. [Google Scholar] [CrossRef]
  10. Dorostkar-Ghamsari, M.R.; Fotuhi-Firuzabad, M.; Lehtonen, M.; Safdarian, A. Value of distribution network reconfiguration in presence of renewable energy resources. IEEE Trans. Power Syst. 2015, 31, 1879–1888. [Google Scholar] [CrossRef]
  11. Jafari, A.; Ganjehlou, H.G.; Darbandi, F.B.; Mohammadi-Ivatloo, B.; Abapour, M. Dynamic and multi-objective reconfiguration of distribution network using a novel hybrid algorithm with parallel processing capability. Appl. Soft Comput. 2020, 90, 106146. [Google Scholar] [CrossRef]
  12. Ji, X.; Yin, Z.; Zhang, Y.; Xu, B. Real-time autonomous dynamic reconfiguration based on deep learning algorithm for distribution network. Electr. Power Syst. Res. 2021, 195, 107132. [Google Scholar] [CrossRef]
  13. Kovački, N.V.; Vidović, P.M.; Sarić, A.T. Scalable algorithm for the dynamic reconfiguration of the distribution network using the Lagrange relaxation approach. Int. J. Electr. Power Energy Syst. 2018, 94, 188–202. [Google Scholar] [CrossRef]
  14. Li, L.-L.; Xiong, J.-L.; Tseng, M.-L.; Yan, Z.; Lim, M.K. Using multi-objective sparrow search algorithm to establish active distribution network dynamic reconfiguration integrated optimization. Expert Syst. Appl. 2022, 193, 116445. [Google Scholar] [CrossRef]
  15. Mukhopadhyay, B.; Das, D. Multi-objective dynamic and static reconfiguration with optimized allocation of PV-DG and battery energy storage system. Renew. Sustain. Energy Rev. 2020, 124, 109777. [Google Scholar] [CrossRef]
  16. Peng, C.; Xu, L.; Gong, X.; Sun, H.; Pan, L. Molecular evolution based dynamic reconfiguration of distribution networks with DGs considering three-phase balance and switching times. IEEE Trans. Ind. Inform. 2018, 15, 1866–1876. [Google Scholar] [CrossRef]
  17. Popović, Ž.N.; Kovački, N.V. Multi-period reconfiguration planning considering distribution network automation. Int. J. Electr. Power Energy Syst. 2022, 139, 107967. [Google Scholar] [CrossRef]
  18. Popovic, Z.N.; Knezevic, S.D. Dynamic reconfiguration of distribution networks considering hosting capacity: A risk-based approach. IEEE Trans. Power Syst. 2022, 38, 3440–3450. [Google Scholar] [CrossRef]
  19. Santos, S.F.; Gough, M.; Fitiwi, D.Z.; Pogeira, J.; Shafie-khah, M.; Catalão, J.P. Dynamic distribution system reconfiguration considering distributed renewable energy sources and energy storage systems. IEEE Syst. J. 2022, 16, 3723–3733. [Google Scholar] [CrossRef]
  20. Qiao, J.; Mi, Y.; Shen, J.; Xia, D.; Li, D.; Wang, P. Active and reactive power coordination optimization for active distribution network considering mobile energy storage system and dynamic network reconfiguration. Electr. Power Syst. Res. 2025, 238, 111080. [Google Scholar] [CrossRef]
  21. Home-Ortiz, J.M.; Macedo, L.H.; Vargas, R.; Romero, R.; Mantovani, J.R.S.; Catalao, J.P.S. Increasing RES hosting capacity in distribution networks through closed-loop reconfiguration and Volt/VAr control. IEEE Trans. Ind. Appl. 2022, 58, 4424–4435. [Google Scholar] [CrossRef]
  22. Zhan, H.; Jiang, C.; Lin, Z. A Novel Graph Reinforcement Learning-Based Approach for Dynamic Reconfiguration of Active Distribution Networks with Integrated Renewable Energy. Energies 2024, 17, 6311. [Google Scholar] [CrossRef]
  23. Lotfi, H.; Shojaei, A.A. A dynamic model for multi-objective feeder reconfiguration in distribution network considering demand response program. Energy Syst. 2023, 14, 1051–1080. [Google Scholar] [CrossRef]
  24. Tu, N.; Fan, Z. IMODBO for optimal dynamic reconfiguration in active distribution networks. Processes 2023, 11, 1827. [Google Scholar] [CrossRef]
  25. Kayal, P.; Chanda, C. Optimal mix of solar and wind distributed generations considering performance improvement of electrical distribution network. Renew. Energy 2015, 75, 173–186. [Google Scholar] [CrossRef]
  26. Khatod, D.K.; Pant, V.; Sharma, J. Evolutionary programming based optimal placement of renewable distributed generators. IEEE Trans. Power Syst. 2012, 28, 683–695. [Google Scholar] [CrossRef]
  27. Nikkhah, S.; Rabiee, A. Multi-objective stochastic model for joint optimal allocation of DG units and network reconfiguration from DG owner’s and DisCo’s perspectives. Renew. Energy 2019, 132, 471–485. [Google Scholar]
  28. Wang, W.; Huang, Y.; Yang, M.; Chen, C.; Zhang, Y.; Xu, X. Renewable energy sources planning considering approximate dynamic network reconfiguration and nonlinear correlations of uncertainties in distribution network. Int. J. Electr. Power Energy Syst. 2022, 139, 107791. [Google Scholar] [CrossRef]
  29. Conejo, A.J.; Carrión, M.; Morales, J.M. Decision Making Under Uncertainty in Electricity Markets; Springer: Berlin/Heidelberg, Germany, 2010; Volume 1. [Google Scholar]
  30. Arefifar, S.A.; Mohamed, Y.A.-R.I.; El-Fouly, T.H. Supply-adequacy-based optimal construction of microgrids in smart distribution systems. IEEE Trans. Smart Grid 2012, 3, 1491–1502. [Google Scholar] [CrossRef]
  31. Xia, S.; Luo, X.; Chan, K.W.; Zhou, M.; Li, G. Probabilistic transient stability constrained optimal power flow for power systems with multiple correlated uncertain wind generations. IEEE Trans. Sustain. Energy 2016, 7, 1133–1144. [Google Scholar] [CrossRef]
  32. Atwa, Y.; El-Saadany, E.; Salama, M.; Seethapathy, R. Optimal renewable resources mix for distribution system energy loss minimization. IEEE Trans. Power Syst. 2009, 25, 360–370. [Google Scholar] [CrossRef]
  33. Dehghani, M.; Montazeri, Z.; Trojovská, E.; Trojovský, P. Coati Optimization Algorithm: A new bio-inspired metaheuristic algorithm for solving optimization problems. Knowl.-Based Syst. 2023, 259, 110011. [Google Scholar] [CrossRef]
  34. Chandramohan, S.; Atturulu, N.; Devi, R.K.; Venkatesh, B. Operating cost minimization of a radial distribution system in a deregulated electricity market through reconfiguration using NSGA method. Int. J. Electr. Power Energy Syst. 2010, 32, 126–132. [Google Scholar] [CrossRef]
  35. Esmailnezhad, B.; Shayeghi, H. Simultaneous distribution network reconfiguration and DG allocation for loss reduction by invasive weed optimization algorithm. In Proceedings of the 2013 Smart Grid Conference (SGC), Tehran, Iran, 17–18 December 2013; IEEE: Tehran, Iran, 2013; pp. 166–172. [Google Scholar]
  36. Amini, H. Islanding Detection and Cybersecurity in Inverter-Based Microgrids Under a High-Noise Environment. Ph.D. Dissertation, Virginia Tech, Blacksburg, VA, USA, 2024. Available online: https://hdl.handle.net/10919/120981 (accessed on 4 January 2025).
  37. Li, C.; Dai, Y.; Wang, P.; Xia, S. Active and reactive power coordinated optimization of active distribution networks considering dynamic reconfiguration and SOP. IET Renew. Power Gener. 2023, 17, 1–12. [Google Scholar] [CrossRef]
  38. Taylor, J.A.; Hover, F.S. Convex models of distribution system reconfiguration. IEEE Trans. Power Syst. 2012, 27, 1407–1413. [Google Scholar] [CrossRef]
  39. Abdelaziz, A.; Mohamed, F.; Mekhamer, S.; Badr, M. Distribution system reconfiguration using a modified Tabu Search algorithm. Electr. Power Syst. Res. 2010, 80, 943–953. [Google Scholar] [CrossRef]
  40. Ben Hamida, I.; Salah, S.B.; Msahli, F.; Mimouni, M.F. Optimal integration of distributed generations with network reconfiguration using a Pareto algorithm. Int. J. Renew. Energy Res. 2018, 8, 345–356. [Google Scholar]
  41. Bahmanifirouzi, B.; Farjah, E.; Niknam, T.; Farsani, E.A. A new hybrid HBMO-SFLA algorithm for multi-objective distribution feeder reconfiguration problem considering distributed generator units. Iran. J. Sci. Technol. Trans. Electr. Eng. 2012, 36, 51. [Google Scholar]
  42. Lotfi, H. Multi-objective network reconfiguration and allocation of capacitor units in radial distribution system using an enhanced artificial bee colony optimization. Electr. Power Compon. Syst. 2022, 49, 1130–1142. [Google Scholar] [CrossRef]
  43. Su, C.-T.; Chang, C.-F.; Chiou, J.-P. Distribution network reconfiguration for loss reduction by ant colony search algorithm. Electr. Power Syst. Res. 2005, 75, 190–199. [Google Scholar] [CrossRef]
  44. Niknam, T.; Farsani, E.A.; Nayeripour, M.; Firouzi, B.B. A new tribe modified shuffled frog leaping algorithm for multi-objective distribution feeder reconfiguration considering distributed generator units. Eur. Trans. Electr. Power 2012, 22, 308–333. [Google Scholar] [CrossRef]
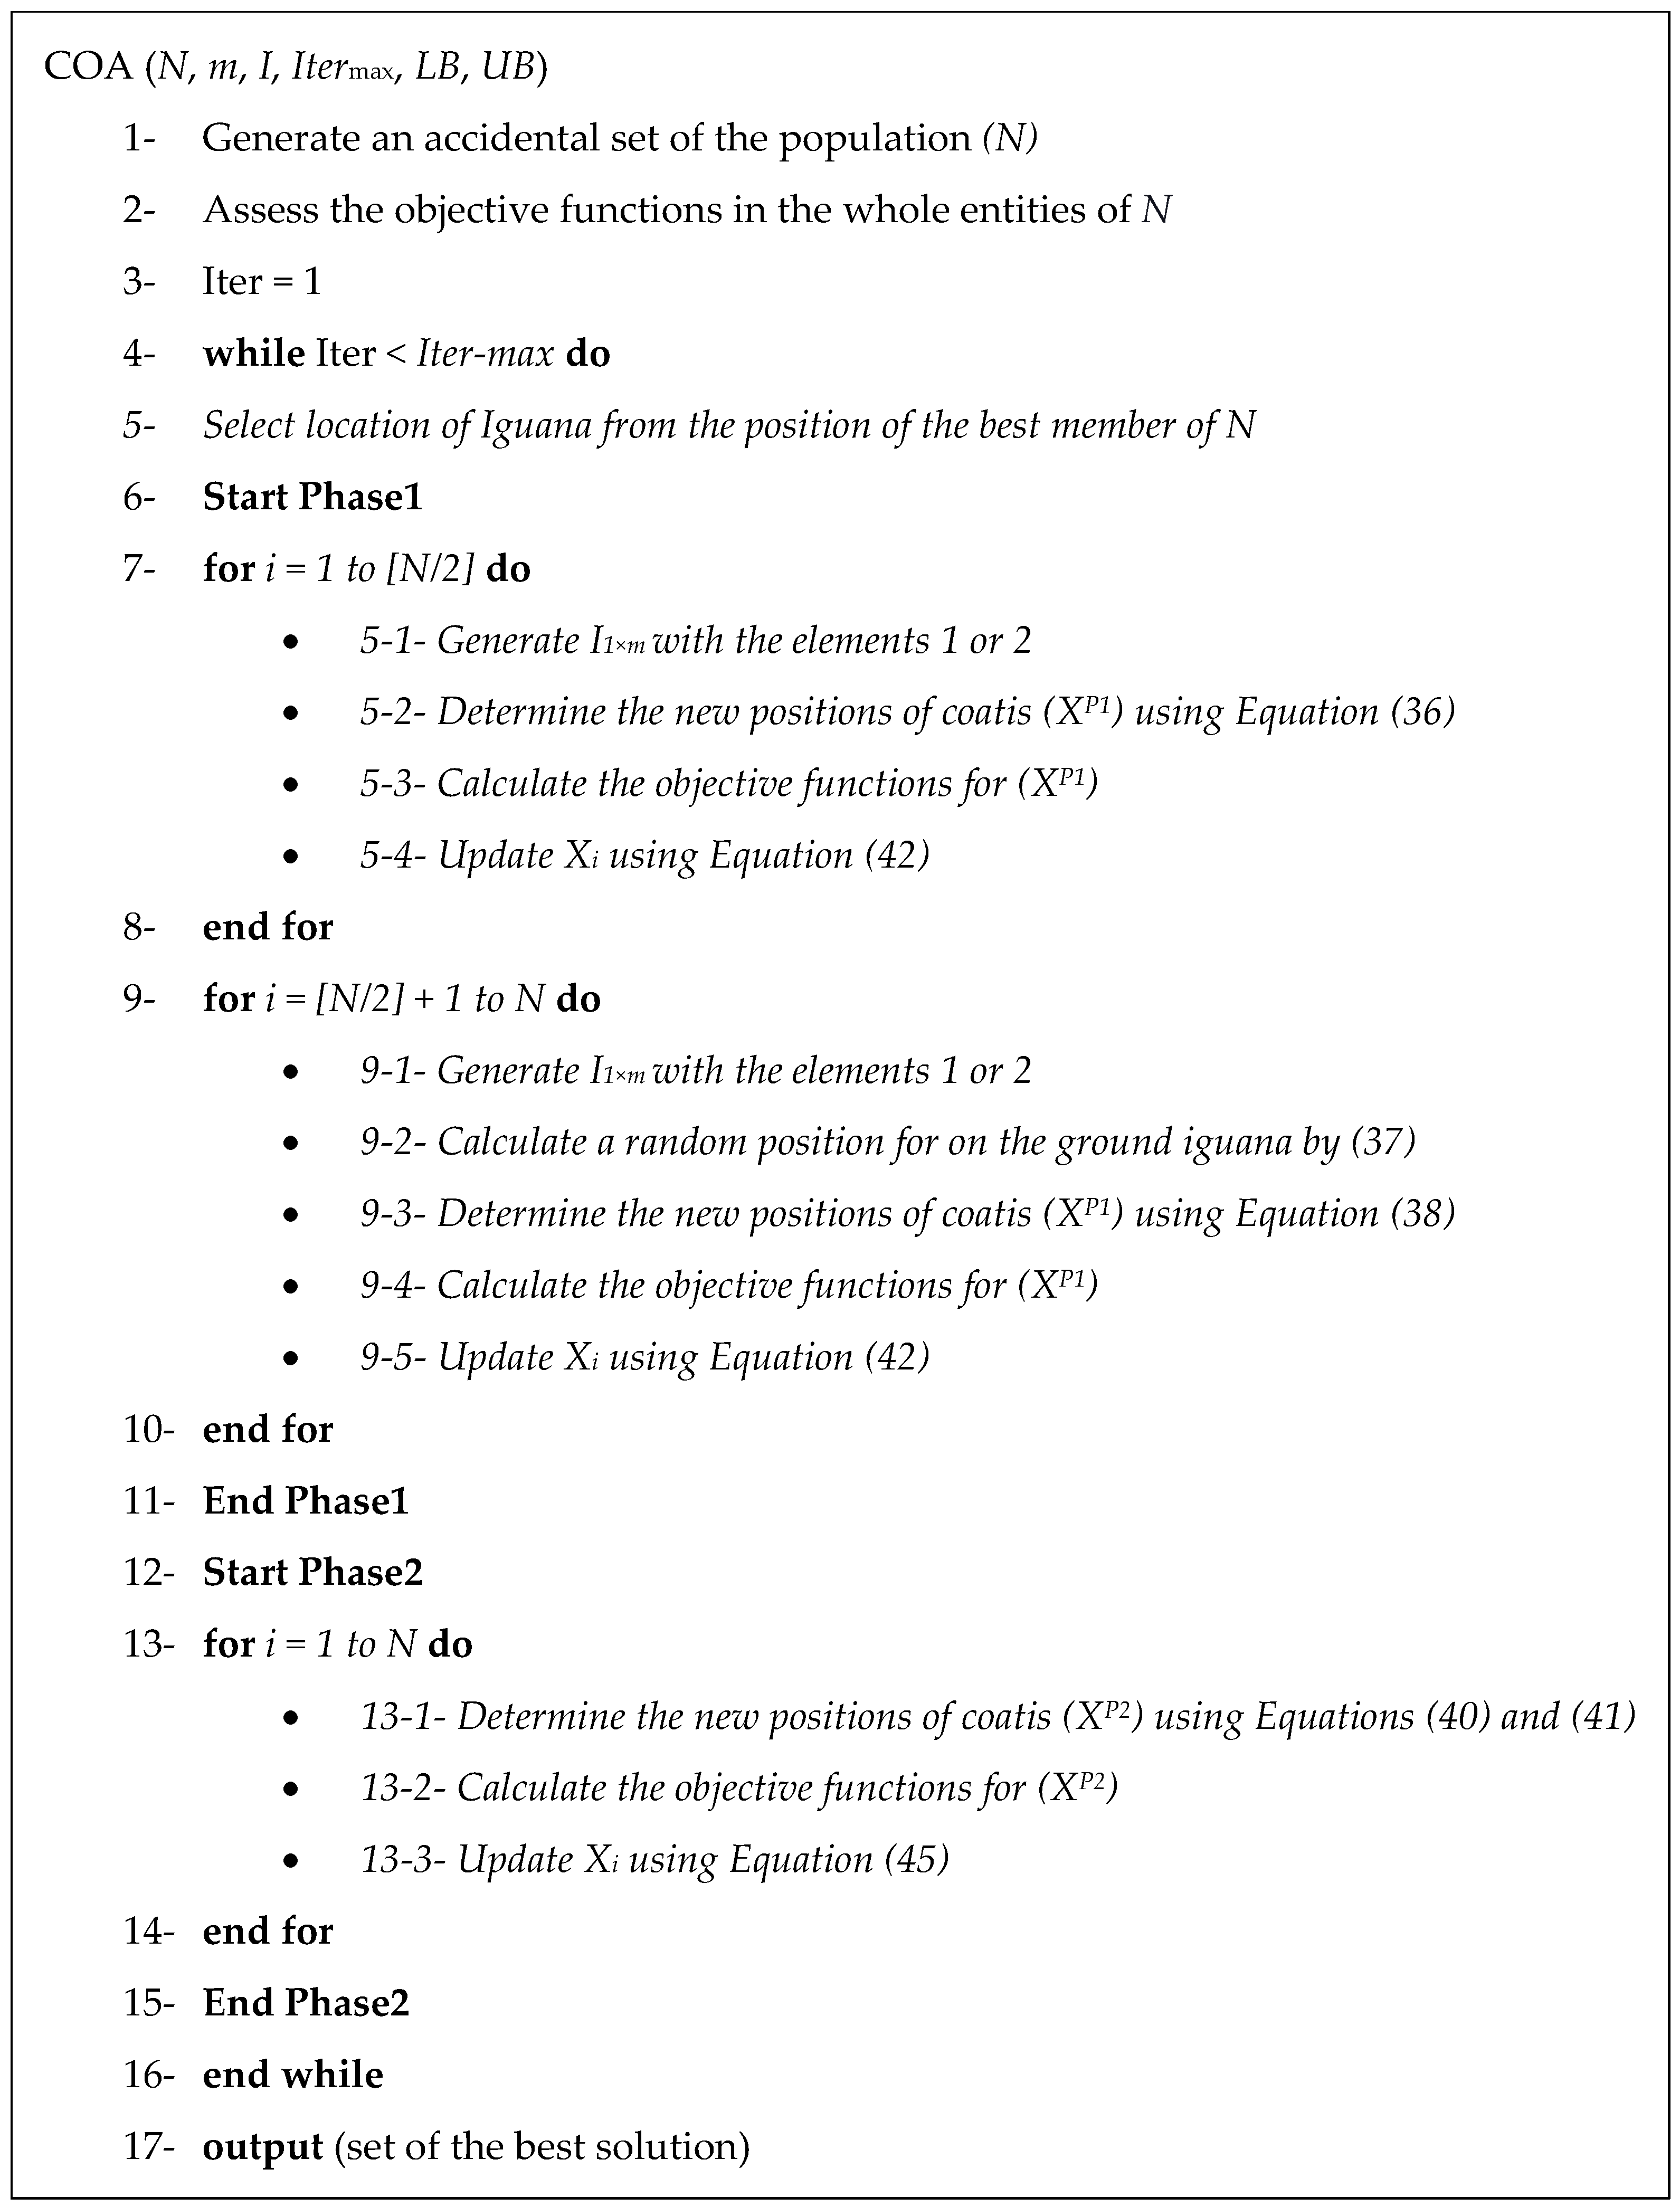
Figure 1. Pseudo code of COA.
Energies 18 00266 g001
Figure 2. Flowchart of the proposed method using the COA.
Energies 18 00266 g002
Figure 3. IEEE 33-bus test system.
Energies 18 00266 g003
Figure 4. Mean and SD of wind speed and solar irradiance.
Energies 18 00266 g004
Figure 5. Forecasted load profile.
Energies 18 00266 g005
Figure 6. Energy prices for different sources.
Energies 18 00266 g006
Figure 7. Power procured from the upstream network and renewable generation for Case 4.
Energies 18 00266 g007
Figure 8. Total power procured from the upstream network in 24 h.
Energies 18 00266 g008
Figure 9. Hourly active power loss comparison.
Energies 18 00266 g009
Figure 10. Total active power loss comparison.
Energies 18 00266 g010
Figure 11. Hourly VD for the studied cases.
Energies 18 00266 g011
Figure 12. Minimum bus voltage during 24 h for the studied cases.
Energies 18 00266 g012
Figure 13. COA and PSO minimum bus voltage comparison during 24 h.
Energies 18 00266 g013
Figure 14. Hourly variation in EENS.
Energies 18 00266 g014
Figure 15. TPC 83-bus system.
Energies 18 00266 g015
Figure 16. Total active power loss comparison (TPC 83 bus).
Energies 18 00266 g016
Table 1. Comparing DR methods.
Ref.DR Type *Minimize Objective FunctionSolution MethodDGUncertaintyTest Systems
DC
[6]🗴Power loss, voltage stability, and load balanceMFSMAYesNo33- and 118-bus
[7]🗴Total energy lossesFCMC and PSOYesYes70-bus
[8]🗴Power lossSOEYesYes33-, 119-,84-, 136-, and 417-bus
[9]🗴ENS, power loss, and operation costIntegrated GWO and PSOYesNo95-bus
[10]🗴Total daily lossesMOSEKYesYes33-bus
[11]🗴Power loss, SAIFI, SAIDI, and AENSHybrid EMA and WGANoNo15-, 33-, 69- and, 85-bus
[12]🗴Switching and power lossDeep Learning AlgorithmYesNo33- and 84-bus
[13]🗴Reliability, switching, and power lossLagrange RelaxationYesNo15- and 1021-bus
[14]🗴Losses, VDI, and economic costMOSSAYesNo33-bus
[15]🗴Losses, VDI, and load abilityCircular mechanismYesNo69-bus
[16]🗴Unbalance factor and switching factorMOMDEYesNo34-bus
[17]🗴Cost of losses, wwitching, and ENSMO Switching and ENS ProgrammingYesYes83-bus
[18]🗴Hosting capacity, cost of losses, switching, and interruptionsMO MILPYesYes33-bus
[19]🗴Cost of emissions and switchingStochastic MILPYesYes119-bus
[20]🗴Operation costMISOCPYesNo33 bus
[21]🗴Hosting capacity and CO2 emissionsMISOCPYesNo33- and 84-bus
[22]🗴Power loss and voltage deviations graph reinforcement learningYesNo33 bus
[23]🗴Cost of losses, operation, and ENSIPSOYesYes95 bus
[24]🗴Power loss and voltage deviations IMODBOYesYes33- and 69-bus
This work🗴Cost (Cupn + Closs + CVD + CSW + CPV + CWind)COAYesYes33- and 84-bus
*—D: decomposition and C: complete.
Table 2. Renewable generation size and location (IEEE 33-bus).
DG TypeLocation (No. Bus)Size (kW)Location (No. Bus)Size (kW)
PV735014450
Wind1040033500
Table 3. Loss reduction by the proposed COA and other references (IEEE 33-bus).
ReferencesOptimization MethodResults
Open SwitchesLoss (kW)
[6]MFSMAS7, S9, S14, S32, S37144.43
[8]SOES7, S9, S14, S32, S37139.55
[10]GAMS SolverS7, S9, S14, S32, S37139.55
[11]Hybrid EMA and WGAS7, S9, S14, S32, S37139.55
[38]Convex ModelsS7, S9, S14, S32, S37139.55
[39]Tabu Search algorithmS7, S9, S14, S32, S37139.55
[40]Pareto algorithmS7, S9, S14, S32, S37139.55
This workCOAS7, S9, S14, S32, S37139.55
Table 4. Comparison results for the studied cases.
CaseTime PeriodOpen Switches Cost (USD)Closs (USD)CVD (USD)CSW (USD)Cupn (USD)CPV (USD)Cwind (USD)
124 hS33, S34, S35, S36, S372799.20633.490.58101873.2860.518231.32
224 hS7, S9, S14, S32, S372635.45476.920.26081858.4260.518231.32
324 hS7, S10, S14, S30, S372649.57489.540.43181859.7560.518231.32
41–14 hS6, S9, S34, S36, S372626.39466.730.279101857.5360.518231.32
15–24 hS7, S9, S14, S32, S37
Table 5. Optimal power procured from the upstream network and renewable generation.
Time (h)Pupst (kW)PPVt,i (kW)PWindt,i (kW)
Case 1Case 2Case 3Case 4Bus 7Bus 14Bus 10Bus 33
11799.611788.581787.191786.6100235.99294.99
21827.261815.461814.321814.2800214.67268.33
31873.891861.411860.391860.5400206.67258.33
41860.191847.811846.881847.1100199.99249.99
51823.111811.181810.401810.711.011.29187.99234.99
61704.401694.381693.491693.3720.2826.09184.00230.00
71459.671452.961451.681450.7939.5050.81199.99249.98
81494.891488.261486.761485.7957.7174.22201.32251.65
91432.541426.891425.051423.8272.8293.66213.32266.65
101488.071482.111480.071478.5782.54106.16223.99279.98
111647.521639.751637.311635.6490.65116.60245.31306.64
122059.782046.152043.672042.5589.34114.91250.64313.31
132352.922334.062334.532333.7984.58108.79158.65198.32
142381.402361.742362.262361.7171.4591.90159.98199.98
152420.552399.772400.432399.7755.1770.96159.98199.97
162326.422306.762307.522306.7735.1445.19149.30186.63
172396.162374.892376.792374.8916.4521.16118.67148.33
182470.622447.572451.042447.570078.6798.34
192680.772654.082660.392654.080033.4641.83
202753.972726.122733.572726.120018.1822.73
212718.132690.952698.292690.950015.7119.64
222596.532572.062579.082572.06006.568.20
232538.062514.692521.442514.69004.795.99
242501.182478.582485.212478.58002.573.21
Table 6. Hourly optimal cost of power procured from the upstream network and renewable generation for studied cases.
Time (h)Cupnt (USD)CPVt (USD)Cwindt (USD)
Case 1Case 2Case 3Case 4Bus 7Bus 14Bus 10Bus 33
150.3850.0850.0450.02004.725.89
243.8543.5743.5443.54004.295.36
341.2240.9540.9240.93004.135.16
442.7842.4942.4742.48003.994.99
543.7543.4643.4443.450.0250.0323.764.69
642.6142.3542.3342.330.510.653.684.60
739.4139.2339.1939.171.381.783.994.99
847.8347.6247.5747.542.022.594.025.03
953.0052.7952.7252.682.553.277.469.33
1065.4765.2165.1265.052.893.717.839.79
1169.1968.8668.7668.693.174.088.5810.73
1282.3981.8481.7481.703.124.028.7710.96
1398.8298.0398.0598.022.963.805.556.94
14102.40101.55101.57101.552.503.215.596.99
15111.34110.38110.42110.382.763.547.198.99
16109.34108.41108.45108.411.752.266.718.39
17116.21115.18115.27115.180.821.055.346.67
18119.82118.71118.87118.71003.544.42
19134.04132.70133.02132.70001.501.88
20123.92122.67123.01122.67000.811.02
21103.28102.25102.53102.25000.700.88
2293.4792.5992.8492.59000.290.36
2376.1475.4475.6475.44000.170.21
2462.5361.9662.1361.96000.090.11
1873.281858.421859.751857.5326.4734.04102.81128.51
Table 7. Hourly cost of active power loss for studied cases.
Time (h)Closst (USD)
Case 1Case 2Case 3Case 4
122.1417.7317.1716.94
221.8417.1216.6616.64
322.3117.3116.9116.97
421.8116.8616.4916.58
520.6415.8715.5515.68
618.5714.5714.2114.16
715.4712.7812.2711.91
816.0013.3512.7512.36
915.6713.4112.6712.18
1017.1514.7613.9513.35
1121.2618.1517.1716.51
1229.7324.2823.2922.84
1331.6024.0624.2523.95
1432.2024.3324.5424.32
1532.9924.6824.9524.68
1630.2422.3822.6822.38
1730.5422.0322.7922.03
1831.2522.0323.4222.03
1935.4024.7227.2424.72
2036.8425.6928.6725.69
2135.9825.1128.0525.11
2232.5322.7425.5522.74
2331.1221.7724.4721.77
2430.1421.1023.7521.10
633.39476.92489.54466.73
Table 8. Comparison of COA with PSO.
MethodTime PeriodOpen SwitchesCost (USD)Closs (USD)CVD (USD)CSW (USD)Cupn (USD)CPV (USD)Cwind (USD)
PSO1–4 hS7, S11, S28, S34, S362634.58466.850.261181857.6360.518231.32
5–11 hS7, S9, S28, S34, S36
13–17 hS7, S11, S28, S34, S36
18–24 hS7, S9, S14, S32, S37
COA1–14 hS6, S9, S34, S36, S372626.39466.730.279101857.5360.518231.32
15–24 hS7, S9, S14, S32, S37
Table 9. Average and total values of EENS.
EENSCase 1Case 2Case 3Case 4
Average (MWh/year)0.61920.51060.62450.5037
Total (MWh/year)14.860212.254314.988712.0879
Table 10. Renewable generation size and location (TPC 83-bus).
DG TypeLocation (No. Bus)Size (kW)Location (No. Bus)Size (kW)Location (No. Bus)Size (kW)Location (No. Bus)Size (kW)
PV6500135005350060500
Wind18500365007150083500
Table 11. Loss reduction by the proposed COA and another reference (TPC 83-bus).
ReferencesOptimization MethodResults
Open SwitchesLoss (kW)
[41]MHBMO-SFLAS7, S14, S34, S39, S42, S55, S62, S72, S83, S86, S88, S90, S92463.28
[42]PSO-EABCOS7, S14, S34, S39, S42, S55, S62, S72, S83, S86, S88, S90, S92463.28
[43]ACOS7, S34, S39, S41, S55, S62, S72, S83, S86, S88, S89, S90, S92469.88
[44]T-MSFLAS7, S34, S39, S41, S55, S62, S72, S83, S86, S88, S89, S90, S92469.88
This workCOAS7, S14, S34, S39, S42, S55, S62, S72, S83, S86, S88, S90, S92463.28
Table 12. Comparison results for the studied cases (TPC 83 bus).
CaseTime PeriodOpen SwitchesCost (USD)Closs (USD)CVD (USD)CSW (USD)Cupn (USD)CPV (USD)Cwind (USD)
124 hS84, S85, S86, S87, S88, S89, S90, S91, S92, S93, S94, S95, S9618,751.932223.80.813015,861.9151.32514.05
224 hS7, S14, S34, S39, S42, S55, S62, S72, S83, S86, S88, S90, S9218,455.351936.60.3641815,835.1151.32514.05
324 hS1, S6, S29, S86, S66, S88, S89, S90, S91, S92, S94, S95, S9618,574.612054.50.603815,846.1151.32514.05
41–19 hS7, S34, S39, S41, S55, S62, S72, S83, S86, S88, S89, S90, S9218,378.231866.10.3681815,825.3151.32514.05
20–24 hS7, S14, S34, S39, S42, S55, S62, S72, S83, S86, S88, S90, S92
Disclaimer/Publisher’s Note: The statements, opinions and data contained in all publications are solely those of the individual author(s) and contributor(s) and not of MDPI and/or the editor(s). MDPI and/or the editor(s) disclaim responsibility for any injury to people or property resulting from any ideas, methods, instructions or products referred to in the content.