Abstract
Various plastics and biomass wastes, such as polypropylene (PP), low- or high-density polyethylene (LDPE/HDPE), and lignin, have become some of the most concerning wastes nowadays. In this context, this study aimed to investigate the possibility of applying thermochemical processes for the valorization of these materials. The experiments were carried out using a thermogravimetric analyzer on individual plastic and lignin samples and their mixtures at different mass ratios of 1:1, 1:2, 1:3, and 1:4. The gaseous products evolved during the pyrolysis process were analyzed by combined thermogravimetric and Fourier-transform infrared spectroscopy (TG-FTIR) and chromatography-mass spectrometry (Py-GC/MS) to analyze the functional groups and chemical composition of the obtained pyrolysis products. The results showed that the main functional groups of lignin monitored by TG-FTIR were aromatic and aliphatic hydrocarbons, while all plastics showed the same results for hydrocarbons. The investigation confirmed that mixing these types of plastics with lignin at different mass ratios led to increased recovery of higher-value-added products. Py-GC/MS analysis showed that the greatest results of compound recovery were achieved with lignin and LDPE/HDPE mixtures at 600 °C. At this temperature and with a mass ratio of 1:3, the plastic’s radicals enhanced the depolymerization of lignin, encouraging its wider decomposition to hydrocarbons that can be applied for the production of value-added chemicals and bio-based energy.
1. Introduction
For the last decades, various plastics have made massive contributions in nearly every human activity, such as medicine, agriculture, transportation, and even in households []. Therefore, increased plastic demand and improper utilization of its waste has become one of the most environmentally concerning problems all around the world. Plastics, mainly polypropylene (PP) and low- and high-density polyethylene (LDPE and HDPE), are widely used in manufacturing and the service industry for different kinds of applications []. Despite the rapidly growing distribution, only a few percent of plastic waste are being recycled properly, while the greater part is landfilled or incinerated with municipal waste []. Unfortunately, plastic waste is not the only worldwide environmental problem that causes pollution. Lignin is one of the main components of lignocellulosic biomass, which during the past couple of years has become another rapidly increasing industrial waste. In many manufacturing processes, such as papermaking, lignin is separated from other lignocellulose components as it is a very stable polymer that cannot be easily processed and becomes non-degradable [].
According to statistics, 57% of the significant polymer waste constitutes LDPE, PP, and HDPE as they also have the largest usage because of their light weight, durability, and cheaper processing cost []. Based on Yueqing Ren et al. [], these types of plastics are classified as a thermoplastics that have low-temperature impact resistance as they are linear macromolecules, in which atoms and molecules are connected end-to-end to form a sequence of long, single carbon chains. Therefore, they cannot change their chemical structure when heated or molded multiple times. For this unique quality, these plastics are commonly used in main industries, such as in agriculture to cover greenhouses, in manufacturing and packaging, or even in medicine. Unfortunately, the enormous usage of plastic has led to almost a worldwide catastrophe of pollution. It is estimated that nearly 30% of total waste is disposed and landfilled in Europe []. As these types of plastics mainly consist of petroleum products, which are chemically composed of hydrocarbons and usually include additives like antioxidants, stabilizers, or even colorants, their incineration might release toxicants that incorporate cadmium or chloride. Additionally, plastics have the feature of long-lasting decomposition, which causes these toxic substances to contaminate the biosphere for an inadequate amount of time []. Studies on plastic pollution reveal that when microplastics are devoured, they start to amass in the tissues of organisms, and this phenomenon mostly affects fish; therefore, there is an everyday risk that through polluted water or aquatic animals the human body can be damaged, as the released toxins can cause cancer, immune and hormonal system problems, or even birth abnormalities [].
Along with plastic, there is less detrimental, however rapidly growing, lignin waste. It is an industrial waste usually formed during the course of wood processing or can be collected from agricultural residues. Lignin is one of the components of lignocellulose; however, it is not that adaptable compared to other components, such as cellulose or hemicellulose, due to its complex structural characteristics []. It has been estimated that approximately 150 billion tons of lignin are being produced worldwide and almost 95% of the generated lignin waste after manufacturing processes is directly distributed into rivers or simply combusted []. Therefore, management and utilization of lignin waste involve serious problems.
Energy recovery from plastic and lignin wastes might be a promising solution for utilizing waste and reclaiming higher-value-added products as all of these materials have some significant properties that might be used to recover alternative energy and chemical products []. Based on numerous papers, the co-pyrolysis of plastics and lignin is wildly applied due to it being a simple, environment-friendly, and low-cost efficient method []. Pyrolysis is a commonly used thermochemical conversion technology that produces three main products, such as the solid fraction (biochar), a liquid fraction (bio-oil), and a mixture of gases, depending on the process conditions. According to the literature on the pyrolysis behaviors of different plastics and lignin mixtures using micro-scale thermogravimetry [], lignin via thermochemical treatment can decompose into aromatic hydrocarbons as it is structurally enriched with phenylpropane units. These abundant hydrocarbon groups can be used as a precursor for fuel production and may also be adapted in the pharmaceutical or chemical sphere []. Unfortunately, the yield of lignin pyrolysis products can be quite low as they are prone to repolymerize; therefore, it was estimated that the addition of microplastics such as LDPE could modify the distribution of hydrocarbons and enhance the production yield to its highest potential []. Moreover, according to Wei Jin et al. [], the distribution of hydrocarbons can be defined by the temperature. It was assumed that, by increasing the temperature, the range and amount of these compounds would expand during the co-pyrolysis of lignin and LDPE. Scientists indicate that the most significant temperature to produce hydrocarbons during micro-thermal analysis is 600 °C, at which the largest range of these compounds’ distribution was detected. Authors Liangliang Tao et al. [] investigated that lignin alone might not fully degrade even at a high temperature. The reason for this phenomenon could be the remaining material of carbon deposition; therefore, it was investigated that the addition of LDPE, as a hydrogen donor, could decrease carbon deposition and increase lignin’s degradation rate [].
Based on the literature, co-pyrolysis of the corresponding materials accelerates pyrolysis reactions and might change the composition of compounds. However, not all investigations of plastic, especially PP or HDPE, and lignin co-pyrolysis have considered the analysis of various recovered products from their mixtures. The scientific novelty of this study is to expand the existing knowledge and address the gap in the literature regarding product formation during the co-pyrolysis of specific plastics and lignin. Therefore, in this study, the main aim was to explore the interaction between lignin and plastics such as PP, LDPE, and HDPE for pyrolysis tests and chemical composition analysis by applying thermogravimetry to analyze the mass and temperature range changes. Moreover, evaluating the composition of the formed volatile products using the combined system of thermogravimetry and FTIR was also incorporated. Additionally, to investigate the physical products, pyrolysis tests were also performed using Py-GC/MS, and to determine the possibilities of recovering higher-value-added products from waste and their facilities to be applied in different types of bio-based industrial fields. The aim of applying the PY-GC/MS technique was to analyze the chemical composition of the products and assess the potential for recovering high-value compounds. Additionally, different plastic substrates were compared to gain deeper insights. These data fill the gap in knowledge of different plastics selected as co-pyrolysis substrates for lignin, expanding the knowledge of plastic waste utilization for higher-value-added product recovery.
2. Methods and Materials
2.1. Characterization and Preparation of Feedstock
For this analysis, plastic wastes such as PP, LDPE, and HDPE were supplied by the waste recycling company “Ekobazė” from Vilnius, Lithuania. These plastic samples were different types of packaging, such as canisters, containers, or plastic rolls, pressed into small, approximately 1 cm diameter pellets (Figure 1). Before applying any experimental treatment, all plastics were milled to particle size using a cryogenic ball mill (Retzsch GmbH, Hann, Germany) (Fritsch pulverisette 0). Each sample was ground for 10 min, keeping the 3 mm amplitude to achieve powder consistency. Lignin was collected from a paper manufacturing company in Lithuania. As it has almost 60% moisture in its structure, a 2V–151 dryer (“Büchi”, Flawil, Switzerland) (was used for the first feedstock processing to eliminate the greater part of the moisture before applying the thermal treatment.

Figure 1.
Visualization of the plastic samples before milling.
Moreover, as a co-pyrolysis component, lignin was collected from a paper manufacturing company in Kedainiai, Lithuania (Figure 2). As it has almost 60% moisture in its structure, a 2V–151 dryer was used for the first feedstock processing to eliminate the greater part of the moisture before applying the thermal treatment.
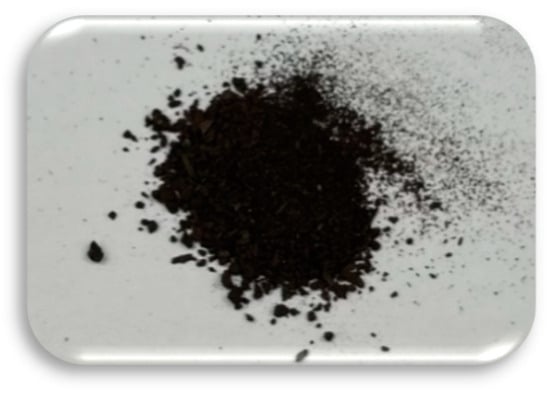
Figure 2.
Visualization of the lignin sample.
The ultimate analysis of individual plastics was also incorporated and is presented in Table 1. Elemental analysis was performed to assess the nitrogen (N), sulfur (S), carbon (C), and hydrogen (H) contents in the samples using a Flash 2000 CHNS analyzer (“Thermofisher scientific”, Milan, Italy) with all results reported on an as-received basis, which means that the feedstock for the samples was not affected by any process before the measurements. Furthermore, the calorific value was determined using an IKA C5000 calorimeter (“IKA”, Staufen, Germany), following the LST EN 14918 standard []. The results showed that carbon was the highest compositional element in all samples—about 80 wt.% for all of the plastics. Another high compositional element was hydrogen, containing almost 14 wt.% for LDPE and PP and 14.37 wt.% for HDPE. However, there was not too much nitrogen content in all of the samples, except PP, which had 0.22 wt.%. The oxygen content was calculated based on Equation (1). The oxygen content for all samples was low—3.75% and 3.74% for LDPE and PP samples, respectively, and only 1.9% for HDPE. As all samples do not contain a lot of sulfur, they can be used for the production of gaseous products and, also, they can be adapted for fuel production as they mainly consist of carbon.
O2 = 100% − C − H − N − S − Cl − Ash

Table 1.
Ultimate analysis of plastic waste.
Proximate analysis of individual feedstocks was examined, and the results are presented in Table 2. The proximate analysis was conducted according to LST EN 15148 [] for volatile content, LST EN 14775 [] for ash content, and LST EN 14774–1 [] for moisture content. The feedstocks for this analysis were not treated by any form of processes before the measurements—the results are outlined on an as-received basis. The performed experiments with lignin showed that it contains 1.59% moisture and only 41.77% volatile matter. During the pyrolysis process, formed fixed carbon reached 30.44% of the content, and after combustion, 26.15% was left. Therefore, it can be claimed that, in lignin’s case, during its degradation, a lot of residue is formed. The analysis of the HDPE sample showed that no moisture or fixed carbon was detected. Additionally, almost 100% volatile matter was detected, with the absence of ash due to its degradation, with minimal formation of residue. Very similar results were obtained with the other plastics. No moisture or fixed carbon was detected in the LDPE sample, only 99.78% volatile matter with a slightly higher percent of ash—0.22. The PP sample, on the other hand, showed slightly higher contents of ash and fixed carbon, reaching 2.13% and 1.21%, respectively, with 96.66% volatile matter.

Table 2.
Proximate analysis of lignin and plastic.
2.2. Thermal Analysis by TG-FTIR System
The selected and prepared feedstocks and their mixtures were used as samples for further experiments and the overview of the applied analysis methods in this research is presented in Figure 3.
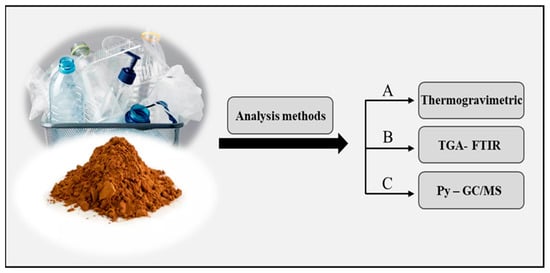
Figure 3.
Flowchart of the current research methodologies.
Thermal analysis at the micro scale (A) of selected feedstocks was performed using a Netzsch Jupiter STA 449 F3 thermogravimetric analyzer produced in Selb, Germany, which is designed for precise measurements of mass changes as a function of temperature and time. The individual lignin and plastic materials and their mixtures were analyzed by detecting their thermal behaviors and decomposition points. PP, LDPE, HDPE, and lignin were analyzed using 10–15 mg of each sample, keeping the proportions of 1:1, 1:2, 1:3, and 1:4, and heated in an Al2O3 crucible with an inert ambient atmosphere supported by supplying nitrogen gas into the furnace at the flow rate of 60 mL/min. The temperature was gradually increased from 40 °C to 900 °C at a heating rate of 30 °C/min. The resulting thermogravimetric curves were analyzed using NETZSCH Proteus 8.0.3 software, which allowed for the extraction of data on temperature changes and weight loss during the thermal treatment. Maximum decomposition points were identified using the DTG curves derived from the first derivative of the TGA data. To study the evolved volatile functional groups during thermal treatment, the thermogravimetric analyzer was coupled with the Bruker Tensor 27 (“Bruker”, Bremen, Germany) Fourier-transform infrared spectrometer system (TG-FTIR) (B). The FTIR system, capable of high sensitivity and resolution, was set to a spectral range of 4500–650 cm−1, with a resolution factor of 4 cm−1. During the experiment, volatile compounds released from the samples were swept into the heated FTIR gas cell, specifically at the moment when the maximum rate of gas evolution occurred during the pyrolysis process. This setup enabled real-time monitoring of the evolved functional groups.
2.3. Co-Pyrolysis Investigation by Py-GC/Ms
The Py-GC/MS system (C) was used to characterize the fast pyrolysis products of lignin, plastics, and their mixtures. The process was performed in a double-shot pyrolyzer (Frontier Laboratories EGA/PY -3030D, Koriyama, Japan) connected to a gas chromatography/mass spectrometry unit (Agilent 7890A GC/MS (“Agilent”, Santa Clara, CA, USA) system). During the experimental process, the direct pyrolysis method was applied. Direct pyrolysis was carried out at 550, 600, and 650 °C. These temperatures were chosen based on the TGA analysis, as all collected samples decomposed at 500 °C, and according to the literature [], as the highest amounts of the targeted products, such as aromatic compounds and hydrocarbons, are recovered at these temperatures. For each pyrolysis run, a precise amount of the sample was weighed into a quartz cup: 0.4 ± 0.1 mg for the mixtures and 0.3 ± 0.1 mg for the individual feedstock materials. High-purity helium was used as the carrier gas, with the split ratio set to 1:20, ensuring optimal transfer of volatiles during the experiment. The carrier gas flow was maintained at 1.5 mL/min, which efficiently transported the evolved volatiles from the pyrolyzer to the GC/MS system. The temperature of the gas transmission pipeline between the pyrolyzer and the GC injector was carefully controlled at 230 °C to prevent condensation of volatile compounds. The chromatographic separation was performed using an HP-5MS column (“Agilent”, Santa Clara, CA, USA), with the column temperature initially set to 40 °C and then ramped to 270 °C at a heating rate of 10 °C/min, which is suitable for the separation of complex pyrolysis products. The mass spectra of the volatiles were recorded within the mass-to-charge (m/z) range of 30–600. Identification of the main compounds was achieved by comparing the obtained spectra to the National Institute of Standards and Technology (NIST) mass spectral library, providing reliable compound identification. The pyrolysis process using the Py-GC/MS system (Figure 4) begins when the sample is placed in the cup attached to the sample holder. At the start of the pyrolysis process, the cup is released and falls into the preheated pyrolyzer furnace, which has been set to the chosen temperature. The gases inside the furnace are swept by the helium carrier gas, and as the sample vapors are released, a portion of these vapors is transferred through the split in the system to the gas chromatography column. The compounds are separated by an ITF needle via the GC injection port. After separation, the individual compounds are sent to the mass spectrometer, where they are identified based on the NIST mass spectra library.
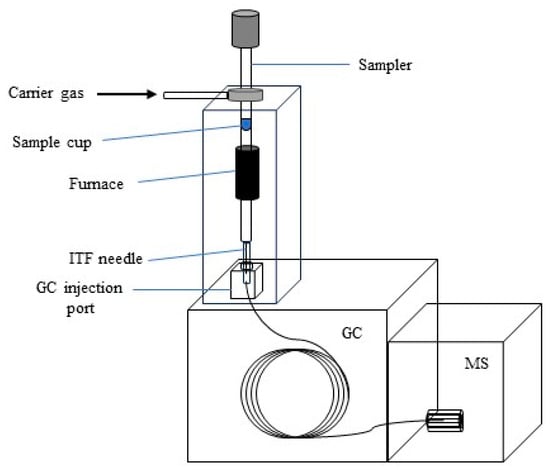
Figure 4.
Instrumentation scheme of Py-GC/MS system.
3. Results and Discussion
3.1. Micro-Thermal Analysis of Plastic and Lignin Co-Pyrolysis
In the examined temperature interval, HDPE degraded in a single mass-loss zone with one decomposition peak at 500 °C, with a mass loss of about 99 wt.% and a residual mass of 0.22 wt.% (Figure 5A). This indicated that some amount of char was formed during the decomposition process. The evaluation of LDPE showed that there were two decomposition peaks described by the DTG (Figure 5B) curve at 390 °C and 510 °C, respectively. This temperature range belongs to the decomposition of polyethylene material. The two decomposition points observed are a result of the sample comprising a mixture of various types of low-density polyethylene (LDPE), each with distinct decomposition temperatures. The mass loss in total reached almost 98 wt.%, with a residual mass of 0.69 wt.%. Analyzing the PP curve, the decomposition peak was reduced to 480 °C and the residual mass increased comparing to the other plastics, up to 2.57 wt.%. According to a previous study [], the examined PP decomposition temperature is 300–400 °C. The degradation temperature might have been increased by additives or fillers, making the material more thermally stable and leaving a greater residual mass due the non-volatile components. In addition, the obtained TGA curve of lignin (Figure 5A) showed a slight weight loss range from 65 °C to 190 °C, with the mass loss of almost 4 wt.%, which represented the evaporation of moisture. The curve itself was divided into one more mass loss zone corresponding to temperature and a mass loss of about 40 wt.% between 190 °C and 760 °C, with the residual mass of char of 53 wt.% at 900 °C. As claimed by Manara et al. [], the mass loss that occurs after moisture evaporation is related to the purity of the material and the proportions of β-O-4 bonds. These bonds in lignin’s structure are responsible for its thermal stability. Therefore, when lignin is not pure enough to decompose into carbohydrates, the higher the proportion of β-O-4 bonds in lignin’s structure, the more it is condensed and the less thermally stable it is []. Moreover, according to the derivative of the DTG curve (Figure 5B), the feedstock degraded with a single peak of volatile evaporation at approximately 380 °C, indicating the decomposition of lignin. Lignin is more thermally stable than other lignocellulose components; therefore, it has a wider decomposition temperature interval (from 150 °C to 900 °C), related to the cleavage of the bonds []. If lignin decomposes at a lower temperature than 300 °C, it has a low activation energy in the bonds; however, degradation at a temperature higher than 300 °C correlates with the stronger chemical bonds in its structure, which need more energy to break.
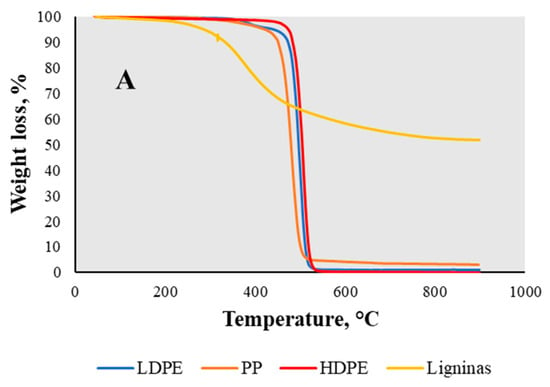
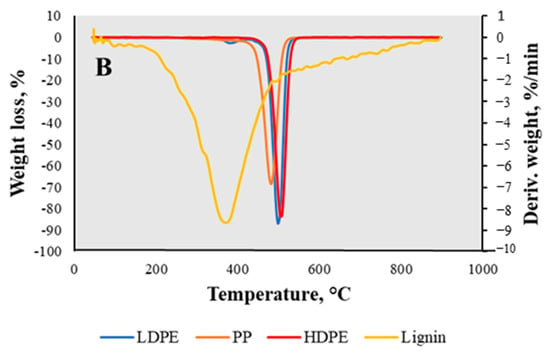
Figure 5.
TGA (A) and DTG (B) curves of lignin, LDPE, HDPE, and PP samples.
The obtained TGA and DTG curves of individual lignin, HDPE, LDPE, and PP mixtures with mass ratios of 1:1, 1:2, 1:3, and 1:4 under an inert ambient atmosphere at a 30 °C/min heating rate are presented in Figure 6. As determined by Özge Çepelioğullar et al. [], the lignocellulosic biomass tends to have a longer thermal degradation than polymers as it has more degradation stages; also, to break down the strong chemical structures, a higher temperature is needed. On the other hand, plastic materials lose almost 99% of their weight within the temperature range of 400–500 °C, unlike lignin. Comparison of the lignin and plastic mixtures with the experiments of individual feedstocks revealed the correlations between the thermal decomposition characteristics of both lignin and plastic materials. The lignin and LDPE mixture with a mass ratio of 1:1 showed a minor decomposition range in the temperature interval of 280–770 °C, with one volatile evaporation peak at 500 °C (Figure 6A). This temperature interval corresponded to the decomposition of both feedstocks as lignin has a wide decomposition temperature range and a mixture of different types of LDPE was used. The residual mass after co-pyrolysis was 29.42 wt.% of the initial weight. This could be acknowledged as the phenomenon of the plastic’s impact on lignin’s decomposition and the chemical structure’s disintegration for greater targeted product recovery. As claimed by Aleksandr Ketov et al. [], the pyrolysis of plastics such as LDPE or HDPE generates free radicals that can interact with lignin’s macromolecular structure and promote depolymerization by enhancing the decomposition of lignin. In the mixture of lignin and HDPE, no significant changes were observed: the DTG peak was noted at 510 °C, which was slightly higher than that of the LDPE mixture. The mass loss during the decomposition temperature interval was approximately 66.99 wt.%, with a residual mass of 28.59 wt.%, which was marginally lower than that seen in the LDPE mixture. Therefore, the correlation of this mixture showed a little better results in the case of decomposing lignin. However, the least applicable results were obtained with mixtures with PP. The mass change in the decomposition range of 290–760 °C was only 59.19 wt.%, with the biggest residual mass of 36.02 wt.%. On the other hand, the decomposition peak temperature of the mixture was slightly lower—490 °C. Further experiments were conducted with a mass ratio of 1:2 (Figure 6B). With this mass ratio, the case of the mixtures of lignin with HDPE and PP showed very similar results as in Figure 6A. The mass change in the decomposition interval was a lot higher than when applying the mass ratio of 1:1—it was almost 75 wt.%—with a residual mass of 21 wt.% in both cases. The mixture of lignin and LDPE with this mass ratio showed slightly different results by reaching 79.68 wt.% of the mass change in the decomposition interval with a residual mass of 15.94 wt.%.

Figure 6.
TGA-DTG curves of lignin/LDPE, lignin/HDPE, and lignin/PP mixtures of 1:1 (A) and 1:2 (B) mass ratios.
The analysis of the mixtures with mass ratios of 1:3 (Figure 7A) and 1:4 (Figure 7B) shown in Figure 7 showed quite correlating results. However, for the best results of the lowest residual mass and highest mass change in the decomposition interval, both (1:3 and 1:4) mass ratios showed that the mixtures of lignin and HDPE left just 10.44 wt.% and 10.87 wt.% of the initial weight, respectively. Therefore, according to the analyzed results, in order to activate the disintegration of lignin’s chemical structure and the decomposition to targeted products such as hydrocarbons, the best applied polymer was HDPE with a mixture mass ratio of 1:4.

Figure 7.
TGA -DTG curves of lignin/LDPE, lignin/HDPE and lignin/PP mixtures of 1:3 (A), 1:4 (B) mass ratios.
3.2. TGA-FTIR Analysis of Lignin and Plastic Co-Pyrolysis
The emitted gaseous products were analyzed using a combined TGA and Fourier-transform infrared spectroscopy (FTIR) system in order to analyze the main functional groups of the individual feedstocks. The results are depicted in Figure 8. Hydrocarbons were the main volatile products that evolved during the thermal decomposition of polyethylene and polypropylene samples mainly at about 500 °C. The temperature was decided based on the DTG curves, which showed the highest emission of volatile compounds. This could be proved by the IR absorption bands at 3050–2600 cm−1, with blending vibrations in the range of 1450–1325 cm−1 indicating the formation of hydrocarbons and corresponding to aromatic and aliphatic compounds. According to Jude A. Onwudili et al. [], in addition to the volatilization process, reactions such as side chain cracking from aromatic rings, isomerization, and polycondensation take place. As a result, all volatile components of polyethylene are decomposed into volatile hydrocarbons. Moreover, analyzing lignin’s functional groups, the typical aromatic vibrations of lignin molecules were observed in the 1600–1400 cm−1 wavenumber range. Additionally, a prominent peak was also observed in the 2300 cm−1 wavenumber region, which corresponded to the vibration of CO2. Furthermore, the absorption peaks at 1750–1700 cm−1 indicated the stretching of carbonyls (C=O), indicating the presence of aldehydes and ketones. According to the obtained TG-FTIR results, the main compounds that could be recovered from individual plastics were hydrocarbons, while lignin was enriched with aromatic compounds that can be applied in different types of bio-based industrial fields.
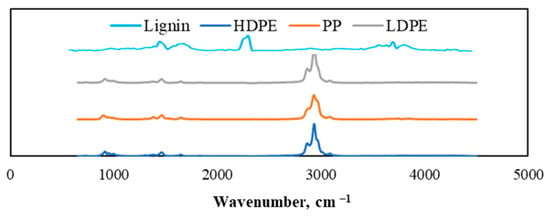
Figure 8.
TGA-FTIR spectra of generated gaseous products from pyrolyzed lignin, LDPE, HDPE, and PP individual samples.
TGA-FTIR analysis of lignin and plastic mixtures was performed, and the results are presented in Figure 9. As can be seen, they show the lignin and LDPE mixtures keeping the mass ratios of 1:1, 1:2, 1:3, and 1:4. A wider absorption peak was found in the 1400 cm−1 wavenumber region that corresponded to aromatic vibrations, which was not very notable in the individual FTIR spectra of lignin and LDPE. Moreover, the absorption peak of aromatic hydrocarbons in the 3050 cm−1 wavenumber region was also promoted by the co-pyrolysis process. This confirmed that the addition of LDPE significantly promoted the production of aromatic compounds during lignin pyrolysis. Comparing the results of different mass ratios, the tendency was obvious that the more plastic (more specifically LDPE) was added, the wider the absorption peak of the aromatic compounds appeared. Therefore, the optimal mass ratio of the mixture to produce the greatest amount of aromatic compounds was 1:4 lignin and LDPE, respectively.
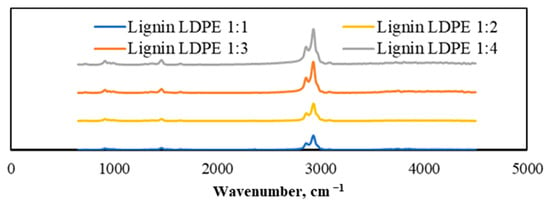
Figure 9.
TGA-FTIR spectra of generated gaseous products from pyrolyzed lignin and LDPE mixtures with different mass ratios.
A similar tendency occurred in the lignin and HDPE mixture case presented in Figure 10. The co-pyrolysis of lignin and HDPE often also showed enhanced hydrocarbon production. Lignin, which is rich in oxygen, created an environment that facilitated the decomposition of HDPE, directing the process toward the formation of more valuable volatile products, such as aromatic hydrocarbons. The absorption peak observed at 3050 cm−1 corresponded to the presence of aliphatic and aromatic hydrocarbons. Additionally, minor oscillations around 1400 cm−1 provided further confirmation of the presence of aromatic hydrocarbons. Comparing the results of different mass ratios, the disposition was very similar to the lignin and LDPE mixture at the optimal mass ratio of 1:4, when the biggest amount of aromatic compounds was produced; however, the whole results showed lower efficiency of aromatic compound production compared with the lignin and LDPE mixtures.
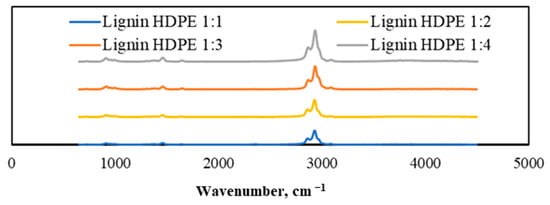
Figure 10.
TGA-FTIR spectra of generated gaseous products from pyrolyzed lignin and HDPE mixtures with different mass ratios.
Furthermore, analyzing the occurring tendency of lignin and polypropylene, the results in Figure 11 showed that the co-pyrolysis process did not promote the emission of aromatic compounds and hydrocarbons as much as in the LDPE or HDPE cases, especially with the lower content of plastic in the mixture. The absorption range at 1400 cm−1 that corresponded to aromatic vibrations was almost non-existent, and the absorption peak of hydrocarbons at 3050 cm−1 was significantly lower.

Figure 11.
TGA-FTIR spectra of generated gaseous products from pyrolyzed lignin and PP mixtures with different mass ratios.
The TGA-FTIR analysis confirmed that the addition of plastics such as LDPE or HDPE as a hydrogen source changed the distribution of products in the co-pyrolysis process. The co-feeding of plastics increased and promoted the formation of the targeted products—aromatic hydrocarbons. Unfortunately, the experiments with the lignin and PP mixtures might suggest that the existence of lignin inhibits the decomposition of PP; therefore, the probability of recovering the targeted products of aromatic compounds in this case was very low compared with the lignin and LDPE or HDPE mixtures.
3.3. Py-GC/MS Analysis of Lignin and Individual Plastics
The composition of the feedstocks for accurate determination of chemical derivatives was analyzed using Py-GC/MS analysis, where all samples were introduced into three starting temperature ranges based on the TGA-DTG analysis of the materials’ decomposition temperatures: beginning from 550 °C, up to 600 °C, and 650 °C. According to the results shown in (Figure 12A) lignin was composed of phenolic units, mainly consisting of phenol type (H-type), guaical (G-type), and hydroxyphenyl types []. The detected hydroxyphenyl and guaiacol structures were 2,4 methyl-phenol and 2 methoxy-phenol. The amounts of aromatic hydrocarbons and phenol-type compounds increased with increasing temperature. As shown in Figure 12A, the phenolic compounds reached 14.79% at 550 °C and, by increasing the pyrolysis temperature to 600 °C, the major aromatic compounds increased up to 28.93%. However, at the 650 °C temperature range, none of these phenolic units were detected, as the demethoxylation and alkylation reactions occurred at higher pyrolysis temperature, causing a decrease in aromatic compound formation []. Therefore, based on the analysis results, the optimal temperature for recovering aromatic compounds was 600 °C. The main abundance of phenol compounds caused by increasing the temperature was the guaiacol type, but the formation of phenol increased. Therefore, it can be proposed that, via the demethoxylation reaction, phenol, 2-methoxy type can produce phenol with increased temperature.
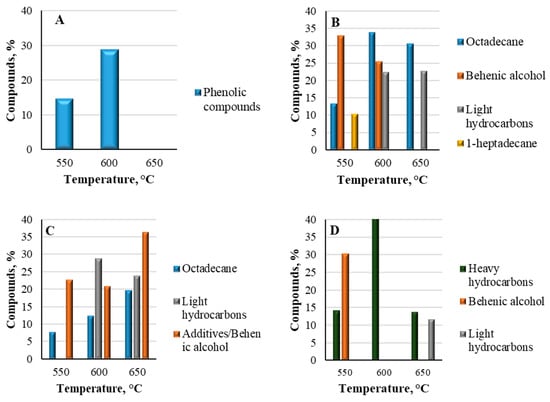
Figure 12.
Py-GC/MS compounds generated from pyrolyzed lignin (A), LDPE (B), HDPE (C) and PP (D) samples.
Analyzing the fast pyrolysis results of plastics showed that they all contained light hydrocarbons that consisted of 1 to 14 carbon atoms and heavy hydrocarbons having more than 20 carbon atoms in their chemical structures. Individual LDPE (Figure 12B) at 550 °C consisted mostly of heavy hydrocarbons ranging from light gases to long chain waxy compounds, such as 1-heptadecene and 1-octadecane, reaching 10.27% and 13.33% respectively. These high-molecular-weight hydrocarbons reflected the incomplete breakdown of the polymer chains. Moreover, another highly elevated compound was behenic alcohol, containing almost 32.78%. Behenic alcohol, as one of the structural components, is usually used to enhance the texture and appearance of the products; also, it might be used as thickener or stabilizer to regulate the viscosity []. By increasing the temperature range up to 600 °C, some changes were detected. The amount hydrocarbons increased more than twice—up to 33.69% of octadecanes; however, 1-heptadecanes were not detected at all. The main reason for this tendency was the decomposition process of high-molecular-weight compounds into low-molecular-weight compounds, which was initiated by the increased temperature and heat flux. At this temperature range, more light hydrocarbons also formed, such as 1-hexene, 1-nonene, and 1-heptane, making up 22.34% of all formed compounds. These hydrocarbons resulted from the random cleavage of C-C bonds in the polymer backbone []. In addition, the amount of behenic alcohol at this temperature also decreased to 25.39%. At a temperature of 650 °C, the quantity of octadecanes slightly decreased to 30.56%, 1-hepatdecanes and behenic alcohol were also not detected, but the amount of light hydrocarbons slightly increased to 22.55%. However, cyclohexane 1,1′-(2-methyl-1,3-propanediyl)bis-compound appeared and reached 25.62%. This component also works as a plasticizer and improves the flexibility of polymers. Overall, the analysis indicated that the optimal temperature for the compound recovery process was 600 °C, as this resulted in the highest yield of targeted products.
Furthermore, the experiments were performed across the same temperature ranges with another polymer, HDPE (Figure 12C). At a starting temperature of 550 °C, the main compounds were identified as hydrocarbons, such as 13-octadecenal, (Z), reaching 7.72%, and were the same as for LDPE, including cyclohexane compounds and oxyrane, hexadecyl-, which are used for enhancing the structural properties of polymers, reaching 10.84% and 11.78%, respectively. At this temperature, no light hydrocarbons were detected. With the increased temperature of 600 °C, the quantity of light hydrocarbons increased to 28.68%. Moreover, hydrocarbons such as 1-octadecane reached 12.26%, while the additive compounds such as behenic alcohol reached 20.86%. With the temperature increased to 650 °C, the quantity of heavy hydrocarbons increased to 19.53%. Furthermore, the formation of light hydrocarbons slightly decreased to 23.69%. The main additive components of behenic alcohol also increased to 36.26%. According to the obtained results, the optimal temperature for the highest recovery of product quantities for HDPE was 650 °C, unlike the previously analyzed LDPE case.
Moreover, the analyzed PP sample (Figure 12D) showed quite similar results. The feedstock mainly consisted of various hydrocarbons and additives for structural improvement. At 550 °C, the main formed hydrocarbons were 1-pentadecane, 1-heptadecane, and 1-nonadecane, reaching 14.3%. As in the previous analysis of different plastics, the main formed compound was additive behenic alcohol, comprising 30.23% of all formed compounds. By increasing the temperature up to 600 °C, the formation of heavy hydrocarbons increased to 40.78%. No light hydrocarbons were detected at any lower temperature. Finally, analyzing the samples at 650 °C, the quantity of hydrocarbons heavily decreased to only 13.8%. However, a slight formation of light hydrocarbons, such as heptane, propene, and 2-butene, occurred with 11.66%. Therefore, the main products of hydrocarbons formed at their highest quantities at 600 °C. According to the results obtained from the Py-GC-MS analysis, the optimal temperature for all samples was 600 °C as it produced the greatest amounts of targeted products, such as aromatic phenolic compounds in the case of lignin and various hydrocarbons in the case of all plastic wastes.
3.4. Py-GC/Ms Analysis of Lignin-Plastic Co-Pyrolysis
The experiments were performed with the lignin and different plastic mixtures with the same mass ratios of 1:1, 1:2, 1:3, and 1:4 at different temperatures starting from 550 °C to 650 °C. The results are depicted in Figure 13. The main compounds identified at each mass ratio were similar and correlated. The combination of heavy hydrocarbons, mainly octadecane and 1-heptadecane, and light hydrocarbons, such as heptane, octene, butene, or pentene, were the main targeted products of all mixtures at different temperatures and mass ratios. At a starting temperature of 550 °C with a mass ratio of 1:1, the recovery of hydrocarbons from the lignin and LDPE mixture (Figure 13A) was 20.72% of all identified compounds. However, the results obtained with the mixture of lignin and HDPE (Figure 13B) under the same conditions were quite different. The same compounds were identified; however, the total quantity was only 13.32%. Nevertheless, the mixture of lignin and PP (Figure 13C) showed quite similar results as the lignin/LDPE mixture. The quantity of hydrocarbons decreased down to 13.98% with a mass ratio of 1:1. By adding more plastic to the mixture and increasing the mass ratio up to 1:2 and 1:3, the quantities of hydrocarbons increased up to 15.99% and 19.75%, respectively, and with a mass ratio of 1:4, the quantity of hydrocarbons increased to 32.92%. The mixtures of lignin/LDPE and lignin/HDPE with the same mass ratios also showed quite correlating results, increasing to 24.71% and 14.69%, respectively, with a mass ratio of 1:2. Increasing the mass ratio to 1:3, the quantities of hydrocarbons also increased up to 33.27% and 20.89%, respectively. With the same mixtures applying the mass ratio of 1:4, the quantities of hydrocarbons increased up to 33.42% and 35.33%, respectively. Lower hydrocarbon yields in mixtures with lower plastic contents aligned with the fact that lignin, in this case, still dominated the feedstock, leading to insufficient hydrogen availability from the plastics. As a result, lignin-derived radicals were less likely to stabilize and more prone to forming char or undergoing polymerization into larger, less volatile compounds []. Meanwhile, the increased plastic ratio reflected the optimal synergy between lignin’s aromatic precursors and the plastic’s hydrogen-rich radicals. The balance allowed efficient stabilization of lignin-derived fragments into lighter hydrocarbons.
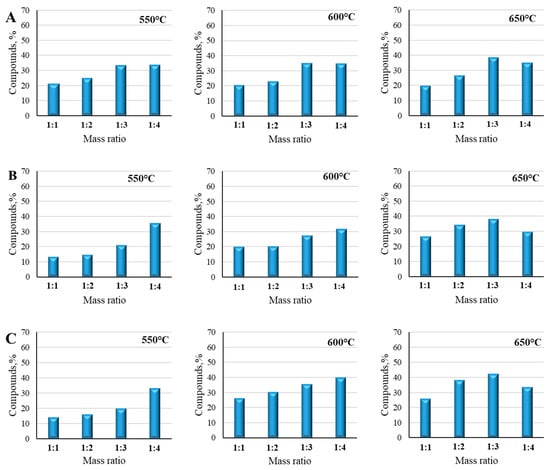
Figure 13.
Py-GC/MS compounds generated from pyrolyzed lignin/LDPE (A), lignin/HDPE (B), and lignin/PP (C) mixtures at 550 °C, 600 °C, and 650 °C temperatures.
By rising the temperature to 600 °C, the quantity of targeted products also significantly increased. The mixture of lignin and LDPE polymer with a mass ratio of 1:1 reached 20.29% of hydrocarbons. Almost identical results were found with the lignin-HDPE mixture: the discrepancies between these two sample values were negligible and reached 2–3%. The most significant results were achieved with the mixture of lignin and PP. The quantity of hydrocarbons reached 26.17% applying a mass ratio of 1:1. With mass ratios of 1:2 and 1:3, the tendency of decreased quantity of hydrocarbons was the same as at the 550 °C temperature. The quantity of hydrocarbons from the mixture of lignin and LDPE was 20.11%, and slightly more, 27.17%, with the mixture of lignin and HDPE, with mass ratios of 1:2 and 1:3, respectively. The mixture of lignin and LDPE showed quite correlating results, reaching 22.72% and 34.94% with mass ratios of 1:2 and 1:3, respectively. However, in this temperature case, the highest quantities of hydrocarbons were obtained with the lignin and PP mixtures with 1:2 and 1:3 mass ratios, reaching 36.28% and 39.31%, respectively. Moreover, when comparing these mass ratios at the 600 °C temperature with the results obtained at 550 °C, the lignin and PP mixtures showed quite different results. With mass ratios of 1:2, 1:3, and 1:4, the evaporation of hydrocarbons increased up to 30.16%, 35.91%, and 39.78%, respectively. By increasing the mass ratio up to 1:4, the quantities of hydrocarbons with the mixtures of lignin/HDPE and lignin/LDPE significantly increased up to 31.46% and 34.58%, respectively. The temperature of 600 °C optimally drove the decomposition of both lignin and plastics, producing a high number of radicals and enabling efficient interactions. Lignin-derived aromatic fragments were more effectively stabilized by plastic-derived hydrogen radicals, resulting in a peak in hydrocarbon production [].
At a final temperature of 650 °C, all mixtures showed very correlating results, elevating from 30–40% of hydrocarbons in each case. The greatest amount of hydrocarbons was obtained from the mixture of lignin and PP with a mass ratio of 1:3, reaching 42.41%. Very similar results were captured with the mixture of lignin and LDPE with the same mass ratio of 1:3. The mass ratios of lower plastic content, such as 1:2, in all mixture cases revealed the least adaptable results, reaching only 20.29%, 20.11%, and 26.17% with the mixtures of lignin and HDPE/LDPE/PP, respectively. With a mass ratio of 1:4, the greatest amount of hydrocarbons at this temperature was obtained with the mixture of lignin and LDPE, reaching 35.20% of all identified compounds; however, even with a higher plastic content, the quantity of elevated hydrocarbons decreased. This phenomenon could be explained by the impact of higher temperature, when the secondary reactions begins and over-cracking of hydrocarbons appears, and larger hydrocarbons break down into smaller volatile gases [].
The tendencies of all experiments were very similar and the synergy of co-pyrolysis products with all mass ratios at different temperatures was also correlated. The production of hydrocarbons during the co-pyrolysis of lignin and plastic mixtures is governed by complex interactions between the decomposition products of both materials, particularly through the balance of hydrogen availability from plastics and the aromatic precursors provided by lignin. Plastics, especially polyolefins, such as polyethylene (PE) and polypropylene (PP), are rich in hydrogen and break down through chain scission during pyrolysis to produce alkyl and allyl radicals. These radicals act as hydrogen donors, which are crucial for stabilizing lignin-derived radicals that would otherwise recombine into larger, less volatile structures, such as char or polyaromatic hydrocarbons []. As the plastic content increases, more hydrogen radicals are available to participate in stabilization, which enhances the formation of smaller hydrocarbons while simultaneously reducing the tendency of lignin to form char. Lignin, being a complex polymer composed of phenolic units, primarily decomposes into aromatic compounds such as phenols, guaiacols, and syringols during pyrolysis. These lignin-derived intermediates interact with plastic-derived radicals, leading to reactions that produce hydrocarbons. However, at lower plastic–lignin ratios, the hydrogen supply is insufficient to fully stabilize lignin-derived radicals, resulting in higher char yields and fewer hydrocarbons []. Furthermore, without adequate plastic content, lignin’s decomposition intermediates are more likely to undergo polymerization into large aromatic structures instead of being converted into simpler hydrocarbons. Temperature significantly influences these processes, as it affects both the extent of decomposition and the nature of radical interactions. At lower pyrolysis temperatures, such as 550 °C, lignin decomposition is incomplete, favouring the formation of char and larger aromatic fragments over smaller hydrocarbons. Plastics, at these temperatures, also only partially decompose, leading to reduced availability of hydrogen radicals. At moderate temperatures of 600 °C, both lignin and plastics decompose more fully, allowing optimal interaction between lignin-derived aromatics and plastic-derived radicals, maximizing hydrocarbon production. By increasing the temperature to 650 °C, secondary cracking reactions break down larger hydrocarbons into smaller volatile compounds, which can increase gaseous product yields at the expense of liquid hydrocarbon production []. Excessive temperatures may also lead to over-cracking, reducing the selectivity for desired hydrocarbon products.
Based on the results, the co-pyrolysis of lignin and LDPE/PP, compared with all mixtures, most dynamically promoted the decomposition of their chemical structures to produce the highest amounts of hydrocarbons, such as octadecane, that can be applied as precursors for bio-fuel production [] or used as phase-change materials for thermal energy storage [], as they have relatively high melting points. Also, it was estimated that the optimal temperature and mass ratio for greater compound recovery in mixture cases was the same as for individual materials—600 °C with a mass ratio of 1:3. According to Fujin Mo et al. [], a temperature around 600 °C favors the cracking of polymer chains and lignin’s aromatic structures, maximizing the recovery of valuable products, as lower temperatures may not fully break down the complex lignin structure while higher temperatures could limit production yields. The interaction between lignin and plastic radicals also highlights the importance of achieving the right mass ratio to maximize hydrocarbon production. Lower plastic ratios, such as 1:1 or 1:2, are limited by insufficient hydrogen availability, which reduces the stabilization of lignin-derived intermediates and promotes the formation of solid char. At a very high plastic content, like 1:4, the dilution effect can reduce lignin’s contribution to aromatic hydrocarbons, as the reactions are dominated by plastic decomposition. The optimal synergy is typically observed at a 1:3 lignin-to-plastic ratio, where the balance between lignin’s aromatic precursors and the plastic’s hydrogen radicals results in the highest hydrocarbon yields [].
4. Conclusions
This study investigated the correlations between two industrial wastes, PP, LDPE, and HDPE plastics and lignin, to determine the possibility of their utilization by applying thermochemical processes and recovering higher-value-added products. After performing all fundamental analyses of the individual materials and their mixtures using TGA-DTG, TGA-FTIR, and Py-GC/MS analyzers, it was determined that lignin has a wide range of decomposition temperatures, starting from 190 °C to 760 °C; however, even at a high temperature, lignin’s structure is not fully disintegrated, leaving a residual mass of 53 wt.%. In analyzing the plastic thermal decomposition, it was clear that all plastics decomposed at about 500 °C and almost fully cracked into volatiles. Therefore, further analysis of material mixtures performed with different mass ratios of up to 1:4 wt./wt. revealed that mixing both materials promoted the decomposition of aromatic and aliphatic compounds by radical interactions from polymers, which enhanced the depolymerization of lignin’s structure. The most significant results were achieved with the lignin and LDPE/HDPE mixtures, for which the residual mass decreased almost down to 10% with a mass ratio of 1:4.
The experiments and analysis of the Py-GC/MS experiments also confirmed that the mixtures of both materials stimulated the formation of aromatic and aliphatic hydrocarbons from lignin, most commonly heavy hydrocarbons such as octadecane. The greatest results of recovering higher-value-added products were reached at 600 °C with the lignin and LDPE/PP mixtures, applying a mass ratio of 1:3, recovering almost 40% of targeted products.
According to the obtained results, mixtures of lignin and plastics such as LDPE and PP increase the recovery of valuable products. Therefore, it can be confirmed that the pyrolysis process is a promising option for the utilization of two large industrial wastes and recovery of higher-value-added products, such as aromatic and aliphatic hydrocarbons. Lignin and plastic co-pyrolysis presents a comprehensive strategy for waste management, renewable energy generation, the synthesis of high-value chemicals, and the mitigation of environmental impacts. The integration of lignin and plastic waste feedstocks in this process facilitates the recovery of valuable resources, enhances economic viability, and contributes to environmental sustainability.
Author Contributions
V.K.: Conceptualization, Data curation, Formal analysis, Investigation, Methodology, Resources, Software, Supervision, Writing—original draft, Writing—review & editing. J.E.: Conceptualization, Data curation, Formal analysis, Investigation, Methodology, Writing—review & editing. N.S.: Conceptualization, Data curation, Formal analysis, Investigation. R.P.: Data curation, Investigation, Methodology, Formal analysis. All authors have read and agreed to the published version of the manuscript.
Funding
This work was supported by Nordic Energy Research and the Ministry of Energy of the Republic of Lithuania through the funding of Plastic Waste Conversion to Methanol Through Water Vapor Plasma Gasification and Advanced Catalytic Synthesis, 189738.
Data Availability Statement
The raw data supporting the conclusions of this article will be made available by the authors on request.
Conflicts of Interest
The authors declare no conflicts of interest.
References
- Jankowska, E.; Gorman, M.R.; Frischmann, C.J. Transforming the Plastic Production System Presents Opportunities to Tackle the Climate Crisis. Sustainability 2022, 14, 6539. [Google Scholar] [CrossRef]
- Achilias, D.S.; Roupakias, C.; Megalokonomos, P.; Lappas, A.A.; Antonakou, V. Chemical Recycling of Plastic Wastes Made from Polyethylene (LDPE and HDPE) and Polypropylene (PP). J. Hazard. Mater. 2007, 149, 536–542. [Google Scholar] [CrossRef] [PubMed]
- Lau, W.W.Y.; Shiran, Y.; Bailey, R.M.; Cook, E.; Stuchtey, M.R.; Koskella, J.; Velis, C.A.; Godfrey, L.; Boucher, J.; Murphy, M.B.; et al. Evaluating Scenarios toward Zero Plastic Pollution. Science 2020, 369, 1455–1461. [Google Scholar] [CrossRef] [PubMed]
- Tao, L.; Ma, X.; Ye, L.; Jia, J.; Wang, L.; Ma, P.; Liu, J. Interactions of Lignin and LDPE during Catalytic Co-Pyrolysis: Thermal Behavior and Kinetics Study by TG-FTIR. J. Anal. Appl. Pyrolysis 2021, 158, 105267. [Google Scholar] [CrossRef]
- Sogancioglu, M.; Yel, E.; Ahmetli, G. Pyrolysis of Waste High Density Polyethylene (HDPE) and Low Density Polyethylene (LDPE) Plastics and Production of Epoxy Composites with Their Pyrolysis Chars. J. Clean. Prod. 2017, 165, 369–381. [Google Scholar] [CrossRef]
- Ren, Y.; Sun, X.; Chen, L.; Li, Y.; Sun, M.; Duan, X.; Liang, W. Structures and Impact Strength Variation of Chemically Crosslinked High-Density Polyethylene: Effect of Crosslinking Density. RSC Adv. 2021, 11, 6791–6797. [Google Scholar] [CrossRef]
- Patel, D.; Mamtora, D.; Kamath, A.; Shukla, A. Rogue One: A Plastic Story. Mar. Pollut. Bull. 2022, 177, 113509. [Google Scholar] [CrossRef] [PubMed]
- Pham, N.T.H. Characterization of Low-Density Polyethylene and Ldpe-Based/Ethylene-Vinyl Acetate with Medium Content of Vinyl Acetate. Polymers 2021, 13, 2352. [Google Scholar] [CrossRef]
- Subaramaniyam, U.; Allimuthu, R.S.; Vappu, S.; Ramalingam, D.; Balan, R.; Paital, B.; Panda, N.; Rath, P.K.; Ramalingam, N.; Sahoo, D.K. Effects of Microplastics, Pesticides and Nano-Materials on Fish Health, Oxidative Stress and Antioxidant Defense Mechanism. Front. Physiol. 2023, 14, 1217666. [Google Scholar] [CrossRef] [PubMed]
- Khan, R.J.; Lau, C.Y.; Guan, J.; Lam, C.H.; Zhao, J.; Ji, Y.; Wang, H.; Xu, J.; Lee, D.J.; Leu, S.Y. Recent Advances of Lignin Valorization Techniques toward Sustainable Aromatics and Potential Benchmarks to Fossil Refinery Products. Bioresour. Technol. 2022, 346, 126419. [Google Scholar] [CrossRef]
- Zhao, C.; Chen, A.; Jiang, E.; Qin, L. Pyrolysis of Industrial Waste Lignin: Analysis of Product Yields and Character. Energy Sources Part A Recovery Util. Environ. Eff. 2017, 39, 458–464. [Google Scholar] [CrossRef]
- Charusiri, W.; Phowan, N.; Vitidsant, T. Pyrolysis of Lignocellulosic Biomass with High-Density Polyethylene to Produce Chemicals and Bio-Oil with High Liquid Yields. Sustain. Chem. Pharm. 2022, 25, 100567. [Google Scholar] [CrossRef]
- Eimontas, J.; Yousef, S.; Striūgas, N.; Abdelnaby, M.A. Catalytic Pyrolysis Kinetic Behaviour and TG-FTIR-GC–MS Analysis of Waste Fishing Nets over ZSM-5 Zeolite Catalyst for Caprolactam Recovery. Renew. Energy 2021, 179, 1385–1403. [Google Scholar] [CrossRef]
- Zhao, J.; Xiuwen, W.; Hu, J.; Liu, Q.; Shen, D.; Xiao, R. Thermal Degradation of Softwood Lignin and Hardwood Lignin by TG-FTIR and Py-GC/MS. Polym. Degrad. Stab. 2014, 108, 133–138. [Google Scholar] [CrossRef]
- Wang, S.; Wan, Z.; Han, Y.; Jiao, Y.; Li, Z.; Fu, P.; Li, N.; Zhang, A.; Yi, W. A Review on Lignin Waste Valorization by Catalytic Pyrolysis: Catalyst, Reaction System, and Industrial Symbiosis Mode. J. Environ. Chem. Eng. 2023, 11, 109113. [Google Scholar] [CrossRef]
- Jin, W.; Shen, D.; Liu, Q.; Xiao, R. Evaluation of the Co-Pyrolysis of Lignin with Plastic Polymers by TG-FTIR and Py-GC/MS. Polym. Degrad. Stab. 2016, 133, 65–74. [Google Scholar] [CrossRef]
- Liu, H.; Shen, Y.; Cui, C.; Zhu, L.; Zhou, Z.; Qi, F. Catalytic Co-Pyrolysis of Low-Density Polyethylene and Lignin over Cu-Modified HZSM-5: Insight with Online Photoionization Mass Spectrometry. Fuel Process. Technol. 2023, 251, 107945. [Google Scholar] [CrossRef]
- EN 14918:2009; Solid Biofuels—Determination of Calorific Value. Slovenian Institute for Standardization: Ljubljana, Slovenia, 2009.
- EN 15148:2009; Solid Biofuels—Determination of the Content of Volatile Matter. Slovenian Institute for Standardization: Ljubljana, Slovenia, 2009.
- EN 14775:2009; Solid Biofuels—Determination of Ash Content. Slovenian Institute for Standardization: Ljubljana, Slovenia, 2009.
- EN 14774-1:2009; Solid Biofuels—Determination of Moisture Content—Oven Dry Method—Part 1: Total Moisture—Reference Method. Slovenian Institute for Standardization: Ljubljana, Slovenia, 2009.
- Mourad, A.H.I. Thermo-Mechanical Characteristics of Thermally Aged Polyethylene/Polypropylene Blends. Mater. Des. 2010, 31, 918–929. [Google Scholar] [CrossRef]
- El Moustaqim, M.; El Kaihal, A.; El Marouani, M.; Men-La-Yakhaf, S.; Taibi, M.; Sebbahi, S.; El Hajjaji, S.; Kifani-Sahban, F. Thermal and Thermomechanical Analyses of Lignin. Sustain. Chem. Pharm. 2018, 9, 63–68. [Google Scholar] [CrossRef]
- Kim, J.Y.; Oh, S.; Hwang, H.; Kim, U.J.; Choi, J.W. Structural Features and Thermal Degradation Properties of Various Lignin Macromolecules Obtained from Poplar Wood (Populus albaglandulosa). Polym. Degrad. Stab. 2013, 98, 1671–1678. [Google Scholar] [CrossRef]
- Uslu, A.; Faaij, A.P.C.; Bergman, P.C.A. Pre-Treatment Technologies, and Their Effect on International Bioenergy Supply Chain Logistics. Techno-Economic Evaluation of Torrefaction, Fast Pyrolysis and Pelletisation. Energy 2008, 33, 1206–1223. [Google Scholar] [CrossRef]
- Çepelioǧullar, Ö.; Pütün, A.E. Thermal and Kinetic Behaviors of Biomass and Plastic Wastes in Co-Pyrolysis. Energy Convers. Manag. 2013, 75, 263–270. [Google Scholar] [CrossRef]
- Ketov, A.; Korotaev, V.; Sliusar, N.; Bosnic, V.; Krasnovskikh, M.; Gorbunov, A. Baseline Data of Low-Density Polyethylene Continuous Pyrolysis for Liquid Fuel Manufacture. Recycling 2022, 7, 2. [Google Scholar] [CrossRef]
- Onwudili, J.A.; Insura, N.; Williams, P.T. Composition of Products from the Pyrolysis of Polyethylene and Polystyrene in a Closed Batch Reactor: Effects of Temperature and Residence Time. J. Anal. Appl. Pyrolysis 2009, 86, 293–303. [Google Scholar] [CrossRef]
- Mo, F.; Ullah, H.; Zada, N.; Shahab, A. A Review on Catalytic Co-Pyrolysis of Biomass and Plastics Waste as a Thermochemical Conversion to Produce Valuable Products. Energies 2023, 16, 5403. [Google Scholar] [CrossRef]
- Ohra-Aho, T.; Tenkanen, M.; Tamminen, T. Direct Analysis of Lignin and Lignin-like Components from Softwood Kraft Pulp by Py-GC/MS Techniques. J. Anal. Appl. Pyrolysis 2005, 74, 123–128. [Google Scholar] [CrossRef]
- Jiang, G.; Nowakowski, D.J.; Bridgwater, A.V. Effect of the Temperature on the Composition of Lignin Pyrolysis Products. Energy Fuels 2010, 24, 4470–4475. [Google Scholar] [CrossRef]
- Kanduri, P.K.; Seethamraju, S. In Situ and Ex Situ Catalytic Co-Pyrolysis of Lignocellulosic Biomass and Plastics (Low-Density and High-Density Polyethylene) Using Spent FCC Catalyst. Waste Biomass Valorization 2023, 14, 1737–1751. [Google Scholar] [CrossRef]
- Baranitharan, P.; Elaiyarasan, U.; Sakthivel, R.; Sriariyanun, M.; Tamilarasan, N. Energy out of Waste: Kinetics and Thermolysis of Co-Pyrolysis of Biomass and Municipal Plastic Waste. Biomass Convers. Biorefinery 2024. [Google Scholar] [CrossRef]
- Serrano, D.P.; Aguado, J.; Escola, J.M.; Rodríguez, J.M.; San Miguel, G. An investigation into the catalytic cracking of LDPE using Py–GC/MS. J. Anal. Appl. Pyrolysis 2004, 74, 370–378. [Google Scholar] [CrossRef]
- Singh, M.; Salaudeen, S.A.; Gilroyed, B.H.; Al-Salem, S.M.; Dutta, A. A Review on Co-Pyrolysis of Biomass with Plastics and Tires: Recent Progress, Catalyst Development, and Scaling up Potential. Biomass Convers. Biorefinery 2023, 13, 8747–8771. [Google Scholar] [CrossRef]
- Kawamoto, H. Lignin Pyrolysis Reactions. J. Wood Sci. 2017, 63, 117–132. [Google Scholar] [CrossRef]
- Lu, X.; Gu, X. A Review on Lignin Pyrolysis: Pyrolytic Behavior, Mechanism, and Relevant Upgrading for Improving Process Efficiency. Biotechnol. Biofuels Bioprod. 2022, 15, 106. [Google Scholar] [CrossRef] [PubMed]
- Meller, E.; Green, U.; Aizenshtat, Z.; Sasson, Y. Catalytic Deoxygenation of Castor Oil over Pd/C for the Production of Cost Effective Biofuel. Fuel 2014, 133, 89–95. [Google Scholar] [CrossRef]
- Liu, L.; Niu, J.; Wu, J.Y. Formulation of Highly Stable PCM Nano-Emulsions with Reduced Supercooling for Thermal Energy Storage Using Surfactant Mixtures. Sol. Energy Mater. Sol. Cells 2021, 223, 110983. [Google Scholar] [CrossRef]
- Akubo, K.; Nahil, M.A.; Williams, P.T. Co-Pyrolysis–Catalytic Steam Reforming of Cellulose/Lignin with Polyethylene/Polystyrene for the Production of Hydrogen. Waste Dispos. Sustain. Energy 2020, 2, 177–191. [Google Scholar] [CrossRef]
Disclaimer/Publisher’s Note: The statements, opinions and data contained in all publications are solely those of the individual author(s) and contributor(s) and not of MDPI and/or the editor(s). MDPI and/or the editor(s) disclaim responsibility for any injury to people or property resulting from any ideas, methods, instructions or products referred to in the content. |
© 2025 by the authors. Licensee MDPI, Basel, Switzerland. This article is an open access article distributed under the terms and conditions of the Creative Commons Attribution (CC BY) license (https://creativecommons.org/licenses/by/4.0/).