Article

The Impact of Fixed-Tilt PV Arrays on Vegetation Growth Through Ground Sunlight Distribution at a Solar Farm in Aotearoa New Zealand

by
Matlotlo Magasa Dhlamini
1,2 and
Alan Colin Brent
1,3,*
1
Sustainable Energy Systems, Te Wāhanga a Manaia—Faculty of Science and Engineering, Te Herenga Waka Victoria University of Wellington, Wellington 6140, New Zealand
2
Energy Research Centre, Council for Scientific and Industrial Research, Pretoria 0001, South Africa
3
Department of Industrial Engineering, Centre for Renewable and Sustainable Energy Studies, Stellenbosh University, Stellenbosch 7600, South Africa
*
Author to whom correspondence should be addressed.
Energies 2025, 18(20), 5412; https://doi.org/10.3390/en18205412
Submission received: 20 August 2025 / Revised: 6 October 2025 / Accepted: 7 October 2025 / Published: 14 October 2025
(This article belongs to the Special Issue Solar Energy, Governance and CO2 Emissions)

Abstract

The land demands of ground-mounted PV systems raise concerns about competition with agriculture, particularly in regions with limited productive farmland. Agrivoltaics, which integrates solar energy generation with agricultural use, offers a potential solution. While agrivoltaics has been extensively studied, less is known about its feasibility and impacts in complex temperate maritime climates such as Aotearoa New Zealand, in particular, the effects of PV-induced shading on ground-level light availability and vegetation. This study modelled the spatial and seasonal distribution of ground-level irradiation and Photosynthetic Photon Flux Density (PPFD) beneath fixed-tilt PV arrays at the Tauhei solar farm in the Waikato region. It quantifies and maps PPFD to evaluate light conditions and its implications for vegetation growth. The results reveal significant spatial and temporal variation over a year. The under-panel ground irradiance is lower than open-field GHI by 18% (summer), 22% (spring), 16% (autumn), and 3% (winter), and this seasonal reduction translates into PPFD gradients. This variation supports a precision agrivoltaic strategy that zones land based on irradiance levels. By aligning crop types and planting schedules with seasonal light profiles, land productivity and ecological value can be improved. These findings are highly applicable in Aotearoa New Zealand’s pasture-based systems and show that effective light management is critical for agrivoltaic success in temperate maritime climates. This is, to our knowledge, the first spatial PPFD zoning analysis for fixed-tilt agrivoltaics, linking year-round ground-light maps to crop/pasture suitability.

1. Introduction

Aotearoa New Zealand is steadily working towards decarbonising its economy and is committed to achieving net-zero greenhouse gas emissions, other than biogenic methane, by 2050 [1]. To support this objective the government has also set an aspirational target of 100% renewable electricity by 2030 [2]. The target may be achieved without government support for specific electricity generation technologies. The generation investment survey commissioned by the Electricity Authority [3] indicates that nearly 60% of committed and actively pursued projects, with the intent of being commissioned by 2030, are utility-scale solar photovoltaic (PV) systems, or solar farms. These developments will increase the demand on highly productive agricultural land, which has raised concerns in the country [4].
Agrivoltaics has emerged as a promising response to this concern [4,5]. It refers to the integration of solar energy production with agricultural activity, where crops or pasture can coexist with solar arrays. By integrating solar arrays with crop cultivation or livestock grazing, agrivoltaic systems aim to optimize dual land use and improve overall land-use efficiency.
While agrivoltaics is gaining traction globally, its effectiveness in complex temperate maritime climates like Aotearoa New Zealand [6] is still being explored [7]. In situ monitoring is underway in the country [8], but little is known about how solar arrays influence ground-level light conditions and, by extension, the types of vegetation that can thrive beneath them. This gap makes it difficult for stakeholders to make informed decisions on co-locating solar farms with agriculture.

Objective of the Paper

The objective of this paper is to simulate the spatial and seasonal distribution of ground-level Photosynthetic Photon Flux Density (PPFD) beneath fixed-tilt photovoltaic (PV) arrays at Tauhei solar farm in the Waikato region of Aotearoa New Zealand. By applying real irradiance data and a custom Python-based model, the study quantifies how sunlight varies throughout the year and evaluates its impact on vegetation suitability under solar infrastructure.
This paper addresses a regional research gap by offering data-driven insights on agrivoltaics in a temperate maritime climate. It aims to inform land-use planning, crop selection, and system design by answering the following:
  • What proportion of land receives high, moderate, or low irradiance?
  • How does the fixed-tilt PV array influence the spatial and seasonal distribution of PPFD?
  • Which vegetation types are best suited to each irradiance zone?
  • What are the implications for agrivoltaic design and land-use policy in the Aotearoa New Zealand context?

2. Literature Review

2.1. Review Methodology

A scoping review methodology was applied based on the work of Arksey and O’Malley [9] and complemented by the work of Levac et al. [10] for enhanced analytical depth. The central research question was: What is known about the impacts of solar PV installations on vegetation growth, light distribution, and microclimatic modification?
The sub-questions focused on vegetation types, modelling techniques, and regional gaps. A pragmatic and inductive approach guided the process, allowing flexible integration of literature insights into modelling design. Rather than statistical meta-analysis, a narrative synthesis was used to explore how PV systems influence ecological conditions and to inform vegetation suitability under PV structures.
The search included academic and grey literature across databases such as Scopus, ScienceDirect, and Google Scholar. Search terms included combinations of “agrivoltaics”, “solar PV and vegetation”, “light distribution under solar panels”, and “microclimate under PV arrays”. Boolean operators (e.g., “AND”, “OR”) refined the queries (see Figure 1).
Of the 1300 initial documents identified, 41 were shortlisted after screening, and 36 met the final inclusion criteria. These were selected based on their relevance to themes such as shading, microclimate effects, light distribution, and relevant case studies in similar climatic regions.
The reviewed studies were published from 2021 to 2024. They span a range of geographical regions, but Europe and the United States contributed the most publications. Empirical studies and simulation-based models dominated the research landscape [11], using tools such as MATLAB R2024b, ray tracing, crop simulators, and irradiance models like PVLib and Sandia’s Solar Positioning Algorithm (SPA) [12].

2.2. Key Themes in the Literature

2.2.1. PV Impacts on Light and Microclimate

PV panels alter the surface energy balance by modifying direct and diffuse light availability [13], which in turn affects photosynthetically active radiation (PAR), photosynthesis, and microclimate variables such as temperature and humidity [14,15]. While some species adapt to shaded conditions through physiological responses like chlorophyll increase, shade-sensitive species may suffer from reduced yields or photoinhibition [16].
Soil temperature and moisture are also affected [17]. Shading can reduce evaporation and retain soil moisture [18], which benefits dry climates but may create damp microenvironments prone to fungal diseases in humid regions [19]. Drip patterns from panels further influence soil wetting and microbial activity.

2.2.2. Modelling Light Distribution Under PV Systems

Modelling tools such as ray tracing, 3D irradiance mapping, and the Solar and Longwave Radiation Model (SLRM) are widely used to simulate ground-level light dynamics [12]. Many models now account for both beam and diffuse light, especially important in bifacial PV systems [11]. Input parameters often include panel tilt, azimuth, geographic location, and cloud cover.
Recent models [20,21] also incorporate crop-specific growth responses, such as those using GECROS (Genotype-by-Environment interaction on CROp growth Simulator) or hybrid models that combine radiation physics with plant development simulations. These integrative approaches help bridge microclimate modification and ecological outcomes.

2.2.3. Vegetation Suitability Under PV Systems

Leafy vegetables (e.g., lettuce, spinach) and fruiting crops (e.g., strawberries, tomatoes) are frequently found to perform well under partial shade, with improvements in quality or water use efficiency [22]. Ornamental species like Hydrangea also show positive growth. In contrast, high-light-demand crops such as maize and wheat tend to experience yield suppression in shaded zones [16].

2.2.4. Light Availability and Photosynthetic Efficiency

Photosynthetic Photon Flux Density (PPFD), expressed in μmol/m2/s, is the key metric for assessing light availability for vegetation under PV arrays [23]. Its variability across space and time under fixed-tilt installations creates micro-zones of differing light intensities, which can be strategically matched to crop types. Shade-tolerant C3 plants with low light compensation points (<200 μmol/m2/s) are better suited for use beneath panels [24].

2.2.5. Ecological and Land-Use Implications

Agrivoltaics may support ecosystem services such as biodiversity enhancement, erosion control, and extended growing seasons by mitigating environmental extremes. However, ecological risks include compaction, disrupted pollination, and altered habitat connectivity [25]. These trade-offs underscore the importance of careful spatial design and post-installation monitoring.

2.2.6. Gaps in Current Modelling Practice

Despite growing model sophistication, several limitations persist. Many tools omit long-term ecological processes, hydrological interactions, or seasonal variability. Most are also calibrated for arid and Mediterranean climates, failing to fully capture the cloud cover, rainfall patterns, and diffuse light dominance typical of temperate maritime climates like Aotearoa New Zealand. Furthermore, pasture-specific dynamics remain underexplored in the agrivoltaics literature.

2.2.7. Pasture and Herd-Based Agrivoltaic Studies

Recent field studies show that pasture and small-ruminant production can co-exist with ground-mounted PV. In semi-arid Colorado C3 grassland, the above-ground production inside arrays was statistically indistinguishable from open controls, and simulated grazing extended late-season forage protein [26]. In a California commercial site, sheep grazed more within arrays and under-panel forage had higher digestibility/protein, informing rotation strategies [27]. Multi-year trials in Oregon reported comparable lamb growth under panels versus open pasture (~120 vs. 119 g head−1 day−1) and, in one year, higher July herbage in agrivoltaic paddocks [28,29]. Outside North America, a 70-ha permanent grassland agrivoltaic site in Ravenna, Italy, was surveyed in 2023 using transects laid perpendicular to the panel rows. Researchers repeatedly identified species and clipped biomass along these transects to capture pasture responses across the shade gradient, providing European evidence on pasture performance and management needs [30], and French sheep-grazed agrivoltaic grasslands showed shading effects on light, soil temperature, water, and forage quality across shade zones [31]. Taken together, these studies indicate that grazed agrivoltaics can sustain pasture production and animal performance—and, in dry periods, buffer water stress—while underscoring the value of resolving where and when light limits occur, which is addressed by the spatial ground irradiation and PPFD mapping in this study.

2.3. Conclusions

The reviewed literature presents a growing body of evidence on how solar PV systems influence vegetation via light availability and microclimate regulation. However, existing models are often unsuited to temperate maritime climates or long-term field conditions. The review supports the need for site-specific modelling frameworks that account for both irradiance variability and considers how much light different crops need to grow optimally under PV systems, particularly for pasture-based systems in regions such as Aotearoa New Zealand.

3. Research Methods

3.1. Research Design

A simulation-based research design was employed, with the use of computational modelling tools in Python 3.13.0 to analyze the solar radiation distribution under the PV arrays. This approach enabled a focused analysis of irradiance distribution using meteorological inputs and panel geometry. The aim was to develop a reproducible model that could be adapted for different spatial configurations and seasonal scenarios. The design also enabled the identification of irradiance gradients across the solar farm, which were then linked to potential vegetation outcomes.
The choice of a modelling-based method aligns with studies that favor predictive analysis when direct ecological observation is constrained [21]. It also facilitates scenario-based testing of light availability across time and space, enabling a virtual assessment of microclimatic effects across the landscape. Furthermore, it provides a means to examine long-term annual variability and its seasonal characteristics, which would otherwise be challenging to monitor empirically.
The study aimed to (i) simulate the spatial distribution of solar radiation beneath fixed-tilt PV panels at a solar farm; (ii) compute the shading factors affecting direct and diffuse components of irradiance using Python; (iii) estimate PPFD at ground level and interpret its implications for vegetation suitability based on published light thresholds; and (iv) examine seasonal variations in ground-level irradiance and assess zones of persistent shading and light availability.

3.2. Case Study: Tauhei Solar Farm, Waikato

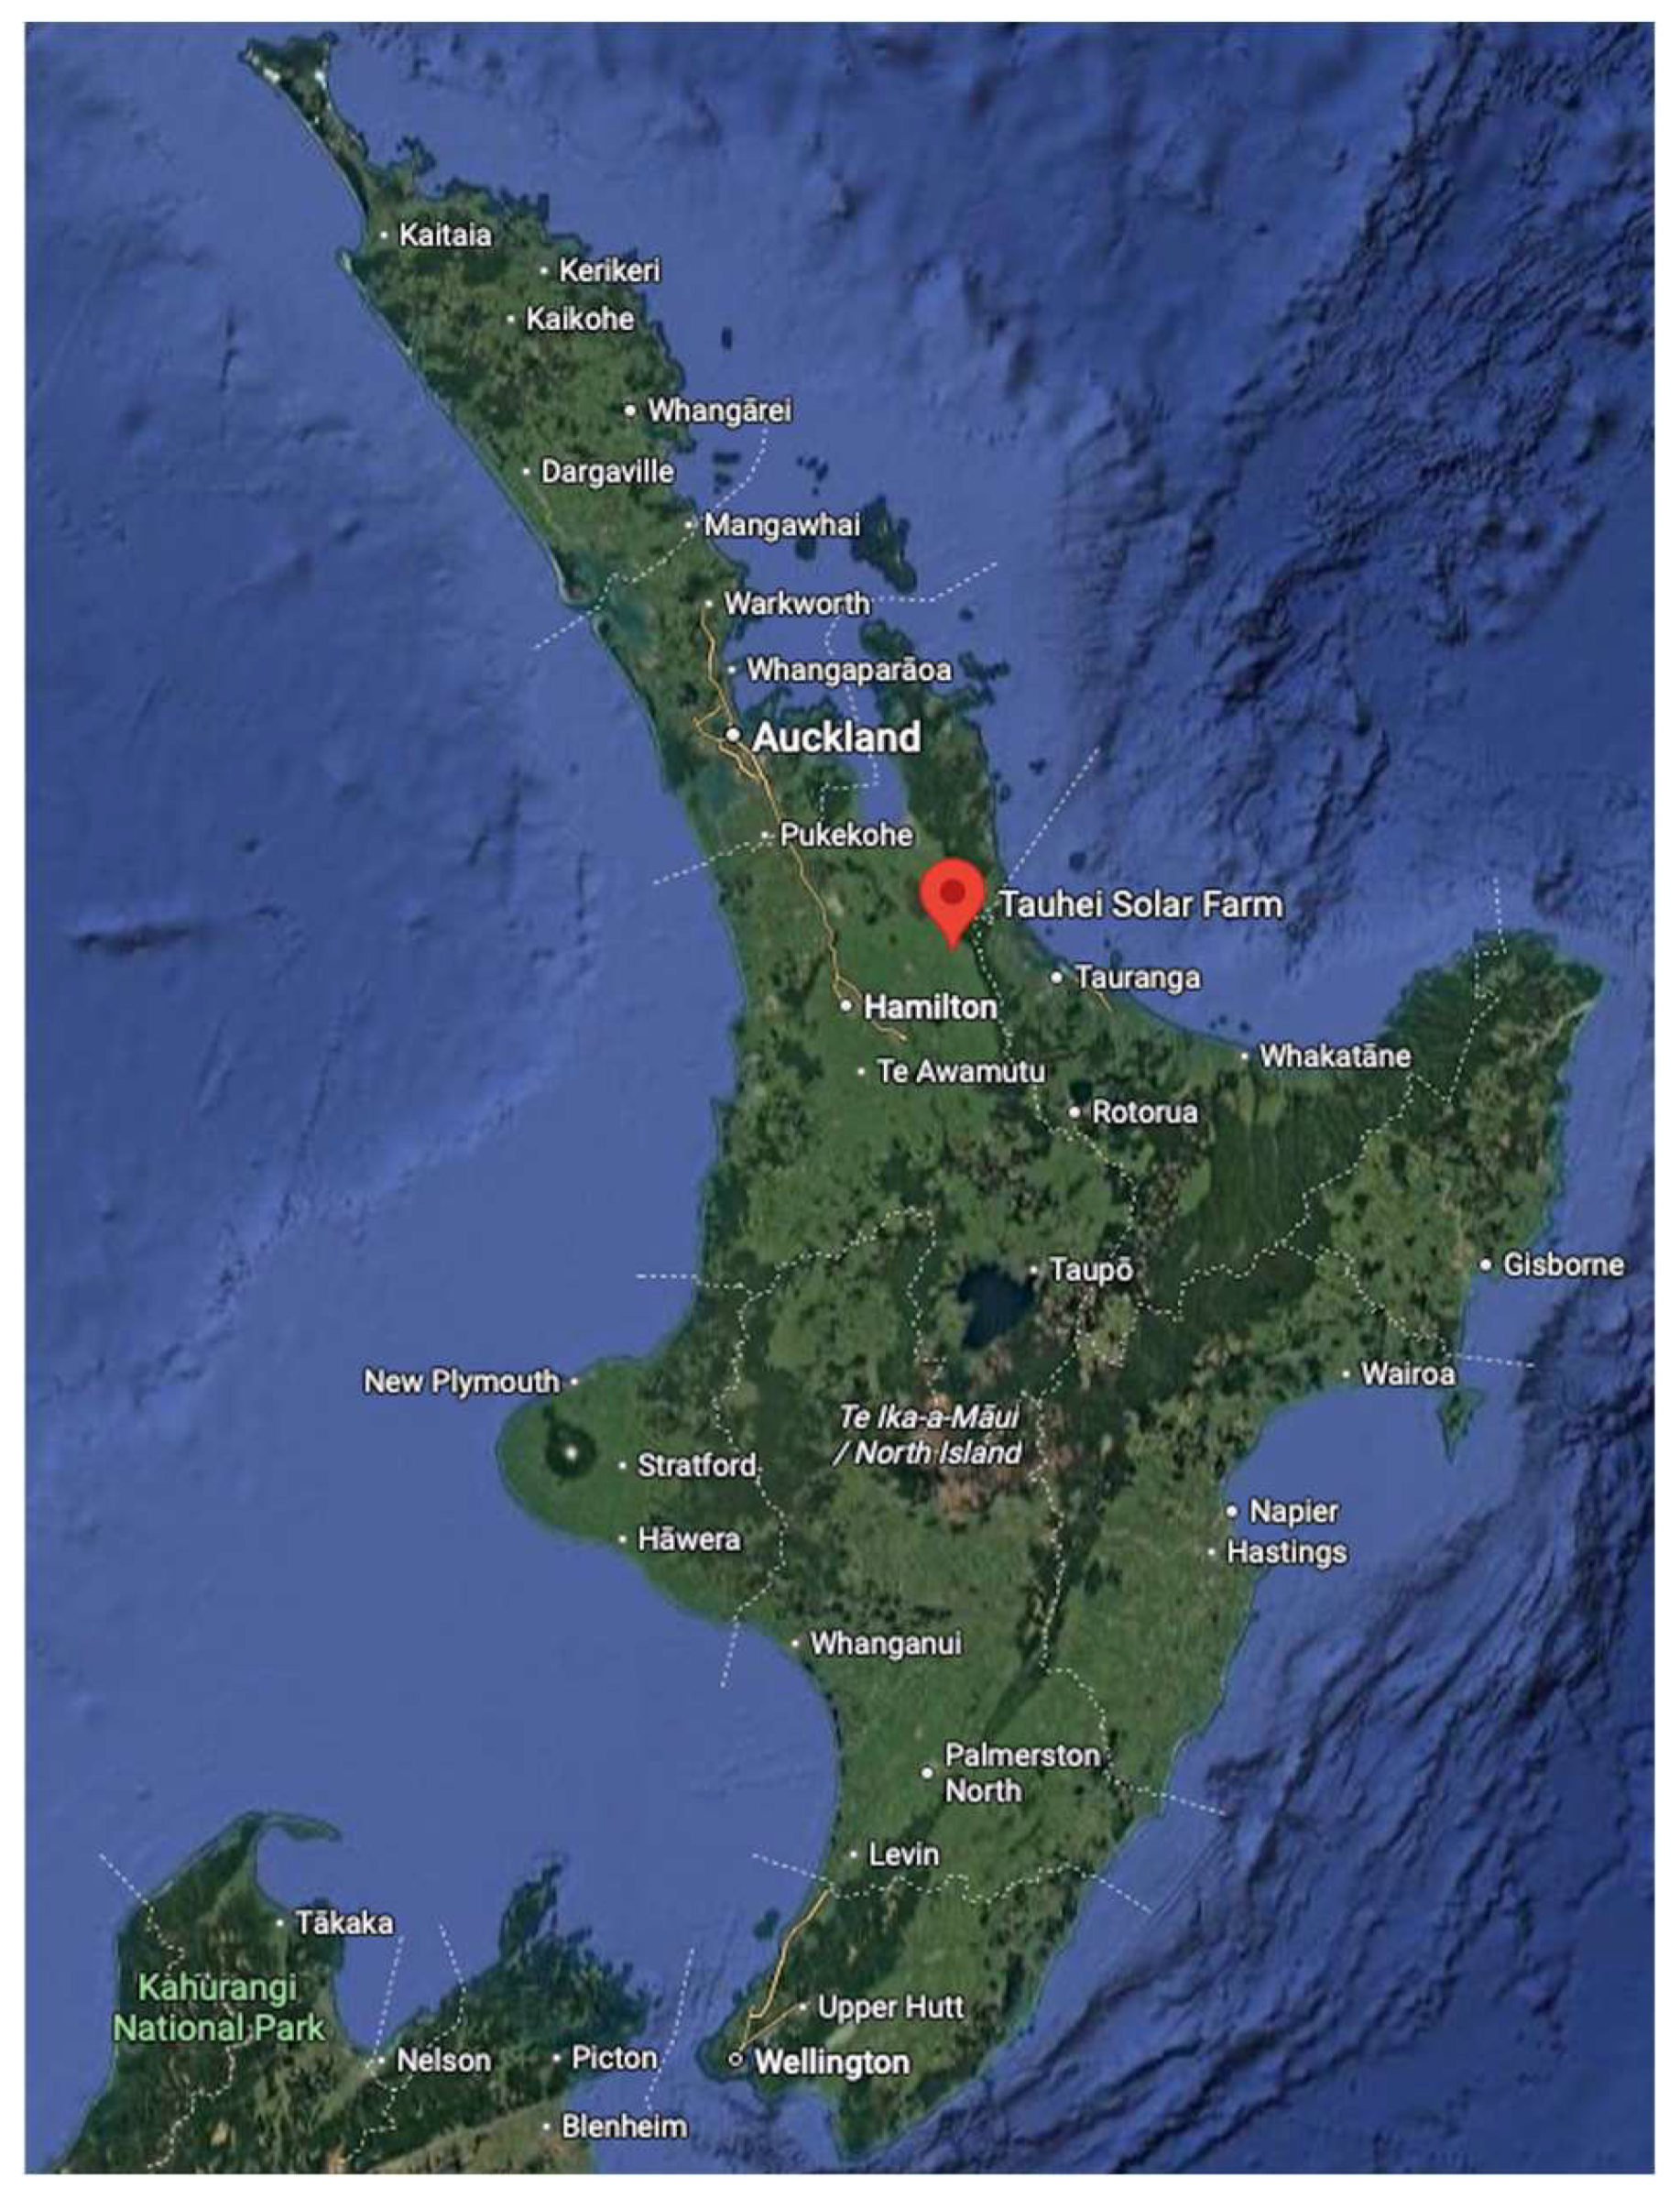
The research focused on the Tauhei solar farm, a representative case study of large-scale solar deployment in the Waikato region of Aotearoa New Zealand (see Figure 2). Details of the 147 MWAC project are provided in the resource consenting documentation [32]. The site spans 182 hectares and is expected to generate 280 GWh annually with a 202 MWP fixed-tilt bifacial PV system [33]. Although it is converting dairy farming, sheep grazing is maintained on the land, which highlights its dual-use nature.
This farm was selected because it reflects the emerging agrivoltaic landscape in Aotearoa New Zealand and provides a realistic template for future developments. Its consistent tilt and uniform layout make it ideal for spatially explicit modelling of solar irradiance. The farm’s selection was also influenced by its representative environmental conditions typical of the North Island’s central zone. These characteristics make Tauhei a suitable pilot for understanding how fixed-tilt PV systems might influence ecological processes across similar landscapes.

3.3. Modelling Approach

The modelling was conducted using Python, leveraging packages for solar geometry, trigonometric projection, and geospatial analysis. The approach simulates the movement of the sun across the sky and projects the resulting shadows cast by the PV panels onto a fixed ground study area. The calculations account for solar zenith and azimuth angles, panel tilt, and orientation. The shadow polygons are clipped against the ground area and used to derive shading factors for each hour of the year.
The simulation process was broken into key stages: (1) establishing the solar position; (2) generating panel geometry; (3) simulating shadow projection; and (4) calculating irradiance loss within the study area.

Python Model Overview

The shading and irradiance workflow in Python was implemented to (i) compute hourly ground-level irradiance beneath a fixed-tilt row, (ii) convert to PPFD, and (iii) produce seasonal maps and summary tables for decision-making.
The input to the model is the hourly 2018 irradiance and sun-position data (csv) obtained from SolarGIS (Bratislava, Slovakia), and array geometry (row length, panel tilt, height profile, and pitch).
The core steps were:
  • The study area was divided into 1 m × 1 m cells to sample light at a practical resolution.
  • For each hour, compute using sun elevation and azimuth and project the panel (polygon) onto the ground to obtain a shadow shape; intersect that shape with each grid cell to obtain the beam shading fraction per cell to obtain the shading factor.
  • Compute ground irradiance using hourly DNI and DHI from SolarGIS with the shading factor to compute the ground irradiation.
  • Render heat maps of the ground GHI as well as PPFD using relevant python libraries.
The Python tools that were used and their purpose are as follows:
  • Pandas 2.2.3: tabular data handling (read SolarGIS csv filess; time indexing; seasonal aggregation).
  • NumPy 2.2.0: fast array math for solar angles and shading matrices.
  • Shapely 2.0.6: geometric operations on polygons (shadow projection, intersection with grid cells, and area calculations).
  • GeoPandas 1.0.1: geospatial DataFrame that pairs each grid cell geometry with its computed values and makes plotting straightforward.
  • Matplotlib 3.10.0: plotting library used to render the heat maps and export publication-quality figures with consistent colour scales.

3.4. System Parameters

3.4.1. Assumptions

  • Panels are opaque and block all direct beam radiation beneath their structure.
  • Diffuse irradiance is assumed to be isotropic (evenly distributed across the sky dome).
  • Ground reflectance and albedo effects are ignored.
  • Soil and vegetation characteristics are assumed to be uniform throughout the study area.
Since the scope of the modelling is fixed-tilt arrays the aspects of tracker control (backtracking), sky-view obstruction, and albedo/reflection exchange between rows were not included.

3.4.2. Solar Array Technical Specifications

As illustrated in Figure 3, the solar arrays have the following technical specifications:
  • Array width: 4530 mm;
  • Array length (row length): 14,970 mm;
  • Panel tilt angle (β): 20°;
  • Lowest panel edge height (Hpanel): 900 mm;
  • Highest panel edge height (Hpanel, top): 2600 mm;
  • Row Spacing (pitch): 3250 mm.

3.4.3. Panel Geometry and Study Area

The zenith angle (Z) and azimuth angle (γs) of the sun were computed for each hour. The analysis area (study area) includes the ground below the panel and the adjacent pitch up to the next row. The model simulates only the target row, so row-to-row (mutual) shading is not included. The dimensions are 14.97 m (length) × 7.257 m (width), representing the horizontal ground shadow zone, with the following parameters:
  • Panel height (Hpanel): Distance from ground to the lowest panel edge.
  • Panel tilt (β): Angle between the panel surface and horizontal.
  • Solar zenith angle (Z): Angle between the sun and the vertical.
  • Solar azimuth angle (γs): Direction of the sun’s position.
  • Panel azimuth angle (γp): Orientation of the panel.

3.5. Irradiance Modelling and Shading Factors

The total global irradiation is given by:
G t o t a l = D N I + D H I
where Gtotal is the Global Horizontal Irradiation (GHI), DNI is the Direct Normal Irradiance, or beam irradiance, and DHI is the Diffuse Horizontal Irradiance.

3.5.1. Direct Beam (Direct Normal) Irradiance and Direct Beam Shading Factor

Beam irradiance (direct irradiance) is the component of sunlight that travels unimpeded in a straight line from the sun to the Earth’s surface, unaffected by atmospheric scattering. It is calculated for tilted surfaces using solar geometry and atmospheric conditions, as defined by the angle of incidence [34]:
I = I · m a x ( 0 , c o s ( θ ) s i n ( α ) )
where I is the horizontal direct irradiance, θ is the angle of incidence, and αₛ is the solar altitude.
The beam shading factor quantifies the reduction in beam irradiance due to obstructions (in this case, PV panels). The beam shading factor, fb, is the shading factor for the beam irradiance and is given by:
f b = A t o t a l A s h a d e d
where fb is the shading factor, Ashaded is the shaded area on the ground, and Atotal is the total fixed ground area considered.
This shading results in a reduction in solar irradiance reaching the ground. The irradiance loss is thus captured by adjusting the ground-level global irradiance GHIground based on the shaded fractions of both direct and diffuse radiation. This is expressed as:
G H I g r o u n d = D N I 1 f b + D H I 1 f d
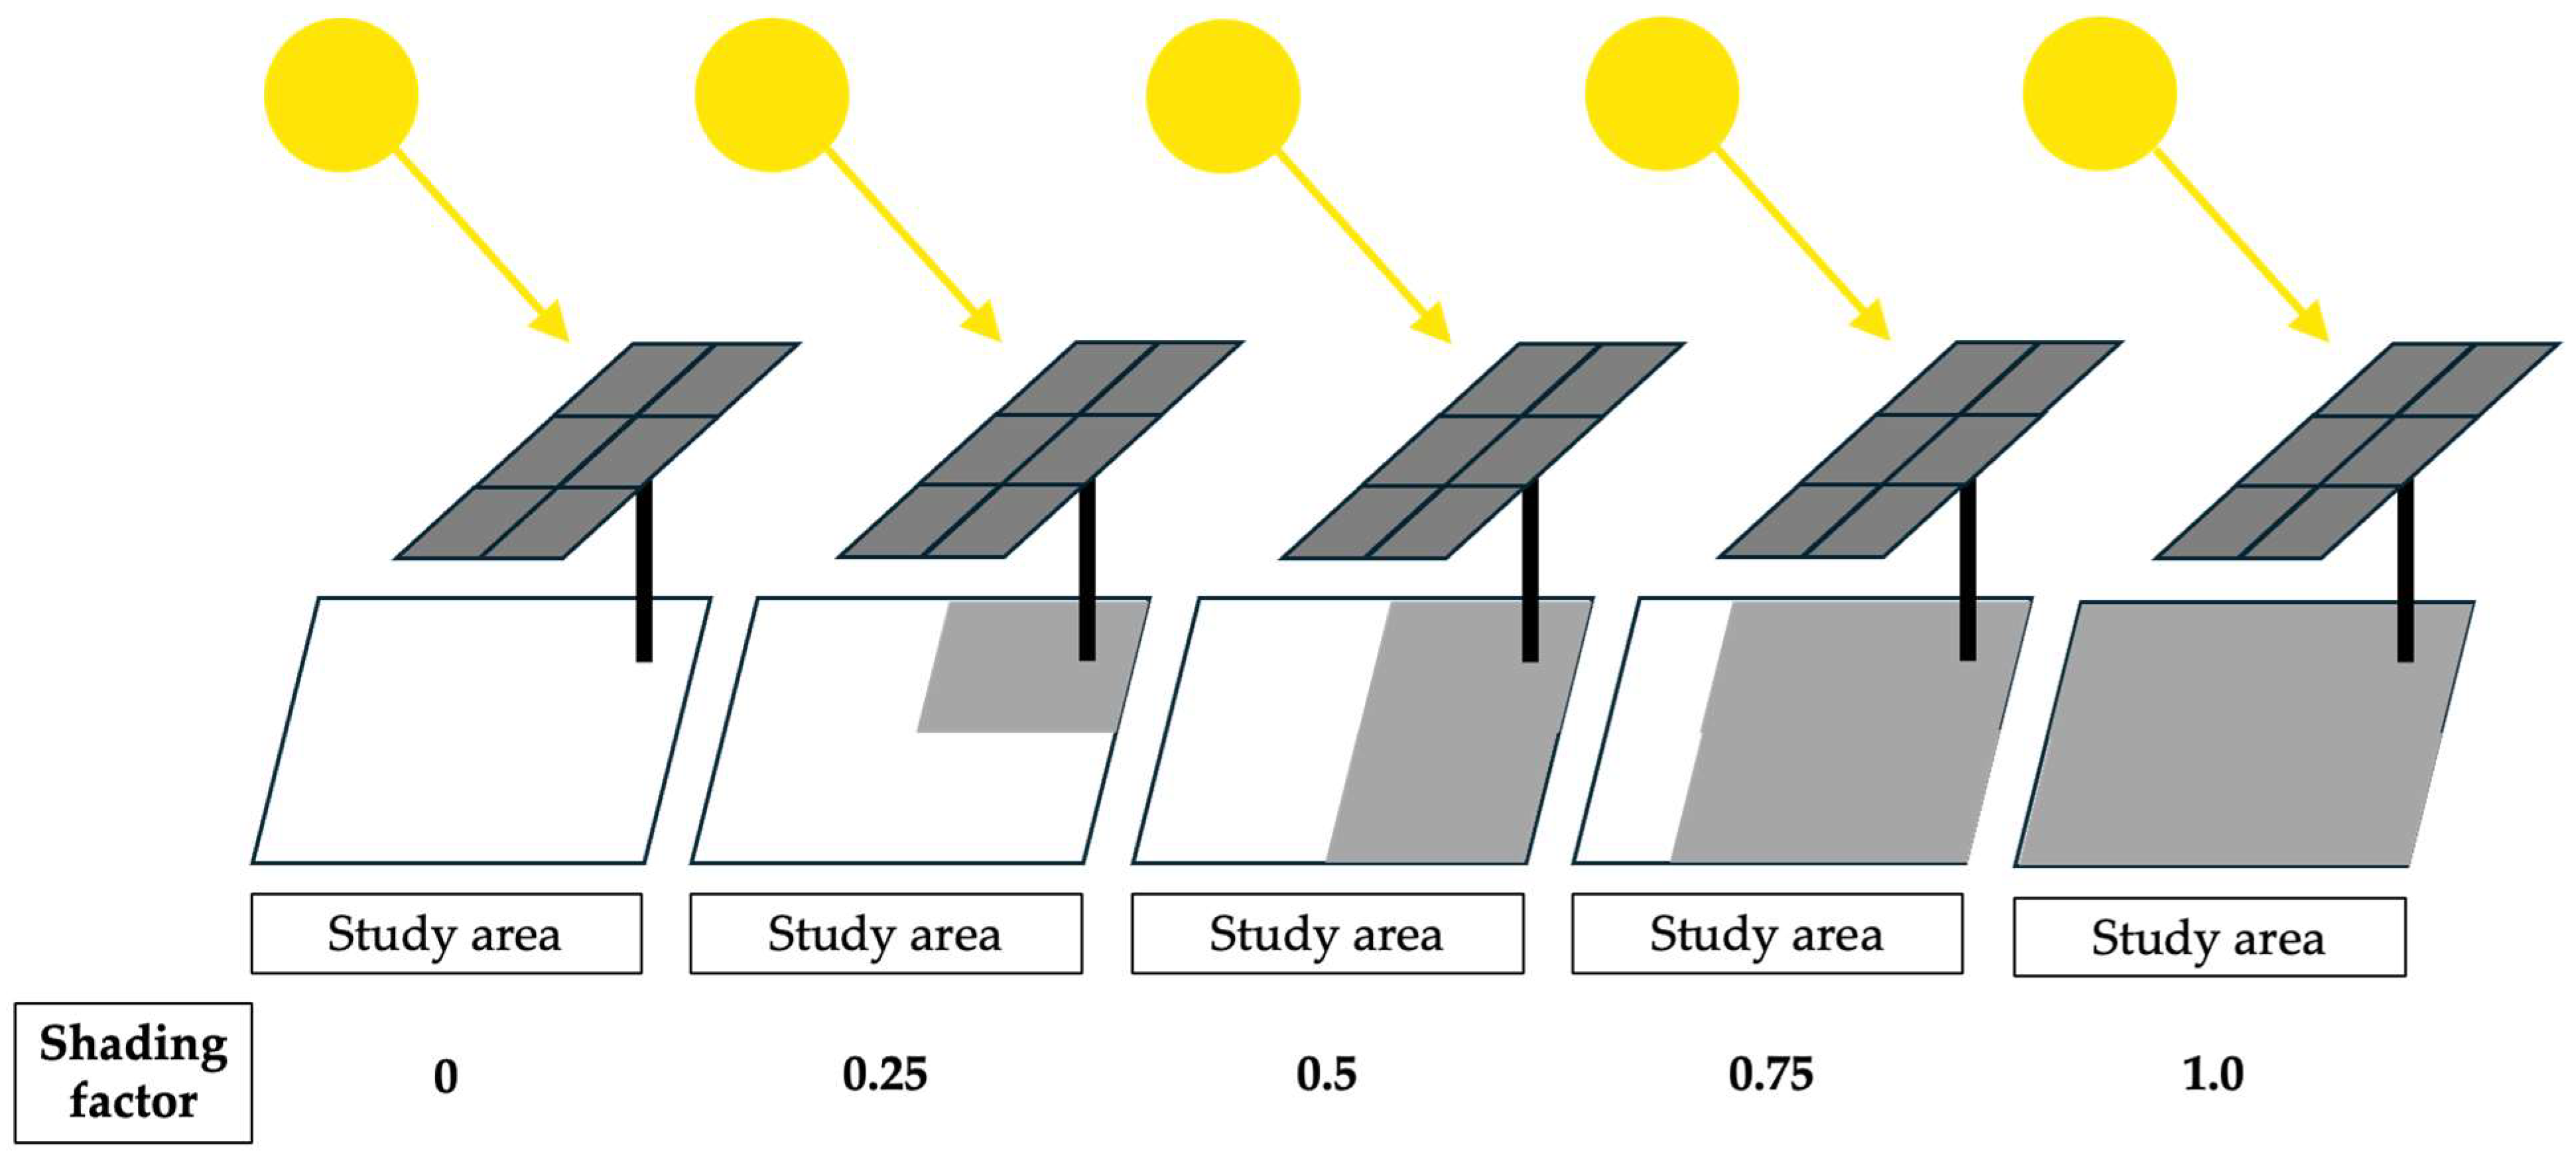
Therefore, (1 − fb) is the fraction of the ground that is exposed to direct beam irradiance (see Figure 4).

3.5.2. Diffuse Irradiance

Diffuse irradiance is the component of sunlight scattered by atmospheric particles, clouds, and molecules, reaching the Earth’s surface indirectly from all directions of the sky hemisphere rather than in a direct beam. This contrasts with direct irradiance and contributes to solar energy systems, especially under cloudy conditions or partial shading [34,35]. The Diffuse Shading Factor quantifies the fraction of diffuse solar radiation blocked by the solar panels, affecting the amount of diffuse irradiance that reaches the ground beneath them. According to Essery and Marks [36] the amount of diffuse radiation that reaches a surface is intricately connected to the portion of the sky dome visible from that surface. This relationship is influenced by several factors, including the angular distribution of diffuse radiation, topographic features, and atmospheric components.
Mapping diffuse solar radiation involves understanding its distribution across the sky hemisphere, which is affected by various atmospheric and environmental conditions. A technique involving all-sky photographs can be used to create a map of diffuse solar radiation. This method utilizes the correlation between digitized photographs and direct radiance measurements, helping to determine the radiance for different densities across the sky dome [37].
In regions with complex topographies, the distribution of diffuse solar radiation is not uniform. Factors like slope, aspect, shadows, and sky obstruction play significant roles. Parametrizations developed to assess clear-sky solar radiation in such regions consider these variables, allowing for accurate modelling of solar radiation, including both direct and diffuse components [36]. The interplay between diffuse and direct beam radiation is also crucial for terrestrial ecosystems, as these two types of radiation impact processes like photosynthesis differently. Diffuse radiation often results in higher efficiencies in light use by plant canopies and reduces the likelihood of photosynthetic saturation when compared to direct radiation. This difference in efficiency underscores the importance of diffuse radiation in areas where plants are the primary photosynthesizers [38].
The diffuse radiation reaching the Earth’s surface is influenced by atmospheric aerosols and clouds. These elements modulate the proportion of diffuse to direct radiation, impacting the total solar energy received at the surface. In conditions with high aerosol concentrations, there is typically an increase in diffuse radiation as aerosols scatter the solar beams [39]. While diffuse radiation is affected by atmospheric components, it is important to consider its role in environments with different optical properties, such as urban areas versus rural landscapes. Urbanized areas, with their complex geometries, can witness significant variations in diffuse radiation due to reflections and obstructions caused by buildings and streets [40].
Overall, understanding how much diffuse radiation reaches a specific surface requires a comprehensive approach that considers the visible portion of the sky dome, topographic influences, atmospheric conditions, and geographical location. Each of these factors contributes to the dynamic nature of diffuse solar radiation distribution. The sky diffuse irradiance is, therefore, substantially affected by the radiance levels and distributions over the sky in the direction viewed from the surface. An appropriate way of determining the sky diffuse irradiance on an inclined plane would be to integrate the radiance over the sky dome visible to the surface.
The diffuse irradiance, Iβd can be determined as:
I β d = R α γ cos α ( sin α . cos β + cos α . sin β . cos γ ) d γ d α
where Rαγ is the radiance of sky element at altitude α and azimuth γ, and β is the inclination angle of the sloped surface [41]. This formula requires the sky diffuse component to be divided into n by m angular zones to simplify the equation for numerical computation [41].

3.5.3. Diffuse Shading Factor

The shading factor for diffuse radiation, fd represents the fraction of the sky hemisphere obscured by obstacles. It is derived by comparing the irradiance contributions from visible and obstructed sky segments [34]:
f d = α = 0 π / 2 γ = 0 2 π f b α , γ R α γ c o s ( β ) d γ d α α = 0 π / 2 γ = 0 2 π R α γ c o s ( β ) d γ d α
Assuming isotropic radiance, i.e., Rαγ is a constant, the double integral can be discretized into n×m angular segments for numerical approximation [13]:
f d = i = 1 n j = 1 m f b , i j α i , γ j c o s ( β i j ) c o s ( α i ) α γ i = 1 n j = 1 m c o s ( β i j ) c o s ( α i ) α γ
For horizontal surfaces, this simplifies further to:
f d = i = 1 n j = 1 m f b , i j α i , γ j s i n ( α i ) c o s ( α i ) i = 1 n j = 1 m s i n ( α i ) c o s ( α i )
Empirical studies [35] show that diffuse shading losses are often <5% in unshaded environments. For the sake of simplification and avoiding computational intensiveness for modelling the diffuse shading factor, fd, this model assumes the diffuse radiation loss to be negligeable, (1 − fd) ≈ 0, and thus the ground irradiation (Equation (4)) is simplified to:
G H I g r o u n d = D N I · 1 f b + D H I

3.6. Simulation and Analysis: The Model

3.6.1. Shadow Projection Beneath the PV Panels

This method follows the shading model of Quaschning and Hanitsch [34] and accounts for the sun’s position. It uses panel geometry to project the shadow of and object in the path of the sun light. The panel was modelled as a 3D polygon, and its shadow projection was computed by intersecting solar rays (from the sun direction vector) with the ground plane (z = 0). Each vertex of the panel was projected individually, and the resulting shadow polygon was formed. The shaded area was then ‘clipped’ using the boundaries provided by the study area using the Shoelace formula.
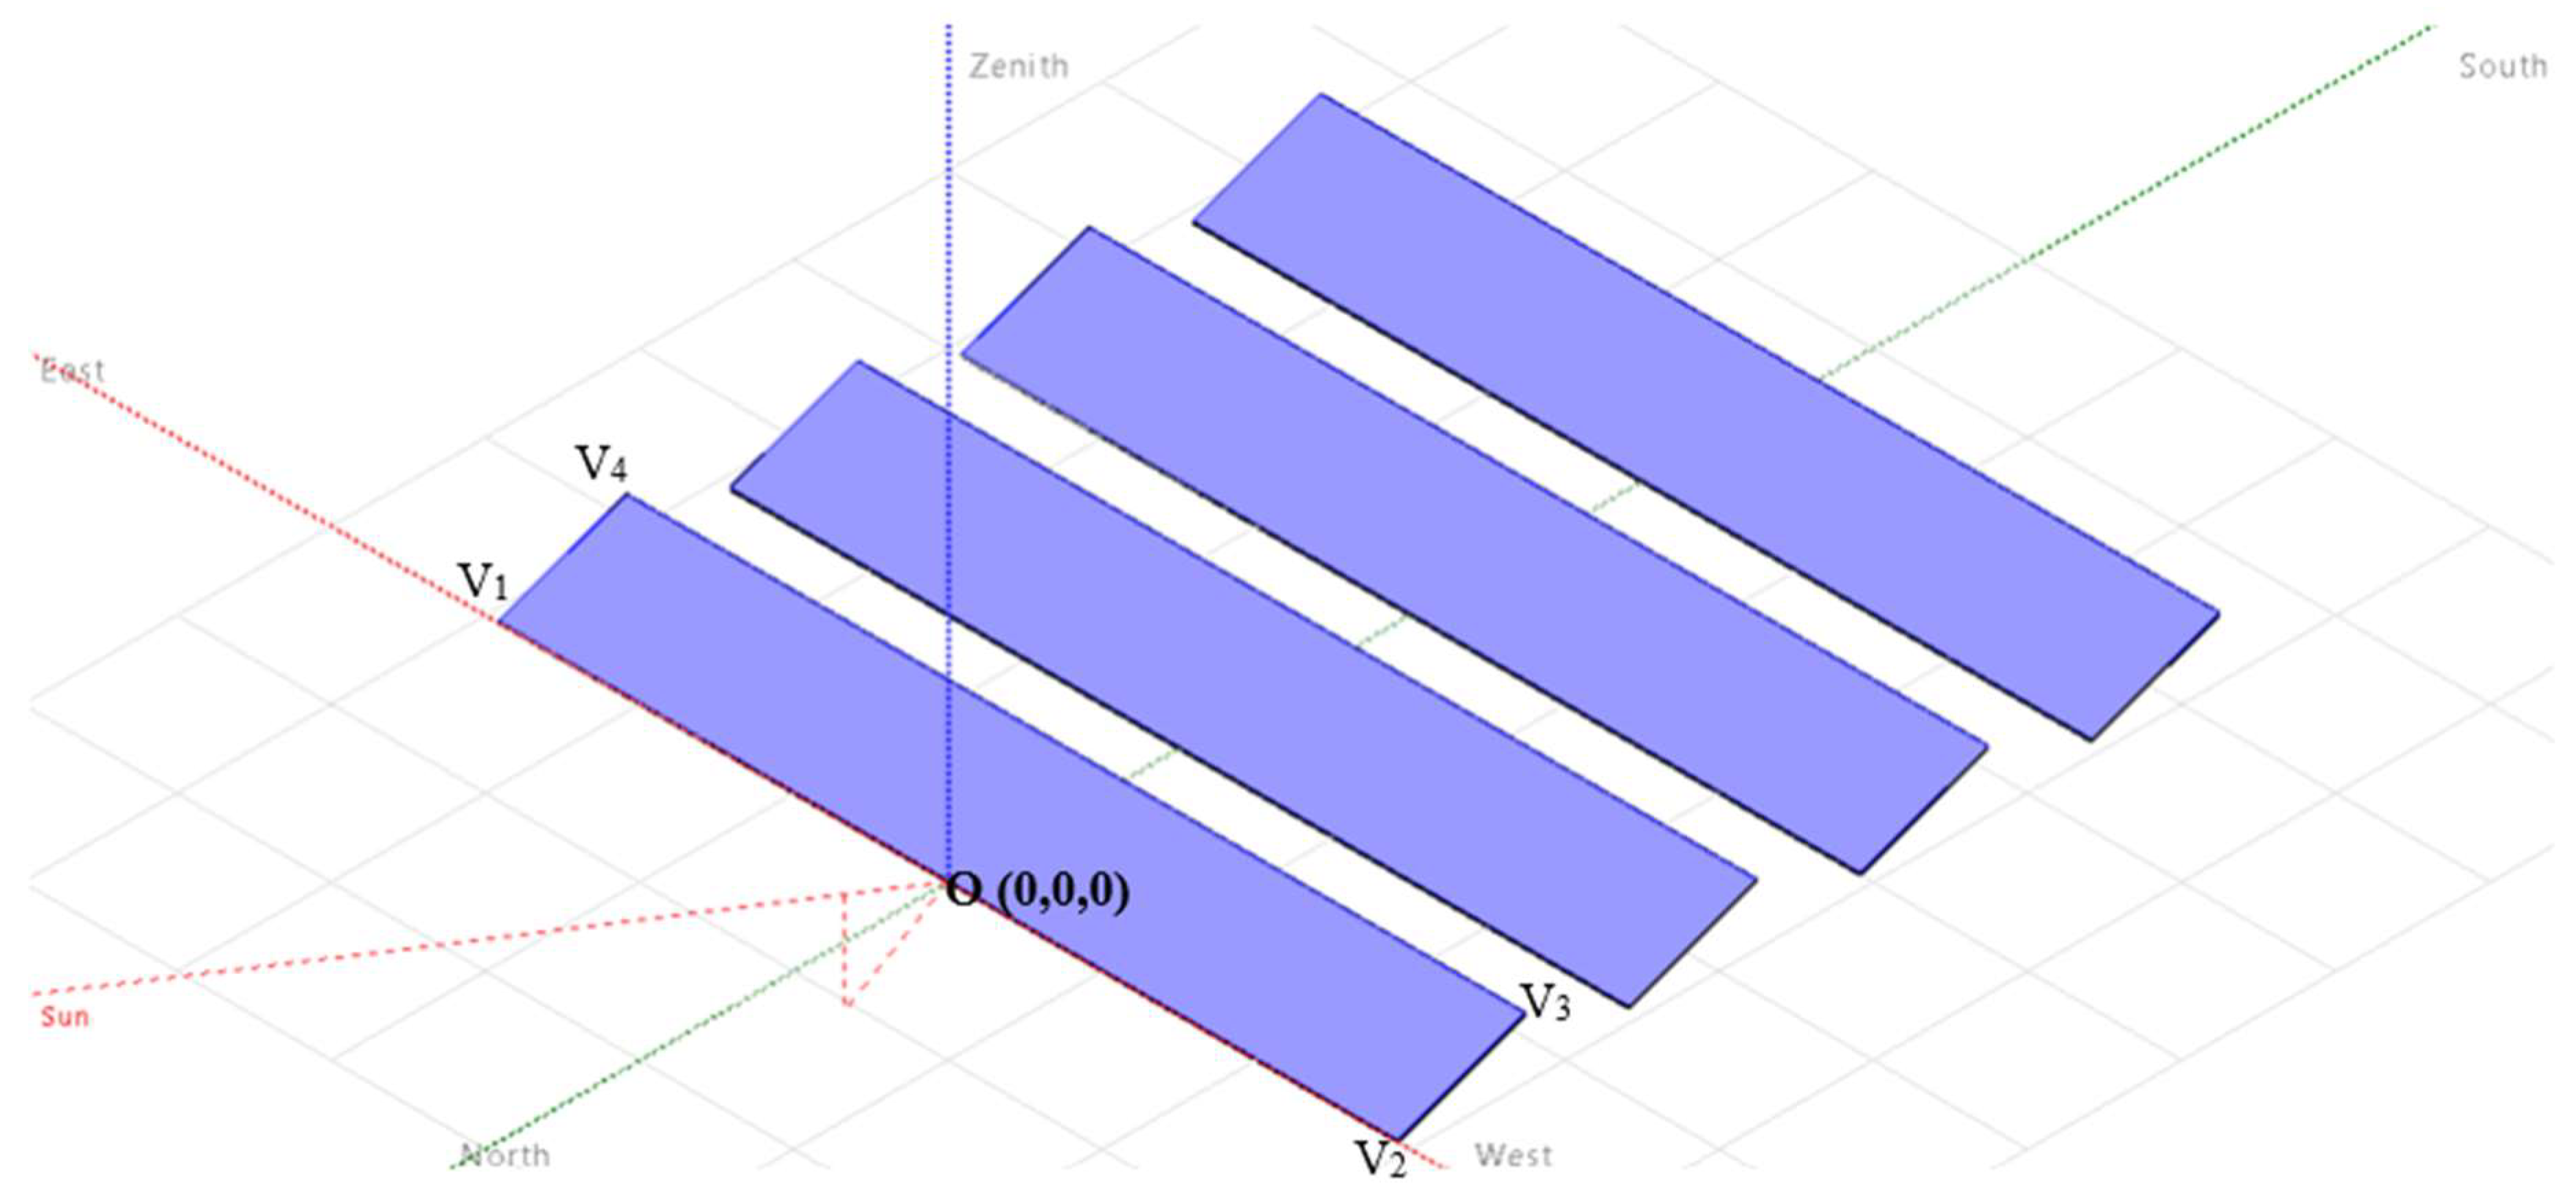
A global coordinate system relative to the solar panel and its position was established, as follows (see Figure 5):
  • x-axis: East–West direction;
  • y-axis: North–South direction;
  • z-axis: Vertical (upward).
Each corner of the panel is a vertex point in the coordinate system. The vertices are the matrices that form the basis of the projection calculations. The origin point is at (0,0,0), which is suspended on the northern most edge of the panel at the centre point (see Figure 5). Similarly, the projected shadow forms a polygon on the ground with its own vertices:
v i = x i , y i , z i
With:
  • v1 = (−7.284, 0, 0.9)
  • v2 = (7.284, 0, 0.9)
  • v3 = (7.284, 7.257, 2.6)
  • v4 = (−7.284, 7.257, 2.6)
The sun direction vector is determined from the following:
s = cos γ cos α sin γ cos α sin ( α )
where α is the sun’s altitude, and γ is the sun’s azimuth.
For each vertex, vi, the shadow is cast in the opposite direction of the sun rays (–s). Its shadow on the ground (z = 0) is calculated by projecting along −s:
x = x i tcos γ cos α y = y i tsin γ cos α z = z i tsin α
where t = zi/(sin(α)) is the gradient defining the distance along the shadow’s path (straight line) along –s to reach the ground, i.e., when z = 0.
The horizontal displacement is determined by: Δx = tcos(γ)cos(α); Δy = tsin(γ)cos(α).
Simplifying the shadow equation using tan(α) = sin(α)/cos(α), the coordinates to the shadow cast, or projected by each vertex, vi, becomes:
x s h a d o w , i = x i z i t a n ( α ) s i n ( γ )
y s h a d o w , i = y i z i t a n ( α ) c o s ( γ )
These coordinates form the shadow vertices s1, s2, s3, s4, which will form the shadow polygon on the ground.
Recalling that the study area is a rectangle on the ground (in meters): −7.485 ≤ x ≤ 7.485; 0 ≤ y ≤ 7.257
The shaded area is then clipped within the limits of the study area. For the clipped polygon, the area is computed using the shoelace formula [34]:
A s h a d e d = 0.5 × i = 1 n ( x i y i + 1 x i + 1 y i )
The beam shading factors, given by Equation (3), can now be estimated using the shaded study area and the total study area.

3.6.2. Data Source and Preprocessing

Hourly meteorological data for one calendar year was used, which was obtained from SolarGIS for the Waikato region. These were provided in a .csv format in European time zone. The dataset included GHI, DNI, and DHI, along with solar position angles. Date and time components were merged into a single datetime index in Python and converted to the Pacific/Auckland time zone. The data were cleaned for daylight saving anomalies and tested for continuity in hourly time steps; no missing values were present.

3.6.3. Estimating Ground Irradiance, GHIground, in the Study Area

The shading factors were computed producing a table of beam shading factors and a constant estimation of diffuse shading factor (isotropic sky model assumption). The ground irradiance values were then calculated as follows:
G H I g r o u n d = D N I s h a d e d c o s ( z e n i t h ) + D H I
where DNIshaded = DNI × (1-shading_factor), and DHIshaded = DHI, i.e., (1-diffuseshading _factor) ≈ 0.

3.6.4. Estimating Photosynthetic Photon Flux Density (PPFD)

PPFD was estimated from the shaded GHI using a conversion factor of 2.02 μmol/J (i.e., 1 W/m2 ≈ 2.02 μmol/m2/s), following established methods for full-spectrum sunlight under clear sky conditions [42]. This allowed for direct ecological interpretation of irradiance levels. A spatial PPFD map was generated for each season, using seasonal hourly averages to highlight areas with light limitations for common pasture and crop types.

3.6.5. Seasonal Comparisons via Solstices and Equinoxes

To understand seasonal effects on PPFD and GHI values, the following representative dates were selected:
  • Summer solstice (21 December);
  • Winter solstice (21 June);
  • Spring equinox (22 September);
  • Autumn equinox (21 March).
These seasonal samples quantify differences in radiation availability and shading patterns, and their impact on plant growth under PV panels.

3.6.6. Irradiance Heat Maps

Using Python’s Matplotlib and GeoPandas, irradiance heat maps were generated for each season, visually representing the spatial distribution of light under the panels. These maps were used to interpret PPFD gradients and identify zones with sufficient light for vegetation growth.

3.7. Limitations

Several limitations of the study are acknowledged. First, the research does not include real-world validation via in situ sensors. Also, the impact of panel reflectivity and albedo changes were omitted. Soil and vegetation feedback mechanisms, such as evapotranspiration, moisture retention, and so forth, were not dynamically simulated, and the ground conditions were assumed to be sufficient for pasture growth. Mutual (row-to-row) shading was excluded and thus pitch/edge irradiance and PPFD should be interpreted as upper-bound estimates at low sun elevations; central under-panel results are unaffected.

4. Results

4.1. Beam Shading Factors

The shadow polygon that was formed by projecting panel vertices and clipping them within a fixed ground study area under the array are summarized in Table 1. The table represents how much of the direct beam sunlight (DNI) is blocked by the panel array at the ground level. The shading factors have a value typically between 0 and 1, where as per Figure 2:
  • 1 means full shading (no direct beam reaching the ground);
  • 0 means no shading (full direct beam reaches ground).

4.2. Model Results for the Global Ground Irradiance

4.2.1. Day Visualization of the Equinoxes and Solstices

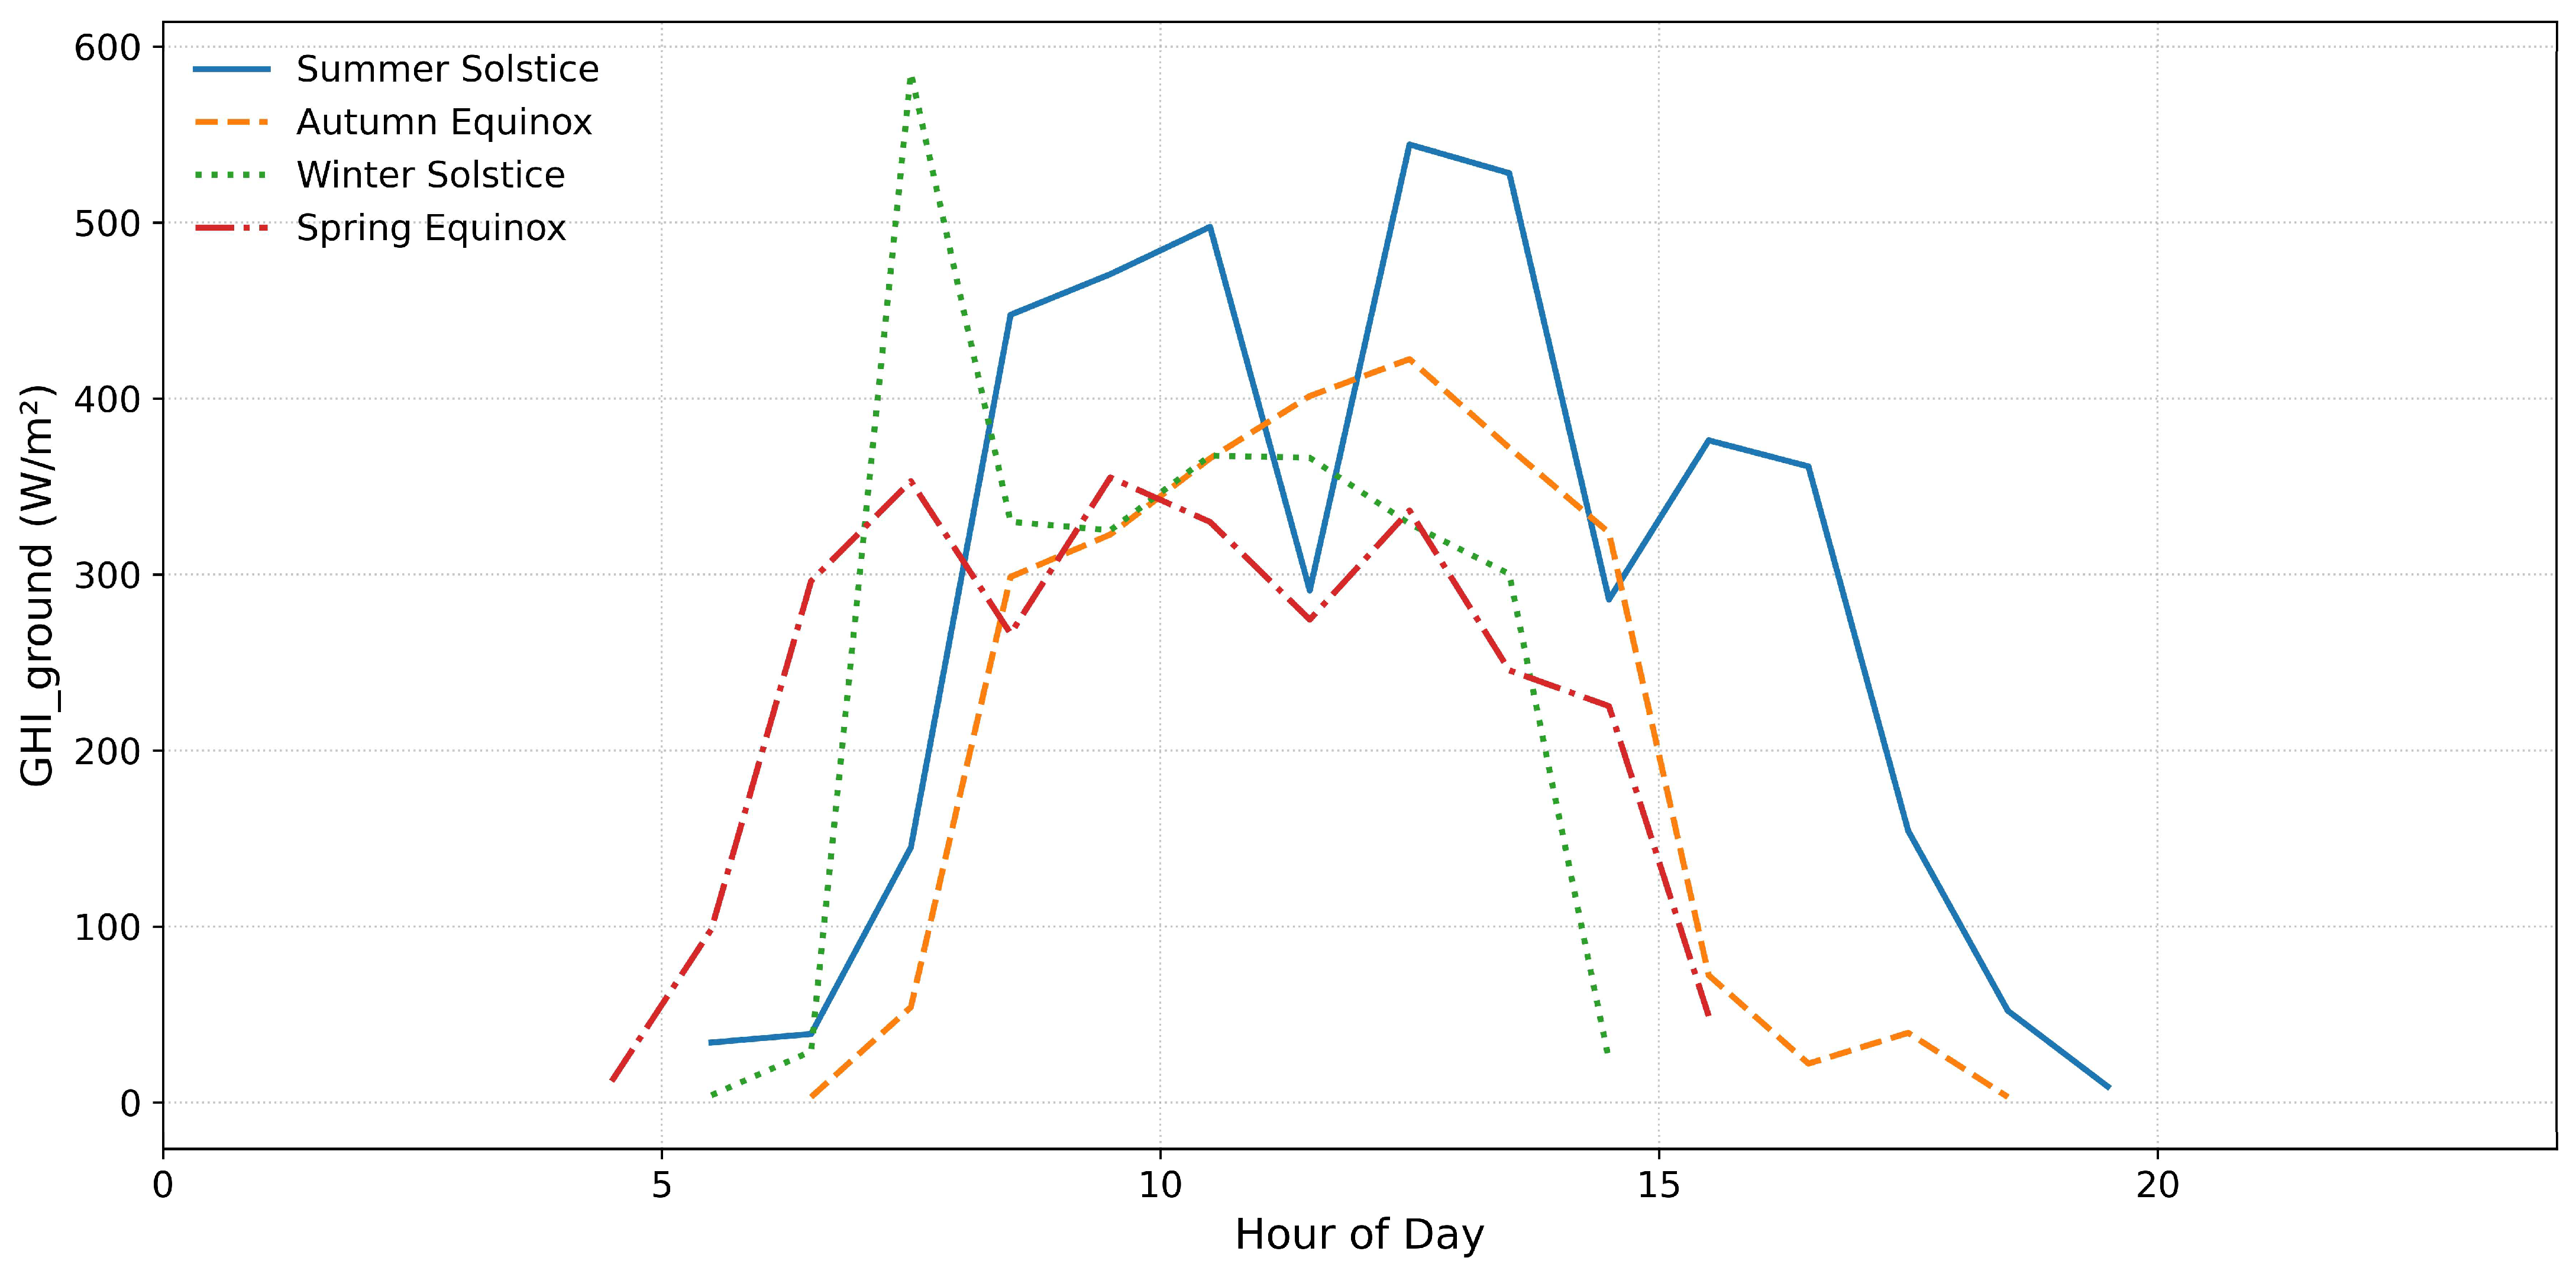
Figure 6 presents the daylight profile of global horizontal irradiance on the ground (GHIground) across the four representative days of the year, which corresponds to the two solstices and two equinoxes. The values represent irradiance measured beneath the PV arrays, accounting for shading losses due to the fixed-tilt configuration.
The summer solstice (blue line) shows the highest and most sustained irradiance, peaking at over 550 W/m2 around midday. The winter solstice (green line) shows the sharpest decline in irradiance duration and peak values, with a maximum around 330 W/m2. The equinoxes (red for spring, orange for autumn) lie between the two extremes, with the autumn profile showing a slightly higher and more sustained peak compared to spring.
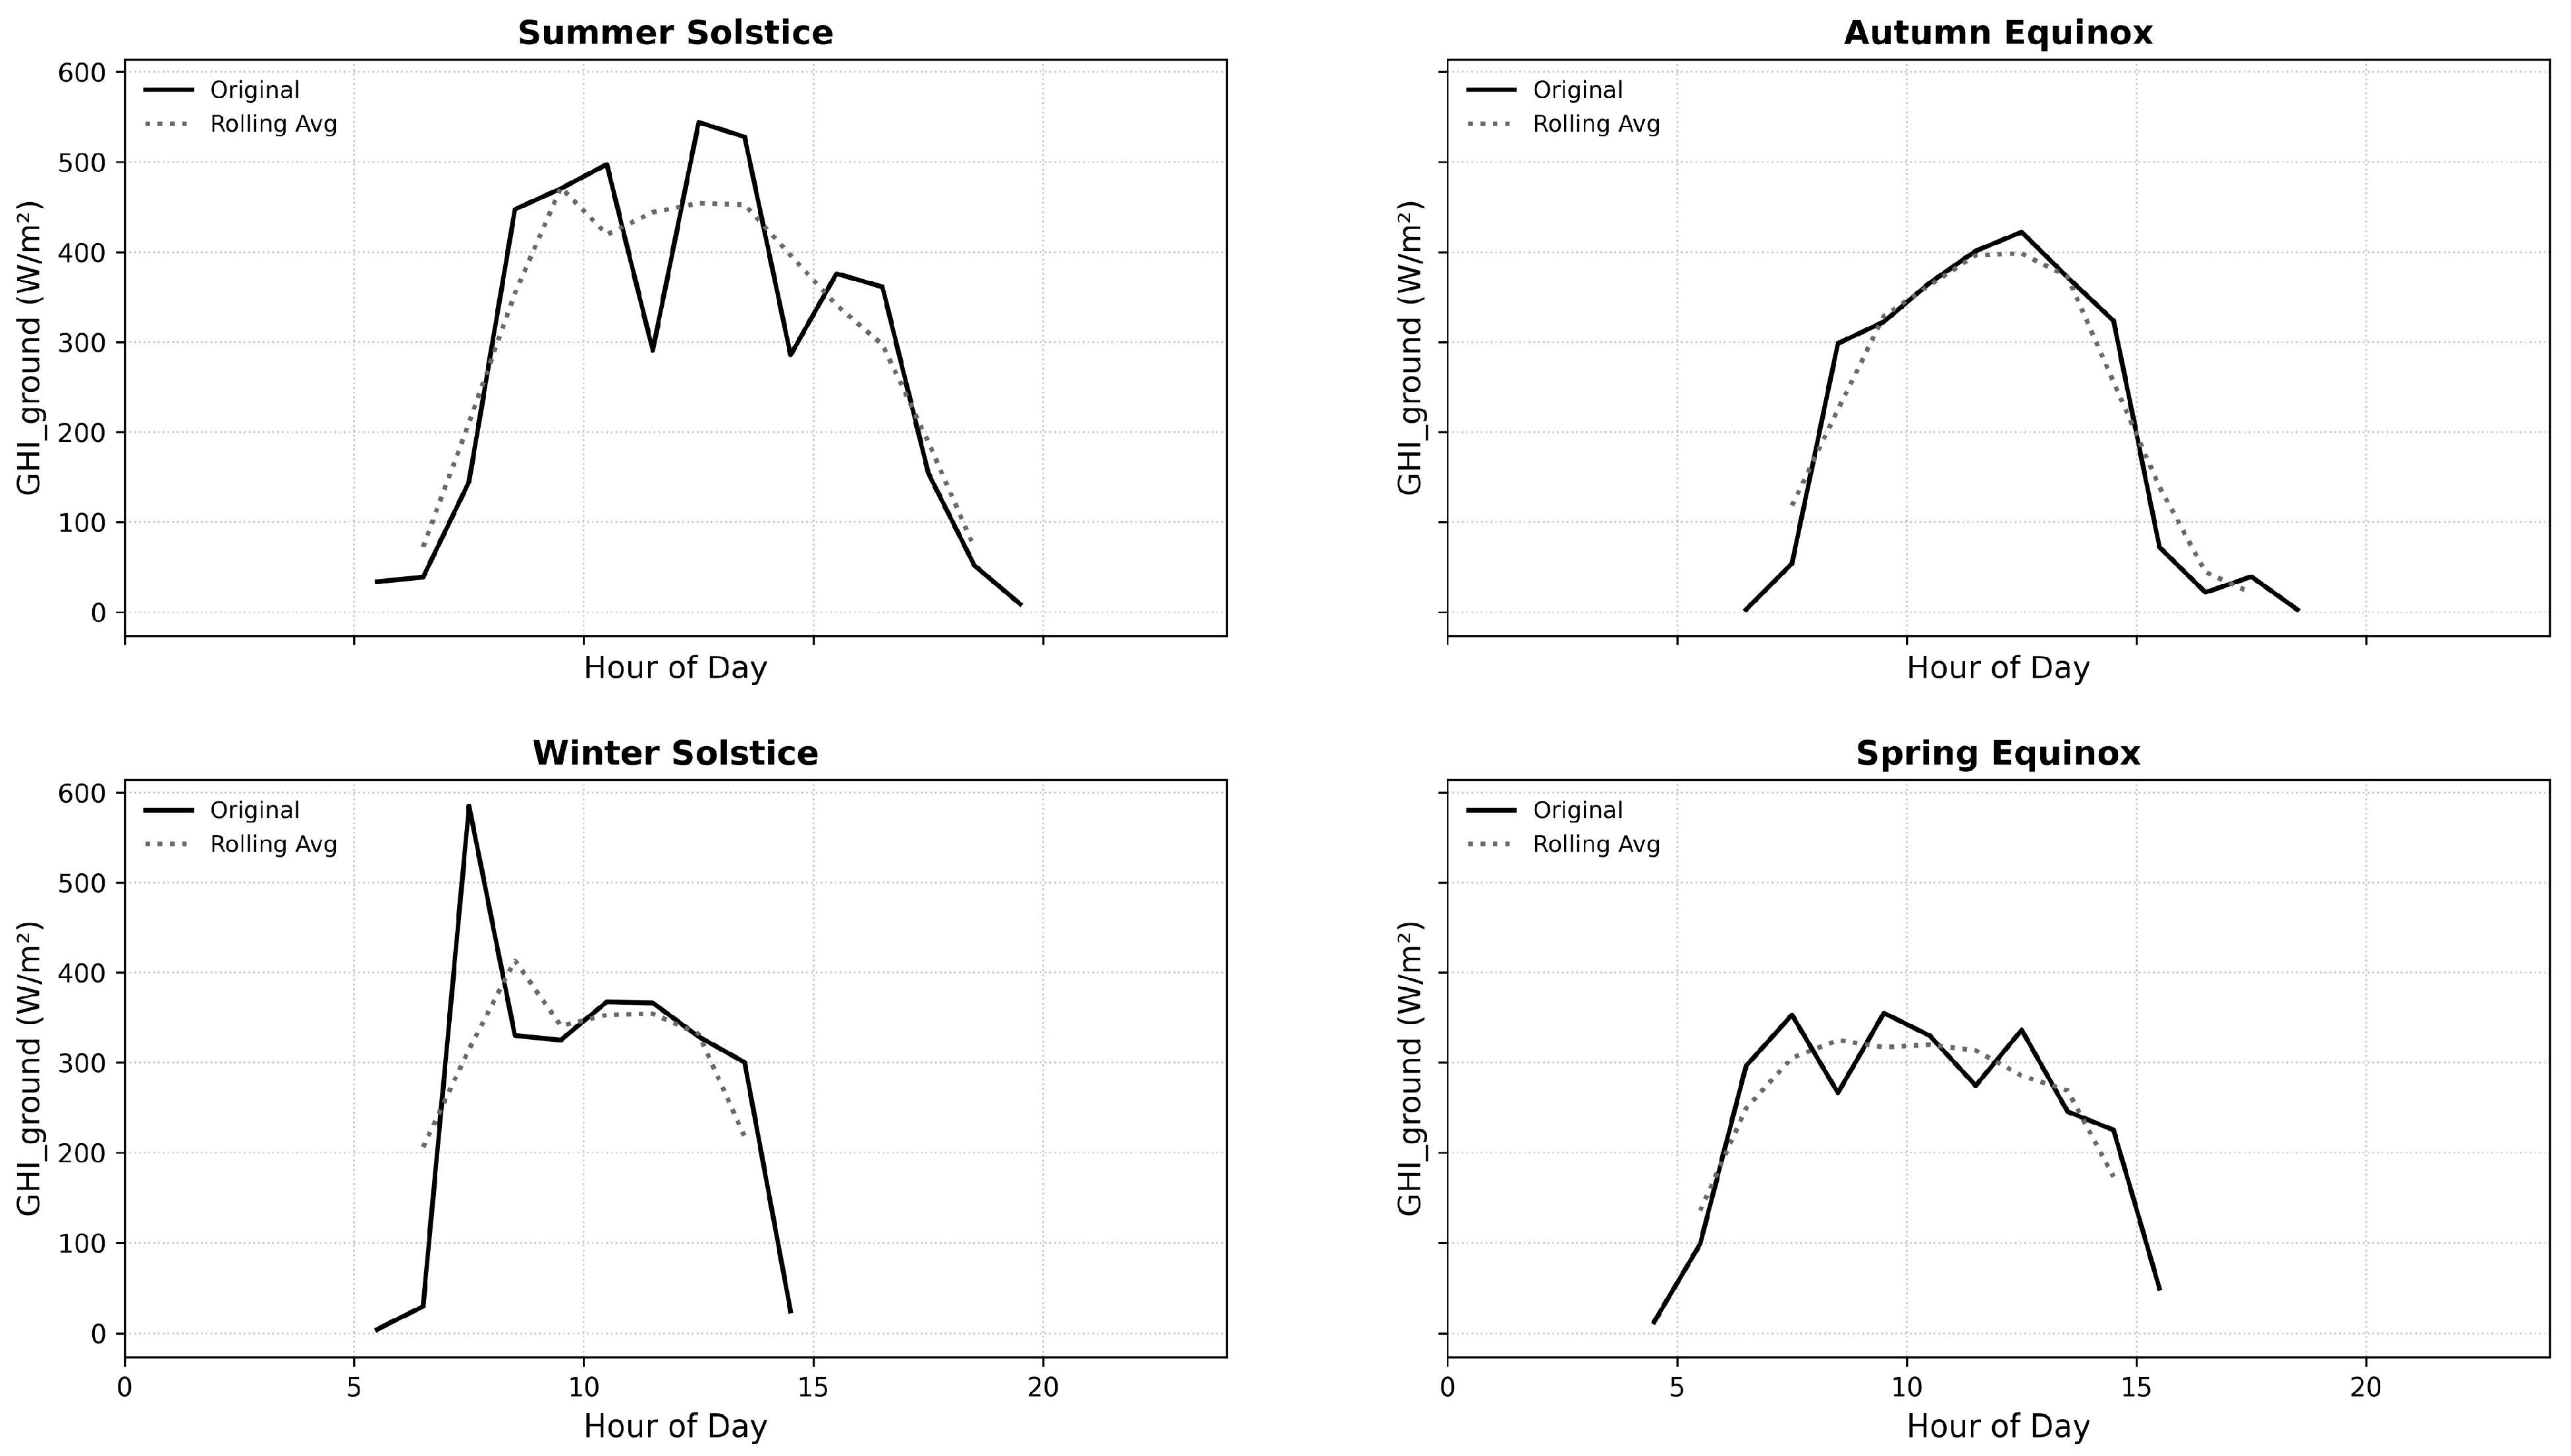
Figure 7 illustrates the ground-level global horizontal irradiance across the four representative seasonal days, with each subplot comparing the original irradiance values (blue line) to their smoothed counterparts (orange dashed line) using a rolling average filter. The rolling average line helps clarify underlying seasonal trends by filtering out short-term variability in irradiance, possibly due to shifting shadows, cloud cover intermittency, or sensor variability.

4.2.2. Spatial Heat Maps for Ground Irradiance

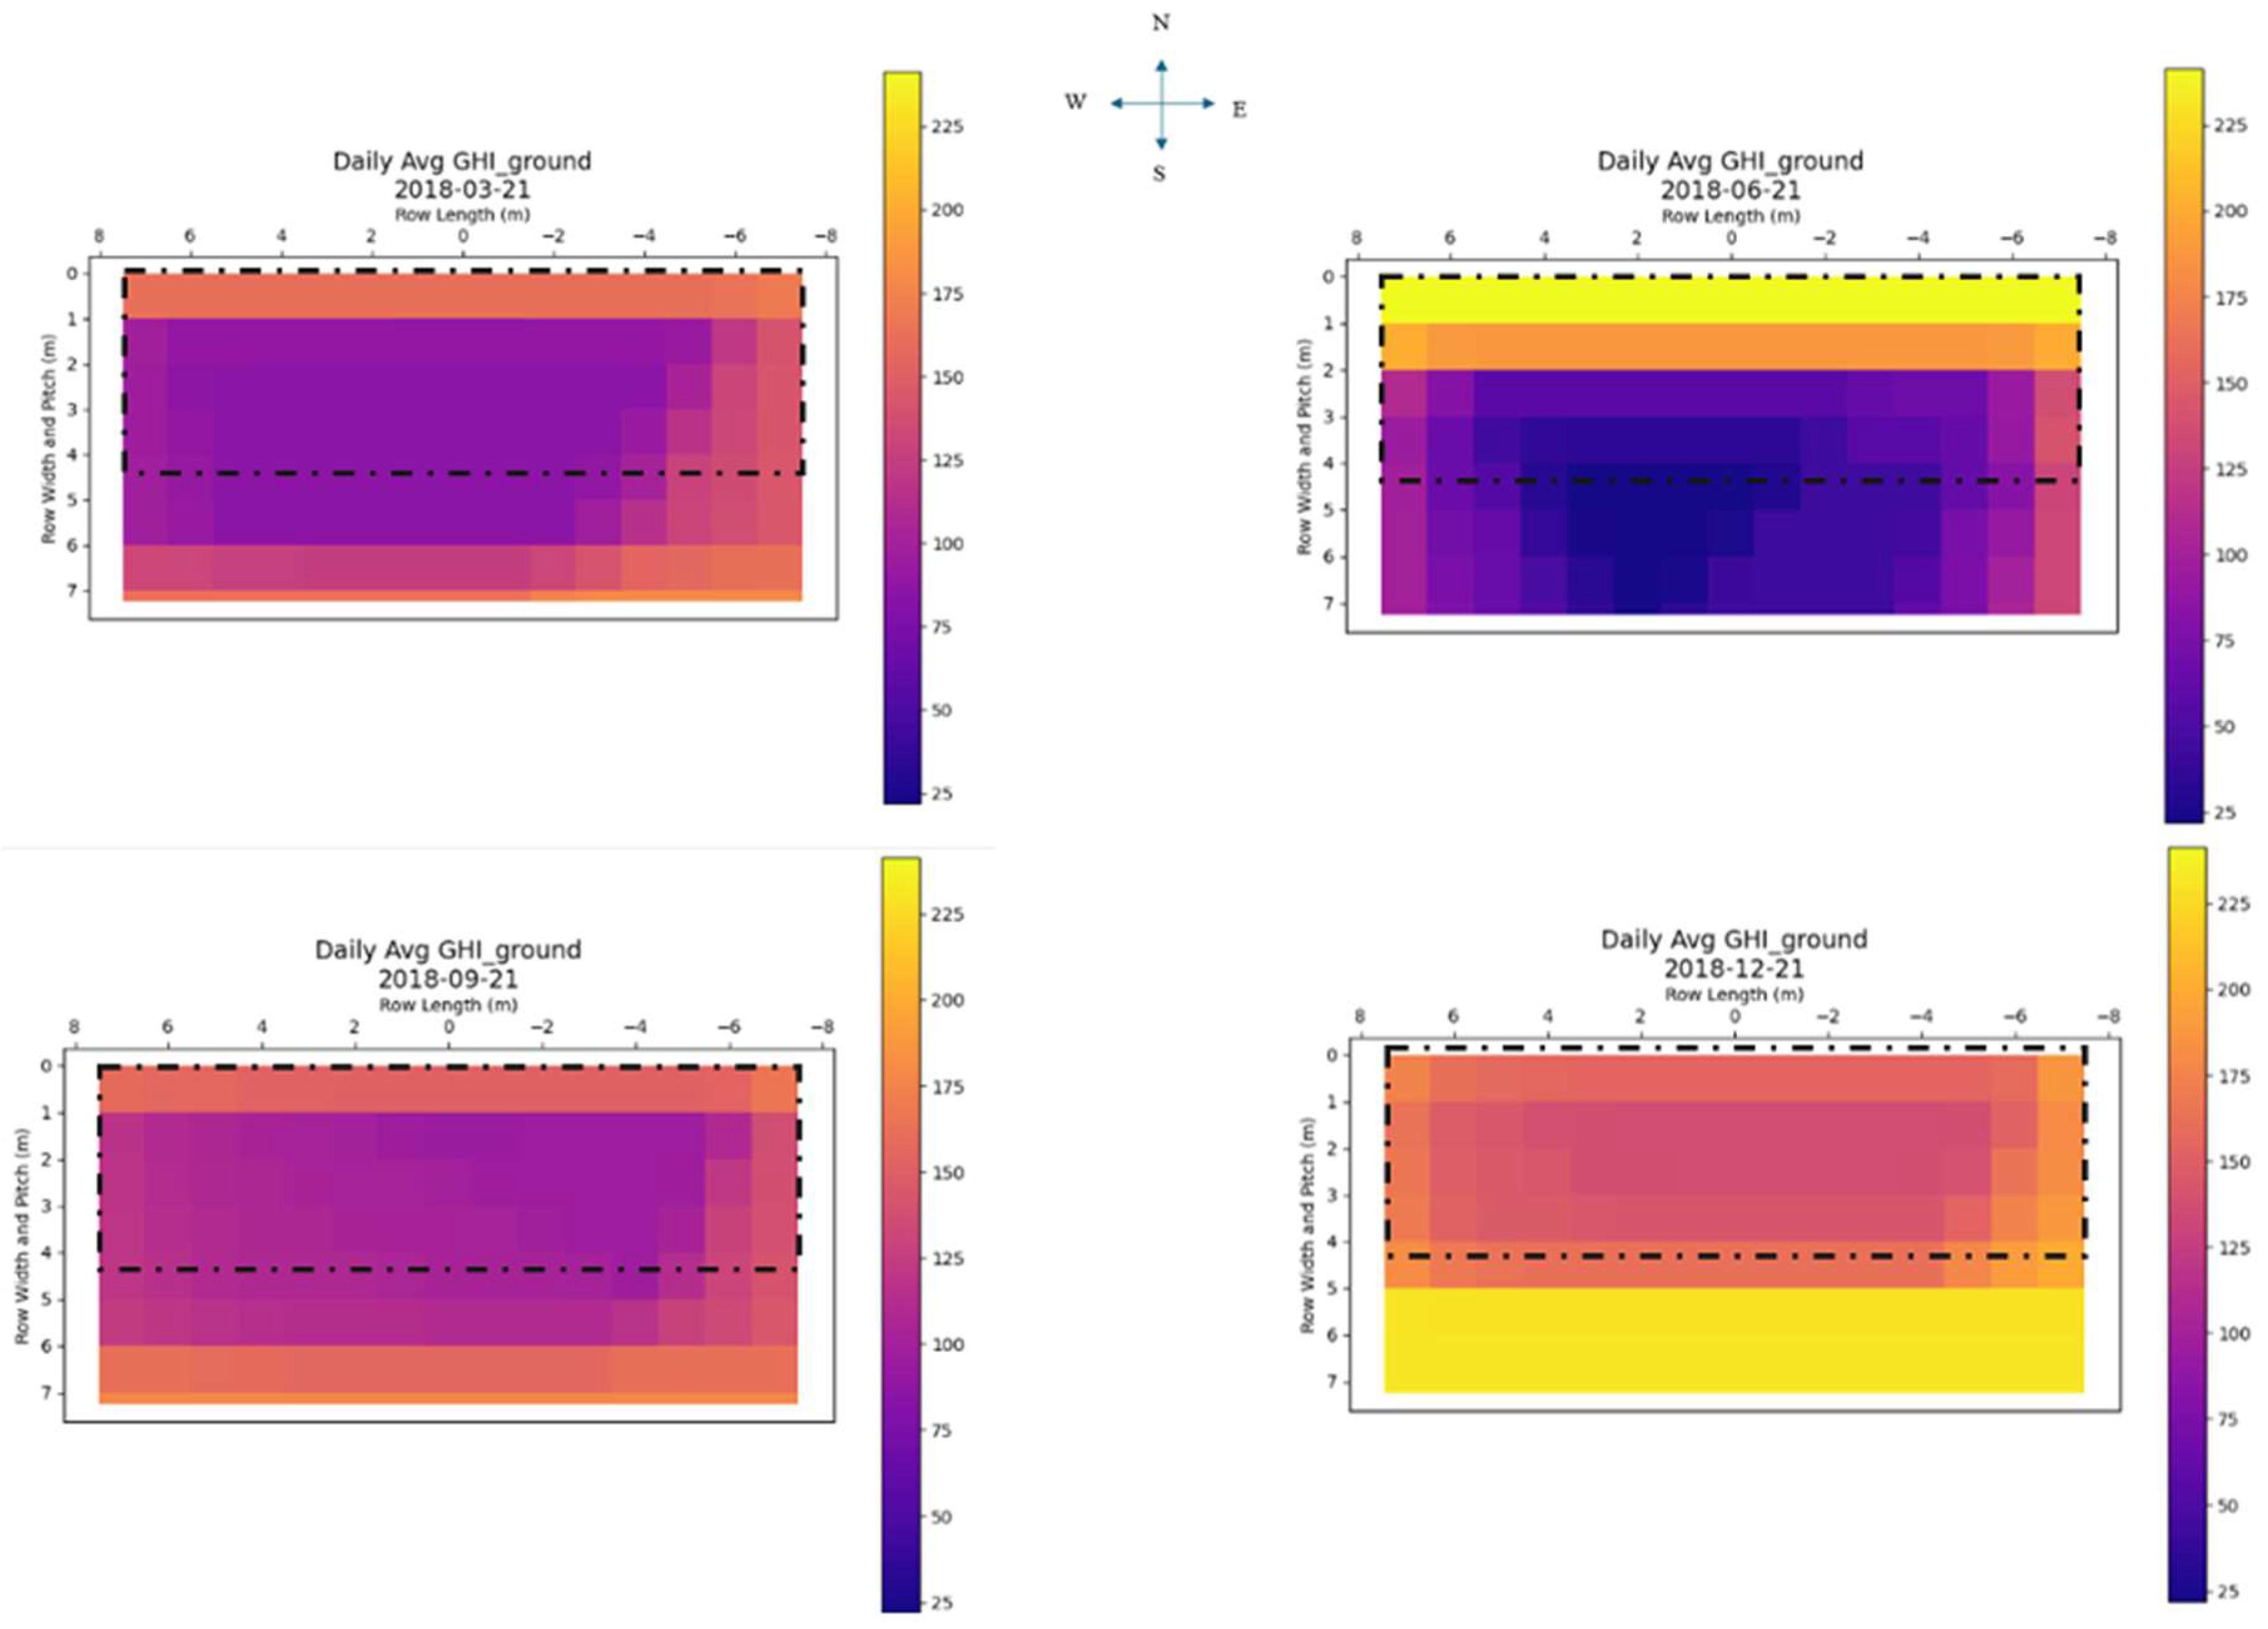
Figure 8 presents the spatial heat maps of daily average global horizontal irradiance at ground level beneath the PV array (dotted boxes) for the four key solar calendar days: the two equinoxes (21 March and 21 September) and the two solstices (21 June and 21 December).
The March and September equinoxes display near-symmetrical shading gradients. The central area beneath the panels receives lower irradiance (50–125 W/m2), with increasing intensity toward the panel edges. The June solstice shows the most pronounced central shading, with GHIground dropping below 50 W/m2 directly beneath the panel. The northern edge receives much unshaded exposure. The December solstice exhibits an inverse pattern, with higher irradiance centrally (>175 W/m2 on average) and a more uniform spatial distribution.

4.2.3. Comparison Between Solar Resource and GHIground

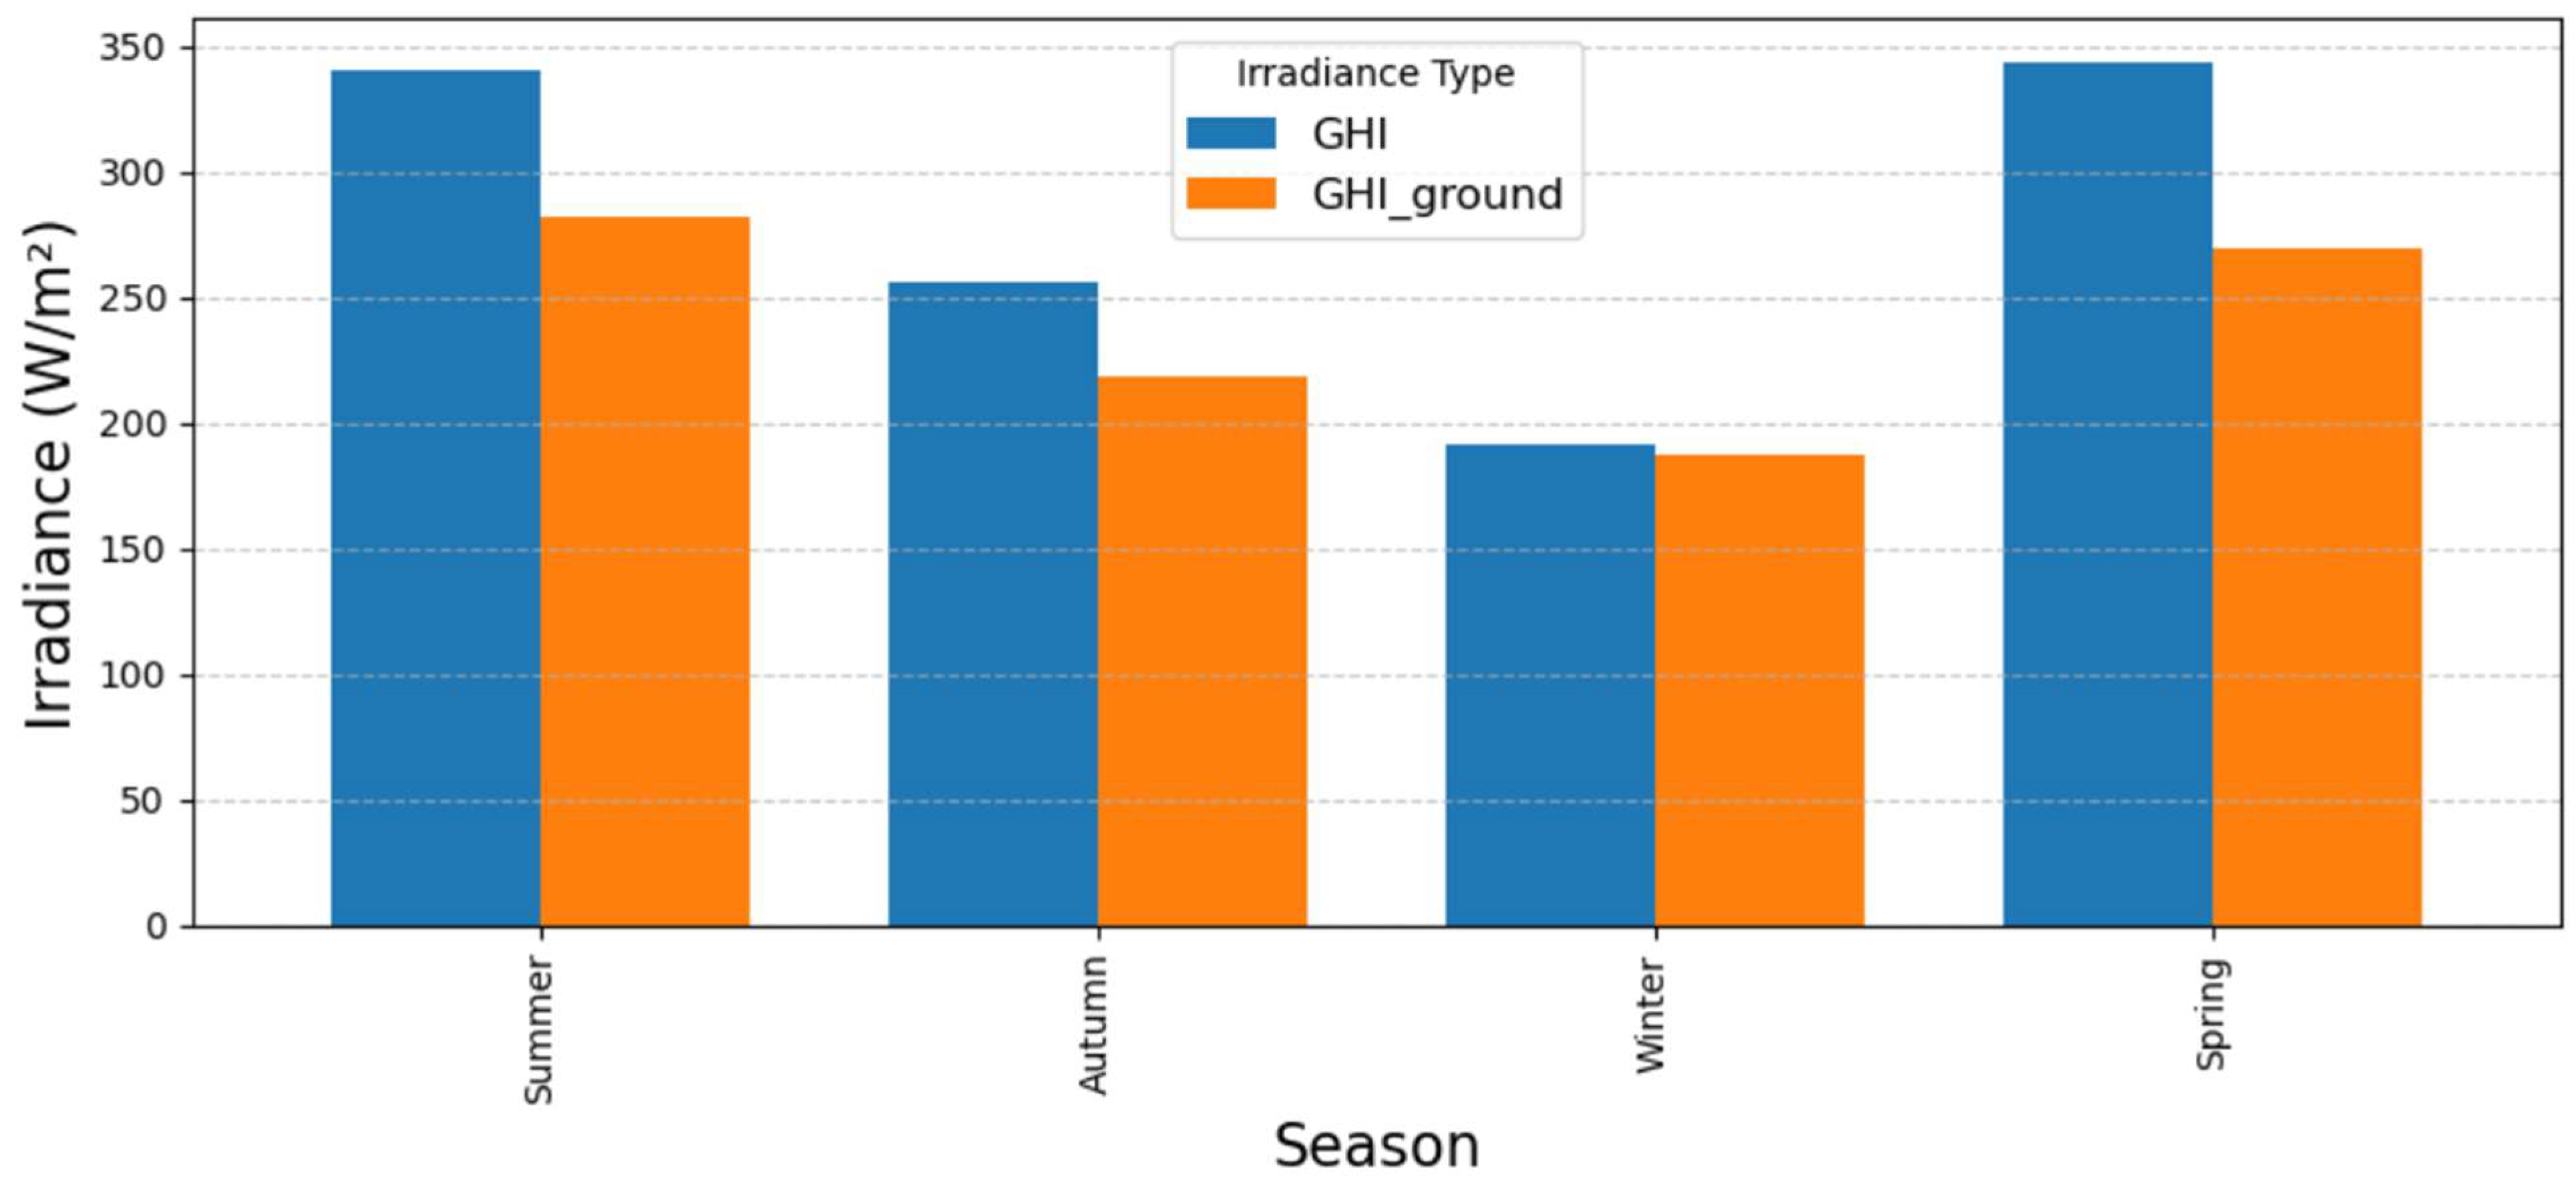
Figure 9 compares the true seasonal average global horizontal irradiance (GHI) and corresponding ground-level irradiance (GHIground) for each of the four meteorological seasons. Summer and Spring exhibit the highest GHI values, each averaging above 340 W/m2, with GHIground lower by roughly one-fifth (≈18% in summer and ≈22% in spring) of the open-field average GHI as a result of shading. Autumn and Winter display lower seasonal irradiance overall. The percentage reduction in GHI below the panel is ~16% in autumn and only ~3% in winter, confirming that the relative difference between GHI and GHIground is smallest in winter.

4.3. The Model Results for the Photosynthetic Photon Flux Density (PPFD)

4.3.1. Daily Average PPFD Across the Seasonal Cycle

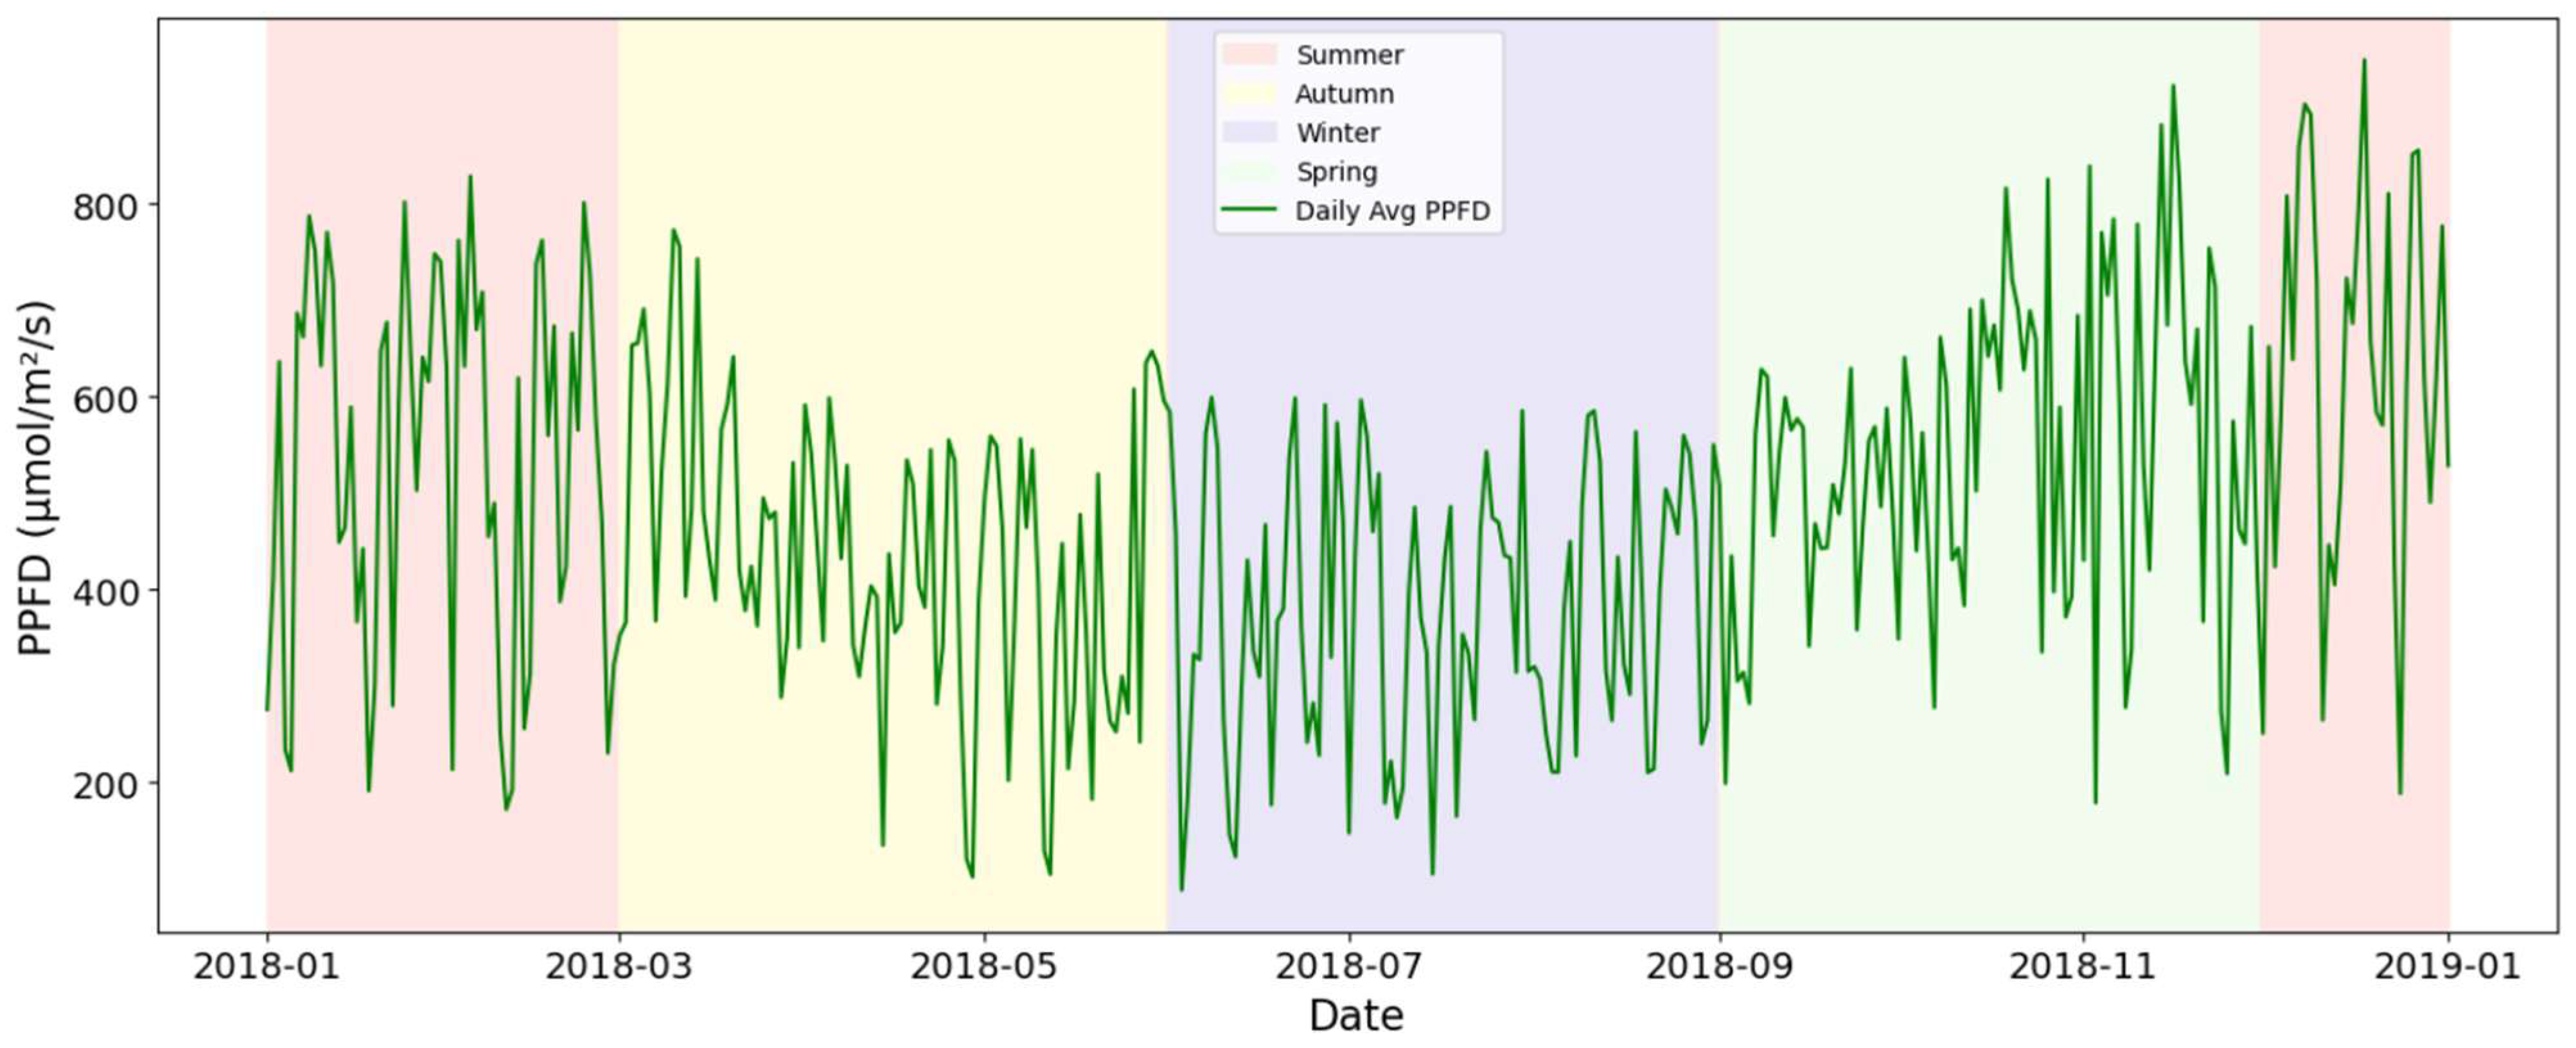
Figure 10 illustrates the modelled daily average PPFD beneath the PV array over a full calendar year. Values are highest during summer and spring, often exceeding 700 μmol/m2/s. Autumn shows moderate levels (400–600 μmol/m2/s), while winter presents the lowest PPFD, frequently falling below 400 μmol/m2/s.

4.3.2. Spatial Distribution of Daily Average PPFD Across Seasons

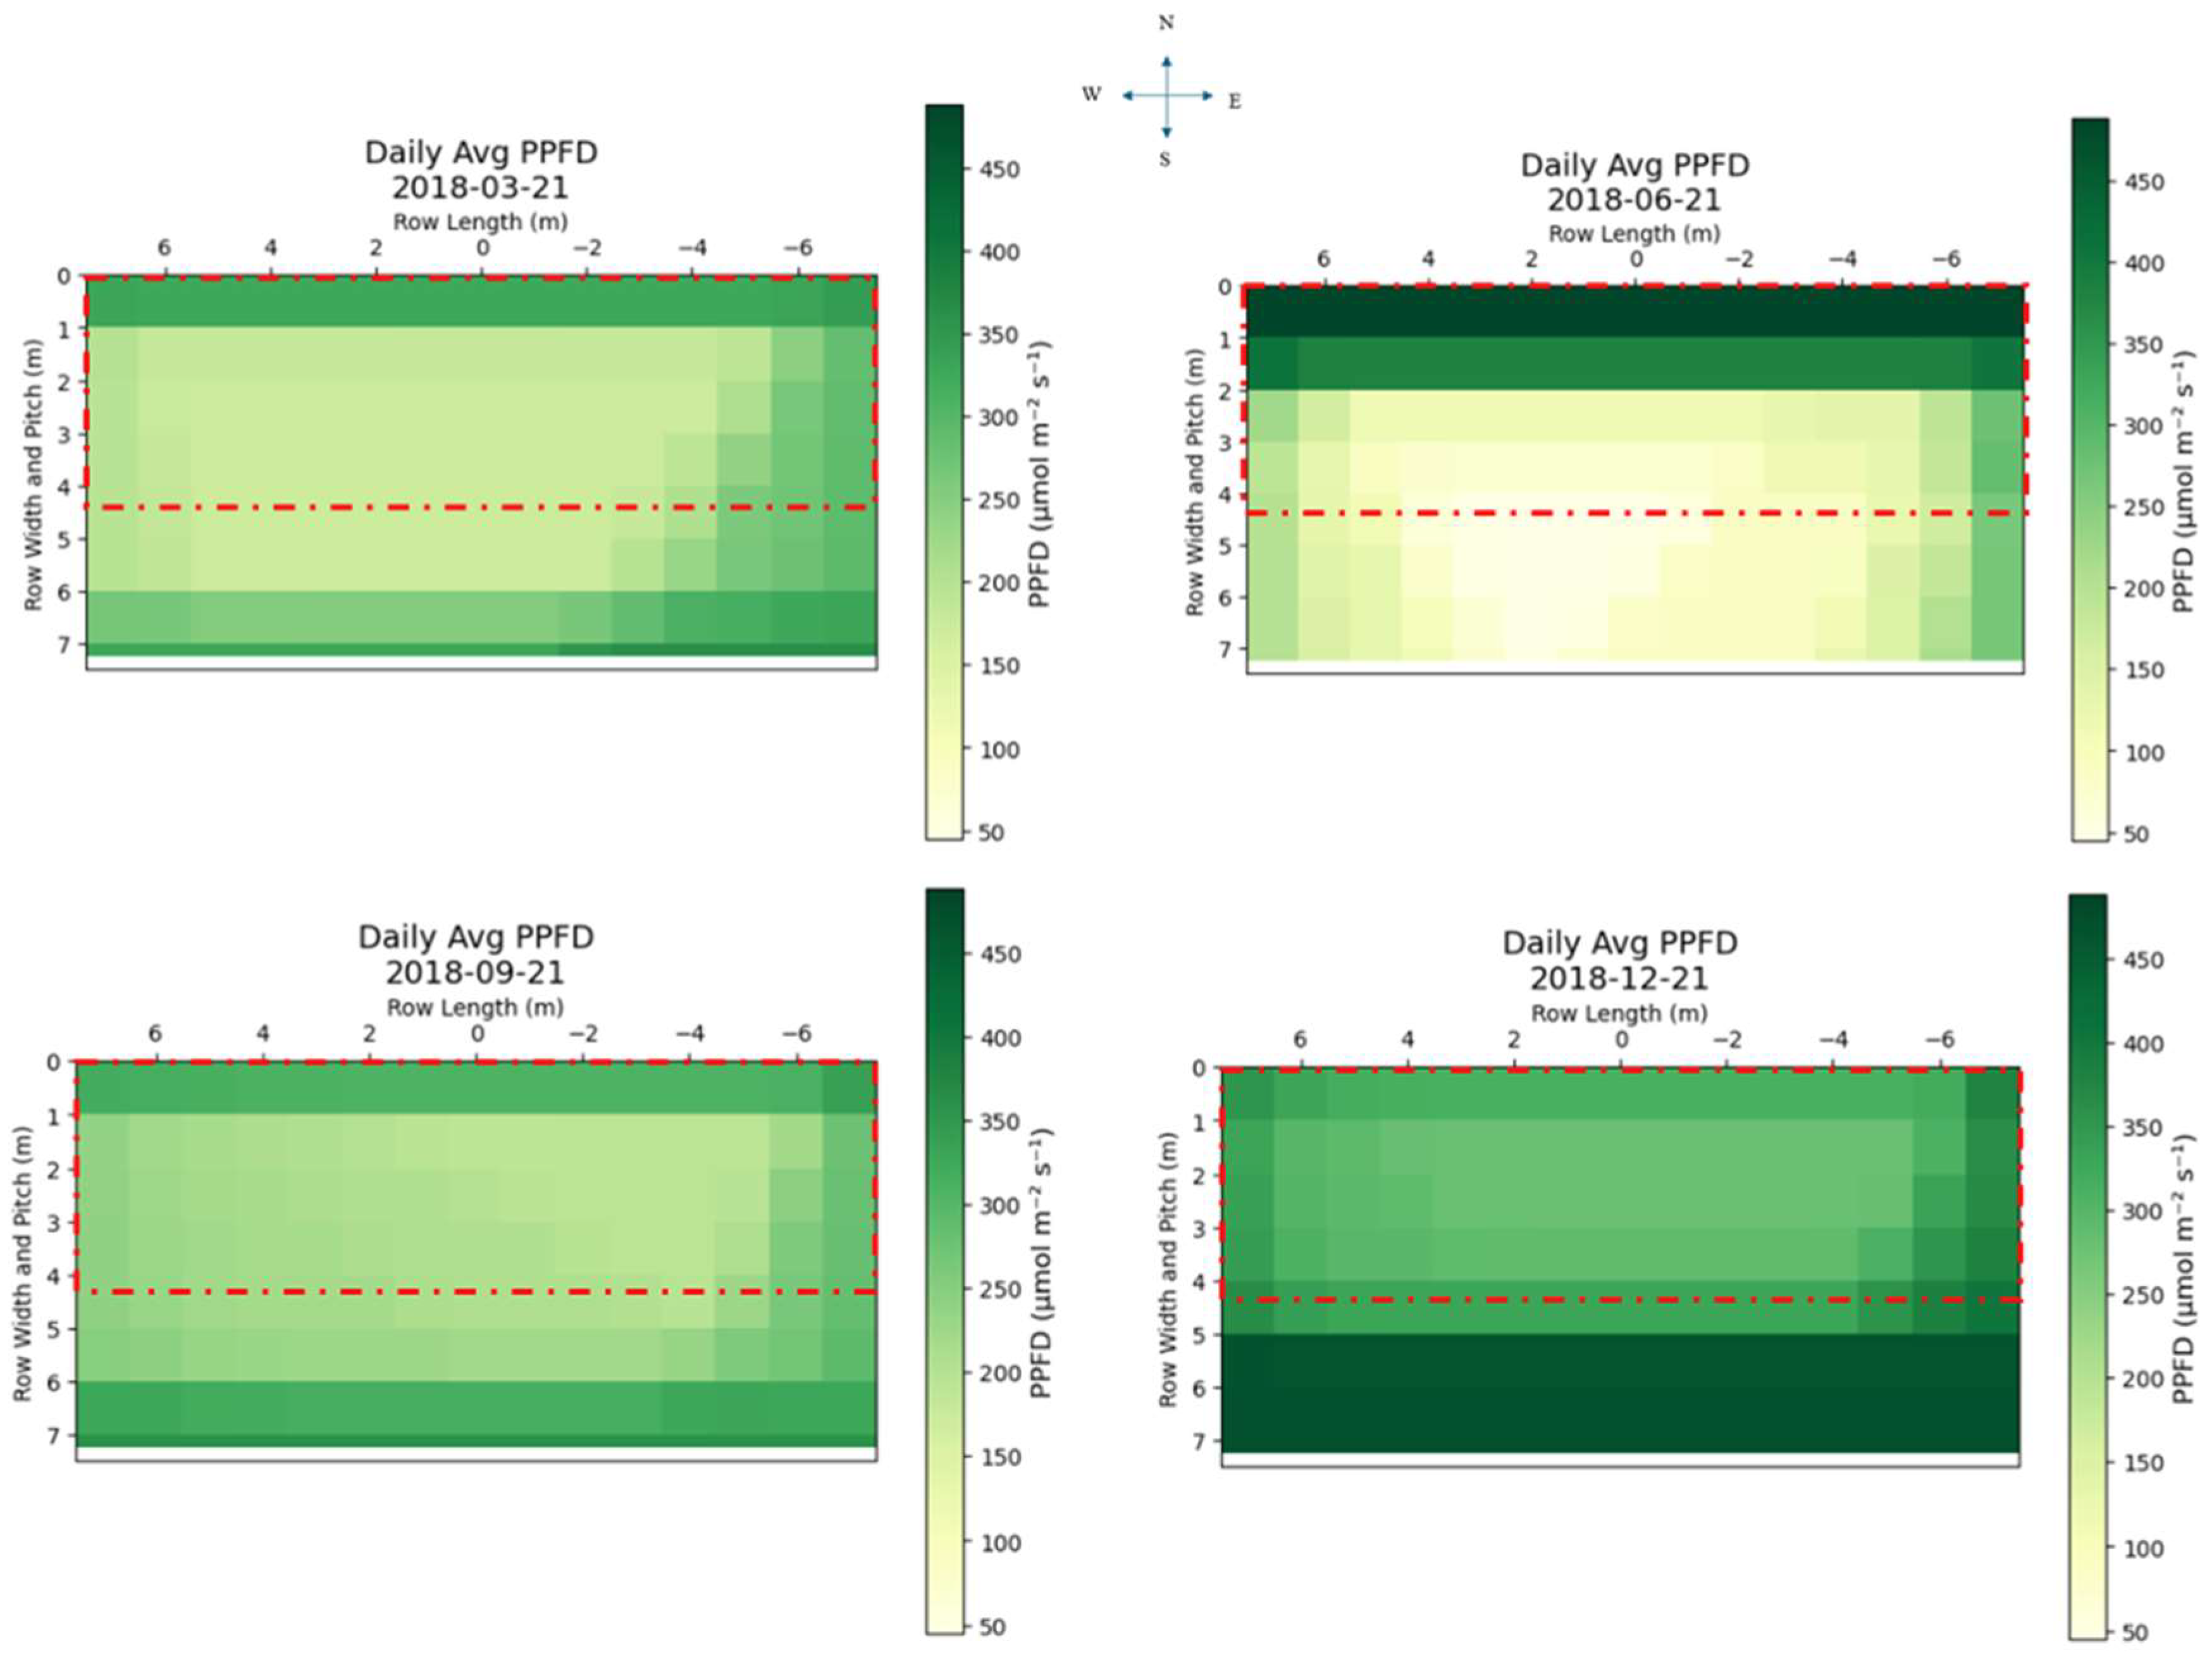
Figure 11 shows the heat maps of daily average PPFD beneath the PV array (dotted red boxes) for four key dates representing each season.
In the autumn and spring equinoxes there are balanced and moderately high PPFD values (200–350 μmol/m2/s). The summer solstice demonstrates the highest under-panel PPFD with values reaching close to 400 μmol/m2/s. Winter solstice exhibits the most severe shading, with the central under-panel region receiving as little as 50–100 μmol/m2/s.

4.3.3. Seasonal Average PPFD Across the Study Area

Figure 12 illustrates the seasonal average PPFD in the PV array. The values are based on daily mean PPFD readings integrated over each season, showing cumulative light availability for vegetation growth.

4.4. Summary of Averaged Ground Irradiance and PPFD Results by Season

To contextualize light availability for vegetation beneath the PV panels, seasonal averages of both global horizontal irradiance at ground level and the corresponding PPFD are summarized in Table 2. These values were derived from the full seasonal datasets and provide a high-level comparison of the solar energy resource and biologically active light across the year.

4.5. Vegetation Suitability Under Light Conditions

To assess the potential for integrating vegetation beneath the PV arrays, Table 3 presents a filtered subset of plant species that align with the observed average PPFD values recorded in the study area. A more complete list of species and PPFD values is available online [23]. The selected crops demonstrate PPFD requirements within the 200–800 μmol/m2/s range, aligning with the average under-panel PPFD observed during spring and summer.
There is a varying range in PPFDs of the vegetation. Nonetheless, these species represent viable candidates for agronomic experimentation in specific irradiance zones beneath the array. However, it is important to note that light availability during winter drops significantly below their active growth thresholds. This raises concerns about year-round viability of the vegetation. The perennial ryegrass (Lolium perenne L.) is the most widely sown grass type in Aotearoa New Zealand as well as in the Waikato regions as it grows in a variety of condition and is easy to manage. According to Brito et al. [43], cultivating this grass under 400 μmol m−2 s−1 light intensity supports peak dry biomass yield, if water and energy inputs are sufficient.
Table 4 presents the seasonal light requirements (DLI and PPFD) for a range of turfgrass cultivars, adapted from Unruh [44]. These values offer a reference for evaluating grass species beyond perennial ryegrass that may be suited for agrivoltaic environments or alternative grazing zones across the study area.

4.6. Sensitivity Analysis

4.6.1. Sensitivity to Panel Tilt and Orientation (Panel Azimuth)

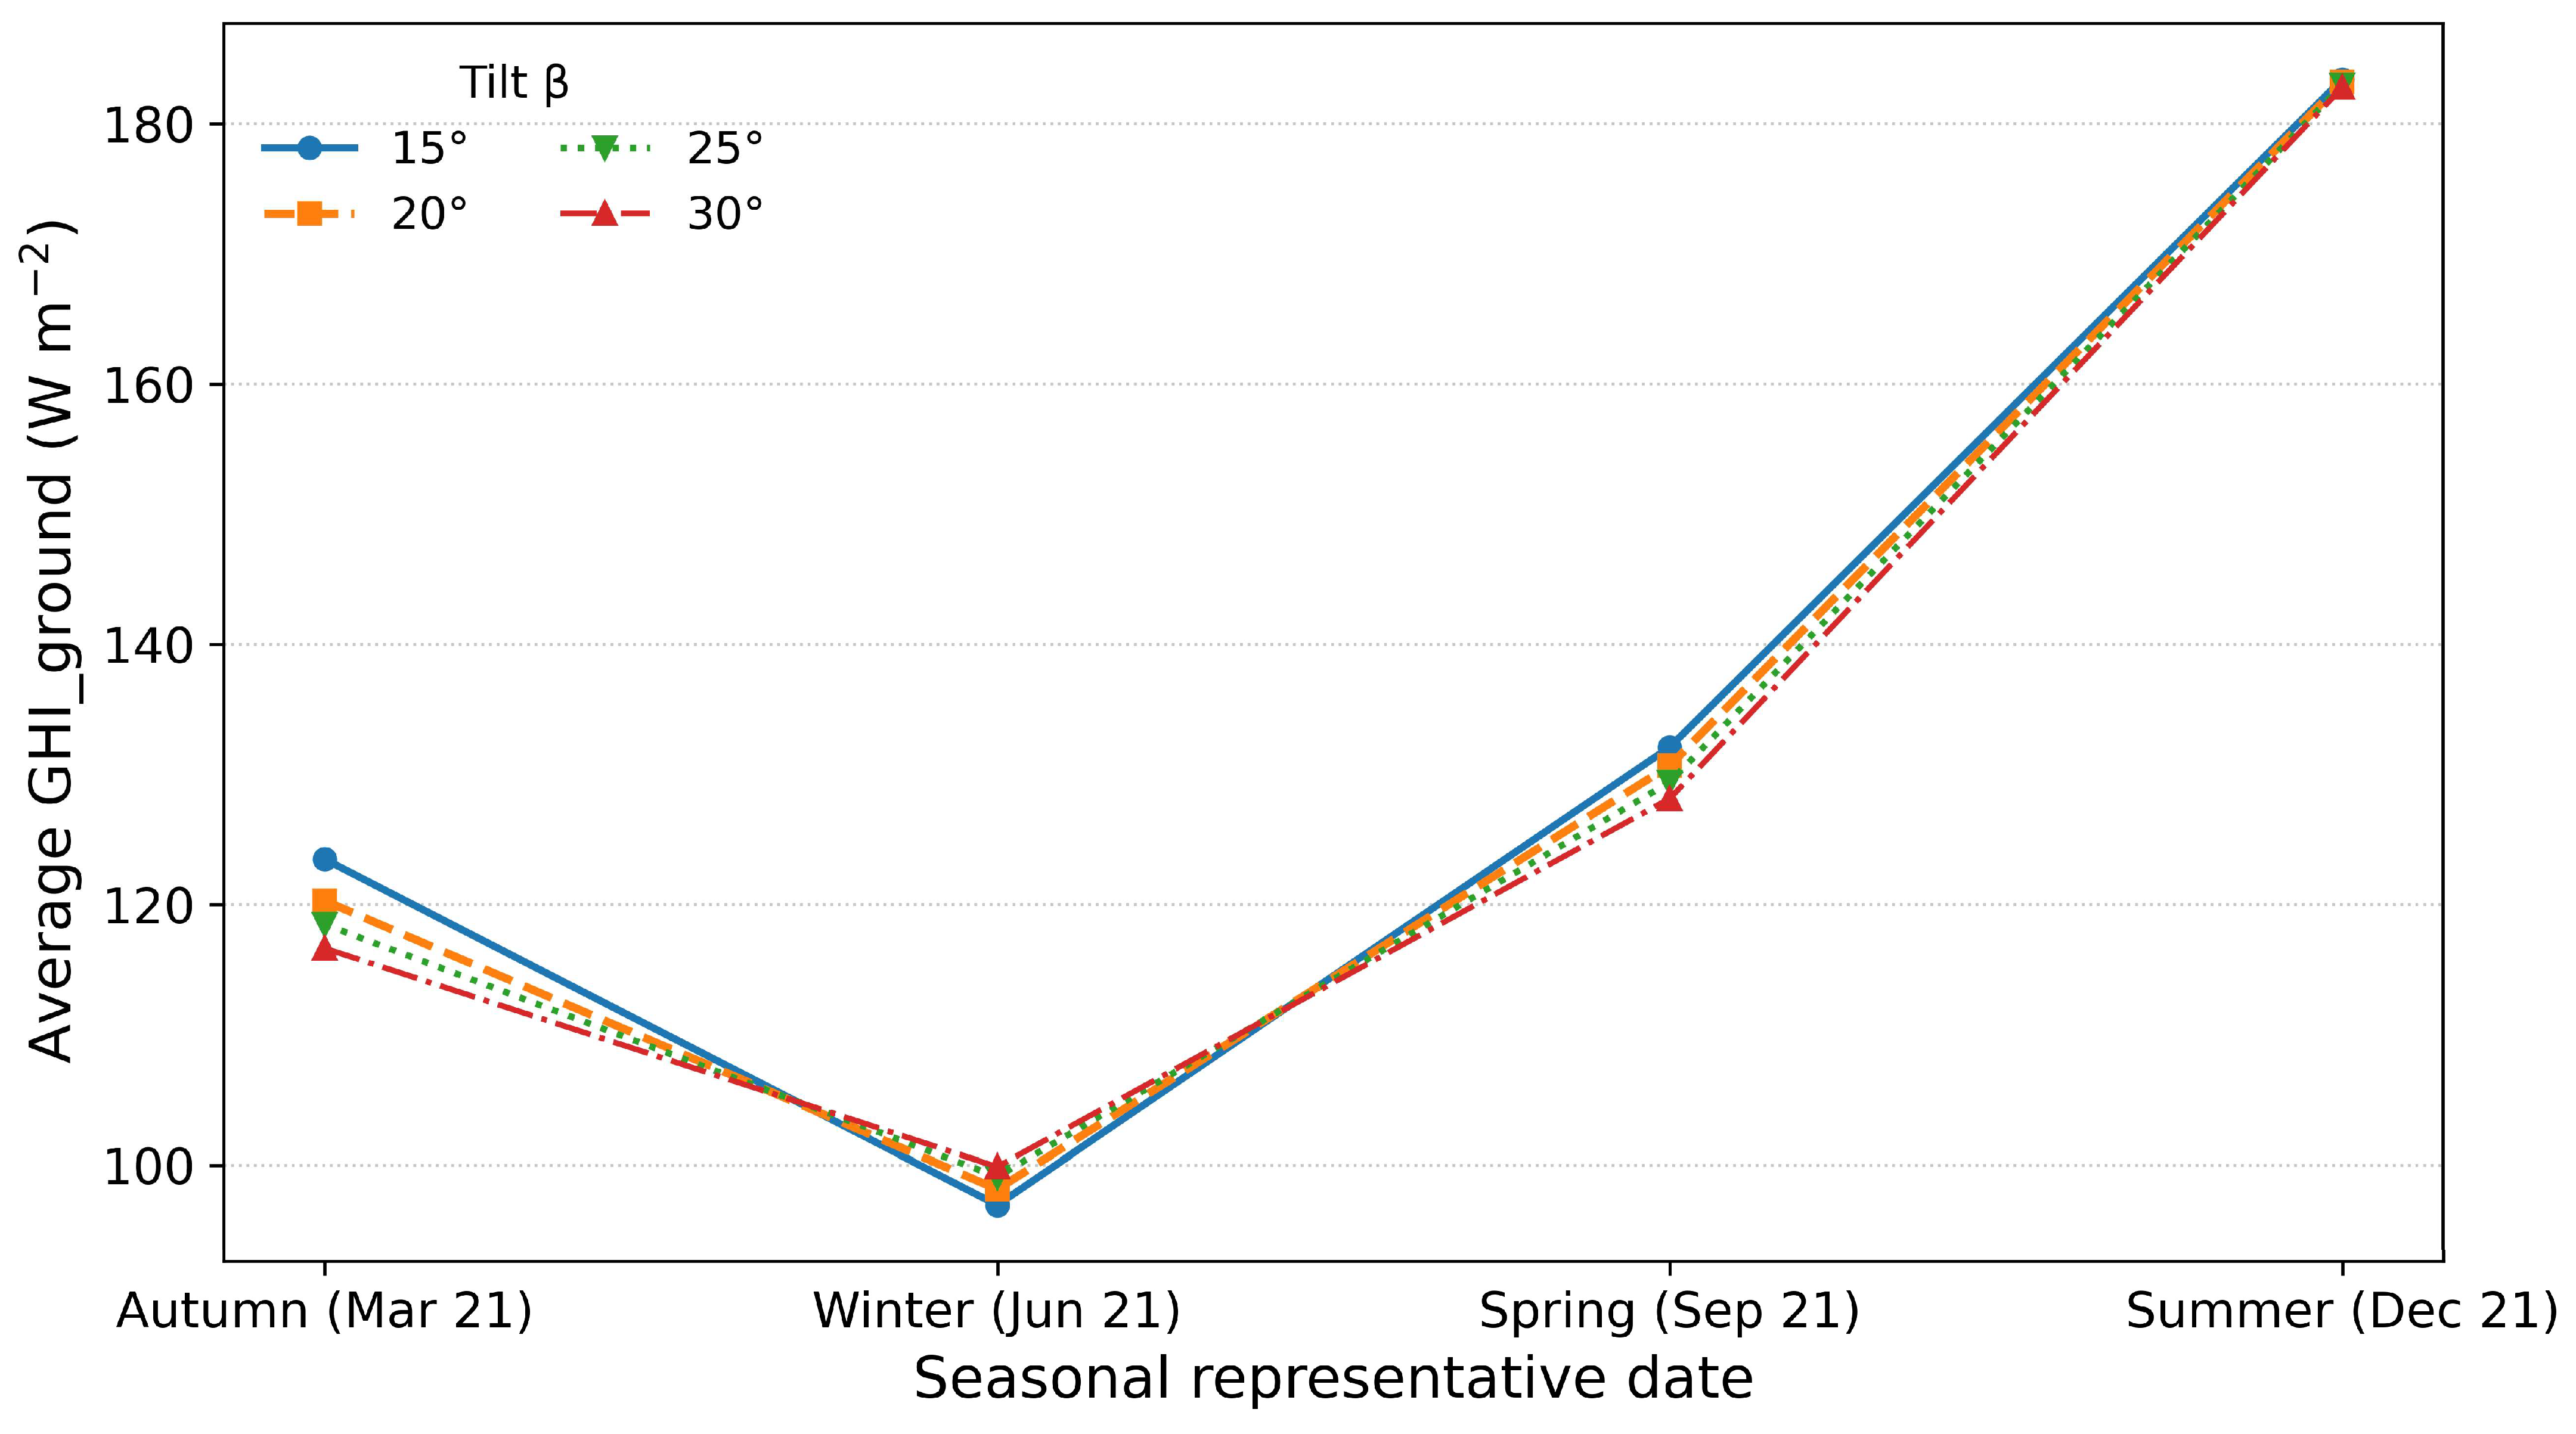
Sensitivity analyses were undertaken by recomputing the ground irradiance and PPFD with (a) tilt = {15°, 20°, 25°, 30°} at fixed azimuth 0° (see Figure 13), and (b) azimuth = {−30°, −20°, −10°, 0°, +10°, +20°, +30°} at fixed tilt 20° (see Figure 14).
Autumn is the season with the highest sensitivity to both parameters, with the panel orientation being more significant compared to the tilt angle.

4.6.2. Sensitivity to an Anisotropic Environment

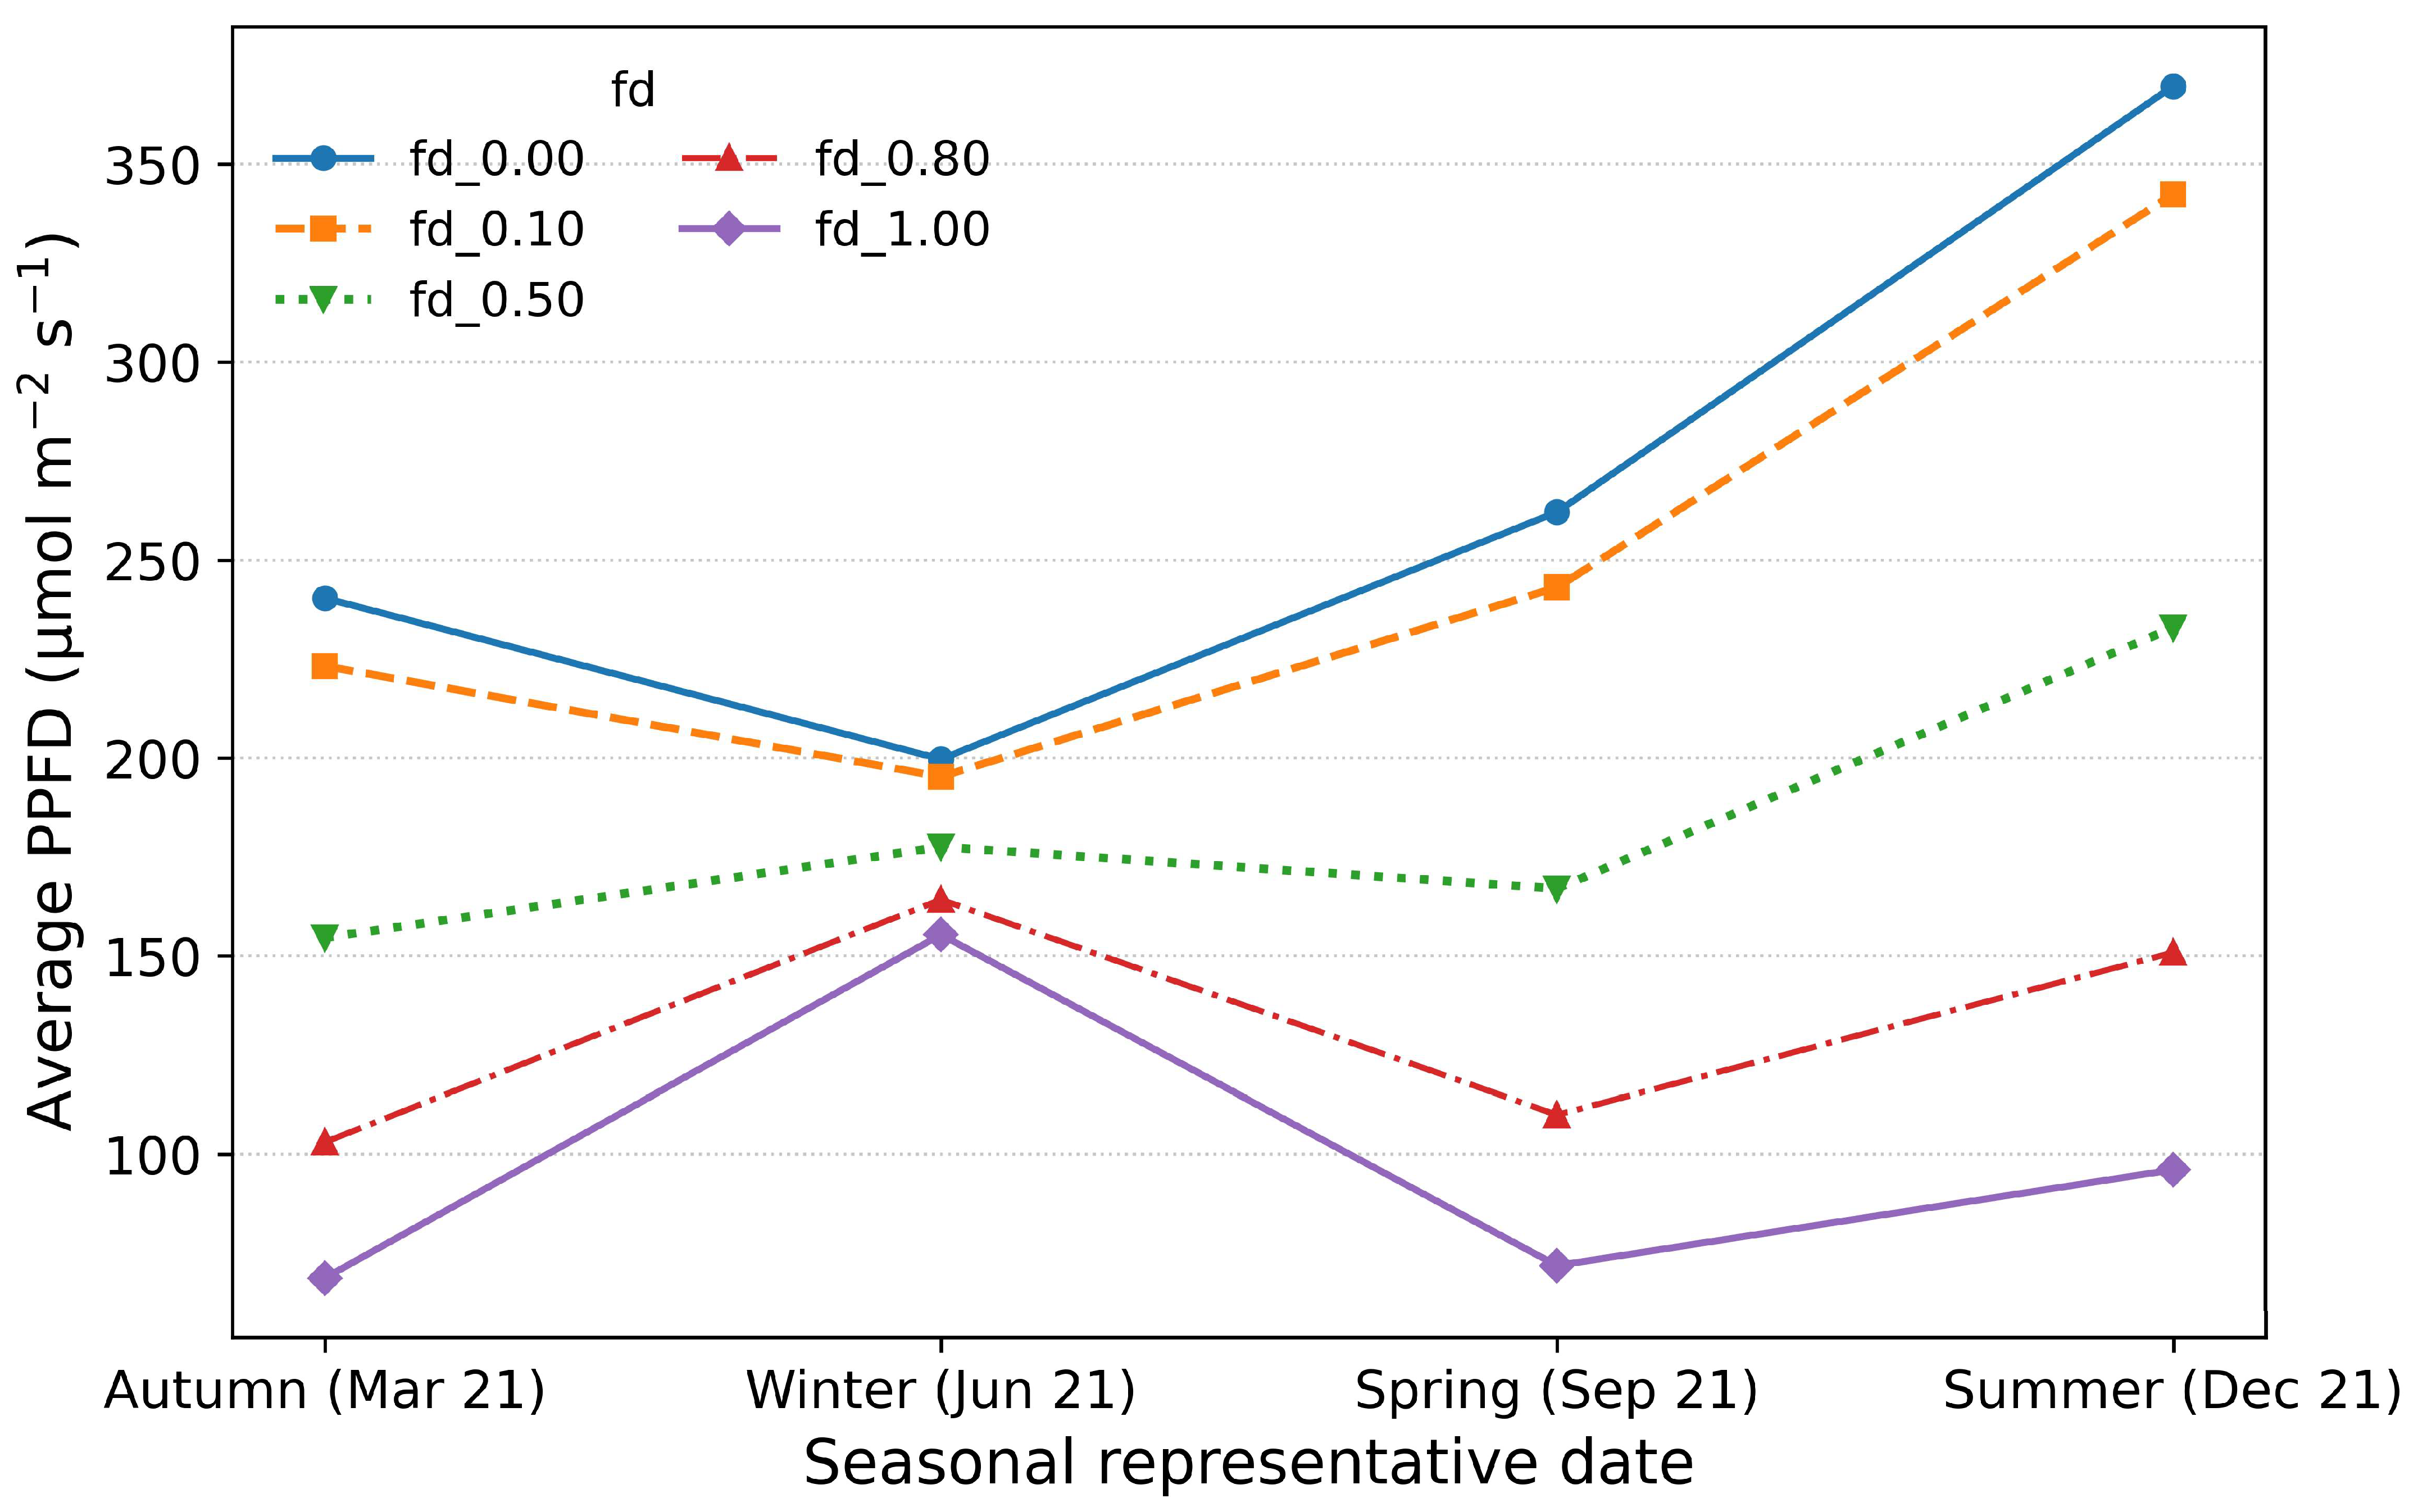
The baseline mode assumed an isotropic sky model, meaning the model outputs the maximum diffuse ration throughout each season. This may overestimate the overall ground irradiation within the study area. Thus, an anisotropic sensitivity analysis was conducted by varying the diffuse shading factor, fd from 0 to 1 for each of the four representative seasons.
Increasing fd reduces the GHIground, with the response pattern mirrored by the PPFD values (see Figure 15). Across all seasons the curves are ordered by fd (0→1), with higher diffuse shading factors yielding lower seasonal averages. The response, however, is weakest in winter and much more sensitive in the warmer seasons. Thus, the isotropic conditions are defensible in winter and will provide more accurate results in the mode than in the rest of the seasons.

5. Discussion

5.1. Seasonal Trends and Shading Dynamics

The simulations confirmed that seasonal variations in GHIground and PPFD are pronounced, with summer and spring providing the highest levels of irradiance and winter the lowest. This reflects expected variations in solar altitude and day length. Rolling average profiles further highlight the influence of atmospheric variability, where smoother irradiance patterns suggest clearer conditions during autumn compared to spring.
During summer, sustained irradiance exceeding 550 W/m2 and daily PPFD above 700 μmol/m2/s supports the active growth of light-demanding vegetation [39]. In contrast, winter PPFD values often fall below 400 μmol/m2/s, approaching or falling beneath compensation points for many C3 crops [24], thereby constraining productivity.

5.2. Spatial Light Distribution and Ground-Level Variability

The heat maps show non-uniform irradiance distribution caused by the panel array. Winter (June) shadows extend centrally with irradiance < 50 W/m2 under the panels, while summer displays more uniform light penetration with GHIground > 175 W/m2 in many areas. These spatial contrasts arise from seasonal solar geometries, particularly lower solar angles in winter.
Edge zones receive consistently higher irradiance due to grazing-angle radiation. These heterogeneities mirror the zone-based shading patterns identified by Adeh et al. [45]. Intermediate shading in spring and autumn reflects transitional solar paths and turbidity effects [41].
This spatial-temporal variation suggests a need for diverse planting strategies that match vegetation types with irradiance availability.

5.3. Interpretation of Seasonal PPFD Values and GHI Reduction

Seasonal GHIground is consistently lower than total GHI due to shading. The greatest relative reduction is observed in spring, followed by summer and autumn. Winter displays a small GHI-GHIground difference due to already limited solar input, indicating ambient solar constraints are more limiting than shading during that season.
Seasonal PPFD shows biologically significant variation. Summer levels > 600 μmol/m2/s support crop and forage viability. In spring and autumn, 400–600 μmol/m2/s is sufficient for moderate-light crops. Winter PPFD < 300 μmol/m2/s precludes active growth for most species.
These results affirm that seasonal and spatial dynamics of light under fixed-tilt systems require zone-specific and seasonally adaptive strategies. In summer, shading may offer protection from heat stress [46], while winter necessitates dormancy or soil conservation approaches.

5.4. Crop Suitability Based on PPFD Thresholds

The results confirm that moderate-light crops like lettuce, parsley, mint, sage, and cilantro are viable in spring and autumn under PPFD levels of 300–600 μmol/m2/s. These species tolerate partial shade and are commonly used in agrivoltaic trials. Garden lettuce and mint, especially, are well-suited to semi-shaded conditions.
Strawberries are highlighted for their seasonality: active growth aligns with spring/summer light, while winter dormancy avoids light limitations. High-light crops like tomatoes and roses (>600 μmol/m2/s) are feasible only in high-irradiance zones, such as inter-row corridors [21]. Maize and sunflowers require over 800 μmol/m2/s and thus fall outside viability.
The June solstice PPFD map (Figure 11) shows the central under-panel strip is mostly ~50–150 μmol/m2/s, with edge/inter-row bands approaching or exceeding ~200–300 μmol/m2/s. Relative to Table 3 and Table 4, these winter values lie below the active-growth ranges of most horticultural crops (≥300–600 μmol/m2/s, and >600 for high-light species). However, several shade-tolerant turf/cover cultivars listed in Table 4 (e.g., TifBlair centipedegrass, Captiva St. Augustine grass, BA-417 and JaMur/Palisades zoysias) are documented to persist at ~150–250 μmol/m2/s, so year-round ground cover is still feasible under panels in winter. In contrast, perennial ryegrass, a key forage species in Aotearoa New Zealand, tolerates ~400 μmol/m2/s [43], and it is likely to stagnate under panels during winter. Practically, winter management should treat the ground level directly under the panel as cover/dormancy zones during winter, using species that can survive low solar irradiation and concentrate grazing and light-demanding crop at the edge/inter-row band. The establishment of light-demanding species should be scheduled for spring–summer months, when the mapped PPFD exceeds the thresholds in Table 3 and Table 4.
Table 5 provides a species, zone and season suitability analysis (based on PPFD thresholds in Table 3 and Table 4 and mapped PPFD bands in Figure 11 and Figure 12).
These findings validate a tiered land-use model using light-tolerant species for under-panel zones, moderate-light species for edge areas, and dormant or conservation species in winter.

5.5. Limitations, and Policy Relevance

This study’s modelling relies on simulated solar geometry and shadow projection rather than ground-based validation. While outputs align with existing literature [21,22], use of in situ sensors in future work would enhance accuracy.
Intra-seasonal weather anomalies were not modelled, and species suitability was assessed from literature rather than trial data. The use of uniform sky models also excluded dynamic interactions like albedo feedback [47]. Assuming isotropic conditions tends to overestimate the PPFD under the panels, whereas omitting albedo slightly underestimates it. Given that the typical Waikato albedo is ~0.2, and the rarity of snow, the albedo contribution is expected to be small and does not overturn the interpretation that winter conditions remain very low in ground irradiation. Scenario sensitivity to an anisotropy proxy (varying a diffuse-occlusion factor) indicated only modest shifts in winter daily means compared with spring/summer, supporting the assessment that winter results are comparatively insensitive to diffuse-sky representation. Overall, the combined effect likely yields a slight overestimate of winter PPFD. This trade-off is acknowledged as a modelling limitation; future refinements should incorporate anisotropic diffuse and an albedo term, calibrated with site-specific albedo measurements.
Socio-economic and policy considerations, including landholder engagement, were beyond the scope, but remain essential for real-world adoption [5,48].

6. Conclusions

The study concludes that the fixed-tilt PV arrays at the Tauhei solar farm modify ground-level PPFD both seasonally and spatially. Most of the year, under-panel zones are low-light, with high irradiance limited to edges and summer periods. Crop suitability depends on aligning physiological light needs with seasonal patterns. Low-light turfgrass and dormant crops such as strawberries present year-round options.
Winter shows the least irradiance but also the smallest GHI-GHIground difference, suggesting that PV shading has less influence than natural light scarcity. Design responses should prioritize light management in spring and summer.
The study affirms that integrating vegetation with solar PV is feasible using light-zoned land-use planning, shade-tolerant species, and adaptive seasonal strategies. These practices can support Aotearoa New Zealand’s goals for renewable energy and sustainable land use.

6.1. Recommendations for Policy and Practice

Several actionable recommendations arise from this work:
  • Incorporate agronomic criteria into solar farm planning: Regulatory and permitting bodies should consider mandating vegetation-light modelling as part of environmental impact assessments for new PV farms, especially in agricultural zones.
  • Encourage dual-use land strategies: This research supports national policies promoting land-use optimization. Integrating solar PV with grazing or shade-tolerant cropping could increase land efficiency and socio-ecological resilience.
  • Establish vegetation monitoring baselines: Ongoing empirical studies at operational solar farms should monitor vegetation health, light variability, and species adaptation to inform future development guidelines.
  • Site-specific light management: Developers should use light zoning maps to guide panel spacing, tilt, and layout adjustments that enable vegetative growth beneath or adjacent to arrays without compromising energy output.
  • The first two policy-related actions, especially, will improve the current land-use regulations in Aotearoa New Zealand in terms of informing, and addressing some of the challenges of, the resource consenting process of solar farms [49]—also referred to as environmental authorization in other countries.

6.2. Recommendations for Further Research

To build on this research, the following is recommended:
  • The framework needs to be extended to single-axis tracking with backtracking to ensure maximization of both energy yield and vegetation productivity.
  • Empirical validation using spectroradiometers or quantum sensors beneath installed PV panels is essential. Ground measurements in different seasons and at different times of day will help calibrate the model and adjust for real-world deviations, particularly during variable cloud conditions.
  • Derive uncertainty margins by logging PPFD and GHI with quantum meter and pyranometers, respectively, in the research study area—below panel, edge, and inter-row zones throughout the seasons—to compute root mean square error (RMSE), mean absolute error (MAE), and bias (mean error) against the model outputs.
  • Crop modelling tools could be integrated with light simulations to assess actual biomass or yield projections under modified light regimes. Model microclimate interactions (for example, evapotranspiration).
  • Extend this analysis to different regions of Aotearoa New Zealand with varying climatic and ecological conditions.

Author Contributions

Conceptualization, A.C.B.; methodology, A.C.B. and M.M.D.; software, M.M.D.; formal analysis, M.M.D.; data curation, M.M.D.; writing—original draft preparation, M.M.D.; writing—review and editing, A.C.B.; visualization, M.M.D.; supervision, A.C.B. All authors have read and agreed to the published version of the manuscript.

Funding

This research received no external funding.

Data Availability Statement

Dataset available on request from the authors.

Acknowledgments

During the preparation of this manuscript/study, the authors used OpenAI Version GPT-4o for the purposes of creating Figure 4. The authors have reviewed and edited the output and take full responsibility for the content of this publication.

Conflicts of Interest

The authors declare no conflicts of interest.

Abbreviations

The following abbreviations are used in this manuscript:
DHIDiffuse Horizontal Irradiance
DNIDirect Normal Irradiance
GHIGlobal Horizontal Irradiance
PPFDPhotosynthetic Photon Flux Density
SLRMSolar and Longwave Radiation Model (SLRM)
SPASolar Positioning Algorithm

References

  1. Ministry for the Environment. New Zealand’s Projected Greenhouse Gas Emissions to 2050. Available online: https://environment.govt.nz/what-government-is-doing/areas-of-work/climate-change/emissions-reductions/emissions-reduction-targets/new-zealands-projected-greenhouse-gas-emissions-to-2050/ (accessed on 14 August 2025).
  2. Ministry of Business, Innovation & Employment. Consultation Document: Advancing New Zealand’s Energy Transition. Available online: https://www.mbie.govt.nz/building-and-energy/energy-and-natural-resources/energy-consultations-and-reviews/advancing-new-zealands-energy-transition-consultation-document (accessed on 14 August 2025).
  3. Concept Consulting. Generation Investment Survey: 2023 Update. Prepared for the Electricity Authority. Available online: https://www.ea.govt.nz/documents/4414/Generation_Investment_Survey_-_2023_update.pdf (accessed on 14 August 2025).
  4. Brent, A.C.; Iorns, C. Solar Farms Can Eat up Farmland–But ‘Agrivoltaics’ Could Mean the Best of Both Worlds for NZ Farmers. The Conversation. 2024. Available online: https://theconversation.com/solar-farms-can-eat-up-farmland-but-agrivoltaics-could-mean-the-best-of-both-worlds-for-nz-farmers-230531 (accessed on 14 August 2025).
  5. Brent, A.C. Agrivoltaic systems for Aotearoa New Zealand. Int. J. Environ. Sci. Nat. Res. 2024, 33, 556357. [Google Scholar] [CrossRef]
  6. NIWA. Overview of New Zealand’s Climate. Available online: https://niwa.co.nz/climate-and-weather/overview-new-zealands-climate (accessed on 14 August 2025).
  7. Vaughan, A.; Brent, A.C.; Fitzgerald, M.; Kueppers, J. Agrivoltaics: Integrating Solar Energy Generation with Livestock Farming in Canterbury. Our Land and Water National Science Challenge, Rural Profession Fund Technical Report. June 2023. Available online: https://ourlandandwater.nz/outputs/integrating-solar-livestock-report/ (accessed on 14 August 2025).
  8. Beechey-Gradwell, Z.; Ali, A.; Shorten, P. Putting the Farm into Solar Farms. MPI Technical Paper 2025/15. December 2024. Available online: https://www.mpi.govt.nz/dmsdocument/68067-Putting-the-Farm-into-Solar-Farms/ (accessed on 14 August 2025).
  9. Arksey, H.A.; O’Malley, L. Scoping studies: Towards a methodological framework. Int. J. Soc. Res. Method. 2005, 8, 19–32. [Google Scholar] [CrossRef]
  10. Levac, D.; Colquhoun, H.; O’Brien, K.K. Scoping studies: Advancing the methodology. Implement. Sci. 2010, 5, 69. [Google Scholar] [CrossRef]
  11. Sarr, A.; Soro, Y.M.; Tossa, A.K.; Diop, L. A new approach for modelling photovoltaic panel configuration maximizing crop yield and photovoltaic array outputs in agrivoltaics systems. Energy Convers. Manag. 2024, 309, 118436. [Google Scholar] [CrossRef]
  12. Perna, A. Modeling and Optimizing Irradiance Distributions in Agrivoltaic Systems. Master’s Thesis, Purdue University, West Lafayette, IN, USA, 2021. Available online: https://hammer.purdue.edu/ndownloader/files/17970563 (accessed on 14 August 2025).
  13. Najafabadi, M.K. Shade and Light Modeling for Agrivoltaic Systems: With Focus on Single-axis Agrivoltaic Systems. Master’s Thesis, Lund University, Lund, Sweden, 2024. Available online: http://lup.lub.lu.se/student-papers/record/9151020 (accessed on 14 August 2025).
  14. Fagnano, M.; Fiorentino, N.; Visconti, D.; Baldi, G.M.; Falce, M.; Acutis, M.; Genovese, M.; Blasi, M.D. Effects of a photovoltaic plant on microclimate and crops’ growth in a Mediterranean area. Agronomy 2024, 14, 466. [Google Scholar] [CrossRef]
  15. Noor, N.F.M.; Reeza, A.A. Effects of solar photovoltaic installation on microclimate and soil properties in UiTM 50MWac solar park, Malaysia. IOP Conf. Ser. Earth Environ. Sci. 2022, 1059, 012031. [Google Scholar] [CrossRef]
  16. Gupta, R.; Kumar, M.; Tiwari, R.; Khare, R. Effects of shading in agrivoltaic systems on maize yield: A case study. Appl. Energy 2024, 262, 114564. [Google Scholar]
  17. Chen, X.; Chen, B.; Wang, Y.; Zhou, N.; Zhou, Z. Response of vegetation and soil property changes by photovoltaic established stations based on a comprehensive meta-analysis. Land 2024, 13, 478. [Google Scholar] [CrossRef]
  18. Feistel, U.; Werisch, S.; Marx, P.; Kettner, S.; Ebermann, J.; Wagner, L. Assessing the impact of shading by solar panels on evapotranspiration and plant growth using lysimeters. AIP Conf. Proc. 2022, 2635, 150001. [Google Scholar] [CrossRef]
  19. Hickey, T. Plant Growth Under Photovoltaic Arrays of Varying Transparencies—A Study of Plant Response to Light and Shadow in Agrivoltaic Systems. Master’s Thesis, Colorado State University, Fort Collins, CO, USA, 2023. Available online: https://hdl.handle.net/10217/236849 (accessed on 14 August 2025).
  20. Ko, D.-Y.; Chae, S.-H.; Moon, H.-W.; Kim, H.J.; Seong, J.; Lee, M.-S.; Ku, K.-M. Agrivoltaic farming insights: A case study on the cultivation and quality of kimchi cabbage and garlic. Agronomy 2023, 13, 2625. [Google Scholar] [CrossRef]
  21. Potenza, E.; Croci, M.; Colauzzi, M.; Amaducci, S. Agrivoltaic system and modelling simulation: A case study of soybean (Glycine max L.) in Italy. Horticulturae 2022, 8, 1160. [Google Scholar] [CrossRef]
  22. Scarano, A.; Semeraro, T.; Calisi, A.; Aretano, R.; Rotolo, C.; Lenucci, M.S.; Santino, A.; De Caroli, M. Effects of the agrivoltaic system on crop production: The case of tomato (Solanum lycopersicum L.). Appl. Sci. 2024, 14, 3095. [Google Scholar] [CrossRef]
  23. RED Horticulture. Measuring Light in Horticulture: PAR, PPF, and PPFD. Available online: https://www.horticulture.red/en/measuring-light-in-horticulture-par-ppf-and-ppfd/ (accessed on 14 August 2025).
  24. Laub, M.; Ehmann, A.; Weselek, A. Impact of shading on crop yields: A meta-analysis of agrivoltaic systems. Renew. Energy 2022, 150, 280–292. [Google Scholar] [CrossRef]
  25. Jedmowski, C.; Kherde, S.; Pahwa, A.; Schlechtrimen, V.; Meier-Grűll, M.; Muller, O. Effect of shading in an agri-PV system on structure and growth of ornamental plants. In AgriVoltaics Conference Proceedings; TIB Open Publishing: Hannover, Germany, 2022. [Google Scholar] [CrossRef]
  26. Sturchio, M.A.; Kannenberg, S.A.; Knapp, A.K. Agrivoltaic arrays can maintain semi-arid grassland productivity and extend the seasonality of forage quality. App. Energy 2024, 356, 122418. [Google Scholar] [CrossRef]
  27. Kampherbeek, E.W.; Webb, L.E.; Reynolds, B.J.; Sistla, S.A.; Horney, M.R.; Ripoll-Bosch, R.; Dubowsky, J.P.; McFarlane, Z.D. A preliminary investigation of the effect of solar panels and rotation frequency on the grazing behavior of sheep (Ovis aries) grazing dormant pasture. App. Anim. Behav. Sci. 2023, 258, 105799. [Google Scholar] [CrossRef]
  28. Andrew, A.C.; Higgins, C.W.; Smallman, M.A.; Graham, M.; Ates, S. Herbage yield, lamb growth and foraging behavior in agrivoltaic production system. Front. Sustain. Food Syst. 2021, 5, 659175. [Google Scholar] [CrossRef]
  29. Andrew, A.C.; Higgins, C.W.; Smallman, M.A.; Prado-Tarango, D.E.; Rosati, A.; Ghajar, S.; Graham, M.; Ates, S. Lamb growth and seasonal herbage production from simple, diverse and legume pastures in an agrivoltaic system. Grass Forage Sci. 2024, 79, 294–307. [Google Scholar] [CrossRef]
  30. Moretta, M.; Rossi, R.; Padovan, G.; Moriondo, M.; Staglianò, N. The impact of photovoltaic on permanent grassland composition and productivity in central Italy. In AgriVoltaics Conference Proceedings; TIB Open Publishing: Hannover, Germany, 2024; Available online: https://www.tib-op.org/ojs/index.php/agripv/article/view/1372/2662 (accessed on 14 August 2025).
  31. Madej, L.; Picon-Cochard, C.; Bouhier de l’Ecluse, C.; Cogny, C.; Michaud, L.; Roncoroni, M.; Colosse, D. One year of grassland vegetation dynamics in two sheep-grazed agrivoltaic systems. In AgriVoltaics Conference Proceedings; TIB Open Publishing: Hannover, Germany, 2022. [Google Scholar] [CrossRef]
  32. Environmental Protection Authority. The Application Documents for the Tauhei Solar Farm. 2022. Available online: https://www.epa.govt.nz/fast-track-consenting/referred-projects/tauhei-solar-farm/the-application/ (accessed on 14 August 2025).
  33. SLR Consulting. Tauhei Solar Farm: Harmony Energy New Zealand. SLR Projects. 2024. Available online: https://www.slrconsulting.com/projects/tauhei-solar-farm (accessed on 14 August 2025).
  34. Quaschning, V.; Hanitsch, R. Shade Calculations in Photovoltaic Systems. ISES Solar World Conference, Harare, Zimbabwe, 1995. Available online: https://www.researchgate.net/profile/Volker-Quaschning/publication/268519841_ISES1995/links/546f37d70cf216f8cfa9cb5b/ISES1995.pdf (accessed on 14 August 2025).
  35. Perez, R.S. A new simplified version of the Perez diffuse irradiance model for tilted surfaces. Sol. Energy 1987, 39, 221–231. [Google Scholar] [CrossRef]
  36. Essery, R.; Marks, D. Scaling and parametrization of clear-sky solar radiation over complex topography. J. Geophys. Res. Atmos. 2007, 112, D10122. [Google Scholar] [CrossRef]
  37. McArthur, L.J.B.; Hay, J.E. A technique for mapping the distribution of diffuse solar radiation over the sky hemisphere. J. App. Meteor. Clim. 1981, 20, 421–429. [Google Scholar] [CrossRef]
  38. Gu, L.; Baldocchi, D.; Verma, S.B.; Black, T.A.; Vesala, T.; Falge, E.M.; Dowty, P.R. Advantages of diffuse radiation for terrestrial ecosystem productivity. J. Geophys. Res. Atmos. 2002, 107, ACH 4-1-ACL 3-1. [Google Scholar] [CrossRef]
  39. Xia, X. A critical assessment of direct radiative effects of different aerosol types on surface global radiation and its components. J. Quant. Spectrosc. Radiat. Trans. 2014, 149, 72–80. [Google Scholar] [CrossRef]
  40. Oke, T.R. The energetic basis of the urban heat island. Q. J. R. Meteorol. Soc. 1982, 108, 1–24. [Google Scholar] [CrossRef]
  41. Danny, H.W.; Li, J.C. Predicting solar irradiance on inclined surfaces using sky radiance data. Energy Conver. Man. 2004, 45, 1771–1781. [Google Scholar] [CrossRef]
  42. Bosch, J.L.; López, G.; Batlles, F.J. Global and direct photosynthetically active radiation parameterizations for clear-sky conditions. Agric. For. Meteorol. 2009, 149, 146–158. [Google Scholar] [CrossRef]
  43. Brito, C.; Ferreira, H.; Dinis, L.-T.; Trindade, H.; Marques, D.; Correia, C.M.; Moutinho-Pereira, J. Different LED light intensity and quality change perennial ryegrass (Lolium perenne L.) physiological and growth responses and water and energy consumption. Front. Plant Sci. 2023, 14, 1160100. [Google Scholar] [CrossRef]
  44. Unruh, J.B. Daily Light Requirements for Grass Species. Lecture, University of Florida. 2015. Available online: https://wfrec.ifas.ufl.edu/media/wfrecifasufledu/docs/pdf/turfgrass/Daily_Light_Requirements_Lawn_Grasses_FTGA_2015_Unruh.pdf (accessed on 14 August 2025).
  45. Adeh, E.H.; Selker, J.S.; Higgins, C.W. Remarkable agrivoltaic influence on soil moisture, micrometeorology, and water-use efficiency. PLoS ONE 2018, 13, e0203256. [Google Scholar]
  46. Marrou, H.; Guilioni, L.; Dufour, L.; Dupraz, C.; Wery, J. Microclimate under agrivoltaic systems: Is crop growth hindered by the reduction in solar energy? Agric. For. Meteorol. 2013, 177, 117–132. [Google Scholar] [CrossRef]
  47. Vignola, F.; Peterson, J.; Kessler, R.; Snider, S.; Gotseff, P.; Sengupta, M.; Habte, A.; Andreas, A.; Mavromatakis, F. Influence of diffuse and ground-reflected irradiance on the spectral modelling of solar reference cells. In Proceedings of the ASES National Solar Conference Proceedings, Boulder, CO, USA, 3–6 August 2021. [Google Scholar] [CrossRef]
  48. Hernandez, R.R.; Easter, S.B.; Murphy-Mariscal, M.L.; Maestre, F.T.; Tavassoli, M.; Allen, E.B.; Allen, M.F. Environmental impacts of utility-scale solar energy. Renew. Sustain. Energy Rev. 2014, 29, 766–779. [Google Scholar] [CrossRef]
  49. Brent, A.; Iorns, C.; Brent, A.C. Consenting and developing solar farms in Aotearoa New Zealand: Challenges and way forward. Res. Man. J. 2025, 19–23. [Google Scholar] [CrossRef]
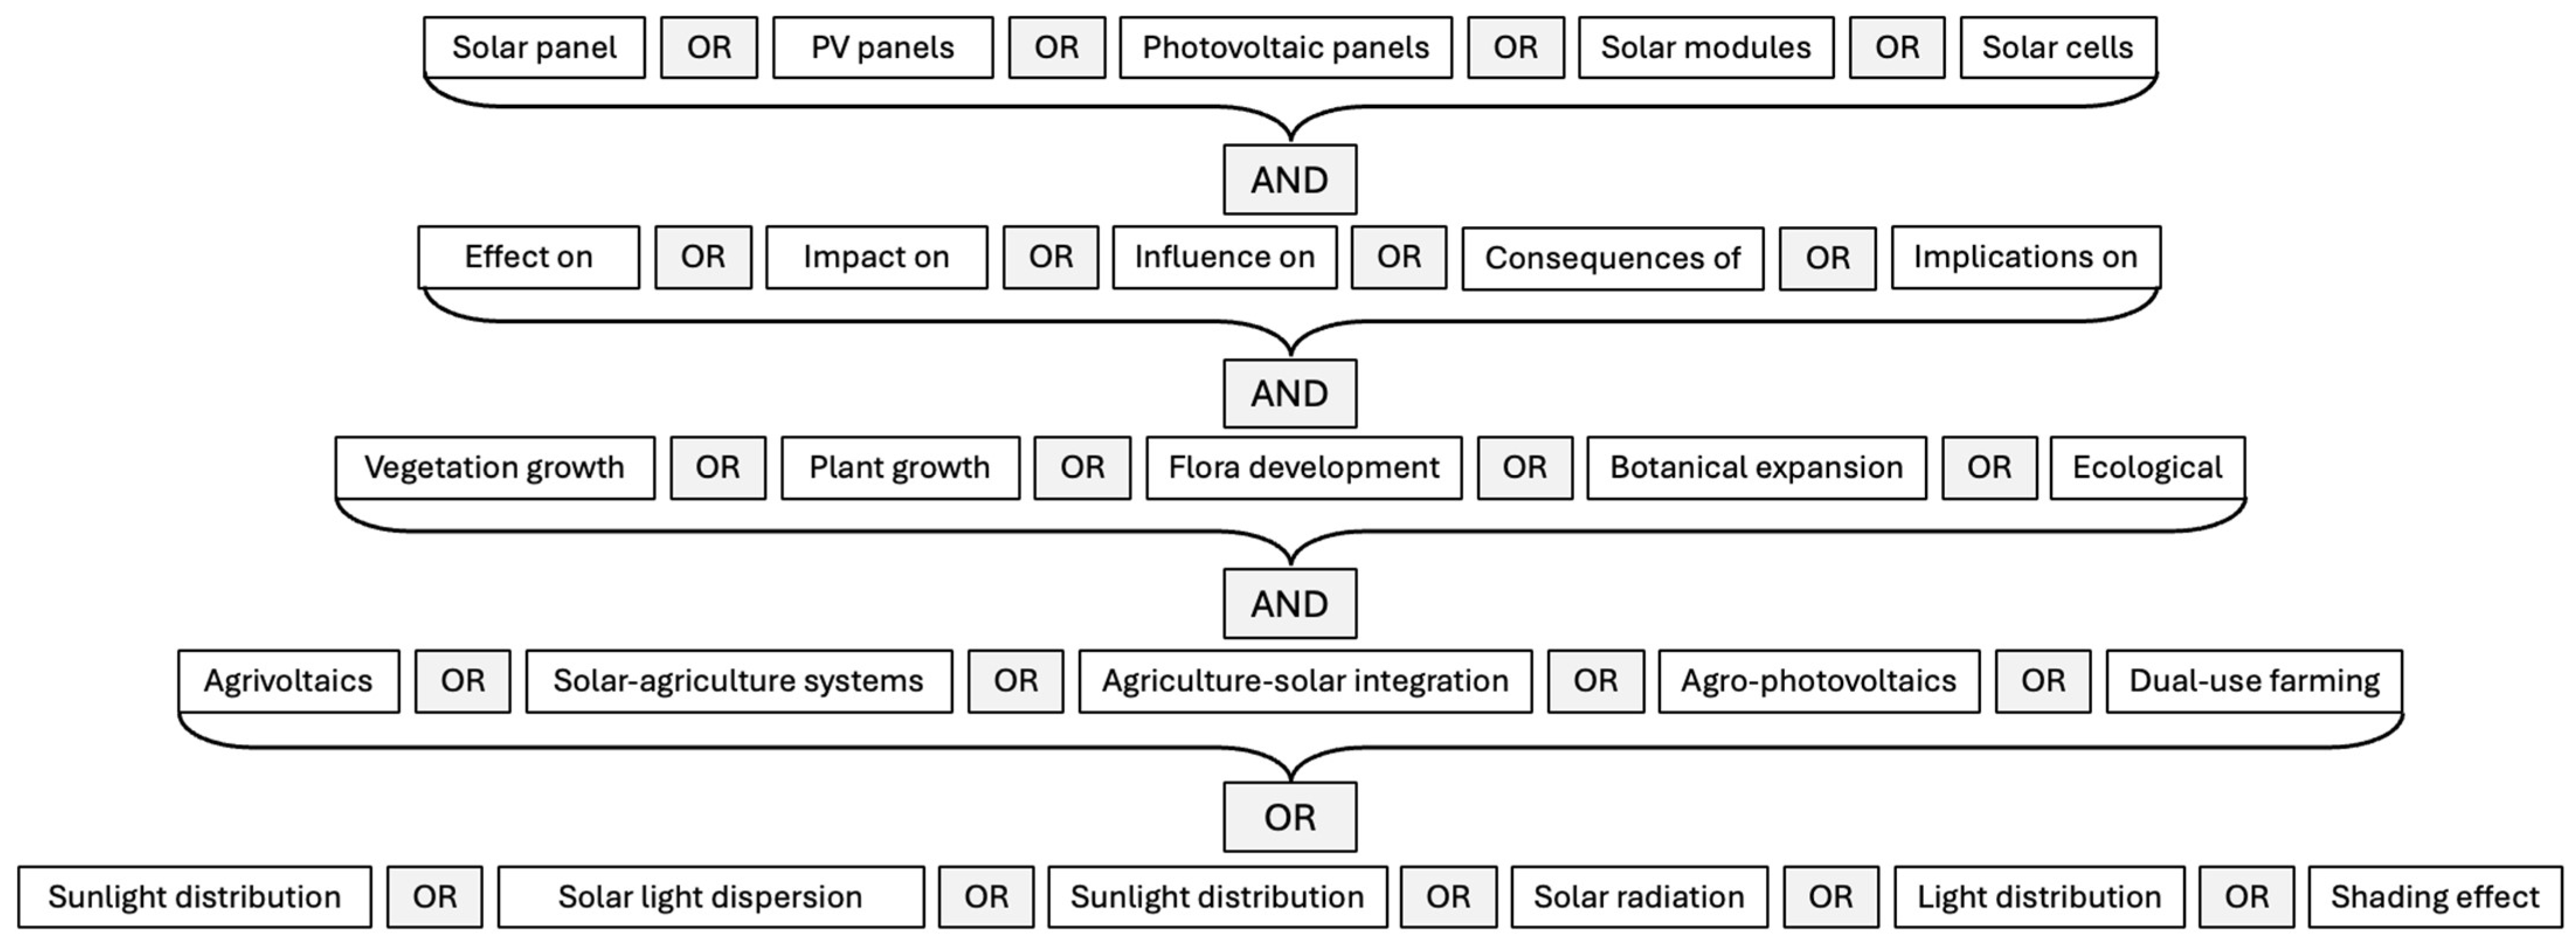
Figure 1. Search query within each database.
Energies 18 05412 g001
Figure 2. Location of Tauhei solar farm on the North Island.
Energies 18 05412 g002
Figure 3. Solar panel array and study area.
Energies 18 05412 g003
Figure 4. Shading factor illustration.
Energies 18 05412 g004
Figure 5. Representation of the panel array using geographic reference.
Energies 18 05412 g005
Figure 6. Day visualisation of the equinoxes and solstices.
Energies 18 05412 g006
Figure 7. GHIground rolling average for the four representative days.
Energies 18 05412 g007
Figure 8. Spatial heat maps for ground irradiance for the representative seasons.
Energies 18 05412 g008
Figure 9. Comparison of seasonal average GHI and the average of ground irradiance.
Energies 18 05412 g009
Figure 10. Daily average PPFD across the seasonal cycle.
Energies 18 05412 g010
Figure 11. Heat map of PPFD across seasons (representative days).
Energies 18 05412 g011
Figure 12. Seasonal PPFD averages.
Energies 18 05412 g012
Figure 13. Sensitivity of seasonal average PPFD to panel tilt.
Energies 18 05412 g013
Figure 14. Sensitivity of seasonal average PPFD to panel orientation.
Energies 18 05412 g014
Figure 15. Sensitivity of seasonal average PPFD to diffuse shading factor.
Energies 18 05412 g015
Table 1. Beam, or direct, irradiance shading factors.
Azimuth (deg)−180−160−140−120−100−80−60−40−20020406080100120140160180
Elevation (deg)
900.590.590.590.590.590.590.590.590.590.590.590.590.590.590.590.590.590.590.59
800.630.620.610.600.580.560.560.530.520.520.520.530.560.560.580.600.610.620.66
700.670.660.630.660.580.540.500.470.460.460.460.470.500.540.580.610.630.660.67
600.720.700.660.620.570.510.450.410.380.380.380.410.450.510.570.620.660.700.72
500.780.750.690.630.560.480.400.330.290.290.290.330.400.480.560.630.690.750.78
400.850.810.730.640.550.440.320.230.180.160.170.230.320.440.550.640.730.810.85
300.790.750.730.650.530.380.220.090000.090.220.380.530.650.730.750.79
200.660.620.610.610.480.280.06000000.060.280.480.610.610.620.66
100.300.290.330.360.280.0500000000.060.280.360.330.290.30
01111111111111111111
Table 2. Summary of average of season ground irradiance and average PPFD.
Season Average Ground GHI (W/m2)Average PPFD (μmol/m2/s)
Summer282.21570.06
Autumn218.3440.96
Winter187.65379.06
Spring 269.71544.81
Table 3. Plants with the necessary PPFD required to grow within the study area.
PlantGenusPPFD (μmol/m2/s)DLI (mol/m2/d)
BlackberryRubus200–3008–14
ChrysanthemumsChrysanthemum200–30010–14
MintMentha200–40010–20
ParsleyPetroselinum crispum200–40010–20
SageSalvia officinalis200–40010–20
Garden LettuceLactuca250–35014–16
RosesRosa350–45018–22
TomatoesSolanum lycopersicum350–80022–30
StrawberryFragaria400–60017–28
Table 4. Daily light requirements for grass species.
Turfgrass CultivarSummerWinterSpring
DLI
(mol/m2/day)
PPFD
(μmol/m2 /s)
DLI
(mol/m2/day)
PPFD (μmol/m2/s)DLI
(mol/m2/day)
PPFD (μmol/m2/s)
Tifway hybrid bermudagrass21486.1110.6245.3717.9414.35
TifGrand hybrid bermudagrass19.9460.659.8226.8514.6337.96
Celebration common bermudagrass19.6453.708.8203.7014.9344.91
TifBlair centipedegrass13.4310.199.5219.9114.1326.39
Floratam St. Augustinegrass11.8273.158.5196.7611.6268.52
Palisades zoysiagrass (japonica)11.2259.268.2189.8111.2259.26
Captiva St. Augustinegrass10.9252.318185.1911.5266.20
BA-417 zoysiagrass (matrella)10.8250.007.3168.9810.6245.37
JaMur zoysiagrass (japonica)10.3238.436.8157.4110.5243.06
Table 5. Summary of the suitability of species in the different zones and seasons.
Species/GroupPPFD Band Used (μmol m−2 s−1)Suitability Below the PanelsSuitability at Edge/Inter-Row BandsNotes
Low-light turf/cover (TifBlair centipede grass; Captiva St. Augustine grass; BA-417 zoysia; JaMur/Palisades zoysia)150–250Suitable as ground cover throughout the year; growth is slow in winter.Suitable as ground cover throughout the year.Best for soil protection and weed suppression where light is lowest.
Perennial ryegrass (Lolium perenne)~400 (optimum)Generally not suitable in winter; may be marginal in spring or autumn only if PPFD reaches ~400.Suitable in spring and autumn; generally suitable in summer.May require water/nutrient inputs around its ~400 optimum.
Lettuce, parsley, mint, sage, cilantro300–600Not suitable below panels.Suitable in spring and autumn; may be feasible in summer with careful management.Typical moderate-light crops for semi-shade.
Strawberries~400–500 during active growth; dormant in winterAcceptable during winter dormancy only; not suitable for active growth below panels.Suitable for active growth in spring and summer.Seasonality aligns with the site’s winter light deficit.
Tomatoes, roses (high-light)>600Not suitable below panels.Suitable in summer only and only in the brightest edge/inter-row bands.High-light requirement limits placement and season.
Maize, sunflower (very high-light)>800Not suitable below panels.Not recommended within the PV footprint; requires open, unshaded areas.Exclude from under-row and near-row zones.
Disclaimer/Publisher’s Note: The statements, opinions and data contained in all publications are solely those of the individual author(s) and contributor(s) and not of MDPI and/or the editor(s). MDPI and/or the editor(s) disclaim responsibility for any injury to people or property resulting from any ideas, methods, instructions or products referred to in the content.