Abstract
The present study aims to compare the feasibility of using ultrasound techniques and image processing to obtain comprehensive experimental results on the dynamics of solid–liquid fraction changes during the melting and solidification of coconut oil as a phase change material (PCM). The discussion will focus on the advantages and limitations of various ultrasonic techniques and image data analysis for inspecting materials during phase transitions. Ultrasound enables the detection of phase changes in materials by analysing variations in their acoustic properties, such as wave velocity and amplitude, during transitions. This method is not only cost-effective compared to traditional non-destructive techniques, such as X-ray tomography, but also offers the potential for real-time monitoring in thermal energy storage systems. Furthermore, it can provide valuable information about internal mechanical parameters and the material’s structure. A detailed analysis of the melting and solidification dynamics has been conducted, confirming the feasibility of using ultrasound parameters to assess the reconstruction of material structures during phase changes. This study paves the way for more efficient and cost-effective monitoring of phase change materials in various applications.
1. Introduction
Phase change materials are widely used due to their high energy density and almost constant temperature during the change in phase. One of the most promising PCMs is coconut oil, as it is a relatively cheap, non-toxic, biodegradable material with a good shelf life of up to 5 years. That time can be even longer if the PCM is protected from photodegradation and oxidation [1]. In addition, it has been confirmed that there are many potential applications of coconut oil, e.g., in greenhouses [2], battery management systems [3], a temperature control agent for building systems [4], for keeping the passengers’ thermal comfort in vehicles [5]. The main challenge to using PCM in thermal energy storage systems (TESs) is connected with the degradation of heat performance by shrinking voids randomly formed into the PCM during solidification because of the density change [6], complicated dynamics of changing the solid–liquid interface geometry, and characteristics of the mushy zone, which is the transition region between the liquid and solid phases [6]. The real-time analysis of the solid/liquid interface is crucial for the determination of actual solidification or melting rate. The traditional technique is based on temperature sensors that measure the temperature evolution during the process. Then, based on the temperature interpolation, the amount of liquid/solid fraction is obtained [7]. However, this approach is limited, especially in the case of analysing high-temperature or corrosive PCM. The accuracy of the technique is also sensitive to the accuracy of obtaining the average values of temperature in the PCM volume. In this context, it seems that the position and number of senators can play an important role [8]. Furthermore, the influence of subcooling temperature is often neglected. Due to that fact, the contact-free techniques with the possibility to measure not only the position but also the shape of the two-phase front should be analysed.
One of such techniques is optical. Usually, it can be successfully used for PCM in which the liquid or solid phase is transparent. Furthermore, it is relatively cheap and easy to use in real-time data analysis. However, it is somewhat limited to surface studies only and cannot reveal any information on the solid/liquid interface inside the crystal structure [9,10].
Other possible techniques involve the use of X-ray tomography. This technique is based on the density difference between solid and liquid phases, influenced by temperature and concentration. High-resolution X-ray images could provide information about the growth front interface as well as the 3D internal PCM structure during melting/solidification. It is possible to obtain the volumetric liquid/solid fraction [11]. However, this technique is quite complex and not feasible for use in the field tests of latent thermal energy storage units (LTESs), especially in the case of LTES with a heat transfer area placed into the volume of the tank with PCM, e.g., shell and tube or shell and coil geometry. This is because using the high density of conventional popular materials in heat exchangers, such as copper or stainless steel, can be beneficial. Moreover, despite the possibility of inspecting the internal structure of PCM in 3D or quantifying relevant parameters such as volumetric liquid/solid fraction, it cannot be established whether the internal structure of PCM and its temperature history are related. The analysis is made possible by the use of time-lapse image data.
Another well-known technique is eddy current sensing. In this technique, the differences in the electrical conductivity between the liquid and solid phases are utilised [7]. The main limitation of using these techniques in the case of PCM is the fact that the electrical behaviour of organic and inorganic PCMs is drastically different. The PCMs from the group of alkanes are electrical insulators and present little contrast between the electrical properties of the liquid and solid phases. There are slightly better-looking substances from the group of fatty acids and esters, which present some polarisations and promote some electrical conduction, particularly in the liquid phase. The most significant disproportion between the electrical properties of the liquid and solid phases seems to be in salt hydrates [12].
The ultrasonic pulsed echo and transmission methods have been widely used to locate material discontinuities. Numerous literature studies have been presented on the use of such techniques for observing solidification fronts in aluminium, tin, iron, and steel. Generally, the limitation is the temperature of the PCM because direct contact between the transducer and the material is needed. The solution could be the cooling of the transducers. However, this approach comes with a potential trade-off: the loss of information about the morphology and curvature of the solid/liquid interface [13]. This is a concern that needs to be addressed in future research. Moreover, there is limited information about using such techniques to analyse the parameters of organic PCM during phase change. Until that moment, these techniques have been used primarily to study the adulteration of edible oils, such as coconut oil or sunflower oil, by analysing the variation in sound velocity [14]. In addition, the ultrasound pulse velocity (UPV) and attenuation have been used to determine the physicochemical and mechanical properties of oils [15]. However, the presented results have been limited to the liquid phase of edible oils (above the melting point) [16] or limited to the solid phase, focused on crystallisation behaviour [17]. The non-contact method has also been proposed for phase change identification in a mixture of building materials with PCM. J. Hong et al. [18] investigated a contactless ultrasonic method to monitor thermal and mechanical variations in concrete plates, including those with PCM-LWAs (phase change material mixture with lightweight aggregate). The experimental investigation has been carried out during melting and free cooling processes. It has been highlighted that the contactless ultrasonic system enabled a 5.5% reduction in dynamic modulus for a concrete plate mixed with 160 kg/m3 PCM-LWAs. Furthermore, the time lag effect of heat transfer and surface temperature reduction through heat storage performance has been shown. Guardia et al. [19] have been experimentally investigating the use of ultrasonic pulse transmission to evaluate the thermal performance and energy storage capacity of five cement-lime mortars with 20% of PCM, cellulose fibres, and LWA (perlite) under different thermal conditions. Using the sound attenuation coefficient to identify the phase change PCM from solid to liquid and vice versa, during heating and cooling, was confirmed as a possibility. In addition, Dragonetti et al. [20] confirmed the potential of using ultrasonic techniques for detecting solid inclusions in molten salt piping systems used in concentrated solar power (CSP) plants.
There is a limit to using both ultrasonic and image data analysis techniques for observing the dynamic solid–liquid fraction. The present work aims to compare the possibility of using both the ultrasound approach and image data analysis to provide comprehensive experimental results about the dynamics of solid–liquid fraction change during the melting/solidification of coconut oil PCM. The discussion will focus on the advantages and limitations of using two different non-invasive methods for inspecting materials during phase change. Generally, the use of ultrasound allows for the detection of phase changes in materials, where the solid–liquid interface can be monitored through variations in acoustic properties (e.g., velocity of sound wave, amplitude) during the phase transition. This is a low-cost method compared to traditional non-destructive techniques, such as X-ray tomography, and allows for real-time monitoring of thermal energy storage systems (TESs) [21]. This is especially important in real applications where the tanks in which phase change materials are kept are usually metallic, because identification of the solid–liquid interface by image data analysis is limited [22]. On the other hand, the machine learning (ML) techniques have been confirmed to enhance the accuracy of identification of the solid–liquid interface, leading to improved predictions of material performance [23]. From that perspective, combining image data analysis with ultrasound to monitor the solid–liquid interface could provide valuable data about the distribution of phase for different kinds of PCMs and boundary conditions. It should also be stressed that the ultrasound method provides information about the composition of the solid/liquid fraction based on the limited volume. In the present study (contact method), the focus is on the path of a sound wave through the PCM volume. In contrast to the optical method (image processing method), the composition of the solid/liquid fraction is related to the cross-sectional area occupied by the solid/liquid phase.
A key contribution of this study will also establish the possibility of correlating changes in the internal structure of PCM and relevant parameters, such as liquid/solid fraction, with temperature history. The influences of subcooling temperature on sound wave parameters will also be analysed. Moreover, an experimental database of the ultrasonic properties of coconut oil is available below its melting temperature.
2. Materials
The subjects of the study were coconut oil and a non-eutectic mixture of fatty acids with non-permanent composition: caproic acid, caprylic acid, capric acid, lauric acid, myristic acid, palmitic acid, stearic acid, arachidic acid, oleic acid, linoleic acid. Due to that fact, in such a mixture of substances, there is no visible sharp melting point. The coconut oil melts at a range of temperatures (see Table 1). Furthermore, according to the new literature, the peak temperature during melting and solidification is affected by the melting/solidification heating rates. It has been confirmed that even for pure PCM (like Rubitherm products), there can be some visible change between the measured and declared melting/solidification temperature range [24,25,26,27]. Generally, the thermal conditions could affect the character of transitions. It can be visible by a narrow or wider transition range. In present studies, it has been assumed (based on own experiments and other literature studies) that the melting range is between 22 °C and 28 °C [28].

Table 1.
Thermal properties of coconut oil [28,29].
However, there is no complete consensus about this temperature range. According to previous authors’ DSC results, the melting range occurs between 10 °C and 25 °C (see Figure 1). It should be noted that the cooling rate in this test was equal to 1 °C/min. Depending on the method and kind of the coconut oil (virgin coconut oil or refined coconut oil), the melting temperature varies from 21 °C to almost 27 °C [28]. On the contrary, according to the literature on solidification, this range is relatively lower, even between 16 °C and 18 °C [29]. Furthermore, according to other literature and DSC results, this range could be even wider. However, as noted above, this is also a function of heating. If a rapid cooling rate (e.g., 1 C/min) occurs, the crystallisation may start from 20 °C or even lower temperatures. In contrast, for a slow cooling rate (e.g., 0.08 C/min), the crystallisation begins from about 25 °C and ends at about 22 °C to 20 °C. In the case of a slow cooling process, there is also a more visible influence of the subcooling effect [17].
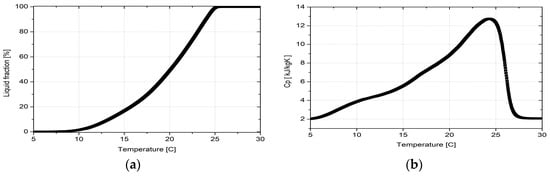
Figure 1.
Specific heat capacity as a function of temperature (a), liquid fraction as a function of temperature, and DSC measurement results for selected properties of coconut oil (b) [29].
3. Experimental Methods
This section presents the experimental methods used in the paper. It includes the ultrasonic method used for measurements of temperature- and frequency-dependent acoustical properties of coconut oil, and the image processing method aided by machine learning for the evaluation of solid fraction.
3.1. Ultrasonic Method
Ultrasonic studies of coconut oil at variable temperatures were carried out using the trough transmission method. The measurement setup for ultrasonic tests, as shown in Figure 2a, consisted of a measuring chamber with a capacity of about 370 mL (L × W × H 61 × 61 × 100 mm3), an immersion circulation thermostat (Haake DC30, Thermo Fisher Scientific, Newington, NH, USA) with a heating power of 2 kW and a cooling power of 320 W at 20 °C, a computer with software for operating the Opbox 1.0 (Wrocław, Poland) digital ultrasonic flaw detector, ultrasonic immersion transducers, temperature measurement software, and three digital thermometers (Termometer PT-401 ®Elmetron, Zabrze, Poland) with thermocouples (PT100). Temperature measurements during the tests were taken using two thermocouples placed at different points in the coconut oil measuring chamber. One was placed at the same height as the ultrasonic transducers (marked T3), the second 20 mm below (marked T4), and the third was installed in the liquid in the heating/cooling system tank (T2). The recording of temperatures T1, T2, T3 was carried out using RS232C serial communication between individual Thermometer PT-401 devices and an independent computer dedicated to recording temperature data by our own software.
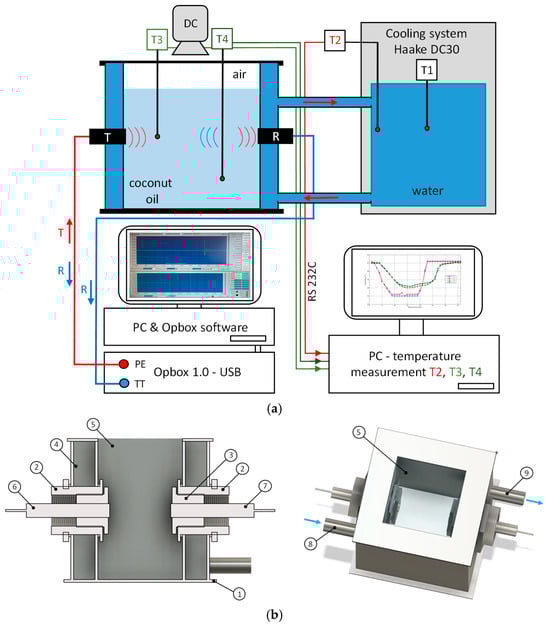
Figure 2.
Diagram of the measuring system for ultrasonic testing (a) and detailed view of the measuring chamber (b), where 1—chamber, 2,3—mounting and sealing elements for the ultrasonic transducers, 4—water jacket, 5—measuring chamber, 6—transmitter, 7—receiver, 8,9—water connectors.
The circulation thermostat allows for the regulation of the liquid temperature in the range from −50 °C to +250 °C using the T1 temperature measurement system. Figure 2b shows a detailed view of the measuring chamber with ultrasonic transducers. The measuring system consists of a chamber made from stainless steel (1) with a water jacket (4) enabling cooling or heating of the tested material in the measuring chamber (5). The chamber also contains mounting (brass) and sealing elements (made of silicone) for the ultrasonic transducers (2), interchangeable adapters for mounting ultrasonic transducers (3) of various diameters made using 3D printing technology with O-ring seal, connectors (8) and (9) for the flow of the heating/cooling fluid, and the ultrasonic transmitter (6) and receiver (7). The use of two transducers placed in a single measurement path, opposite each other (halfway up the measurement chamber), allows for the use of transmitted wave (TT) or echo (PE) methods in measurements. Broadband longitudinal wave ultrasonic transducers with a central frequency of 1 MHz and an active diameter of 10 mm (®Optel Ultrasonic Technology, Wrocław, Poland) were used in the tests. Dedicated Optel software OPBOX ver. 1.0 2009 used during measurements enabled signal recording with a minimum time step of 1 s and was averaging 32 signals. During the ultrasonic measurements, the coconut oil chamber was recorded with a 12-megapixel digital camera (DC).
Figure 3 presents exemplary ultrasonic signals of a wave transmitted through a PCM sample in the liquid (35 °C) and solid (21 °C) states. For both cases, the first incoming pulse, associated with the longitudinal wave propagating in the test material, was analysed. The signals were recorded every 5 s at a sampling rate of 100 MHz. Based on the signals, two parameters—the time of flight (TOF) and maximum amplitude of the wave propagating in the material—were determined. Based on the measured TOF of all recorded signals, it was possible to evaluate the ultrasonic wave propagation velocity for a known (constant during experiments) distance between the probes. The distance measurement was performed with a calliper with an accuracy of 0.02 mm. This was conducted to assess changes in coconut oil properties during cooling or heating.
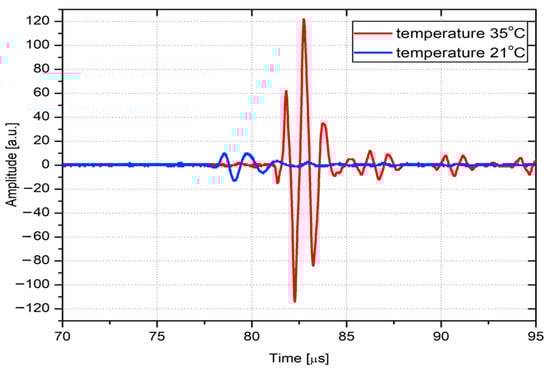
Figure 3.
Time domain ultrasonic signals were recorded for the sample of PCM as a liquid (35 °C) and a solid (21 °C).
Comparing the wave pulses in the liquid and solid states, an amplitude decrease of approximately 22 dB was observed, with a simultaneous increase in velocity of roughly 80 m/s. The ultrasonic transmitter was excited with a voltage of 300 V, and the signals were additionally amplified, depending on the measurement (temperature), in the range of 7 dB to 54 dB. The signals were averaged 32 times and filtered with a band-pass filter with a frequency of 0.5 MHz to 6 MHz. Signal filtering and averaging were used to improve the signal-to-noise ratio (SNR) and eliminate the interference generated during the measurements.
3.2. Acoustical Properties of Coconut Oil
To verify the repeatability of the obtained ultrasonic results, two types of preliminary tests were conducted. The first involved determining the “stability” of the wave parameters at specific temperatures as a function of time. Figure 4 shows the measured velocities and amplitudes of longitudinal waves recorded at various temperatures: 22 °C (solid phase), 30 °C, and 35 °C (liquid phase) over 60 min.
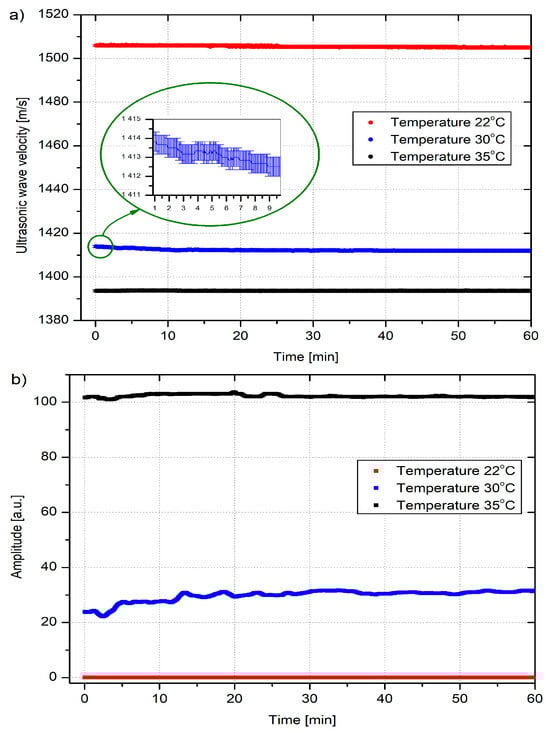
Figure 4.
Longitudinal wave velocities (a) and amplitudes (b) for PCM sample recorded throughout the 60 min measurement cycle at temperatures 22 °C, 30 °C, and 35 °C.
It can be seen that both the wave velocity and its amplitude are practically constant throughout the 60 min measurement cycle. Based on the obtained results, it can be concluded that the designed measurement chamber, along with the heating and cooling system, ensures stable conditions during the measurements, and consequently, allowed results to be obtained for the determined ultrasonic parameters. Table 2 presents the precision of measured parameters during ultrasonic tests.
Table 2.
Precision of measured parameters during ultrasonic tests.
The second type of preliminary testing consisted of verifying the repeatability of wave parameter values across measurement cycles. For this purpose, ultrasonic testing was performed for several measurement cycles, including the cooling and heating of a coke oven oil sample. Figure 5 presents the amplitudes and velocities of the longitudinal wave as a function of time and temperature for the PCM sample, which was recorded during two cooling and heating cycles (approximately 160 min within a given temperature range in the circulation system: from 35 °C to 19 °C for cooling and from 19 °C to 35 °C for heating). High qualitative repeatability of the measured ultrasonic wave parameters, i.e., the determined group velocities and maximum amplitudes, was observed for both measurement cycles. Based on the obtained preliminary test results, it can be concluded that the ultrasonic method is repeatable, and the measured wave parameter values are stable at a given temperature.
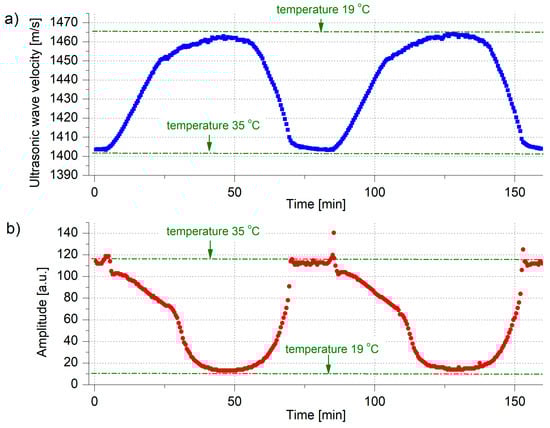
Figure 5.
Longitudinal wave velocity (a) and amplitudes (b) as a function of time for a temperature range from 35 °C to 19 °C for PCM oil (approximately 160 min).
Due to the limited information in the literature, one of the main focuses of the presented study is to provide a comprehensive database of acoustical parameters for coconut oil. Most of the results presented only the ultrasonic velocity for room temperature (see Table 3).
Table 3.
Selected results of acoustical parameters for coconut oil.
There are no precise guidelines for the accurate value of room temperature. Usually, it can be assumed that the temperature range could be between 20 °C and 25 °C. This is a significant difference because it is the temperature range in which coconut oil could occur in solid, liquid, or a mixture of solid and liquid phases. Only one of the presented articles from the literature has presented precise information about the temperature range and selected thermal parameters. Unfortunately, authors do not precisely analyse the dynamic relations between liquid and solid phase changes. It is not possible to check if the coconut oil has been fully melted and solidified each time without precise thermal analysis. In the author’s opinion, it is necessary to present a comprehensive thermal analysis together with visual observation and the results of the ultrasound-based method.
Figure 6 and Figure 7 present the variability of selected coconut oil properties with temperature change. Changes in amplitude, velocity, and density as a function of temperature from 35 °C to 18.3 °C were observed over 200 min. There is a visible relation between the density of coconut oil (calculated as a function of temperature) and wave velocity.
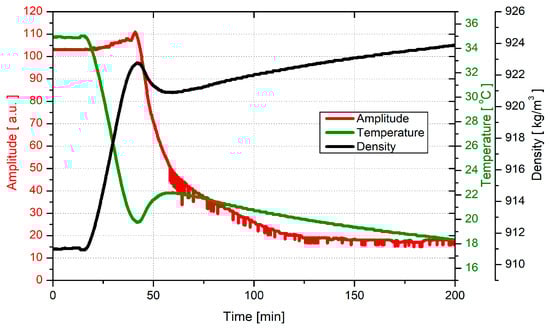
Figure 6.
Example of variability of selected coconut oil parameters during the cooling process from 35 °C to 18.3 °C.
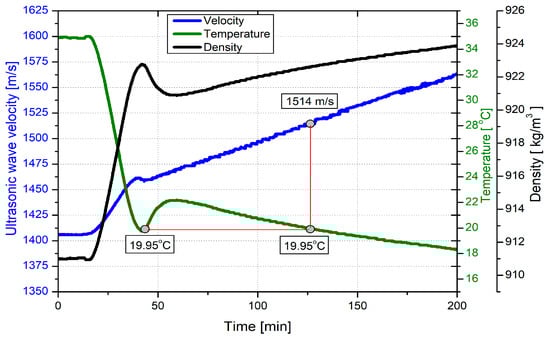
Figure 7.
Example of variability of selected coconut oil parameters during the cooling process from 35 °C to 18.3 °C.
Figure 8 shows the changes in the velocity of the longitudinal wave in coconut oil during the cooling cycle, along with changes in temperature, density, and compressibility of the tested material over the 230 min measurement period. It can be seen that within the presented range of temperature changes, a decrease in the compressibility of coconut oil is observed, determined from relationship (1):
where β—material compressibility, V—longitudinal wave velocity, and ρ—oil density.
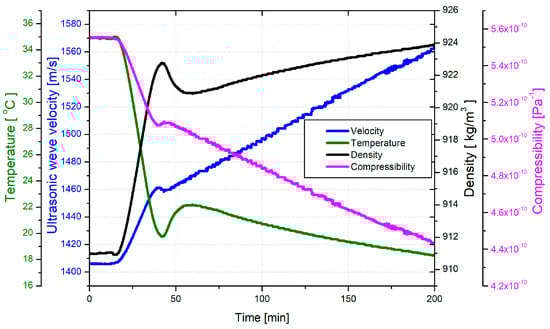
Figure 8.
Changes in speed, temperature, density, and compressibility of coconut oil during cooling in the temperature range of 35 °C to 18.3 °C.
It shows that an increase in velocities from 1403 m/s at 35 °C to 1570 m/s at 18.3 °C is a result of an increase in the material’s stiffness.
Figure 9 presents the changes in wave velocity as a function of temperature. On this basis, two inflexion points were determined, which illustrate the onset of the crystallisation process at temperatures of 23.3 °C and 20.5 °C. The end of crystallisation was determined based on Figure 9 at approximately 20 °C, which is consistent with the previous literature reports [17]. For that temperature, it has been assumed that the velocity of the solid phase is 1514 m/s.
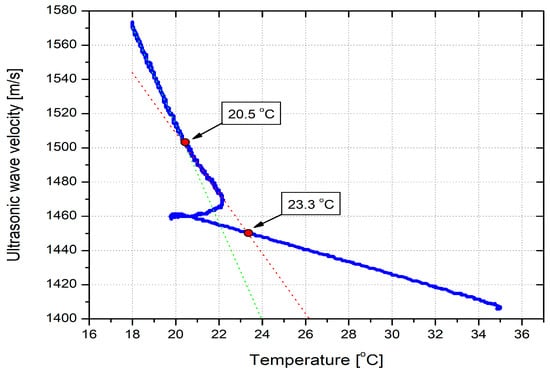
Figure 9.
Changes in velocity as a function of temperature with determined inflexion points for the crystallisation process in the temperature range of 35 °C to 18.3 °C. The green dotted line is a tangent line to the experimental data for the temperatures below 20.5 °C, while the red dotted line is a tangent line to the experimental data for the range of temperatures 20.5 °C–22 °C.
3.3. Image Processing
The image data analysis has already been used in the author’s previous studies in the case of analysing solidification [21] and melting [25]. In both presented papers, the main techniques are based on binarisation, which is used to estimate the liquid/solid fraction via a binary ratio. However, this procedure will not be possible in the case of the solidification of coconut oil. It is working well in the case of a sharp border between the melting and solidified phases. Coconut oil solidifies in such a way only in the first phase of the process, which is when the solidified material is visible only close to the heat transfer area. Then, the solidified material creates a nucleation site in the whole volume of the tank. Furthermore, the layer of solidified material is thicker at the bottom of the tank compared to the top, due to the influence of natural convection [34]. Such a process cannot utilise a simple methodology based on labelling the solidified layer, as was performed in a vase of Rt18HC [27]. Furthermore, in the presented study, the geometry of the experimental module is more complex. First of all, the module is not transparent. It is only possible to make an image from the top of the module. Moreover, this decreases light penetration and increases the trouble with reflections and shadowing patterns resulting from other elements of the measurement infrastructure 1–4 (Figure 10), where the original image is on the left, and the greyscale image is on the right with highlighted shadow areas. These challenges highlight the complexity of the problem we are addressing.
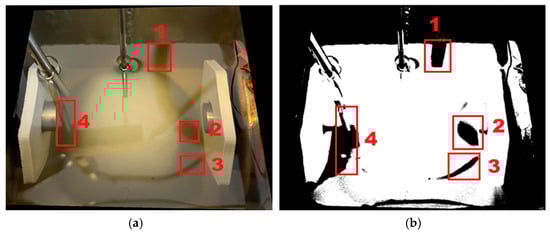
Figure 10.
Example of a gradient shadow pattern resulting from the measurement infrastructure. Original image (a) and image after binarization (b).
Due to that fact, the quality of photos has been checked to confirm the useless database. It has used the well-known method based on the Matlab code from the literature [35]. The quality of the image has been analysed based on comparison of a few parameters: MSE (mean square error), PSNR (peak signal noise ratio), RMSE (root mean square error), MAE (mean absolute error), SNR (signal-to-noise ratio), and UQI (universal quality index). The results are presented in Table 4 and Table 5. Generally, the image structure remains recognisable (UQI > 0.8); on the other hand, noises significantly degrade pixel accuracy (see results of (MSE, PSNR).
Table 4.
Parameters for the first selected photo–liquid phase only.
Table 5.
Parameters for the second selected photo–solid phase only.
3.4. Experimental Procedure of Evaluation of Solid Fraction by Machine Learning
Finally, the authors proposed two new algorithms based on supervised machine learning (ML). The main difference between those two algorithms is the method of counting the pixels in the final statistic. In the first model (Model 1), there is a possibility to ignore some areas for a percentage of the solid phase. In the second method (Model 2), all pixels are taken to calculate the solid fraction. Both models use supervised machine learning to classify pixels in images. It trains a model to recognise areas of solid phase based on pixel features. For each pixel, the model calculates RGB channels, Gaussian texture, texture variation (standard deviation), local variation in texture, and texture details (used Gabor filter). Next, the training images are labelled manually as solid (1) and liquid phase (0). Then, the decision tree is made. It learns a hierarchy of rules, splitting pixels by feature values. Then each node tests a condition on a feature and routes the pixel down the tree. Finally, there is an assignment of a class label (solid phase or not). In the prediction phase, for new images, the model computes the same features per pixel and predicts class labels for every pixel. The output is a binary mask highlighting detected solid-phase areas (see Figure 11). However, the final result is also related to the image resolution equal to 4.7 × 10⁶.
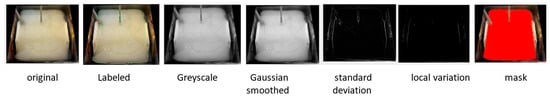
Figure 11.
Preprocessing of images.
There is no significant visual difference between those two models (see Figure 12 and Figure 13). Still, there are apparent differences in the results of the calculation for the solid fraction (see Figure 13). Generally, Model 1 better predicts the solid fraction at the end of solidification. Model 2 better predicts the solid fraction at the end of melting one. The deeper image analysis confirmed the disproportion with the labelling of solid fraction areas. The maximum disproportion can be larger than 30% at the last phase of solidification and melting.
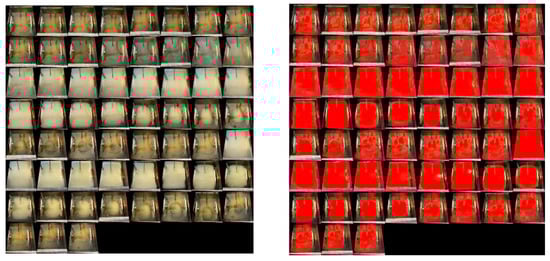
Figure 12.
Comparison of original photography (left) with the mask-labelled solid phase according to Model 1 (right).
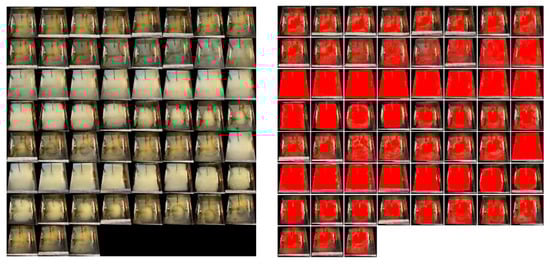
Figure 13.
Comparison of original photography (left) with the mask-labelled solid phase according to Model 2 (right).
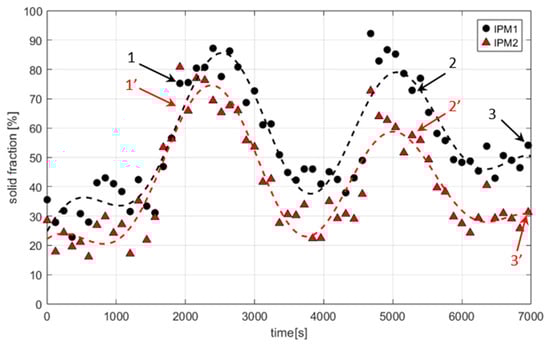
Figure 14.
Solid fraction as a time function during the melting/solidification of coconut oil.
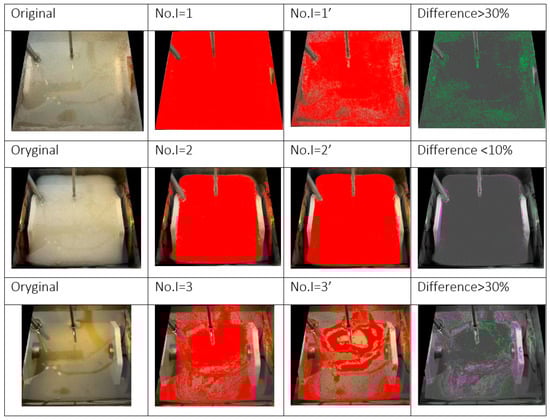
Figure 15.
Comparison of selected results of image analysis according to Model 1 and Model 2.
According to image processing results, some solid phase occurs even at the beginning of the process (average temperature 35 °C). The minimum percentage of solid phase is about 20% to 30%, and the maximum is between 70% and 90%. It should be noted that the use of image data analysis is limited by the optical parameters of the experimental module and PCM. The proposed algorithms based on supervised machine learning can predict the amount of solid phase in the case of a visible, sharp melting front quite well. Still, it is a challenging task to achieve good results for a mixture of a liquid phase with many separated solid particles. This effect is a visible increase due to the influences of shadowing, gradients, and reflections. One possible solution could be to use a higher-quality camera with higher resolutions to modify the experimental module.
4. Results and Discussion
4.1. Comprehensive Analysis of PCM Transition
Figure 16a schematically presents a method for comparing the results of ultrasonic, temperature, and visual tests. Ultrasonic tests of changes in wave transit time accompanying temperature changes over time (see Figure 16b) are compared with photographs of the measuring chamber (see Figure 16c) filled with PCM in various states of matter. The pictures show changes in the state of matter of the tested material, and the numbers indicate the time and the corresponding temperatures indicated in Figure 16c. The temperature was measured directly in the measuring chamber at points below (T4) and the height of the ultrasonic transducers (T3) (see Figure 2). Figure 16a shows the measured temperatures for the entire cycle from individual thermocouples, T3 and T4, demonstrating the thoroughness of our experimental setup.
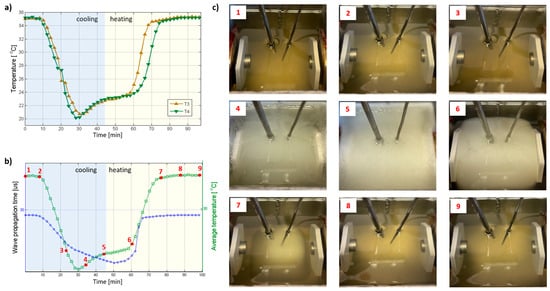
Figure 16.
Comparison of temperatures recorded in coconut oil by thermocouples T3 and T4 (a) and comparison of the results of ultrasonic (wave transit time), temperature (b) tests, and the corresponding photographs of the material in the stages 1–9 (c).
The wave velocity and amplitude values determined based on transit time, recorded during one cooling and heating cycle of the material in the temperature range of 35 °C–20 °C–35 °C, are summarised in Figure 17. The temperature changes presented in the graphs are average values obtained from thermocouples T3 and T4. The duration of this cycle was 96 min.
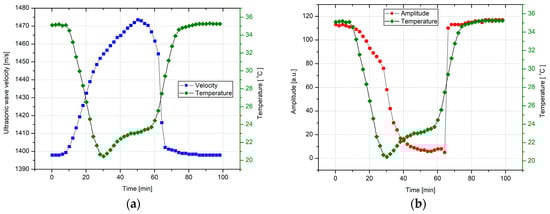
Figure 17.
Changes in the velocity (a) and amplitude (b) of the ultrasonic wave of one cooling and heating cycle of the material in the temperature range of 35 °C–21 °C–35 °C. The temperature is the average temperature of thermocouples T3 and T4, with a cycle duration of 96 min.
As seen in Figure 18, there is a visible disproportion between the solid fraction variability calculated according to image processing methods and the analysis of sound velocity (fraction US) at the beginning and end of the solidification process. Furthermore, there is a slightly different profile of change in this parameter for the melting process. The reason is that the amount of solid phase in image processing has been calculated for tank surfaces (top area), neglecting the influences of the mushy zone. Clearly, the mushy zone can strongly influence melting dynamics and heat transfer behaviour, which in turn may contribute to inaccuracies in surface-based image analysis. Similar considerations were highlighted by [36], where the role of mushy regions was examined in the context of thermal characteristics and heat storage applications in solar–biogas heating systems. Due to that fact, it is necessary to modify the imaging system to take this effect into account in future work. Moreover, the image processing models struggle to track single-solid particles within the PCM volume. In the case of the ultrasound method, the sound parameters have been obtained for the centre profile of the PCM tank (average volume of PCM).
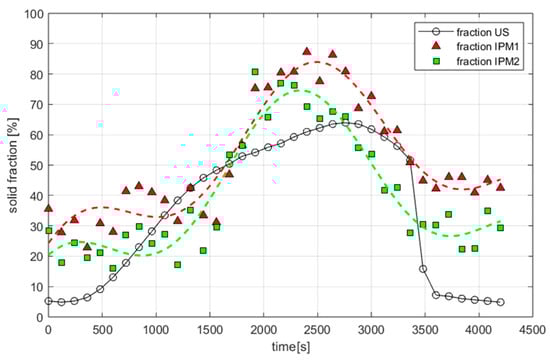
Figure 18.
Comparison of solid fraction experimental results by ultrasonic and image processing methods.
Such results are not significantly affected by ambient parameters, such as light reflections. However, the results are limited to the area within the impact of the sound wave. Generally, it can be assumed that the amount of solid phase in the case of using image processing is proportional to the amount present on the surface of the container. On the contrary, in the case of the acoustical method in the present study, this amount is proportional to the volume that occurs at the centre of the tank (see Figure 19). It should be noted that the ultrasonic measurements ignored the edge effects. However, despite the transducers being placed in the central part, they provide information from certain volume. In prior experiments, the acoustic field was regarded as a function of distance from the emitter and was measured. These experiments show that the diameter of the acoustic beam for 1 MHz transducer (used in the studies) is about 10 mm. Thus, we assume that the information about the material “comes” from certain volume (diameter ~1 cm and length ~4.17 cm ≈ 3.3 cm3. This is approximately 10% of total volume of PCM).
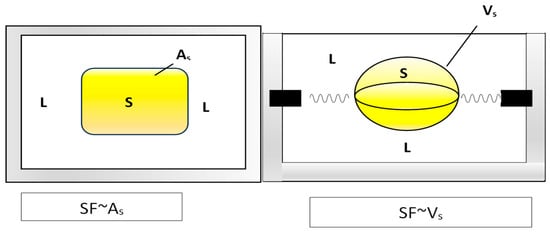
Figure 19.
Schematic representation of estimation of solid fraction by two different methods: on the left, the method is based on image processing; on the right, the method is based on the acoustical method.
As a result of the tests, it is obtained that the acoustic parameters are affected by the transition of phase change material during melting/solidification (liquid, solid, mushy zone). It corresponds with additional parameters like density and material compressibility, which influence the ultrasound velocity and amplitude wave.
Consequently, combining image data analysis with ultrasound is necessary to obtain valuable insights into the dynamics of the solidification/melting front, and to provide satisfactory data for a comprehensive analysis.
4.2. Analysis of the Dynamics of the Solidification/Melting Process
It should be highlighted that in the case of coconut oil, non-isothermal phase changes occur during the phase transition. In the mushy zone, for the same temperature, both solid and liquid phases exist. Additionally, there is an abrupt change in enthalpy per unit temperature around the freezing point. This is a moving boundary problem that can be solved by the front-tracking method, [37]. To solve this problem, it is necessary to track both the moving phase-change boundary and a temperature history profile. The combination of using image data analysis with ultrasound could provide valuable data about the dynamics of the solidification/melting front, correlating the liquid/solid fraction with temperature history.
As seen, there is constant growth of sonic wave velocity during the solidification of coconut oil. It is obviously in agreement with other literature results for other vegetable oils [30]. It has been confirmed that in the liquid phase, the sonic velocity linearly decreases with the increase in temperature. Such linearity has also been observed in the present study (see Figure 20c, points 1 to 3). However, the character of the velocity profile starts to visibly change from the beginning of the solidification process (see Figure 21c for points 4 to 12). According to the literature, the subcooling temperature seems to be the starting point of the solidification process [38]. It is not fully confirmed by the images analysed. As seen, the solid phase occurs already at point 3 (see Figure 20a). It can be explained by the fact that presenting a temperature profile is an arithmetic average. After the second phase of solidification (see Figure 21), the temperature is stabilised at the solidification temperature, and again, there is visible linear growth of sonic wave velocity. However, the rate of velocity change is visibly smaller. It is due to the decreasing rate of increase in the solid fraction. This clearly shows that compared to the temperature profile, the velocity profile could have information about phase changing during the whole cooling and solidification process. The amplitude does not change during the cooling of the liquid phase. However, the amplitude seems to be even more sensitive when a solid phase occurs in the tank volume. First of all, the amplitude of visible growth increases (decrease in ultrasonic attenuation) during the cooling process of liquid coconut oil (see points 1 and 2 at Figure 20). Generally, the amplitude decreases (attenuation increases) with temperature decreases [39]. However, there are usually highly variable observations. It is because attenuation is affected not only by temperature change but also by variation in mixture composition [40]. As mentioned, the coconut oil is composed of many fats with slightly different properties (non-eutectic mixture). When the material structure starts to rebuild (crystallisation occurs), it rapidly changes the tendency to increase absorption of ultrasonic waves into the PCM volume (see point 3 at Figure 20a). This parameter starts to change directly from the initial phase of solid phase nucleation appearing in the volume (see Figure 20b—point 3). Then, the character of the amplitude curve appears similar to the temperature profile, but it does not fully stabilise like the temperature. There is a clearly observed slow decrease in amplitude over time. This confirms the sensitivity of amplitude to the dynamic changes in the internal structure. It has been better presented in a short image sequence (https://www.youtube.com/watch?v=XL3ULG80EcI (Supplementary Materials)). That video presents the cooling of coconut oil from a temperature of 35 °C to 20 °C. It is worth noting that the movement of solid particles occurs during the solidification of PCM. The influence of natural convection can explain it.
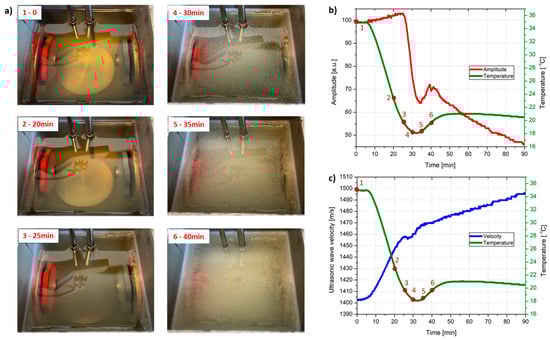
Figure 20.
Comparison of sonic and thermal parameters distribution during the solidification of coconut oil: (a) solidification front images for the first 40 min of the process, (b) distribution of average PCM temperature and amplitude, (c) distribution of average PCM temperature and ultrasonic wave velocity.
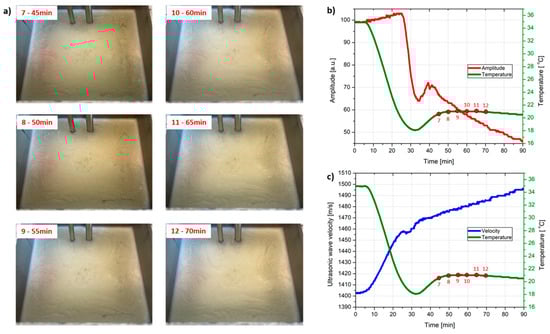
Figure 21.
Comparison of sonic and thermal parameters distribution during the solidification of coconut oil: (a) solidification front images for the last 30 min of the process, (b) distribution of average PCM temperature and amplitude, (c) distribution of average PCM temperature and sonic wave velocity.
The amplitude of sonic waves is stable during the first 20 min of the melting process. Then, a prominent peak is visible, and again, a stable value of amplitude is maintained until the end of the process (see Figure 22a). Notably, the amplitude does not exhibit constant changes in value during the melting of coconut oil. It occurs suddenly, with a quick change in that parameter. Due to that fact, it is hard to use it as a marker suitable for analysing the dynamics of the melting front. On the contrary, the constant nonlinear changes are presented by sonic wave velocity. This dynamic change is visible in the first phase of melting (see Figure 22a,b from points 1 to 6). This is visibly correlated with the character of changes in the average temperature of PCM. This is also clearly occurring in the second phase of melting (see Figure 23a,c from points 7 to 12), when the temperature is stabilised; only a small change in the velocity is observed till the point at which the solid phase cannot be observed for any amount of solid phase present in the volume (see Figure 23, points 11–12). In the authors’ opinion, these parameters can be used as a marker for analysing the behaviour of melting front dynamics.
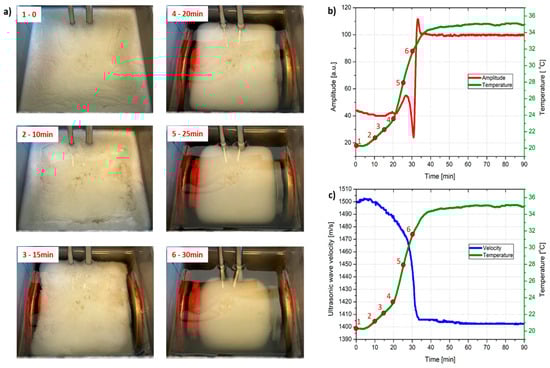
Figure 22.
Comparison of sonic and thermal parameter distribution during the melting of coconut oil: (a) melting front images for the first 30 min of the process, (b) distribution of average PCM temperature and amplitude, (c) distribution of average PCM temperature and ultrasonic wave velocity.
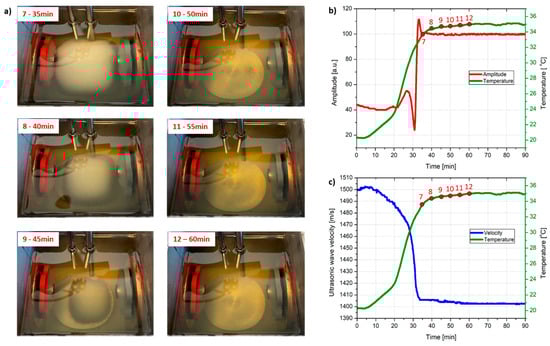
Figure 23.
Comparison of sonic and thermal parameter distribution during the melting of coconut oil: (a) melting front images for the last 30 min of the process, (b) distribution of average PCM temperature and amplitude, (c) distribution of average PCM temperature and ultrasonic wave velocity.
5. Conclusions
This study investigates the dynamics of the melting and solidification of coconut oil (PCM) within a rectangular chamber at a constant wall temperature. Results of the experiment were obtained using two non-destructive methods: image processing and ultrasonic data analysis. While each method has its advantages and disadvantages, the combination of image data analysis with ultrasound has proven to provide valuable insights into the solidification and melting processes. Using both methods is crucial for correlating changes in the internal structure of phase change materials (PCMs) with relevant parameters, such as liquid/solid fraction and temperature history.
The effects of subcooling temperature on sound wave parameters have also been analysed. Additionally, an experimental database of the temperature-dependent ultrasonic properties of coconut oil at various frequencies has been established.
The study confirms that ultrasound parameters can be used to analyse the structural reformation of materials during phase changes. Notably, the relationship between sound wave velocity and PCM temperature can help to determine the temperature range of the solidification process. On the other hand, the significant drop in amplitude during the cooling process can be utilised to pinpoint the exact moment when solid particle nucleation begins.
The current ultrasonic technique utilises one emitter and one receiver to monitor the melting and solidification processes. This configuration performs effectively during solidification; however, during melting, the acoustic parameters are affected by the material’s phase change. To address this issue, future research will focus on employing an array of emitters and receivers at various positions.
Supplementary Materials
The following supporting information can be downloaded at https://www.youtube.com/watch?v=XL3ULG80EcI. The cooling of coconut oil from a temperature of 35 °C to 20 °C.
Author Contributions
Conceptualisation, R.A., R.D. and M.P.; methodology, R.A. and R.D.; validation, R.A. and R.D.; formal analysis, R.A. and R.D.; ultrasonic studies and data processing, recording of images, R.D.; image analysis, R.A.; writing—original draft preparation, R.A., R.D., and M.P.; writing—review and editing, R.A., R.D. and M.P.; visualisation, R.A. and R.D.; supervision, R.A. All authors have read and agreed to the published version of the manuscript.
Funding
This research received no external funding.
Data Availability Statement
The datasets presented in this article are not readily available because the data are part of an ongoing study. Requests to access the datasets should be directed to Radoslaw Drelich or Rafał Andrzejczyk.
Conflicts of Interest
The authors declare no conflicts of interest.
Abbreviations
The following abbreviations are used in this manuscript:
| Fo | Fourier number [] |
| f | Frequency [Hz] |
| MF | Melting fraction [%] |
| Ra | Rayleigh number [] |
| SF | Solid fraction [%] |
| Ste | Stefan number |
| t | Time [s] |
| T | Temperature [°C] |
| MAE | Mean absolute error |
| PSNR | Peak signal-to-noise ratio |
| RMSE | Root mean square error |
| SNR | Signal-to-noise ratio |
| SF | Solid fraction |
| UQI | Universal quality index |
| IPM | Image processing model |
| US | Ultrasound |
| DSC | Differential scanning calorimeter |
| PCM | Phase change material |
| TES | Thermal energy storage |
References
- Jayadas, N.H.; Nair, K.P. Coconut oil as base oil for industrial lubricants—Evaluation and modification of thermal, oxidative and low temperature properties. Tribol. Int. 2006, 39, 873–878. [Google Scholar] [CrossRef]
- Ziapour, B.M.; Hashtroudi, A. Performance study of an enhanced solar greenhouse combined with the phase change material using genetic algorithm optimization method. Appl. Therm. Eng. 2017, 110, 253–264. [Google Scholar] [CrossRef]
- Alipanah, M.; Li, X. Numerical studies of lithium-ion battery thermal management systems using phase change materials and metal foams. Int. J. Heat Mass Transf. 2016, 102, 1159–1168. [Google Scholar] [CrossRef]
- Indartono, Y.S.; Suwono, A.; Pasek, A.D.; Mujahidin, D.; Rizal, I. Thermal Characteristics Evaluation of Vegetables Oil to be Used as Phase Change Material in Air Conditioning System. J. Tek. Mesin. 2011, 12, 119–124. [Google Scholar] [CrossRef]
- Saleel, C.A.; Mujeebu, M.A.; Algarni, S. Coconut oil as phase change material to maintain thermal comfort in passenger vehicles. J. Therm. Anal. Calorim. 2019, 136, 629–636. [Google Scholar] [CrossRef]
- Li, X.; Niu, C.; Bian, Q.; Zhang, H.; Liu, J.; Ma, T.; Wang, Q. Influence of void cavity distribution on melting of composite phase change. Materials 2019. [Google Scholar]
- Grujic, K.; Hegna, T.; Laundal, K.M. In Situ Monitoring of Growth Interfaces: A Review of Noninvasive Methods. JOM 2012, 64, 96–101. [Google Scholar] [CrossRef]
- Ettouney, H.M.; Alatiqi, I.; Al-Sahali, M.; Al-Ali, S.A. Heat transfer enhancement by metal screens and metal spheres in phase change energy storage systems. Renew. Energy 2004, 29, 841–860. [Google Scholar] [CrossRef]
- Cröll, A.; Schweizer, M.; Dold, P.; Kaiser, T.; Benz, K.W.; Lichtensteiger, M. Temperature and growth rate fluctuations in silicon floating zones. Adv. Space Res. 2002, 29, 527–536. [Google Scholar] [CrossRef]
- Fujiwara, K.; Obinata, Y.; Ujihara, T.; Usami, N.; Sazaki, G.; Nakajima, K. In-situ observations of melt growth behavior of polycrystalline silicon. J. Cryst. Growth 2004, 262, 124–129. [Google Scholar] [CrossRef]
- Guarda, D.; Martinez-Garcia, J.; Fenk, B.; O’Neill, P.; Ravotti, R.; Gwerder, D.; Stamatiou, A.; Worlitschek, J.; Mancin, S.; Schuetz, P. X-ray computed tomography analysis of calcium chloride hexahydrate solidification. Appl. Therm. Eng. 2024, 252, 123618. [Google Scholar] [CrossRef]
- Mira-Hernández, C.; Travaglini, G.; Dolfi, A.; Mancin, S. Electrical properties of phase change materials for electrical impedance-based sensing of the liquid fraction. J. Energy Storage 2025, 113, 115625. [Google Scholar] [CrossRef]
- Dold, P.; Heidler, M.; Drevermann, A.; Zimmermann, G. In situ observation of growth interfaces by ultrasound. J. Cryst. Growth 2003, 256, 352–360. [Google Scholar] [CrossRef]
- Ali, S.K.M.; Raju, P.; Prashanthi, T.V.; Shankar, J.; Anjaiah, J.; Bibi, S.K.N.; Rajesham, S. Ultrasonic velocity studies in pure and adulterated edible oils. In AIP Conference Proceedings; AIP Publishing LLC: Melville, NY, USA, 2023; p. 040005. [Google Scholar] [CrossRef]
- Alouache, B.; Laux, D.; Hamitouche, A.; Bachari, K.; Boutkedjirt, T. Ultrasonic characterization of edible oils using a generalized fractional model. Appl. Acoust. 2018, 131, 70–78. [Google Scholar] [CrossRef]
- Jiménez, A.; Rufo, M.; Paniagua, J.; González-Mohino, A.; Olegario, L.S. New findings of edible oil characterization by ultrasonic parameters. Food Chem. 2022, 374, 131721. [Google Scholar] [CrossRef]
- Mori, D.; Matsuura, T.; Masuko, T.; Katsuno, N.; Nishizu, T. Monitoring the Crystallization Behavior of Hydrogenated Coconut Oil Using Ultrasonic Phase Velocity. J. Am. Oil Chem. Soc. 2020, 97, 1165–1175. [Google Scholar] [CrossRef]
- Hong, J.; Choi, H.; Lee, J.; Jeong, S.-G. Thermal and mechanical variations of cementitious composites with phase change materials using a contactless ultrasonic method. Constr. Build. Mater. 2023, 409, 134077. [Google Scholar] [CrossRef]
- Guardia, C.; Barluenga, G.; Palomar, I. Evaluation of the energy storage capacity of Phase Change Material cement-lime mortars by using heat flux meters and ultrasonic pulse transmission. J. Energy Storage 2022, 50, 104674. [Google Scholar] [CrossRef]
- Dragonetti, R.; Romano, R.A.; Di Giulio, E. Numerical Evaluation of Ultrasonic Detection of Solid Occlusions in CSP Molten Salt Piping. Appl. Sci. 2025, 15, 1373. [Google Scholar] [CrossRef]
- Han, W.; Rebow, M.; Liu, D.; Farrell, G.; Semenova, Y.; Wu, Q. Optical fiber Fresnel reflection sensor for direct detection of the solid–liquid phase change in n-octadecane. Meas. Sci. Technol. 2018, 29, 125107. [Google Scholar] [CrossRef]
- Janghel, D.; Karagadde, S.; Saha, S.K. Measurement of shrinkage void and identification of solid-liquid phases in phase change materials: Ultrasound-based approach and simulated predictions. Appl. Therm. Eng. 2023, 223, 120048. [Google Scholar] [CrossRef]
- Kamiyama, T.; Hirano, K.; Sato, H.; Ono, K.; Suzuki, Y.; Ito, D.; Saito, Y. Application of Machine Learning Methods to Neutron Transmission Spectroscopic Imaging for Solid–Liquid Phase Fraction Analysis. Appl. Sci. 2021, 11, 5988. [Google Scholar] [CrossRef]
- Kaboré, A.; Tala, J.V.S.; Younsi, Z.; Bougeard, D. Experimental characterization of the thermophysical properties of some selected phase change materials for building applications: Critical input data for numerical simulations. J. Energy Storage 2025, 111, 115463. [Google Scholar] [CrossRef]
- Rogowski, M.; Fabrykiewicz, M.; Andrzejczyk, R. Melting in Shell-and-Tube and Shell-and-Coil Thermal Energy Storage: Analytical Correlation for Melting Fraction. Energy 2025, 18, 2923. [Google Scholar] [CrossRef]
- Andrzejczyk, R.; Muszynski, T.; Kowalczyk, T.; Saqib, M. Experimental and numerical investigation on shell and coil storage unit with biodegradable PCM for modular thermal battery applications. Int. J. Therm. Sci. 2023, 185, 108076. [Google Scholar] [CrossRef]
- Andrzejczyk, R.; Saqib, M.; Rogowski, M. A New Approach of Solidification Analysis in Modular Latent Thermal Energy Storage Unit Based on Image Processing. Appl. Therm. Eng. 2024, 236, 121925. [Google Scholar] [CrossRef]
- Kahwaji, S.; White, M.A. Edible Oils as Practical Phase Change Materials for Thermal Energy Storage. Appl. Sci. 2019, 9, 1627. [Google Scholar] [CrossRef]
- Saleel, C.A. A review on the use of coconut oil as an organic phase change material with its melting process, heat transfer, and energy storage characteristics. J. Therm. Anal. Calorim. 2022, 147, 4451–4472. [Google Scholar] [CrossRef]
- Sidek, H.A.A.; Chow, S.P.; Shaari, A.H.; Senin, H.B. Ultrasonic studies of palm oil and other vegetable oils. J. Oil Palm. Res. 1996, 8, 37–44. [Google Scholar]
- Rekha, E.; Jeevakumar, R. Variation of Ultrasonic Velocity and a Few Acoustic Parameters as a Function Frequency in Some Commonly Used Edible Oils. Int. J. Multidiscip. Res. 2024, 6. [Google Scholar] [CrossRef]
- Sharma, M.D. Exploring Ultrasonic Velocity and Compressibility Analysis for Various Edible Oils: A Comparative Study. J. Condens. Matter. 2024, 2, 17–19. [Google Scholar] [CrossRef]
- Ali, S.K.M.; Ali, B. Acoustics impedance studies in some commonly used edible oils. Int. J. Innov. Sci. Eng. Technol. 2014, 1. [Google Scholar]
- Andrzejczyk, R.; Kowalczyk, T.; Kozak, P.; Muszyński, T. Experimental and theoretical study of a vertical tube in shell storage unit with biodegradable PCM for low temperature thermal energy storage applications. Appl. Therm. Eng. 2021, 183, 116216. [Google Scholar] [CrossRef]
- Wang, Z.; Bovik, A.C. A universal image quality index. IEEE Signal Process. Lett. 2002, 9, 81–84. [Google Scholar] [CrossRef]
- Liu, Z.; Gao, X.; Huang, X.; Xie, Y.; Gao, J.; Yang, X.; He, Q. Evaluation on solar-biogas heating system for buildings: Thermal characteristics and role of heat storage sectors. Appl. Energy 2025, 390, 125817. [Google Scholar] [CrossRef]
- Voller, V.R.; Peng, S. An enthalpy formulation based on an arbitrarily deforming mesh for solution of the Stefan problem. Comput. Mech. 1994, 14, 492–502. [Google Scholar] [CrossRef]
- Solomon, G.R.; Karthikeyan, S.; Velraj, R. Sub cooling of PCM due to various effects during solidification in a vertical concentric tube thermal storage unit. Appl. Therm. Eng. 2013, 52, 505–511. [Google Scholar] [CrossRef]
- Benedito, J.; García-Pérez, J.V.; Dobarganes, M.C.; Mulet, A. Rapid evaluation of frying oil degradation using ultrasonic technology. Food Res. Int. 2007, 40, 406–414. [Google Scholar] [CrossRef]
- Sharma, T.; Pandey, K.K.; Tripathi, M.; Upmanyu, A.; Singh, R.C. Ultrasonic attenuation study of liquid mixtures of Propylene Glycol and DD water at various temperatures. Mater. Today Proc. 2024, 104, 70–76. [Google Scholar] [CrossRef]


Disclaimer/Publisher’s Note: The statements, opinions and data contained in all publications are solely those of the individual author(s) and contributor(s) and not of MDPI and/or the editor(s). MDPI and/or the editor(s) disclaim responsibility for any injury to people or property resulting from any ideas, methods, instructions or products referred to in the content. |
© 2025 by the authors. Licensee MDPI, Basel, Switzerland. This article is an open access article distributed under the terms and conditions of the Creative Commons Attribution (CC BY) license (https://creativecommons.org/licenses/by/4.0/).