Article

A Three-Granularity Pose Estimation Framework for Multi-Type High-Voltage Transmission Towers Using Part Affinity Fields (PAFs)

1
Information & Communication Company, State Grid Sichuan Electric Power Company, Chengdu 610041, China
2
School of Mechanical Engineering, Sichuan University, Chengdu 610065, China
*
Author to whom correspondence should be addressed.
Energies 2025, 18(3), 488; https://doi.org/10.3390/en18030488
Submission received: 17 December 2024 / Revised: 15 January 2025 / Accepted: 17 January 2025 / Published: 22 January 2025
(This article belongs to the Topic Advances in Power Science and Technology, 2nd Edition)

Abstract

:
At present, Unmanned Aerial Vehicles (UAVs) combined with deep learning have become an important means of transmission line inspection; however, the current approach has the problems of high demand for manual operation, low inspection efficiency, inspection results that do not reflect the distribution of defects on transmission towers, and the need for a large number of manually annotated captured images. In order to achieve the UAV understanding the structure of transmission towers and identifying the defects in the parts of transmission towers, a three-granularity pose estimation framework for multi-type high-voltage transmission towers using Part Affinity Fields (PAFs) is presented here. The framework classifies the structural critical points of high-voltage transmission towers and uses PAFs to provide a basis for the connection between the critical points to achieve the pose estimation for multi-type towers. On the other hand, a three-fine-grained prediction incorporating an intermediate supervisory mechanism is designed so as to overcome the problem of dense and overlapping keypoints of transmission towers. The dataset used in this study consists of real image data of high-voltage transmission towers and complementary images of virtual scenes created through the fourth-generation Unreal Engine (UE4). In various types of electrical tower detection, the average keypoint identification AF of the proposed model exceeds 96% and the average skeleton connection AF exceeds 93% at all granularities, which demonstrates good results on the test set and shows some degree of generalization to electricity towers not included in the dataset.

1. Introduction

High-voltage transmission towers play a vital role in the transmission of electricity in modern society and are a key infrastructure [1,2]. Their condition has a significant impact on a large area and therefore requires frequent inspections [3]. Currently, taking images of transmission towers by UAVs manually operated by grid staff and using deep learning models for defect detection is a relatively advanced and commonly adopted approach [4,5,6]. However, this approach itself still faces many challenges. Firstly, manual operation of the UAV is required, which limits the efficiency [7,8]. Second, this method can only locate the defects in the image and cannot be accurate to the specific location and distribution of the transmission tower [9,10,11]. Finally, to obtain the distribution of defects in the whole tower, all the images need to be labeled manually, which is a huge amount of work and further reduces the efficiency [12,13,14]. Therefore, a method that can overcome the above problems is needed, i.e., a framework for understanding the structure of transmission towers, which can assist in realizing the detection of UAV patrol videos.
Pose estimation [15,16,17] reconstructs the keypoints and structural information of an object by predicting the keypoints of the object [18,19], which has been widely studied in the field of human pose estimation [20,21], animal pose estimation [22] and behavior analysis research [23,24], automobile structure estimation [25], and other kinds of object structure estimation. Many excellent algorithms have been born and good progress has been made, which fully demonstrates the potential of understanding the structure of transmission towers. However, traditional pose estimation methods applied to transmission towers have two difficulties. The first is the difference in coding methods, where traditional methods usually assign a unique label to each keypoint of an object and predict a keypoint in each channel of the network output [26]. However, the number of keypoints of transmission towers is large, and forcing specific encoding of each specific keypoint will lead to huge output channels. Second, the dense and similar distribution of transmission tower keypoints will have more keypoints that are similar and overlapping, posing a challenge to the prediction accuracy. Therefore, a transmission tower pose estimation method with a new coding method and overcoming the overlapping keypoint problem is needed.
In the transmission tower pose estimation task, the functions and tasks of transmission towers are relatively uniform, even though their structures may vary. In general, transmission towers are designed to carry transmission lines, lightning protection lines, and support structures. Therefore, a strategy of coding by functional categorization can be used to achieve a small number of keypoint categories covering multiple specific keypoints [27,28]. However, this strategy faces an additional problem in that the lack of naming of each keypoint leads to the possibility of multiple candidate connections for the same type of keypoint. Therefore, an auxiliary method is needed to select the correct connection from multiple candidate connections.
In multi-person pose estimation, the problem of detecting multiple identical joints but needing to determine who belongs to someone arises. OpenPose overcomes this problem by employing Part Affinity Fields (PAFs) [29], which predict the orientation of joint connections. This method provides a solution in identifying the correct joint from the candidate joints in transmission tower pose estimation.
Given the problem of dense, similar, and potentially overlapping keypoints of transmission towers, as well as the different accuracy requirements due to the change in the field of view from far to near in UAV inspection tasks, the idea of Feature Pyramid (FP) can be borrowed to build a solution. The Feature Pyramid achieves the gradual refinement of coarse- to fine-grained features through multi-scale feature processing and layer-by-layer intermediate supervision mechanisms. When the UAV is far away from the transmission tower, the high semantic layer provides coarse-grained information about the overall structure, while when the UAV is close, the low semantic layer provides fine-grained information about the distribution and connection of the keypoints to satisfy the needs in different distance scenarios. In addition, an intermediate supervision mechanism is introduced to apply supervision at each stage of feature generation separately, so that the network gradually optimizes the keypoint prediction from global to local and reduces the confusion between dense keypoints.
Above all, this paper proposes a three-granularity pose estimation framework for multi-type high-voltage transmission towers using Part Affinity Fields to address the efficiency limitations and complex keypoint detection problems in the current transmission tower inspection approach. The simplified schematic of the proposed method is shown in Figure 1. The main contributions of this paper are as follows:
(1)
A novel transmission tower attitude estimation framework with good generalization capability is proposed, which, unlike traditional target detection and image segmentation methods, can cover the keypoint and skeleton attitude detection of multiple types of transmission towers and assist in the implementation of defect localization detection in videos captured by UAVs.
(2)
A transmission tower structure detection method combining classification coding and PAFs is proposed, which solves the problem of coding extension under multiple types of structures of transmission towers and also accurately determines the correct skeleton connection from multiple candidate connections by the PAF method.
(3)
The proposed framework designs the corresponding three-granularity feature framework and intermediate supervision mechanism according to the actual situation of defect detection in transmission towers, gradually optimizes the keypoint prediction, solves the problem of dense, similar, and overlapping keypoints, and adapts to the needs of different horizons.
The structure of this paper is organized as follows: Section 2 presents related work on the inspection of electrical towers and pose estimation of electrical towers, Section 3 introduces the proposed three-granularity pose estimation framework for multi-type high-voltage transmission towers using PAFs, Section 4 discusses our experiments and analysis, and Section 5 concludes with the effects and potential applications of the proposed framework.

2. Related Work

The related work in this section is centered around the inspection of keypoints in electrical towers, which will be presented in two ways, one of which is research on the inspection of electrical towers based on deep learning, and the other of which is pose estimation.

2.1. Research on Inspection of Electrical Tower Based on Deep Learning

Using deep learning models to detect high-voltage transmission line images taken by UAVs has become an important approach, which involves two main tasks: object detection and segmentation.
Object detection includes identifying foreign objects such as bird nests and kites [2,3,4], insulators and their damaged locations [5,6], metal fittings like the pressure equalization ring shock absorber [7], and the more challenging detection of missing pins [8,9].
Segmentation techniques such as semantic segmentation and instance segmentation are mainly used for transmission line and tower segmentation [10,11], as well as insulator segmentation [12,13].
Many researchers have proposed original or improved neural networks for these tasks with good results in metrics like speed or accuracy on private or public datasets.
However, most of the data used in these studies do not consider the location of detected objects despite different locations having varying levels of importance. For example, a bird’s nest close to an insulator poses greater risk than one located on a lower branch or on the main trunk. Additionally, manually marking image locations is time-consuming when hundreds of images need to be captured per tower inspection or tens of thousands and even up to hundreds of thousands per powerline survey. Therefore, detecting keypoints and skeleton structures on electric towers combined with existing target tracking technology like HR-CEUTrack [14] can help UAVs understand shooting positions during inspections, reducing manual labeling workloads while also supporting automatic path planning or custom inspection tasks.

2.2. Pose Estimation

Pose estimation is a widely studied computer vision task. Whether it follows a top–down or bottom–up framework or employs heatmap soft regression or direct coordinate point regression, traditional pose estimation methods specifically name all keypoints of an object. During prediction, a specific keypoint is determined using a dedicated heatmap channel (for the heatmap regression). The most extensively researched area in this field is human pose estimation, with notable algorithms such as DeepPose [15], CMP [16], Hourglass [17], Simple Baseline [18], OpenPose [29], HRNet [19], etc. Additionally, hand gesture estimation [20], face estimation [21], and animal pose estimation and behavior analysis research [22,23,24], as well as the pose estimation of specific objects like cars [25,26], are also areas of focus.
However, when it comes to estimating the pose of electrical towers, there exists a wide range of tower types, and employing this method would only allow for the identification of one type of electrical tower. For the pose estimation of multi-type towers, in reference [1], a posture estimation was conducted for a five-class tower by individually labeling the keypoints of each specific type and predicting the corresponding tower type accordingly. Nevertheless, this approach presents certain challenges: it necessitates numerous output channels with each additional type requiring dozens more, making it difficult to generalize to other tower types. Furthermore, complete structural visibility is required in the image for the accurate determination of the number of tower floors; otherwise, the prediction results may be compromised. Xu et al. [30] implemented a pose estimation method for multi-class objects based on matching principles; however, the keypoints for each class of objects in the dataset still need to be specifically defined.
Therefore, further research is warranted on how to effectively identify objects belonging to the same category but exhibiting significantly different structures or even varying numbers of components, such as the plant keypoints, insect keypoints, and heterogeneous electrical towers analyzed in this study.

3. Proposed Framework

This section will be presented in the following two parts: data annotation and network. Data annotation includes the dataset source and Gaussian heatmaps for representing keypoints and PAFs for representing connections. Network includes the HRNet backbone, network’s neck, loss function, and parameters.

3.1. Data Annotation

Considering that the data annotation of transmission towers relies on the transmission tower images and the corresponding annotation forms, Section 3.1 will include the data source of the transmission tower image and the corresponding image’s Gaussian heatmaps for representing keypoints and PAFs for representing connections.

3.1.1. Dataset Source

The dataset used in this paper consists of two parts. The first part comprises real data obtained from transmission tower images captured by manually operated UAVs operated by power grid staff. From the entire image set, we selected images that depict the complete structure of electrical towers, including five types: drum tower, sheep horn tower, zigzag tower, wine-glass-1 tower, and wine-glass-2 tower. The second part is a dataset created using UE4 and includes two classes of towers (referred to as UE-1 and UE-2 for convenience). In this paper, with the support of the Unreal Engine 4 environment, various types of surrounding environments (mountains, plains, lakes, and woods), various types of tower structures (two types of towers: UE-1 and UE-2), and different types of weather (sunny, cloudy, and rainy) are created in the virtual scene. And the UAV is simulated to take pictures of the tower from different angles to obtain the sample of the high-voltage transmission tower based on Unreal Engine 4, which is used to expand the number of samples in the dataset for pre-training the model. The towers exhibit diverse shapes, yet they all serve the same purpose of accommodating three-phase transmission lines and lightning protection lines, thus necessitating a categorization of keypoints. Simultaneously considering varying granularity requirements in practical applications, this paper proposes three distinct methods for annotating electrical tower images at different levels of detail.
The Granularity-1 level provides a general overview, while the Granularity-2 level separates the upper and lower layers of the tower. Additionally, the Granularity-3 level further divides the front and back layers based on the divisions made at Granularity-2. Specifically, within these three levels of annotation, there are keypoints belonging to class 5,5,14 categories and connections established between keypoints belonging to 5,5,37 types, respectively.
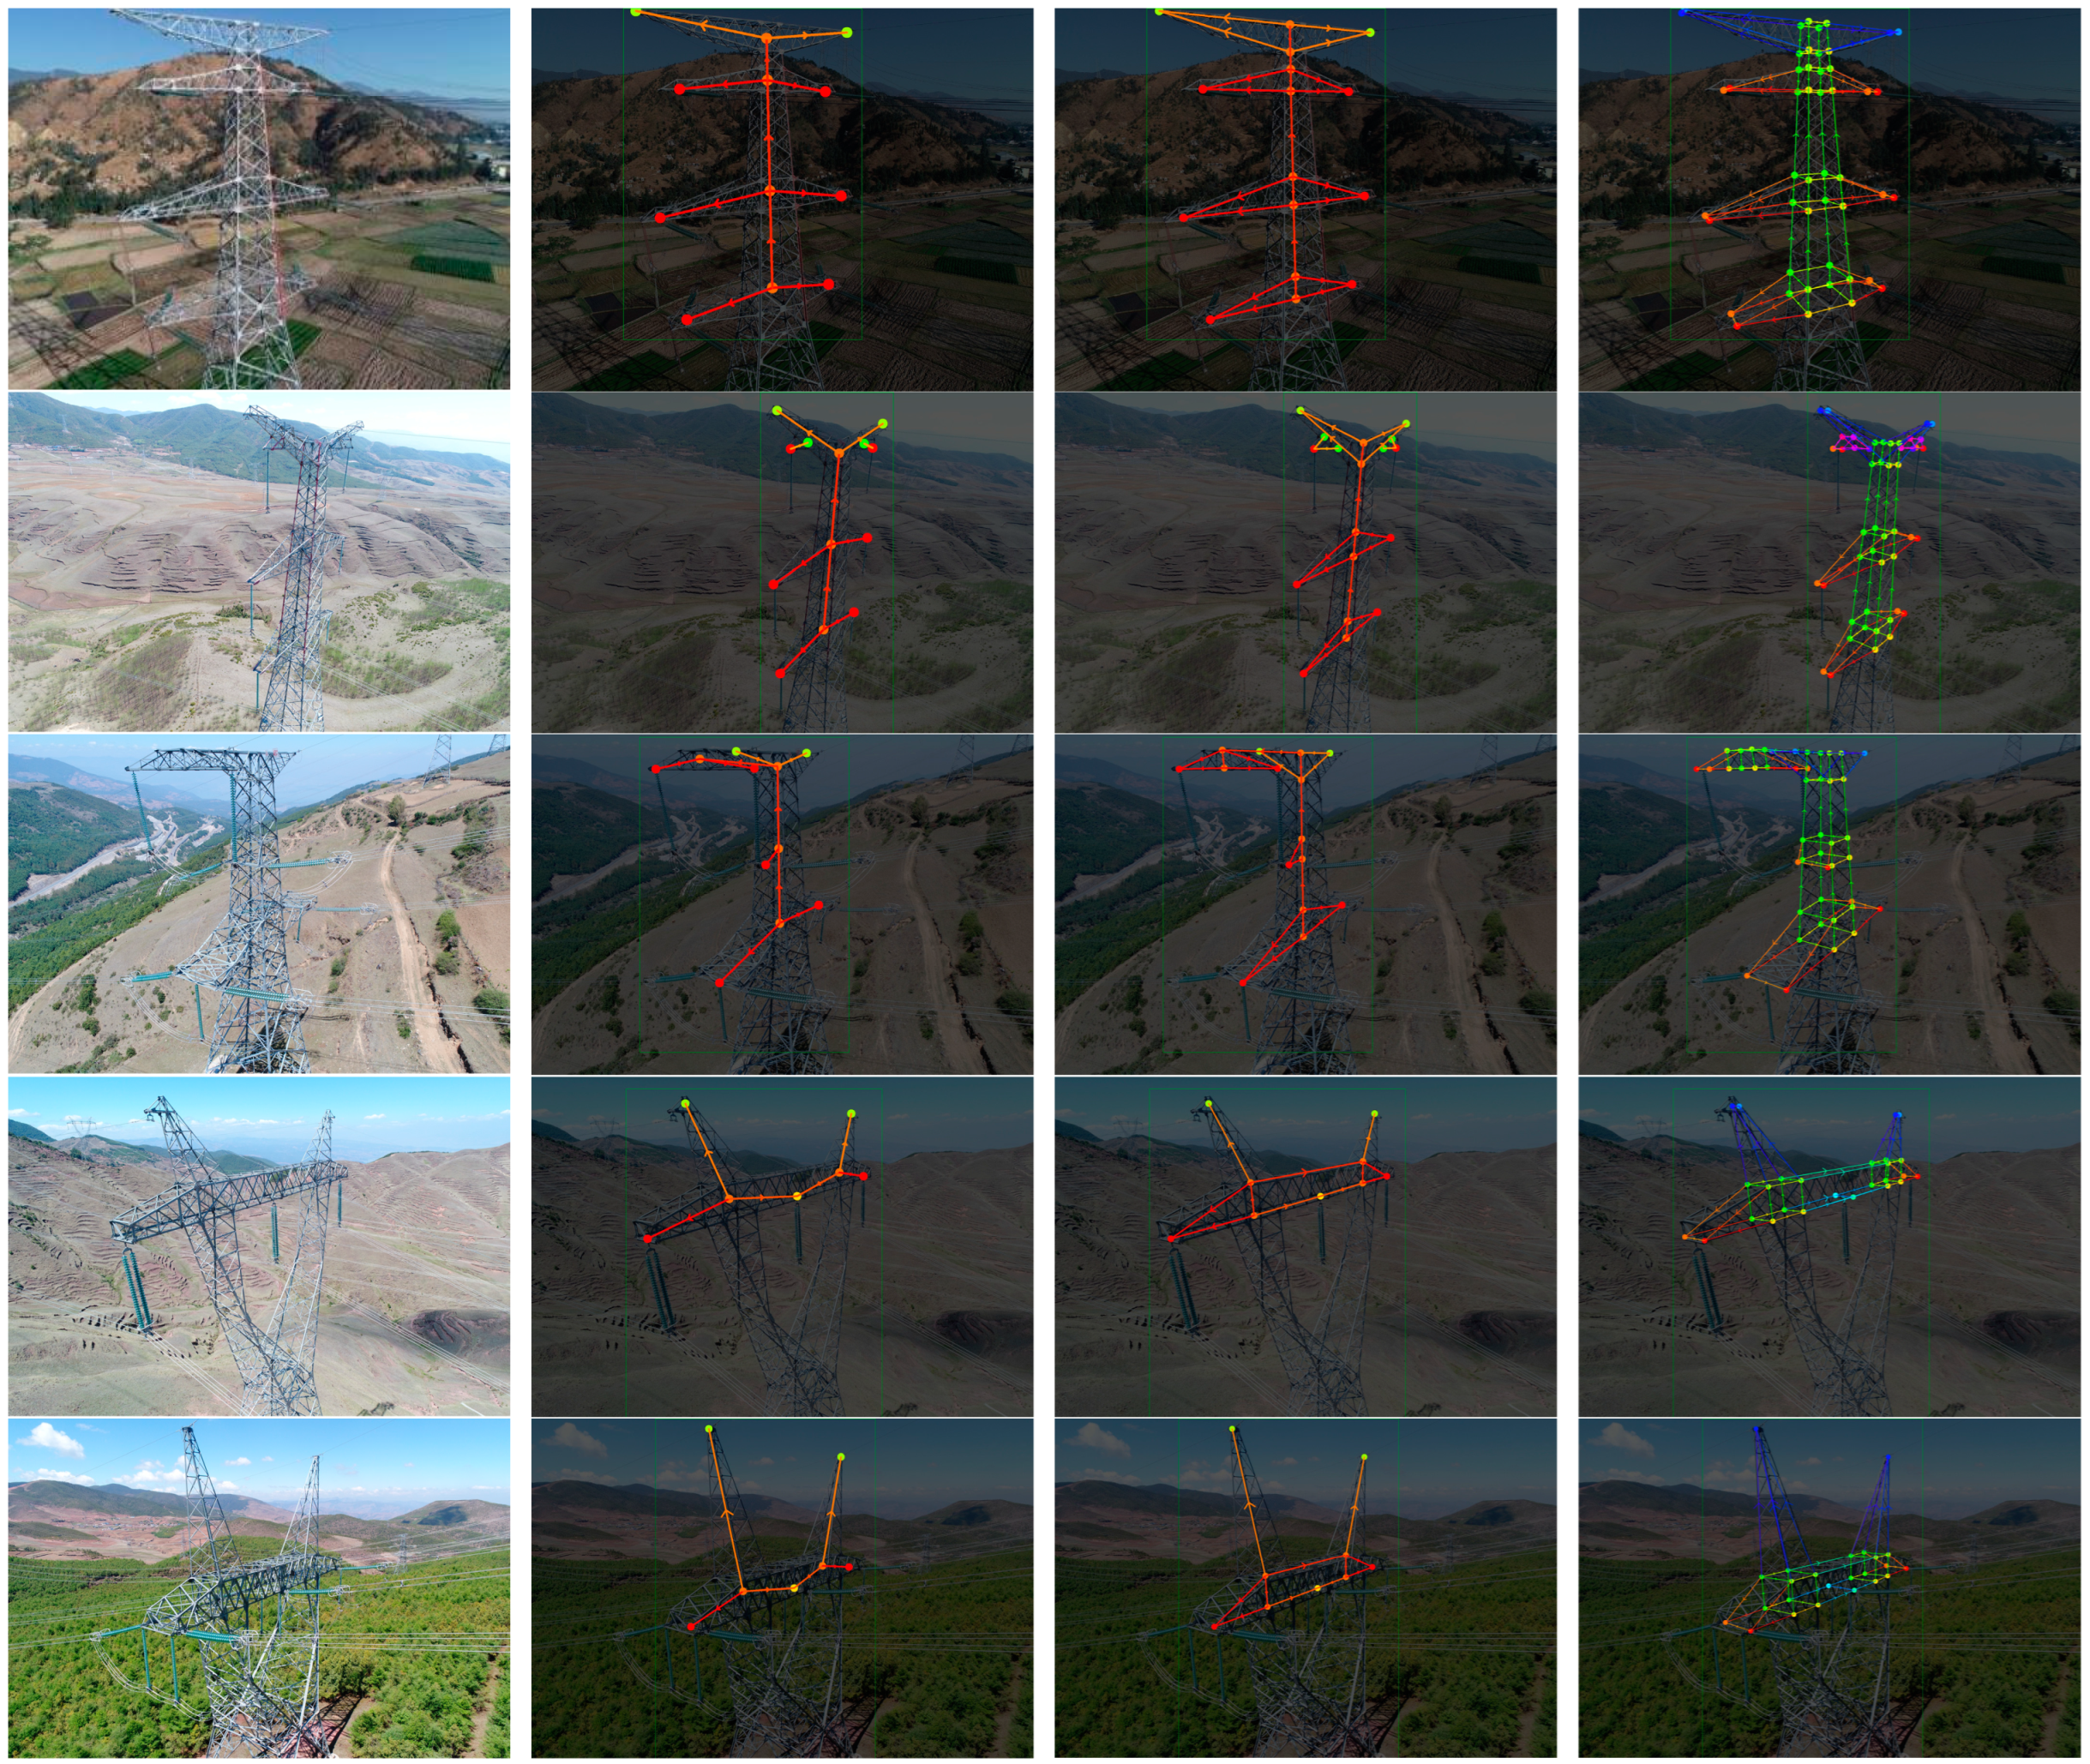
Table 1 presents the quantities of different types of electrical tower images as well as the numbers of keypoints and skeletons. Additionally, Figure 2 illustrates the structures of various tower types and their corresponding labeling methods. To enhance generalizability and expand the dataset size, a portion of each image is cropped to include at least two complete cross arms, resulting in a final dataset comprising 2916 samples. This dataset is then divided into a training set (2049 samples), validation set (289 samples), and test set (579 samples) according to a ratio of 7:1:2.

3.1.2. Gaussian Heatmaps for Representing Keypoints and PAFs for Representing Connections

The keypoints in this paper are categorized, and an output channel of the heatmap represents the probability prediction of multiple points of the same type. Therefore, similar to the task of multi-person pose detection, predicting the connection relationship between similar keypoints becomes a key challenge. Drawing inspiration from OpenPose’s approach to multi-person pose detection, this paper utilizes Gaussian heatmaps to represent keypoints and PAFs to represent connections between keypoints.
The direct regression of keypoint coordinates for single keypoint prediction may result in visually accurate predictions but with a large loss. Conversely, the direct prediction of coordinates for multiple keypoints also faces challenges in encoding quantity effectively. In the process of generating the target, a Gaussian heatmap is utilized to represent the probability that each region within the heatmap corresponds to a specific keypoint. This probability calculation can be expressed as follows:
H ^ x , y = e ( ( x x ^ ) 2 + ( y y ^ ) 2 2 σ 2 )
where ( x ^ , y ^ ) is the ground truth of the keypoints; σ is the standard deviation used to control the size of the light area (area of large value); and H ^ x , y indicates the value of the position at the (x, y) of the heatmap. When a position approaches (x, y), its value tends to be close to 1, indicating high confidence. Conversely, when a position deviates from (x, y), its value tends to be close to 0, suggesting low confidence.
The Gaussian heatmap channel generated by the network represents the probability prediction of a class of keypoints, typically resulting in multiple high-heat regions that correspond to multiple keypoints. The interconnection between these keypoints requires guidance. OpenPose proposes PAF as a solution to this problem, where each connection is represented by a unit vector indicating its direction. The x and y components of the vector field are separately denoted and calculated as follows:
P A F X ( x , y ) = { x 2 x 1 L 0 x L , W 2 y W 2 0 e l s e
P A F Y ( x , y ) = { y 2 y 1 L 0 x L , W 2 y W 2 0 e l s e
x = ( x x 1 ) × cos θ + ( y y 1 ) × sin θ y = ( x x 1 ) × sin θ + ( y y 1 ) × cos θ θ = arctan d ( y 2 y 1 x 2 x 1 ) L = ( x 2 + x 1 ) 2 + ( y 2 + y 1 ) 2
where the coordinates (x, y) represent the points in the vector field, while x 1 , y 1 , x 2 , and y 2 denote the horizontal and vertical coordinates connecting the starting point and ending point of de. The transformed coordinates (x’, y’) are obtained by aligning the connection direction with the X-axis direction and taking the starting point as the origin; θ is the angle of this connection. L represents its length, and W denotes its width range, which requires additional configuration.
The PAF consists of two vectors for each pair of associated keypoints: one for the x-direction component and its unit vector and the other for the y-direction component and its unit vector. To calculate the pylons’ pose connection using the PAF vector, follow these steps:
(1)
Obtain the heatmap of the corresponding keypoint pair for a given electrical tower connection.
(2)
Apply Gaussian filtering to these two heatmap channels to obtain their probability distribution maps.
(3)
Retrieve the region with peak values from the filtered Gaussian heatmap as candidate connection points, obtaining multiple candidates for both starting and ending points.
(4)
Iterate over all candidate starting and ending points, adopting an approach similar to integral interpolation to round positions between them. Multiply this interpolated position’s value with the unit vector connection from the start to end point, then add it up to obtain a score for each connection. If this score exceeds a threshold, predict it as a skeleton connection; otherwise, discard it.
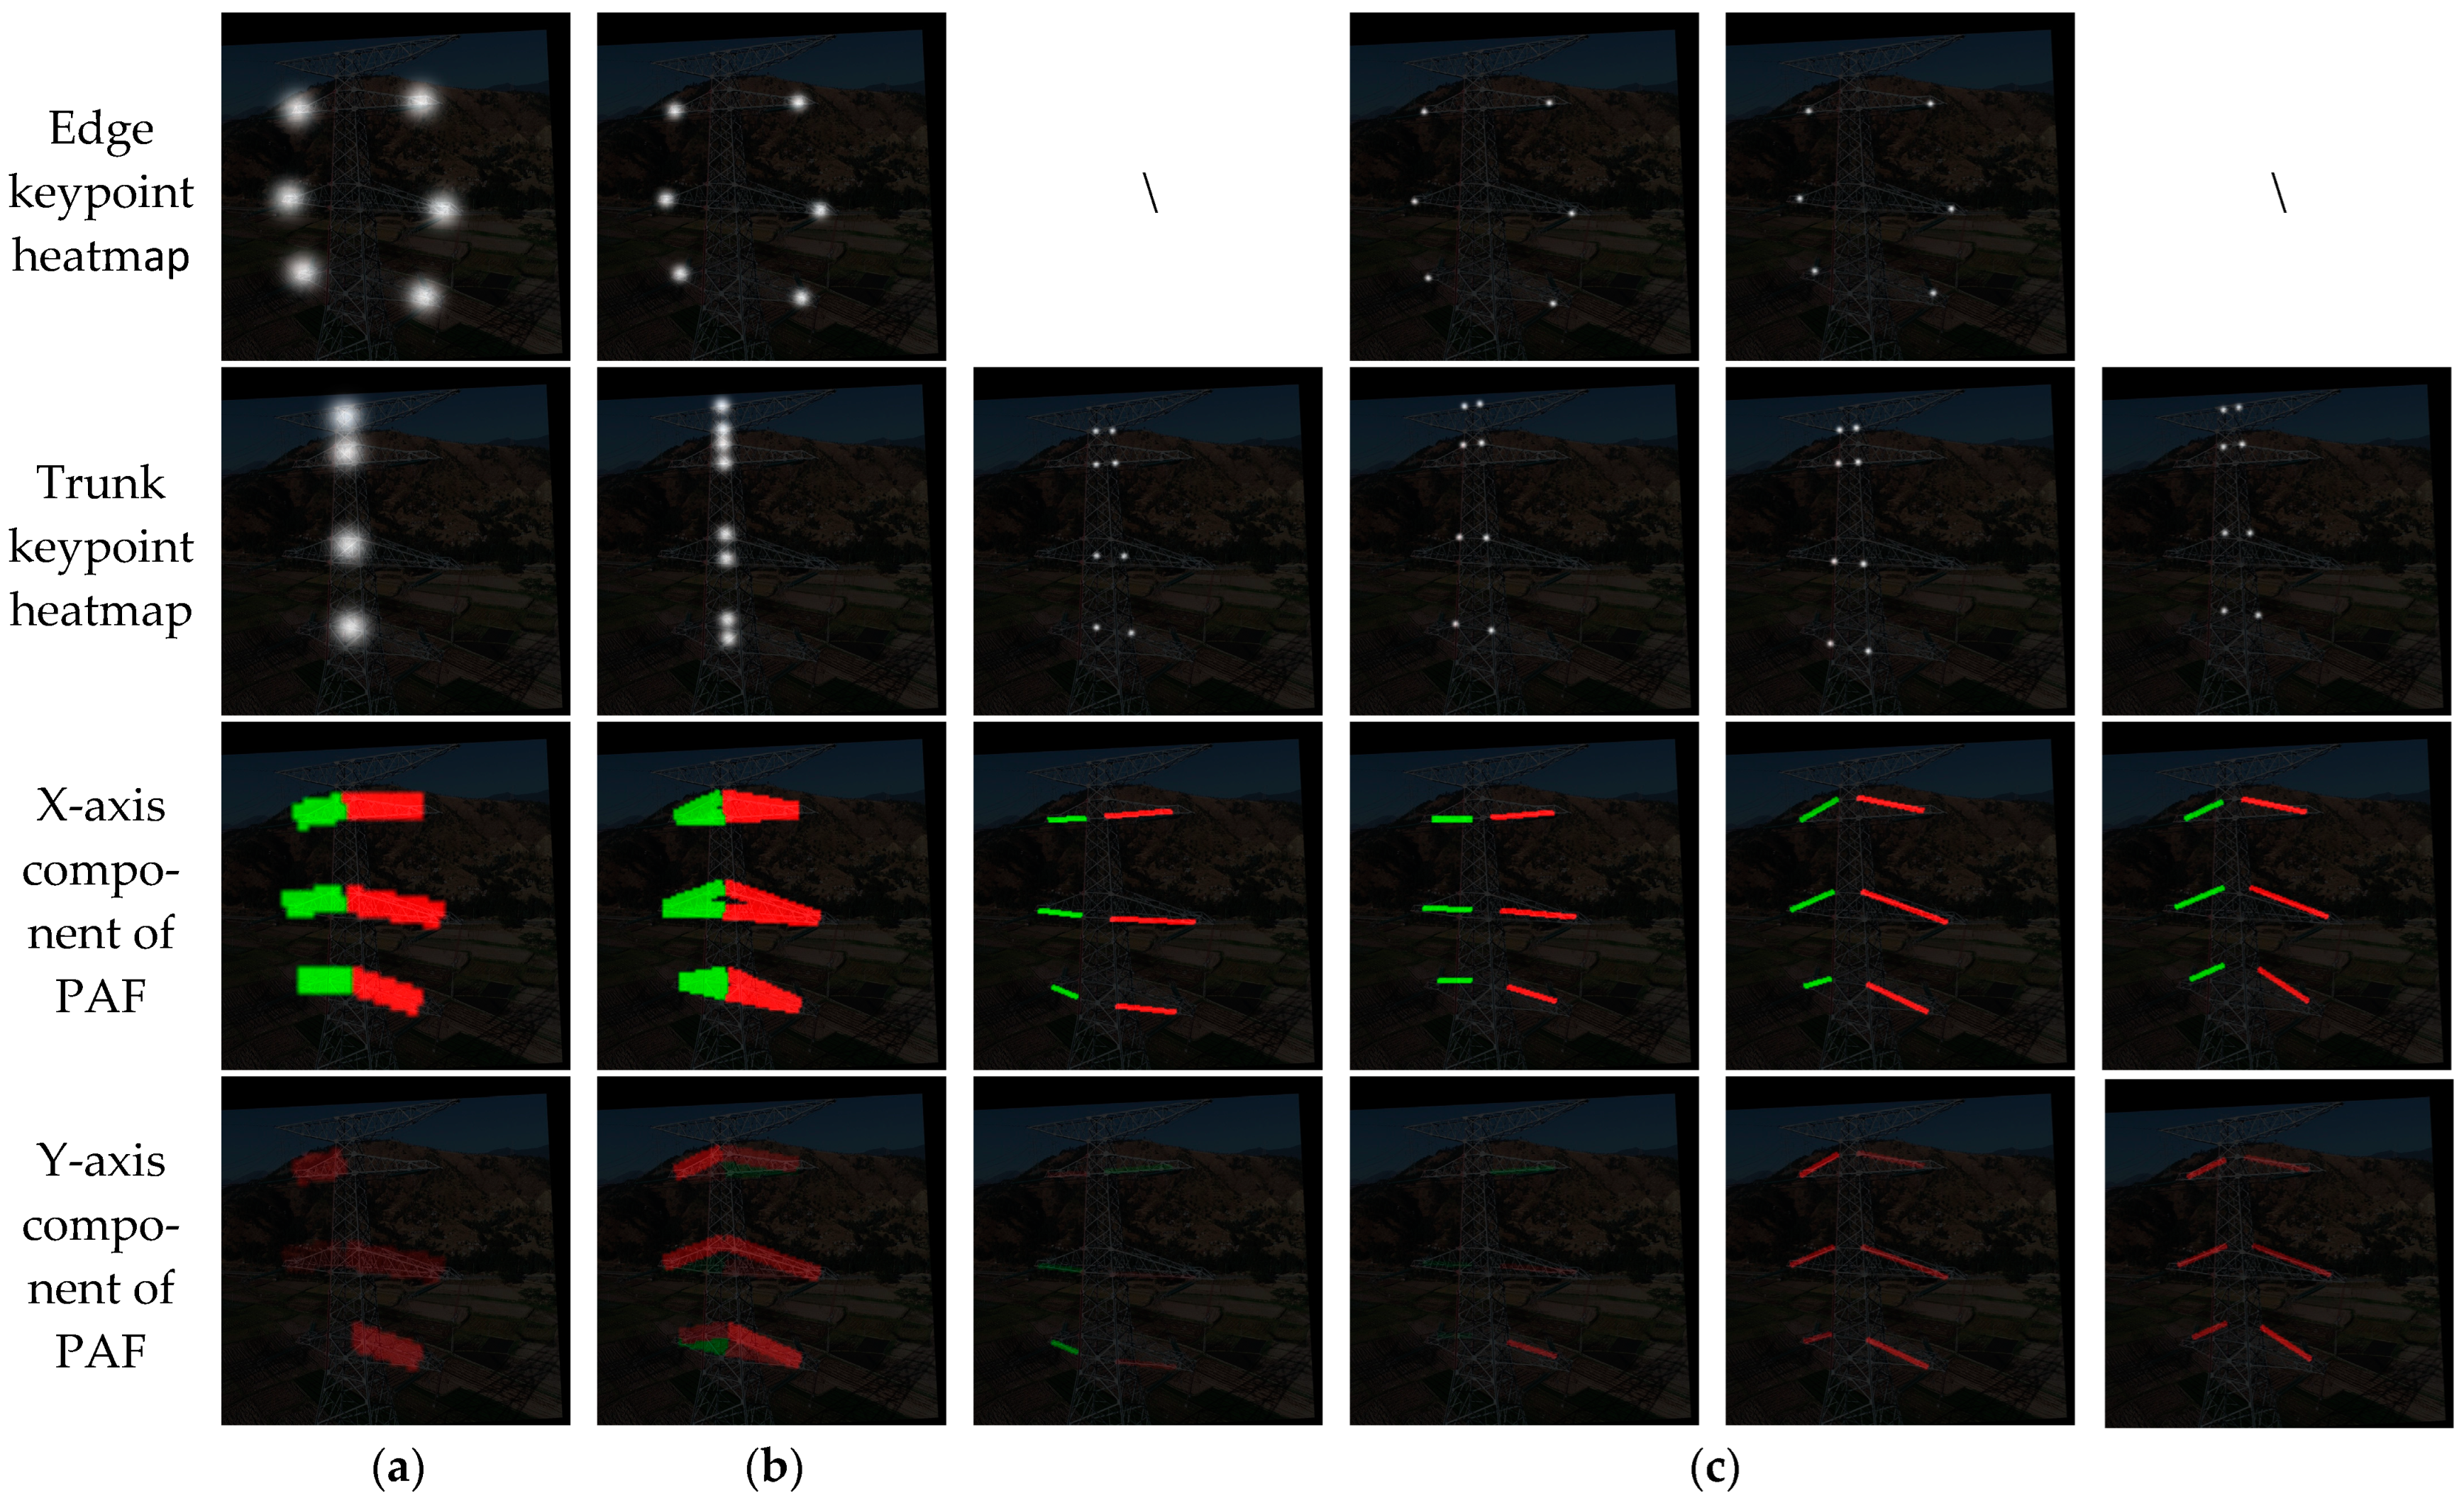
In addition, it is worth noting that the power tower poses a challenge where keypoints of the same type are interconnected. However, this issue does not exist in human pose estimation. Therefore, a fixed order is established for connecting different types, while the relative position between keypoints of the same type is determined during target generation based on their left and right order to prevent network confusion. Figure 3 illustrates the ground truth representation of heatmaps for keypoints and PAF maps depicting connections among three intricate electrical tower crossbars.

3.2. Network

Since the construction of the network serves as an important part of the proposed framework, Section 3.2 will illustrate four aspects of network construction by the HRNet backbone, network’s neck, loss function, and parameter setting.

3.2.1. HRNet Backbone

The High-Resolution Network (HRNet) serves as the backbone of the model, featuring a multi-resolution parallel network with each scale branch performing convolution operations to achieve superior performance in multi-scale and high-resolution tasks, and its network structure diagram is shown in Figure 4. The model consists of four stages, each containing 1, 1, 4, and 3 convolution modules, respectively. These modules adopt a residual structure similar to ResNet [31] to prevent gradient vanishing. Finally, the output feature layers for four sizes are set at 48, 96, 192, and 384 channels.

3.2.2. Network’s Neck

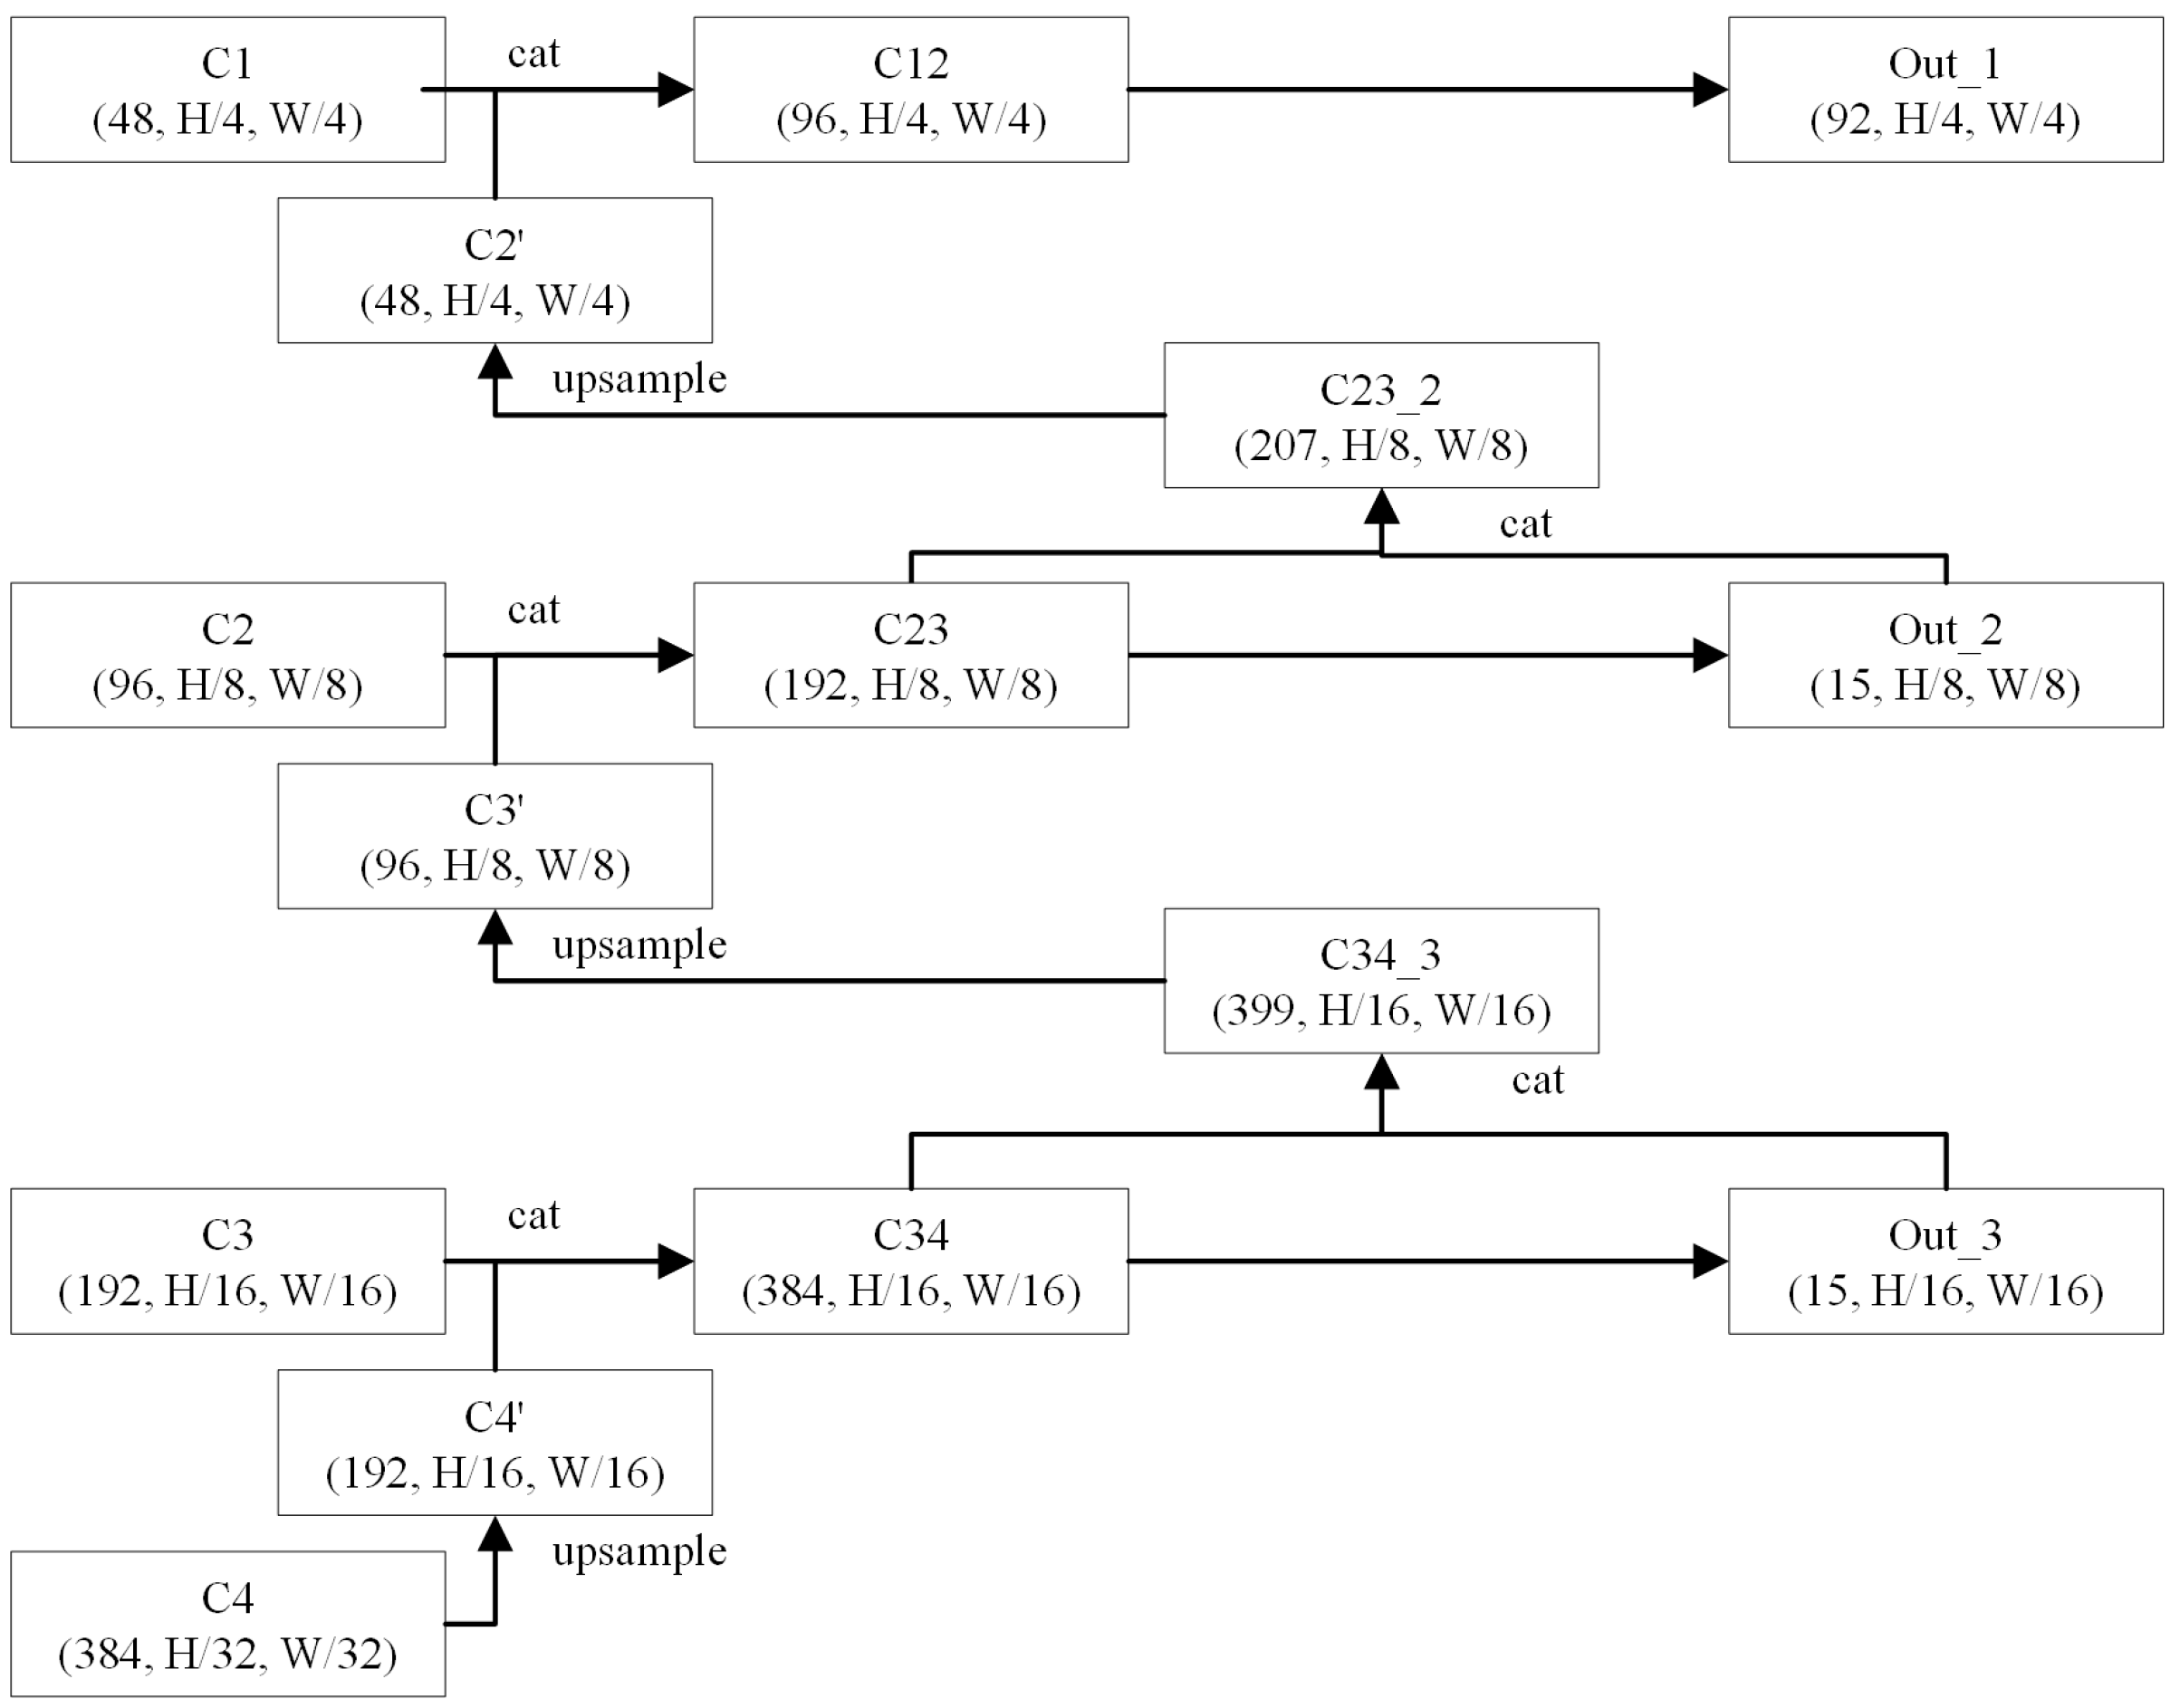
The neck of the model is specially designed in this paper, and its structure is illustrated in Figure 5. Due to the evident progressive relationship between the three-granularity output, a Feature Pyramid-like structure is adopted. Simultaneously, the outputs from the previous two levels are merged with the input and upsampled to contribute to the next level’s output, while intermediate supervision is achieved by calculating the loss between the input and target.
The heatmaps of the output keypoints and the connected PAF are directly merged as the network’s outputs without separate branches since they share identical width and height dimensions. As a connected PAF requires 2-channel representations, each of the three outputs has channel sizes of 15, 15, and 92, respectively.
For the three-granularity target output of HRNet, the neck structure is altered to adopt a design similar to that of the Feature Pyramid and the upsampling part of UNet. Specifically, the structural design is changed from the traditional way of outputting results directly through one feature layer to a structural design of gradual refinement through multiple feature layers. In this way, during the multi-scale feature processing of the model, the information of different scales can be better integrated, and the feature expression can be gradually optimized from coarse to fine, so that the final output feature maps can simultaneously take into account the accuracy of the overall framework and the fineness of the local details. This modification not only improves HRNet’s ability to express multi-level information but also enhances the model’s adaptability in complex scenarios (e.g., transmission tower pose estimation) so that the output three-granularity target can more accurately reflect the locations and relationships of keypoints.

3.2.3. Loss Function

The three fine-grained outputs of the neck output are supervised through intermediate supervision in this paper, and the loss is computed as follows:
L o s s = i = 1 3 λ i l i
where λ i is the loss coefficient for the i-th granularities, with weights of 0.2, 0.4, and 1 assigned to the three levels, respectively, and l i denotes the loss associated with the i-th fine granularity. All losses are evaluated using MSE, while both the heatmap and PAF contribute to output generation and participate in the calculation of losses.

3.2.4. Parameters

The training process for the electrical tower image involves capturing the area of the tower from the original image and applying conventional data augmentation techniques such as random offset, flip, and scaling. It should be noted that detecting the position of the electrical tower is considered a simple object detection task, which falls outside the scope of this paper and is not taken into account. To ensure detailed representation, an input size of 1024 × 1024 is set. Consequently, three-granularity heatmaps are generated with dimensions of 64 × 64, 128 × 128, and 256 × 256, respectively. The standard deviation (σ) values for these heatmaps are set to 2, 2, and 1.5, respectively. Additionally, the W in formulation (2) in each heatmap variation is set to 2.5, 3, and 2, respectively.

4. Experiments and Analysis

This section will be presented in the following four parts: implementation details of the experiments, evaluation metrics of the proposed framework, experimental results on the test set, and an image not included in dataset test.

4.1. Implementation Details

The experimental platform in this paper operates on Windows10, utilizing the open-source framework Multi-Modal Pose Estimation (MMPose) from OpenMMLab, and is equipped with an NVIDIA 2080Ti 22G graphics card. The training process includes a maximum of 100 rounds, with validation performed after each round and early stopping implemented. If there is no improvement in performance on the validation set within 20 rounds, the training process will be terminated prematurely. Finally, the model that achieves the best results on the validation dataset will be used for testing.

4.2. Evaluation Metrics

The evaluation metric employed in this paper is based on average precision (AP), average recall (AR), F1-scores of three-granularity keypoints and connections under various oks thresholds, and a comprehensive metric for selecting the optimal weight on the validation set.
The AP for object detection is based on Intersection over Union (IoU). However, since the output of the keypoints is a point rather than a box or an area, the object keypoint similarity (OKS) metric is utilized to calculate the similarity between the predicted and ground truth keypoint locations. The OKS is calculated as follows:
O K S = e ( d 2 2 σ 2 )
where d is the distance between the ground truth and the predicted keypoint, while σ represents a control parameter. In this case, these values are set to 4, 4, and 3, respectively. (The original OKS calculation formula includes the parameter of image size S. However, since the experimental network model used in this paper consistently calculates image size, this parameter has been removed without significantly altering the meaning of the formula).
The calculation process involves the use of a heatmap to predict multiple similar keypoints. For each ground truth, the keypoint with the highest OKS is identified as the most matching one. Subsequently, the OKS of each ground truth is compared against a threshold value. If it exceeds the threshold, it is classified as true positive (TP). Conversely, if it falls below the threshold or fails to match any keypoint, it is considered false negative (FN). Additionally, if no ground truth is paired with a predicted keypoint, it is regarded as false positive (FP). The AP, AR, and F1-score are calculated as follows:
AP = TP TP + FP AR = TP TP + FN F 1 = 2 × AP × AR AP + AR
For the general pose estimation task, given that the keypoints are pre-defined and their connection modes are predetermined, once the keypoints are detected, the connections between them become fixed. Therefore, only the prediction accuracy of these keypoints needs to be calculated. However, in the case of studying electrical towers, as discussed in this paper, there exists uncertainty regarding specific connection modes and a potential confusion problem with respect to keypoint connections. Even if the keypoints are predicted accurately, there is a possibility of incorrect connections being formed. Hence, it becomes necessary to calculate the accuracy effect of predicting these connections. The calculation method for the AP, AR, and F1-score of connections is similar to that of keypoints, with the exception that only when both the starting point and ending point of the connection have an OKS greater than the threshold will they be recorded as TP.
The numerous evaluation indicators necessitate the weighting of these indicators to derive a comprehensive evaluation index, which facilitates the selection of a model with optimal performance on the validation set. The calculation process is as follows:
M = i = 1 2 α i ( λ 1 F 1 1 + λ 2 F 1 2 + λ 3 F 1 3 + λ 4 F 1 cn )
where λ i denotes the F1-score coefficient for different granularity keypoint and connection predictions, with values of 0.15, 0.2, 0.3, and 0.35 used in this paper, and α i represents the coefficient for different OKS threshold values, set to 0.8 when the threshold is 0.5 and to 0.2 when it is at a value of 0.75.
By comparing the results of multiple experiments, based on the difficulty distribution of the tasks (three fine-grained keypoint predictions and one skeleton prediction), we refer to the literature [32], the information of the gradient descent ratio read, we follow the ratio, and we assign the relevant weights.
Subsequently, the OKS threshold 0.5/0.75, with reference to the COCO Dataset [33], represents the performance under two different degrees of stringency to ensure that the model selected on the validation set can reasonably evaluate the model performance under different degrees of stringency, and the setting of the weights at 0.8 (lax criterion) and 0.2 (stringent criterion) is mainly based on the following considerations.
The lenient criterion (0.5) is closer to the overall task completion based on the accuracy of positioning and assesses the overall performance contribution of the model under relatively lenient conditions, so the weight is higher and set at 0.8.
The strict criteria (0.75) reflects the model’s ability in high-precision scenarios, but because the strict criteria has a lower proportion of scenario requirements in real tasks, it is given a lower weight and set to 0.2.
With this combination of weight settings, model performance can be measured more comprehensively, while highlighting the value of the vast majority of tasks applied under relaxed conditions.

4.3. Experimental Result

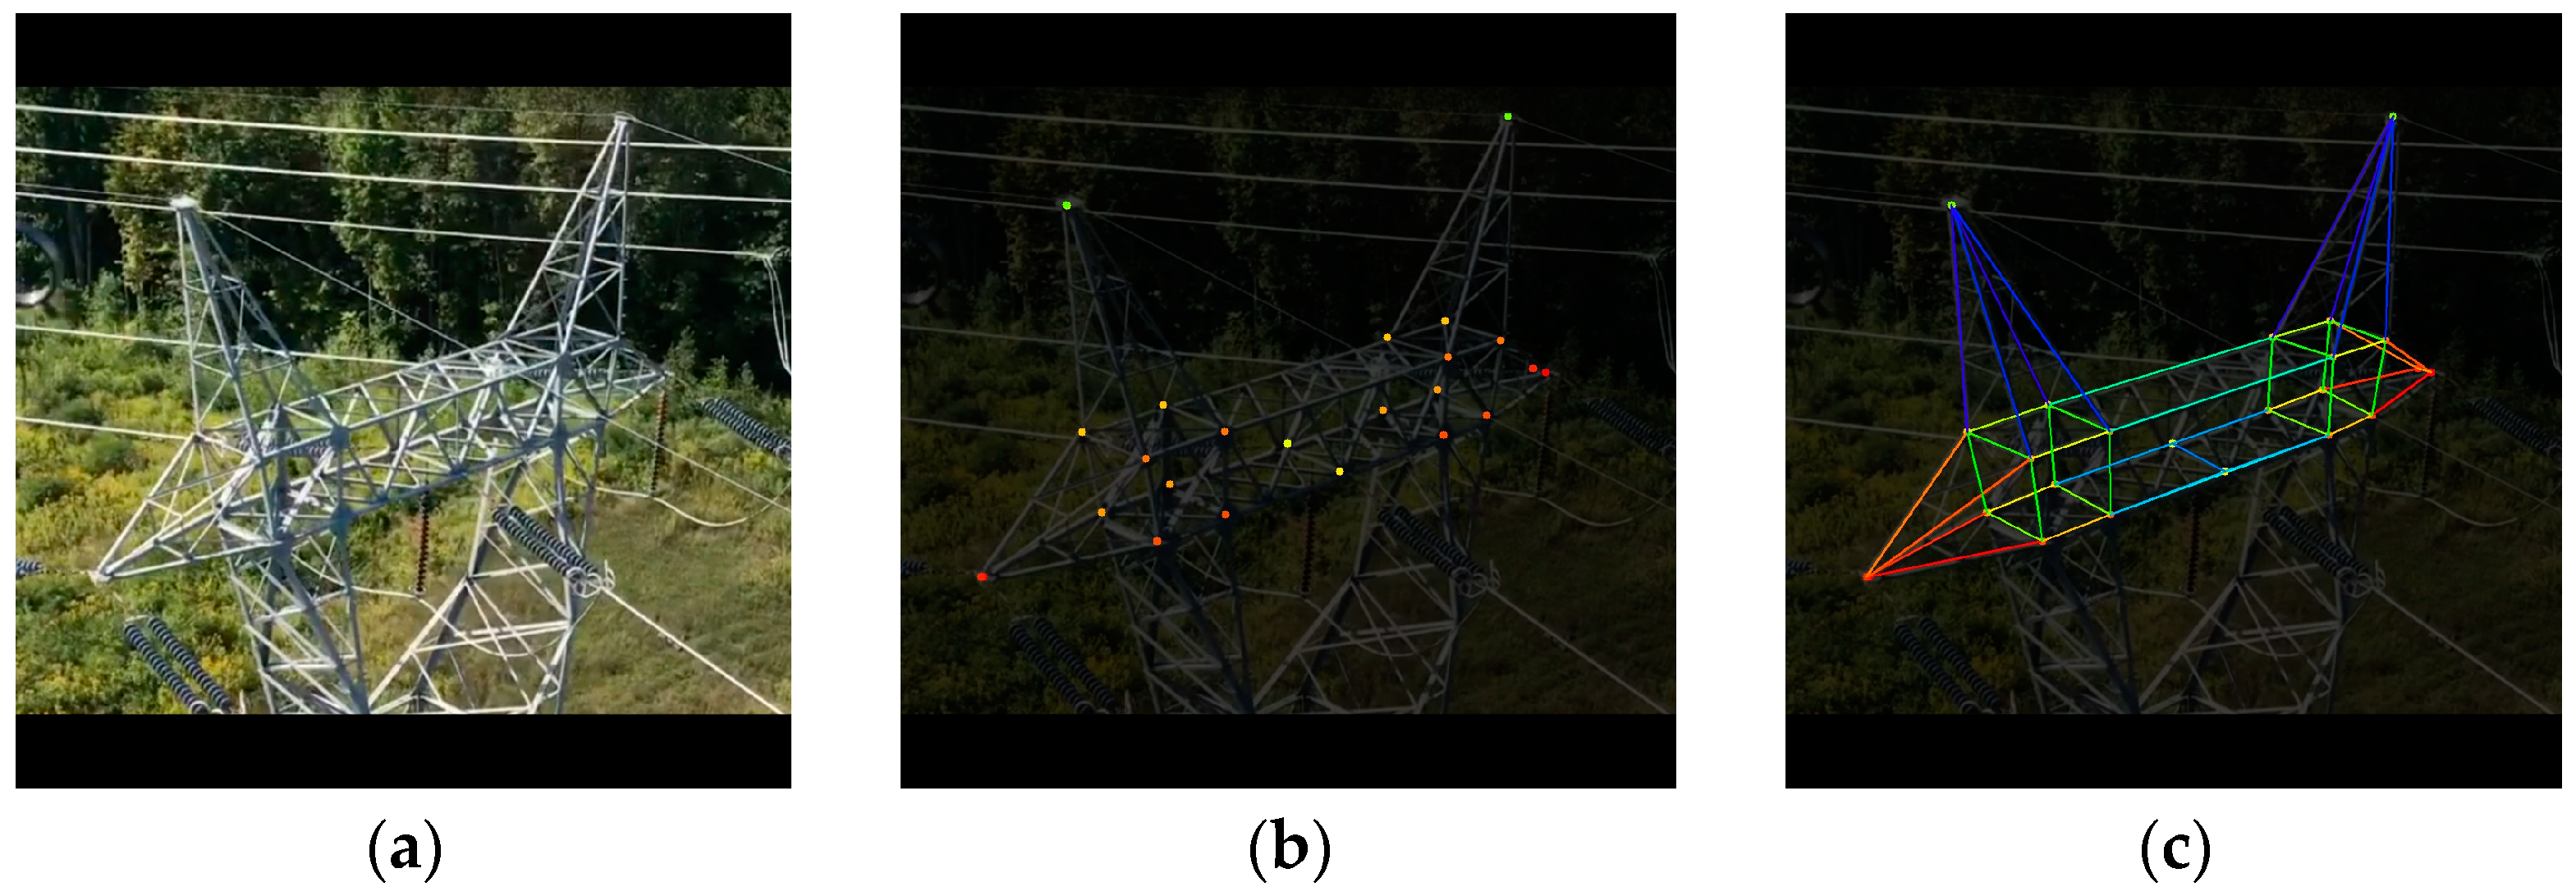
The performance of the proposed framework on the test set is presented in Table 2. It can be observed from Table 2 that both Granularity-1 and Granularity-2 demonstrate exceptional precision even with an OKS threshold of 0.75, while Granularity-3 achieves a commendable precision of keypoints at approximately 0.96 when the OKS threshold is set to 0.5. Moreover, as the OKS threshold increases to 0.75, the keypoint precision reduces to about 0.87. This suggests that the proposed framework can effectively identify keypoints at various levels of granularity for multiple classes of transmission towers. Figure 6a illustrates the original image, Figure 6b showcases the keypoints obtained using our proposed categorization method, Figure 7 shows the detection effect of the proposed framework on the test set, and Figure 8c demonstrates the detection effect achieved by reference [4]. Notably, it can be observed that reference [4] tends to encounter difficulties in accurately detecting intricate keypoints within electrical tower backbones; however, our proposed method effectively addresses this issue.
In addition, Table 3 demonstrates that the accuracy of the connection is approximately 0.93 when the OKS threshold is set to 0.5, whereas it drops to around 0.80 with an OKS threshold of 0.75. This shows that the proposed framework can effectively identify the skeleton connections of multi-class transmission towers. Hence, it can be inferred that this paper’s utilization of a PAF provides a precise foundation for keypoint connections. Table 4 presents the precision, recall, and AP values for keypoints and connections across various categories at an OKS threshold of 0.5. Figure 7 showcases detection samples of diverse transmission tower types, illustrating how the proposed framework based on categorized keypoints and PAFs effectively estimates multi-type electrical towers’ poses. In Table 5, the proposed method compares several models that perform best on the MPII Human Pose dataset [34], such as PCT (Pose as Compositional Tokens) [35], Soft-gated Skip Connections [36], Cascade Feature Aggregation [37], and TransPose [38]. Since these methods do not predict for three granularities, only the AF of the finest granularity of the keypoints and skeleton are evaluated for the OKS thresholds of 0.5 and 0.75, respectively, and the AFs of the keypoints and skeleton are evaluated for the OKS thresholds of 0.5 and 0.75, respectively. It is obvious that all the AF metrics of the proposed methods are the highest. In Table 6, ablation experiments for the method proposed are shown. From the table, it can be seen that AF performs best only when HRNet combines both three granularity with the PAF and the intermediate supervision mechanism.

4.4. Image Not Included in Dataset Test

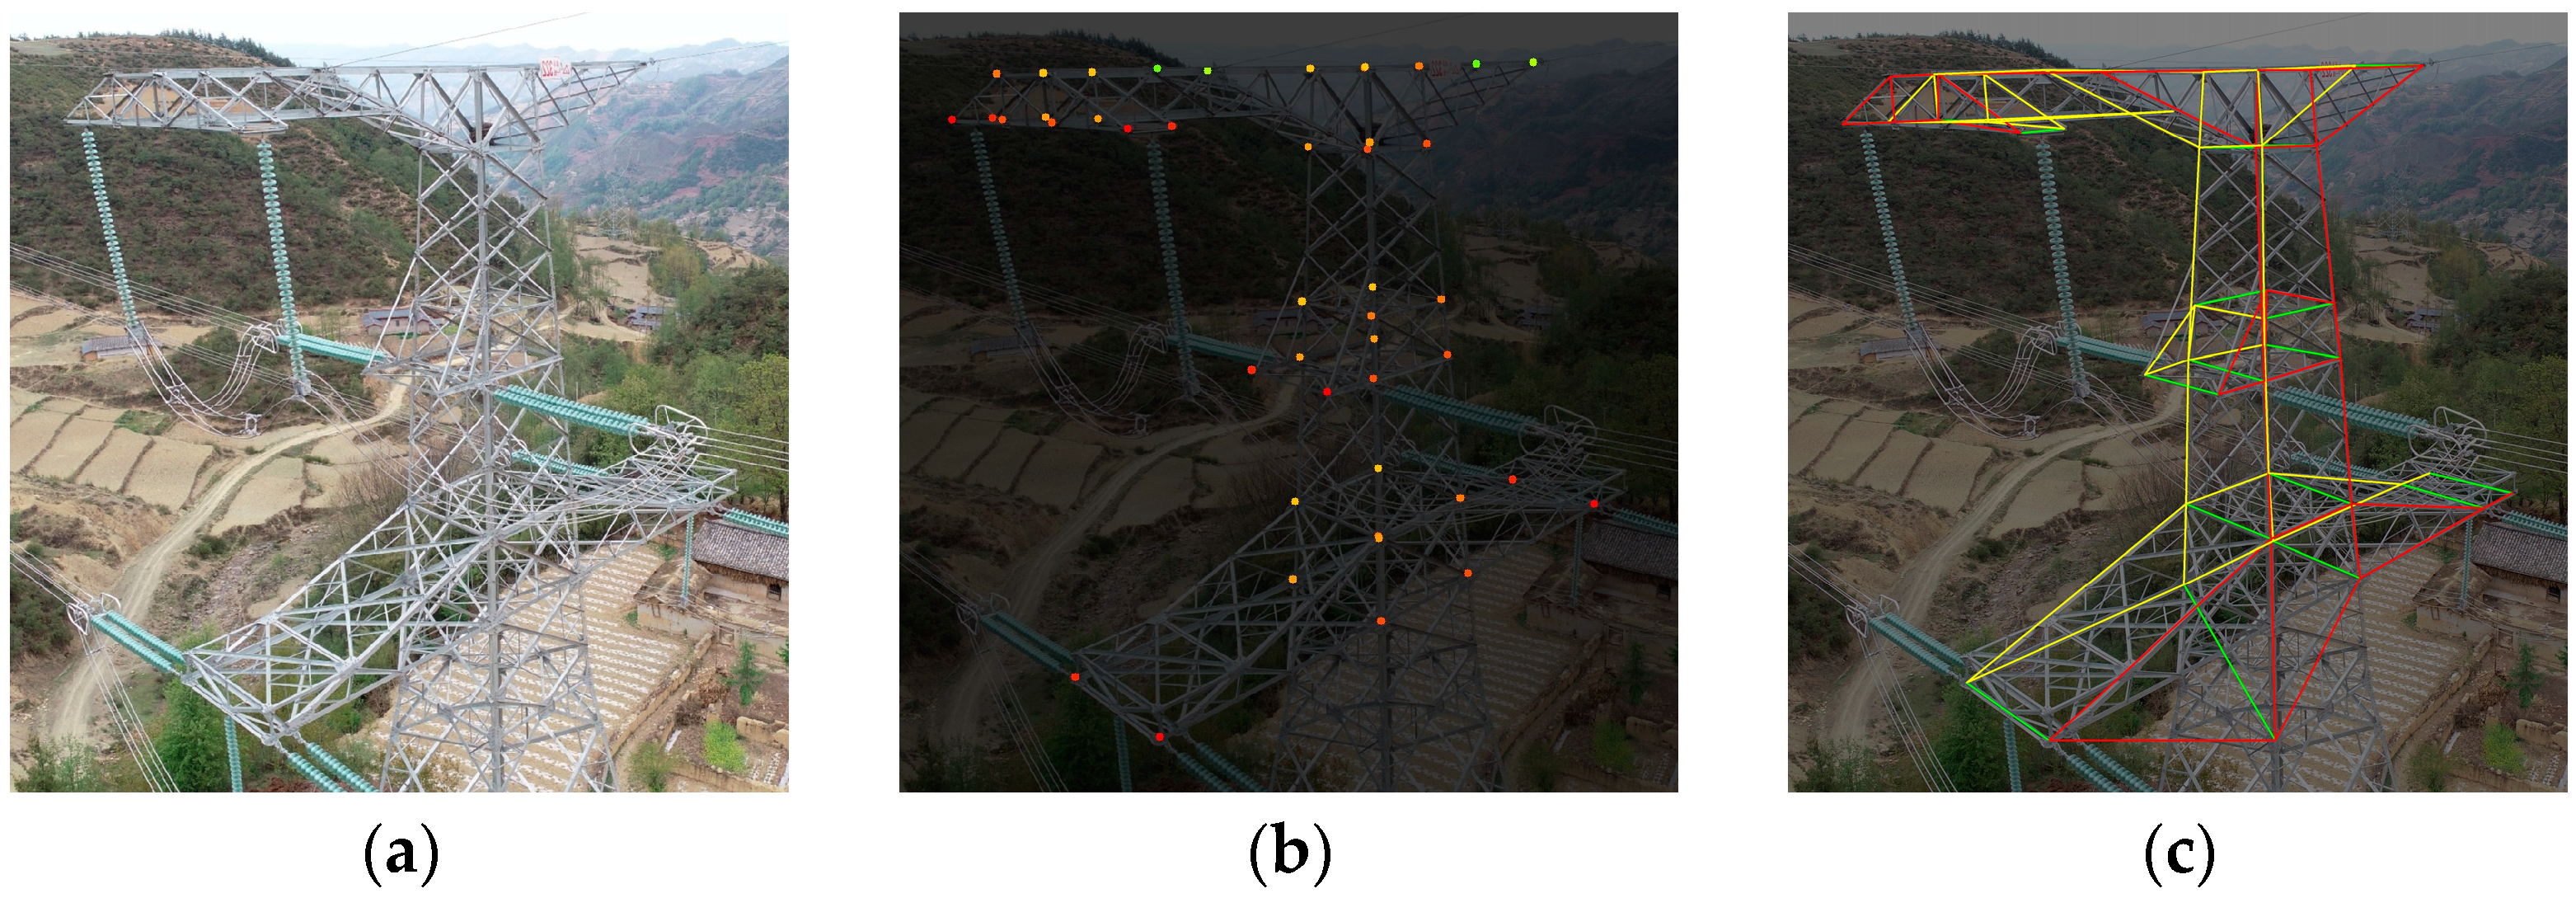
Given that this paper employs a method of initially predicting categorized keypoints and subsequently predicting the connection mode between these keypoints, it can be inferred that the predicted outcome is a set of partial structural elements specific to electrical towers. Consequently, even if an electrical tower’s structure deviates slightly from those in the dataset, as long as every component of its structure is present in the set, the proposed framework remains capable of predicting its structure under certain conditions. Figure 8 showcases an image of an electrical tower not included in the dataset but successfully predicts its structure.

5. Conclusions

The paper proposes a framework for the pose estimation of multi-type high-voltage electrical transmission towers, aiming to enhance the comprehension of towers and assist in automatically annotating shooting content during UAV inspections. The proposed electric tower pose estimation method in this paper utilizes PAFs to learn the skeleton type and Gaussian heatmaps to learn the keypoint type, both of which span multiple types of towers without instantiation, which makes the model learn the higher and uniform component types, making the set of keypoints whenever the entire set of components and keypoints of the transmission tower image is a subset of the set of keypoints of the components of the transmission tower in the training set. Instead of using specific keypoint names, categorizing keypoints are introduced to accommodate various tower structures. The issue of confusion and error-prone connections between multiple similar keypoints is resolved by leveraging the Gaussian heatmaps and PAF output. For the detection of various types of electric towers, the proposed model has an average keypoint identification AF of more than 96% and an average skeleton connection AF of more than 93% at all granularities, which is far more effective than other methods. Three-granularity outputs are established, which offer diverse practical application scenarios. The proposed framework demonstrates excellent performance on the test set, even capable of identifying electrical towers not included in the dataset, thereby providing valuable assistance for practical applications. In the future, emphasis will be placed on lightweight design and faster recognition speed.

Author Contributions

Conceptualization, Y.H. and X.F.; methodology, Y.H.; software, X.D.; validation, Z.T., Y.X. and Y.Z.; formal analysis, X.D.; investigation, Z.T.; resources, Y.H.; data curation, Y.H.; writing—original draft preparation, Y.H.; writing—review and editing, X.F.; visualization, Y.X.; supervision, Z.T.; project administration, Y.H.; funding acquisition, Y.H. All authors have read and agreed to the published version of the manuscript.

Funding

This work was supported by the Key Science and Technology Project of the State Grid Sichuan Electric Power Company (Key Technology and Application of Accurate Identification of Transmission Line Defects for Small Data Samples, No. 521947230002).

Data Availability Statement

The original contributions presented in the study are included in the article; further inquiries can be directed to the corresponding author.

Conflicts of Interest

Authors Yaoran Huo, Xu Dai, Zhenyu Tang and Yuhao Xiao were employed by the company State Grid Sichuan Electric Power Company. The remaining authors declare that the research was conducted in the absence of any commercial or financial relationships that could be construed as a potential conflict of interest.

References

  1. Forlani, G.; Dall’Asta, E.; Diotri, F.; Morra di Cella, U.; Roncella, R.; Santise, M. Quality Assessment of DSMs Produced from UAV Flights Georeferenced with On-Board RTK Positioning. Remote Sens. 2018, 10, 311. [Google Scholar] [CrossRef]
  2. Lei, X.; Sui, Z. Intelligent Fault Detection of High Voltage Line Based on the Faster R-CNN. Measurement 2019, 138, 379–385. [Google Scholar] [CrossRef]
  3. Liao, J.; Xu, H.; Fang, X.; Miao, Q.; Zhu, G. Quantitative Assessment Framework for Non-Structural Bird’s Nest Risk Information of Transmission Tower in High-Resolution UAV Images. IEEE Trans. Instrum. Meas. 2023, 72, 1–12. [Google Scholar] [CrossRef]
  4. Satheeswari, D.; Shanmugam, L.; Swaroopan, N.J. Recognition of Bird’s Nest in High Voltage Power Line Using SSD. In Proceedings of the 2022 First International Conference on Electrical, Electronics, Information and Communication Technologies (ICEEICT), Trichy, India, 16–18 February 2022; pp. 1–7. [Google Scholar]
  5. Yuan, Z.; He, L.; Wang, S.; Tu, Y.; Li, Z.; Wang, C.; Li, F. Intelligent Breakage Assessment of Composite Insulators on Overhead Transmission Lines by Ellipse Detection Based on IRHT. CSEE J. Power Energy Syst. 2022, 9, 1942–1949. [Google Scholar]
  6. Luo, B.; Xiao, J.; Zhu, G.; Fang, X.; Wang, J. Occluded Insulator Detection System Based on YOLOX of Multi-Scale Feature Fusion. IEEE Trans. Power Deliv. 2024, 39, 1063–1074. [Google Scholar] [CrossRef]
  7. Wen, J.; Shugang, L.; Wanguo, W.; Zhenli, W.; Zhenyu, L.; Xinyue, M. Defect Identification Technology for Rotate Object in Transmission Lines Based on Multi-Scale Residual Network. In Proceedings of the 2023 IEEE International Conference on Control, Electronics and Computer Technology (ICCECT), Jilin, China, 28–30 April 2023; pp. 399–403. [Google Scholar]
  8. Huang, W.; Zeng, Q.; Wu, Y.; Cai, Z.; Zhou, R.; Shang, J.; Liang, L.; Li, X. Data-Efficient Pin Defect Detection with Transformer in Transmission Lines. In Proceedings of the 2023 5th International Conference on Electronic Engineering and Informatics (EEI), Wuhan, China, 30 June–2 July 2023; pp. 41–44. [Google Scholar]
  9. Xiao, Y.; Li, Z.; Zhang, D.; Teng, L. Detection of Pin Defects in Aerial Images Based on Cascaded Convolutional Neural Network. IEEE Access 2021, 9, 73071–73082. [Google Scholar] [CrossRef]
  10. Zhu, G.; Zhang, W.; Wang, M.; Wang, J.; Fang, X. Corner Guided Instance Segmentation Network for Power Lines and Transmission Towers Detection. Expert Syst. Appl. 2023, 234, 121087. [Google Scholar] [CrossRef]
  11. Abdelfattah, R.; Wang, X.; Wang, S. Ttpla: An Aerial-Image Dataset for Detection and Segmentation of Transmission Towers and Power Lines. In Proceedings of the Asian Conference on Computer Vision, Virtual, 30 November–4 December 2020. [Google Scholar]
  12. Zhou, J.; Liu, G.; Gu, Y.; Wen, Y.; Chen, S. A Box-Supervised Instance Segmentation Method for Insulator Infrared Images Based on Shuffle Polarized Self-Attention. IEEE Trans. Instrum. Meas. 2023, 72, 5026111. [Google Scholar] [CrossRef]
  13. Wang, B.; Dong, M.; Ren, M.; Wu, Z.; Guo, C.; Zhuang, T.; Pischler, O.; Xie, J. Automatic Fault Diagnosis of Infrared Insulator Images Based on Image Instance Segmentation and Temperature Analysis. IEEE Trans. Instrum. Meas. 2020, 69, 5345–5355. [Google Scholar] [CrossRef]
  14. Zhu, Z.; Hou, J.; Wu, D.O. Cross-Modal Orthogonal High-Rank Augmentation for Rgb-Event Transformer-Trackers. In Proceedings of the IEEE/CVF International Conference on Computer Vision, Paris, France, 2–6 October 2023; pp. 22045–22055. [Google Scholar]
  15. Toshev, A.; Szegedy, C. Deeppose: Human Pose Estimation via Deep Neural Networks. In Proceedings of the IEEE Conference on Computer Vision and Pattern Recognition, Columbus, OH, USA, 23–28 June 2014; pp. 1653–1660. [Google Scholar]
  16. Wei, S.-E.; Ramakrishna, V.; Kanade, T.; Sheikh, Y. Convolutional Pose Machines. In Proceedings of the IEEE Conference on Computer Vision and Pattern Recognition, Las Vegas, NV, USA, 27–30 June 2016; pp. 4724–4732. [Google Scholar]
  17. Xu, T.; Takano, W. Graph Stacked Hourglass Networks for 3d Human Pose Estimation. In Proceedings of the IEEE/CVF Conference on Computer Vision and Pattern Recognition, Nashville, TN, USA, 20–25 June 2021; pp. 16105–16114. [Google Scholar]
  18. Xiao, B.; Wu, H.; Wei, Y. Simple Baselines for Human Pose Estimation and Tracking. In Proceedings of the European Conference on Computer Vision (ECCV), Munich, Germany, 8–14 September 2018; pp. 466–481. [Google Scholar]
  19. Wang, J.; Sun, K.; Cheng, T.; Jiang, B.; Deng, C.; Zhao, Y.; Liu, D.; Mu, Y.; Tan, M.; Wang, X.; et al. Deep High-Resolution Representation Learning for Visual Recognition. IEEE Trans. Pattern Anal. Mach. Intell. 2020, 43, 3349–3364. [Google Scholar] [CrossRef]
  20. Simon, T.; Joo, H.; Matthews, I.; Sheikh, Y. Hand Keypoint Detection in Single Images Using Multiview Bootstrapping. In Proceedings of the IEEE Conference on Computer Vision and Pattern Recognition, Honolulu, HI, USA, 21–26 July 2017; pp. 1145–1153. [Google Scholar]
  21. Zhou, H.; Hadap, S.; Sunkavalli, K.; Jacobs, D.W. Deep Single-Image Portrait Relighting. In Proceedings of the IEEE/CVF International Conference on Computer Vision, Seoul, Republic of Korea, 27 October–2 November 2019; pp. 7194–7202. [Google Scholar]
  22. Ng, X.L.; Ong, K.E.; Zheng, Q.; Ni, Y.; Yeo, S.Y.; Liu, J. Animal Kingdom: A Large and Diverse Dataset for Animal Behavior Understanding. In Proceedings of the IEEE/CVF Conference on Computer Vision and Pattern Recognition, New Orleans, LA, USA, 18–24 June 2022; pp. 19023–19034. [Google Scholar]
  23. Cao, J.; Tang, H.; Fang, H.-S.; Shen, X.; Lu, C.; Tai, Y.-W. Cross-Domain Adaptation for Animal Pose Estimation. In Proceedings of the IEEE/CVF International Conference on Computer Vision, Seoul, Republic of Korea, 27 October–2 November 2019; pp. 9498–9507. [Google Scholar]
  24. Mathis, A.; Biasi, T.; Schneider, S.; Yuksekgonul, M.; Rogers, B.; Bethge, M.; Mathis, M.W. Pretraining Boosts Out-of-Domain Robustness for Pose Estimation. In Proceedings of the IEEE/CVF Winter Conference on Applications of Computer Vision, Virtual, 5–9 January 2021; pp. 1859–1868. [Google Scholar]
  25. Stojanović, N.; Pantić, V.; Damjanović, V.; Vukmirović, S. 3D Vehicle Pose Estimation from an Image Using Geometry. In Proceedings of the 2022 21st International Symposium INFOTEH-JAHORINA (INFOTEH), East Sarajevo, Bosnia and Herzegovina, 16–18 March 2022; pp. 1–6. [Google Scholar]
  26. Chabot, F.; Chaouch, M.; Rabarisoa, J.; Teulière, C.; Chateau, T. Accurate 3D Car Pose Estimation. In Proceedings of the 2016 IEEE International Conference on Image Processing (ICIP), Phoenix, AZ, USA, 25–28 September 2016; pp. 3807–3811. [Google Scholar]
  27. Khan, S.U.; Khan, Z.U.; Alkhowaiter, M.; Khan, J.; Ullah, S. Energy-Efficient Routing Protocols for UWSNs: A Comprehensive Review of Taxonomy, Challenges, Opportunities, Future Research Directions, and Machine Learning Perspectives. J. King Saud Univ. Comput. Inf. Sci. 2024, 36, 102128. [Google Scholar]
  28. Gang, Q.; Muhammad, A.; Khan, Z.U.; Khan, M.S.; Ahmed, F.; Ahmad, J. Machine Learning-Based Prediction of Node Localization Accuracy in IIoT-Based MI-UWSNs and Design of a TD Coil for Omnidirectional Communication. Sustainability 2022, 14, 9683. [Google Scholar] [CrossRef]
  29. Cao, Z.; Simon, T.; Wei, S.-E.; Sheikh, Y. Realtime Multi-Person 2d Pose Estimation Using Part Affinity Fields. In Proceedings of the IEEE Conference on Computer Vision and Pattern Recognition, Honolulu, HI, USA, 21–26 July 2017; pp. 7291–7299. [Google Scholar]
  30. Xu, L.; Jin, S.; Zeng, W.; Liu, W.; Qian, C.; Ouyang, W.; Luo, P.; Wang, X. Pose for Everything: Towards Category-Agnostic Pose Estimation. In Proceedings of the European Conference on Computer Vision, Tel Aviv, Israel, 23–27 October 2022; pp. 398–416. [Google Scholar]
  31. He, K.; Zhang, X.; Ren, S.; Sun, J. Deep Residual Learning for Image Recognition. In Proceedings of the IEEE Conference on Computer Vision and Pattern Recognition, Las Vegas, NV, USA, 27–30 June 2016; pp. 770–778. [Google Scholar]
  32. Wang, Y.; Yang, M.; Zhang, Y.; Xu, Z.; Huang, J.; Fang, X. A Bearing Fault Diagnosis Model Based on Deformable Atrous Convolution and Squeeze-and-Excitation Aggregation. IEEE Trans. Instrum. Meas. 2021, 70, 1–10. [Google Scholar] [CrossRef]
  33. Caesar, H.; Uijlings, J.; Ferrari, V. Coco-Stuff: Thing and Stuff Classes in Context. In Proceedings of the IEEE Conference on Computer Vision and Pattern Recognition, Salt Lake City, UT, USA, 18–23 June 2018; pp. 1209–1218. [Google Scholar]
  34. Andriluka, M.; Pishchulin, L.; Gehler, P.; Schiele, B. 2d Human Pose Estimation: New Benchmark and State of the Art Analysis. In Proceedings of the IEEE Conference on Computer Vision and Pattern Recognition, Columbus, OH, USA, 23–28 June 2014; pp. 3686–3693. [Google Scholar]
  35. Geng, Z.; Wang, C.; Wei, Y.; Liu, Z.; Li, H.; Hu, H. Human Pose as Compositional Tokens. In Proceedings of the IEEE/CVF Conference on Computer Vision and Pattern Recognition, Vancouver, BC, Canada, 17–24 June 2023; pp. 660–671. [Google Scholar]
  36. Bulat, A.; Kossaifi, J.; Tzimiropoulos, G.; Pantic, M. Toward Fast and Accurate Human Pose Estimation via Soft-Gated Skip Connections. In Proceedings of the 2020 15th IEEE international conference on automatic face and gesture recognition (FG 2020), Buenos Aires, Argentina, 16–20 November 2020; pp. 8–15. [Google Scholar]
  37. Su, Z.; Ye, M.; Zhang, G.; Dai, L.; Sheng, J. Cascade Feature Aggregation for Human Pose Estimation. arXiv 2019, arXiv:1902.07837. [Google Scholar]
  38. Yang, S.; Quan, Z.; Nie, M.; Yang, W. Transpose: Keypoint Localization via Transformer. In Proceedings of the IEEE/CVF International Conference on Computer Vision, Montreal, BC, Canada, 11–17 October 2021; pp. 11802–11812. [Google Scholar]
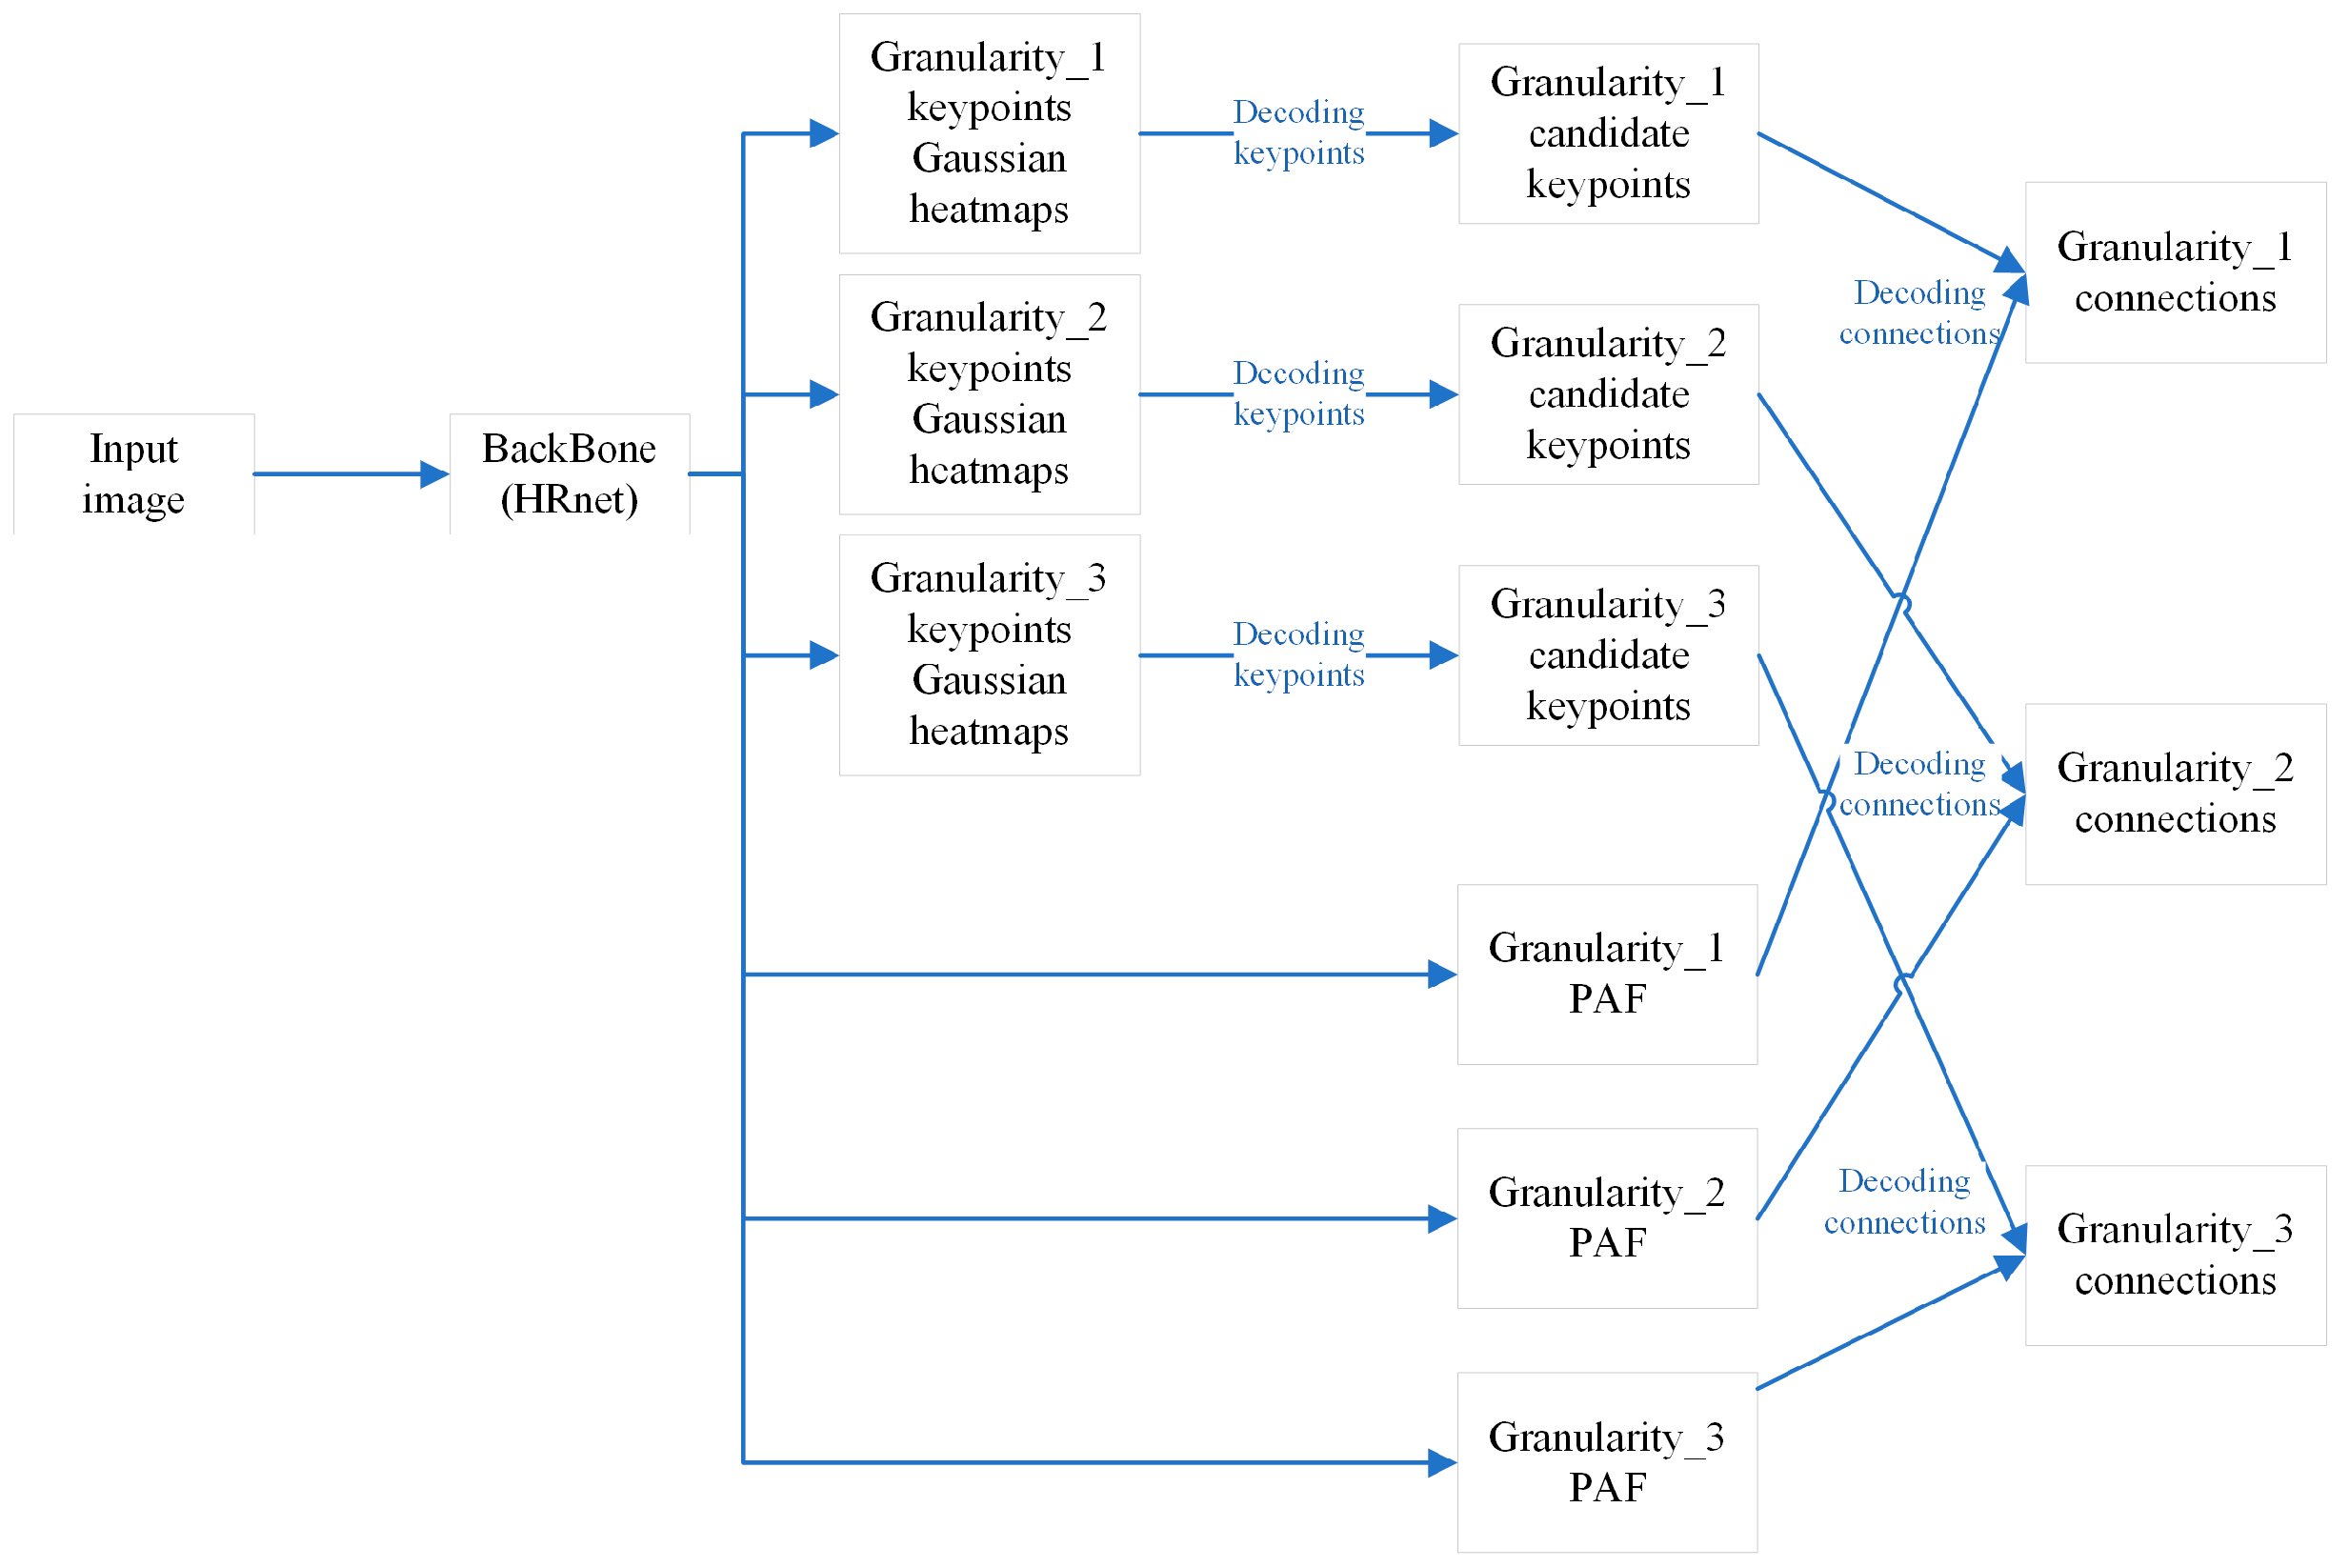
Figure 1. The simplified schematic of the proposed method.
Energies 18 00488 g001
Figure 2. Various types of towers and three-granularity annotations: (a) original image; (b) Granularity-1; (c) Granularity-2; (d) Granularity-3. To enhance the visibility of the skeleton, the original figure has been rendered in black. Distinct skeletons are represented by different colors to demonstrate their variations, while arrows indicate the direction of each skeleton. The images from top to bottom are the drum tower, sheep horn tower, zigzag tower, wine-glass-1 tower, wine-glass-2 tower, UE-1 tower, and UE-2 tower, respectively.
Energies 18 00488 g002aEnergies 18 00488 g002b
Figure 3. The heatmaps of keypoints on the electrical tower cross arm, along with the ground truth of the connected vector affinity field: (a) targets of Granularity-1; (b) targets of Granularity-2; (c) targets of Granularity-3. The image has undergone preprocessing by the data loader, resulting in skewness and black edges. The X-axis is oriented horizontally to the right, while the Y-axis is oriented vertically downwards. Th red color indicates positive values, the green color indicates negative values, and brighter colors indicate larger values. Consequently, for certain connections that exhibit a partial inclination towards horizontal orientation, the y-component plot of the vector field may appear almost colorless.
Energies 18 00488 g003
Figure 4. The structure of HRNet.
Energies 18 00488 g004
Figure 5. The structure of the network’s neck.
Energies 18 00488 g005
Figure 6. Samples of keypoint prediction results on test set: (a) original images; (b) predicted keypoints; (c) predicted connections in reference [4]. The different colors represent different types of keypoints or connections. In (c), the connections are shown to show off the wrong and confused keypoints.
Energies 18 00488 g006aEnergies 18 00488 g006b
Figure 7. Samples of prediction results on test set.
Energies 18 00488 g007
Figure 8. Samples of prediction results of the towers not included in dataset: (a) original images; (b) predicted keypoints; (c) predicted connections and practical application scenarios. The proposed framework demonstrates excellent performance on the test set, even capable of identifying electrical towers not included in the dataset, thereby providing valuable assistance for practical applications. In the future, emphasis will be placed on lightweight design and faster recognition speed.
Energies 18 00488 g008
Table 1. Dataset Information.
Tower TypeNumber of
Images
Number of
Partial Images
Granularity-1Granularity-2Granularity-3
Number of
Keypoints
Number of
Connections
Number of
Keypoints
Number of
Connections
Number of
Keypoints
Number of
Connections
Drum Tower1396461211162348100
Sheep Horn Tower245473131018214892
Zigzag Tower148413111015224698
Wine-Glass-1 Tower438\769112654
Wine-Glass-2 Tower173\769112654
UE-1 Tower142\1211162348100
UE-2 Tower100\111014204694
Table 2. Performance of predicting keypoint on test set with different OKS thresholds.
OKS
Threshold
AP1AR1AF1AP2AR2AF2AP3AR3AF3
0.50.99790.99690.99740.99270.98130.98700.96080.97190.9663
0.750.99610.99510.99560.98710.97570.98140.87120.88140.8763
Table 3. Performance predicting connections on test set with different OKS thresholds.
OKS ThresholdAP_CNAR_CNAF_CN
0.50.93800.92280.9304
0.750.80490.79180.7983
Table 4. Performance on test set of different types of electrical towers.
Tower TypeAP1AR1AF1AP2AR2AF2AP3AR3AF3AP_
CN
AR_
CN
AF_
CN
Drum Tower0.99690.99760.99730.99590.99000.99290.96380.97490.96930.94340.94800.9457
Sheep Horn Tower1.00001.00001.00000.98630.98630.98630.99120.99740.99430.98750.99040.9890
Zigzag Tower0.99520.99040.99280.99020.97190.98100.91580.93810.92690.88880.87300.8808
Wine-Glass-1 Tower1.00001.00001.00000.99620.99230.99420.98940.99290.99120.98570.96700.9763
Wine-Glass-2 Tower1.00001.00001.00001.00000.99670.99840.96520.97170.96840.94630.90200.9236
UE-1 Tower1.00001.00001.00000.99410.99700.99550.89360.89190.89280.84070.74380.7893
UE-2 Tower1.00001.00001.00001.00000.99660.99830.89790.90990.90390.84430.76650.8035
Table 5. Comparison with other state-of-the-art methods.
MethodsAF_0.5AF_0.75AF_CN_0.5AF_CN_0.75
PCT0.94190.81230.88320.7020
Soft-gated Skip Connections0.93230.80100.87640.6910
Cascade Feature Aggregation0.93100.78880.88410.6902
TransPose0.92520.76150.86320.6606
Ours0.96630.87630.93040.7983
Table 6. Performance of the proposed method for ablation experiment.
MethodsAF_0.5AF_0.75AF_CN_0.5AF_CN_0.75
HRNetThree Granularity with PAFIntermediate Supervision
0.92150.78530.87380.6836
0.94590.84510.91270.7544
0.96630.87630.93040.7983
Disclaimer/Publisher’s Note: The statements, opinions and data contained in all publications are solely those of the individual author(s) and contributor(s) and not of MDPI and/or the editor(s). MDPI and/or the editor(s) disclaim responsibility for any injury to people or property resulting from any ideas, methods, instructions or products referred to in the content.