Article

Hydrocarbon Generation Potential and Molecular Composition of Eocene Guchengzi Formation Coals and Carbonaceous Mudstones from the Fushun Basin, NE China

1
China Petroleum Engineering & Construction Corporation, Beijing 100120, China
2
School of Geosciences, Yangtze University, Wuhan 430100, China
3
School of Energy Resource, China University of Geosciences, Beijing 100083, China
4
Department of Geoscience, University of Calgary, Calgary, AB T2N 1N4, Canada
5
State Key Laboratory of Petroleum Resources & Prospecting, China University of Petroleum (Beijing), Beijing 102249, China
*
Author to whom correspondence should be addressed.
Energies 2025, 18(3), 519; https://doi.org/10.3390/en18030519
Submission received: 18 December 2024 / Revised: 17 January 2025 / Accepted: 22 January 2025 / Published: 23 January 2025
(This article belongs to the Section H: Geo-Energy)

Abstract

:
A coal seam from the Fushun Basin in NE China was investigated pertaining to its bulk and molecular compositions to elucidate its hydrocarbon generation potential. Eocene Guchengzi Formation coals and carbonaceous mudstones were deposited in oxic environments and fell within the subbituminous A rank. Hydrogen index (HI) values spanned within a range from 139 to 495 mg HC/g total organic carbon (TOC), indicating the presence of Type II2-III kerogens. The pyrolytic hydrocarbon yield (S2) linearly increased with TOC content in carbonaceous mudstones, while there was no evident correlation between S2 and TOC in the coals. Molecular compositions revealed that the input of algae and aquatic biomass did not enhance the hydrocarbon generation potential of the coals. Moreover, the hydrocarbon generation potential of the coals was not influenced by changes in flora. However, the degree of terpenoid aromatization showed a clear correlation with the HI values. A higher hydrocarbon generation potential is associated with a lower degree of aromatization, even though the Pristane/Phytane ratio does not indicate such a correlation. Bacterial transformation played a pivotal role in the structural rearrangement of the coal matrix, resulting in hydrogen incorporation into the coal. This ultimately led to a relatively hydrogen-rich composition with high oil-generating potential.

1. Introduction

Coal beds play a significant role in petroleum exploration [1]. Notable examples include the Gippsland and Bass Basins in Australia [2], the Taranaki Basin in New Zealand [3], the Guasare Basin in Venezuela [4], the Turpan–Hami Basin in NW China [5], the Upper Paleozoic source rocks in Western Henan, China [6], the Mahakam Delta in Indonesia [7], and regions in Peninsular Malaysia, Myanmar, and Vietnam in Southeast Asia [8,9]. These coal-rich basins are source rocks for hydrocarbon accumulation.
The capacity of humic coals to generate liquid oil is governed by maceral compositions and deposition conditions [10]. Assessing source rock properties and their potential for oil generation in coal-rich areas presents a multifaceted challenge, given that coal is commonly viewed as a source rock for natural gas [11]. Crucially, the availability of hydrogen is the key to oil production and expulsion, requiring higher Hydrogen Index values [HI > 200 mg HC/g total organic carbon (TOC)]. When HI values surpass 300 mg HC/g TOC, a significant quantity of oil can be generated [12,13]. Meeting this requirement hinges on the presence of liptinite macerals, especially in humic coals with liptinite contents exceeding 10–15%. This criterion is essential for identifying coals with the potential for oil generation [14,15]. However, it is worth noting that liptinite content alone does not fully explain the variations observed in HI values [16]. Hence, it is essential to thoroughly understand the interplay between plant compositions, deposition conditions, hydrogen availability, and liptinite content to accurately assess source rock properties and their capacity for hydrocarbon generation in coal.
Coal possesses significant potential for hydrocarbon generation, with a negative correlation between total organic carbon (TOC) and the Hydrogen Index (HI), and a notable correlation between S2 and HI [17]. For the precise assessment of hydrocarbon potential, it is recommended to calibrate the maximum HI values with vitrinite reflectance (Ro) [1,16,18]. However, exploring the intricate relationship between HI and coal rank is challenging due to significant reflectance suppressions, leading to a substantial underestimation of their actual thermal maturity [15,19]. This highlights the need for an understanding of the characteristics of humic coals across various maturation stages when evaluating their genuine hydrocarbon potential.
Bacterial alterations modify the composition of organic matter, primarily involving the decomposition of organic matter [3,20]. However, the impact of these processes on the potential for hydrocarbon generation has received limited attention. This is largely because previous studies [11,13,17] have dealt with samples that reflect an interplay of multiple factors, including variations in plant communities, depositional environments, and degrees of coalification. Furthermore, samples have originated from various coal seams or basins, making it challenging to isolate the specific influence of microbial processes [21]. To enhance our understanding of the potential of oil generation from coal seams, it is essential to perform detailed sample characterizations with a high level of resolution, concentrating on specific influential factors. The molecular compositions found in coaly sediments, originating from ancient plant and microbial remnants, provide insights into vegetation sources, past climates, depositional environments, preservation conditions, and microbial processes [22,23].
The Fushun Basin in northeastern China is recognized for its abundant coal deposits. Previous research has explored coal metamorphism, tectonics, paleoclimatic variations, palynology, paleobotany, and depositional environments [24,25,26,27]. Petrological studies have shown that there has been no significant alteration in biomass input across the entire coal sequence [26]. However, from pollen investigations, it is intriguing to note the replacement of taxodioid conifers by Pinaceae conifers and Aquilapollenites during the Early Eocene [27]. Nevertheless, the oil generation potential of this coal basin has been largely overlooked, primarily because of its shallow burial depth, with most of the strata not reaching the oil generation zone.
In our study, an analysis of extractable organic matter from the open mining operation section of the Eocene Guchengzi Formation coal seam was conducted. The primary focus was on establishing the links between molecular compositions and the potential for hydrocarbon generation within the coal seams. This study aimed to uncover the primary factors driving changes in HI values and to understand the potential for hydrocarbon generation. It involved analyzing the molecular compositions of coal deposits to evaluate their composition, source inputs, and microbial alteration. By comprehending coal geochemistry, researchers can pinpoint the conditions required for hydrocarbon formation and provide guidance for exploration and exploitation endeavors in coal-rich areas.

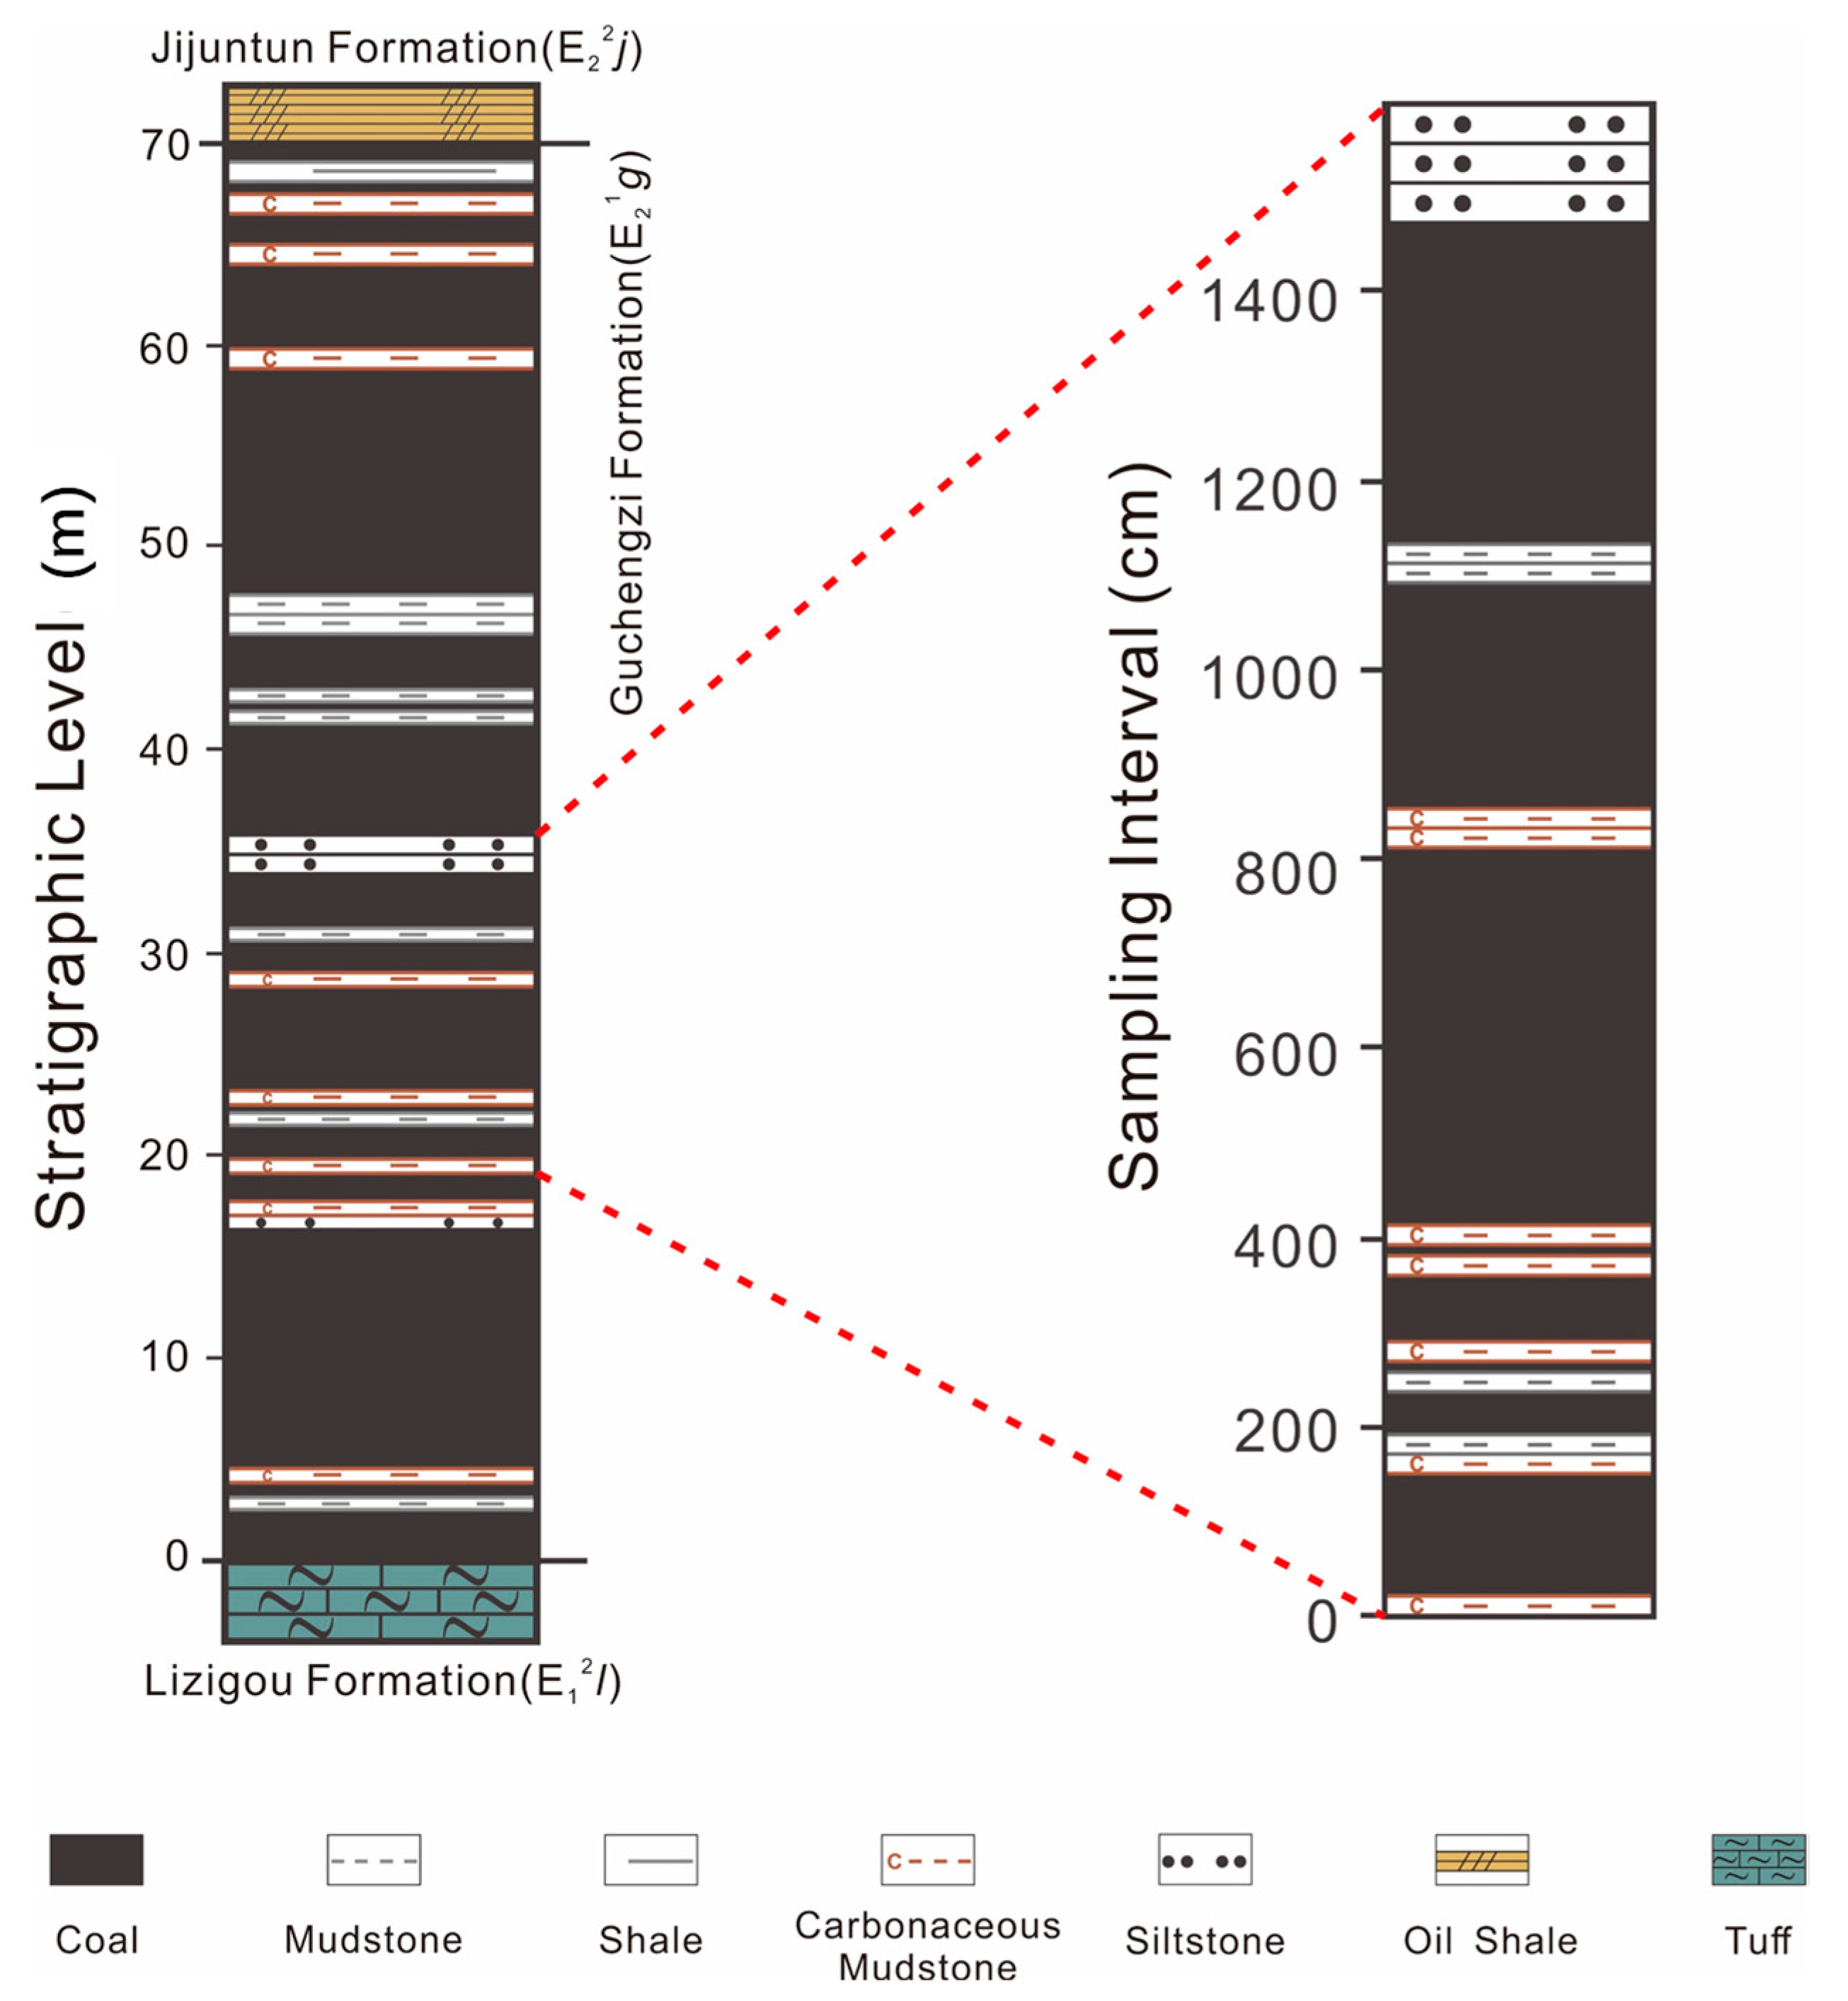
2. Geological Setting

The Fushun Basin is a terrestrial basin located along the Dunhua–Mishan (DunMi) Fault Zone (Figure 1). The basin is underlain by Proterozoic gneiss, overlain by Cretaceous sedimentary rocks. Stratigraphically, the basin includes (from bottom to top): the Paleocene Laohutai and Lizigou Formations, the Lower Eocene Guchengzi Formation, the Middle Eocene Jijuntun and Xilutian Formations, and the Upper Eocene Gengjiajie Formation. Coal deposition occurred primarily during the Paleocene and Lower Eocene, and the investigated coal seam is located in the Guchengzi Formation, while thinner coal deposits are found in the Laohutai and Lizigou Formations.
The Paleocene Laohutai Formation (8–233 m thick) unconformably overlies dark basalt, shales, and carbonaceous mudstone. Its deposition was driven by slow uplift, peat accumulation, and volcanic activity, culminating in massive basalt flows. The overlying Lizigou Formation (0.5–4 m thick) disconformably rests on the Laohutai Formation. It comprises gray-green tuff interbedded with thin coal seams containing silicified wood, reflecting a transition from fluvial to swampy environments, ending with tuff deposition.
The Lower Eocene Guchengzi Formation (20–145 m thick) is characterized by thick coal seams interbedded with carbonaceous shale, mudstone, sandstone, and conglomerate, representing a swamp environment during early basin transgression. The PETM event is identified in the middle of this formation, with vitrinite reflectance indicating coal ranks ranging from sub-bituminous to high volatile bituminous A.
The Middle Eocene Jijuntun Formation (60–300 m thick) comprises thick oil shale with interbedded carbonaceous shale and mudstone. The upper section contains high-quality dark brown oil shale (TOC ~10 wt%), while the lower section has lighter shale (TOC ≤ 20 wt%), deposited in a rapidly subsiding freshwater lake. Plant fossils suggest climate shifts from moist to arid, affecting drainage and salinity. The Xilutian Formation (up to 600 m thick, avg. 420 m) consists of green dolomitic mudstones and marlstones, formed in a contracting shallow lake with hypersaline conditions due to regional uplift and climate change.
Finally, the Upper Eocene Gengjiajie Formation (111–338 m thick) contains interbedded brown mudstone, thin sandstone, and green mudstones. It is less studied but represents the latest stage in the basin’s stratigraphic sequence [24,25,28].
Coal accumulation commenced during the early lake transgressive stage of the basin’s evolution [24]. Within the Guchengzi Formation, there is a variability in total thickness, from 20 to 145 m [24]. This formation includes interbedded layers of carbonaceous mudstone, mudstone, sandstone, and conglomerate [24,25,28]. The formation of the coal seam is attributed to the accumulation of a mix of allochthonous and minor allochthonous peat in a lacustrine environment, influenced by river and storm activities [24]. Strobl et al. [26] categorized the Guchengzi Formation coal seam into high-ash coal, carbonaceous mudstone, low-ash coal, and a transitional zone between coal and shale from the base to the top. The analyzed samples come from the lower section of the seam, where coal samples with relatively high ash content suggest a low-lying mire [26]. The coaly shale may have originated from a fluvio-lacustrine setting [26]. The sulfur content in the coal is low, indicating freshwater conditions [29]. A distinctive characteristic of Fushun coal is its notably high amber content [26]. The coal rank within the Guchengzi Formation varies, with maturity levels ranging from the sub-bituminous stage at approximately 0.5% Ro to the high volatile bituminous A stage, around 0.9% Ro [24].

3. Samples and Methods

3.1. Samples

The Guchengzi Formation, located at the East Open Pit mining site (41°50′33.4″ N, 123°53′14.3″ E), has a thickness of approximately 70 m (Figure 2). The lithology of the collected samples comprises coal and carbonaceous mudstone. A total of 112 samples were collected along a vertical profile through a 14-m section. Each sample covered an interval of approximately 10 cm.

3.2. Methods

Crushed samples, varying in weight from 15 to 30 mg, underwent pyrolysis within a VINCI Rock-Eval 6 apparatus. Pyrolysis involved heating the sample to 300 °C for 3 min, resulting in the release of free hydrocarbons, quantified as S1 (measured in milligrams of hydrocarbon per gram of rock, mg HC/g rock). Subsequently, pyrolyzable hydrocarbons were generated during the pyrolysis process conducted from 300 to 650 °C at a heating rate of 25 °C/min, quantified as S2 (measured in mg HC/g rock). Additionally, the release of CO2 during pyrolysis in the temperature range of 300 to 400 °C was quantified as S3 (measured in mg CO2/g rock). The Tmax value in degrees Celsius is the temperature at the maximum S2 peak (Tpeak). The calculation of TOC was accomplished by summing the fractions of carbon that underwent pyrolysis (PC) and the residual carbon (RC) fractions. The PC is determined by analyzing the hydrocarbon compounds released in peaks S1 and S2, as well as the carbon monoxide (CO) released during pyrolysis up to 500 °C (S3a’ peak) and the carbon dioxide (CO2) released during pyrolysis up to 400 °C (S3a peak). The RC is derived by adding up the organic carbon oxidized into carbon monoxide (CO) (S4′ peak) and carbon dioxide (CO2) up to 650 °C (S4 peak). At temperatures beyond this point, carbon monoxide production ceases, and any remaining carbon dioxide typically originates from the decomposition of carbonates. The HI represents the amount of organic matter cracked from S2 in relation to the TOC, expressed as mg HC/g TOC. The Oxygen Index (OI) represents the quantity of carbon dioxide released from S3 in relation to the TOC, measured in mg CO2/g TOC. The inorganic carbon (MinC) quantity is determined by summing up the CO2 emissions during pyrolysis above 400 °C and the CO2 produced from carbonate decomposition in the oxidation phase spanning from 650 °C to 850 °C [30].
Using a Soxhlet extraction apparatus with a dichloromethane and methanol mixture (93:7, v/v), soluble organic matter (SOM) was obtained from the crushed sample. Approximately 50 mg of SOM was utilized for subsequent analysis. Initially, a mixed internal standard including cholestane-d4, adamantane-d16, and phenyldodecane-d30 for the saturated hydrocarbon fraction and d8-naphthalene, d10-phenanthrene, and 1,1′-binaphthyl for the aromatic hydrocarbon fraction was introduced. Subsequently, the material was transferred to an Isolate Florisil solid-phase extraction cartridge. It underwent partitioning into hydrocarbon and non-hydrocarbon fractions through sequential elution with hexane and dichloromethane. The hydrocarbon fraction was further divided into saturated and aromatic hydrocarbon fractions using a small-scale column (pipette) liquid chromatography method.
The saturated and aromatic fractions underwent analysis using GC-MS, employing an Agilent 7890B gas chromatograph manufactured by Agilent Technologies in Santa Clara, CA, USA connected to an Agilent 5977A mass-selective detector. The chromatographic separation occurred using an HP-5MS fused silica capillary column (60 m long, 0.32 mm in internal diameter, and coated with a 0.25 μm film thickness). The GC column temperature was programmed to start at 40 °C for 5 min and then ramped up to 325 °C at a rate of 4 °C/min, holding at 325 °C for 15 min. Helium was used as the carrier gas with a flow rate of 1.0 mL/min. Both the injector and mass spectrometry interface temperatures were maintained at 250 °C. The ion source operated in electron ionization mode at 70 eV, using selected ion monitoring and full scan mode (SIM/SCAN). The full scan mass spectrum covers 40–600 mass units. To ensure the quality of the analysis, standard oil, blank, and duplicate samples were included. Compound identification was based on comparisons of mass spectra, standard retention indices, and the published literature. Concentration calculations were derived from the peak area against internal standards, without response factor calibration.

4. Results

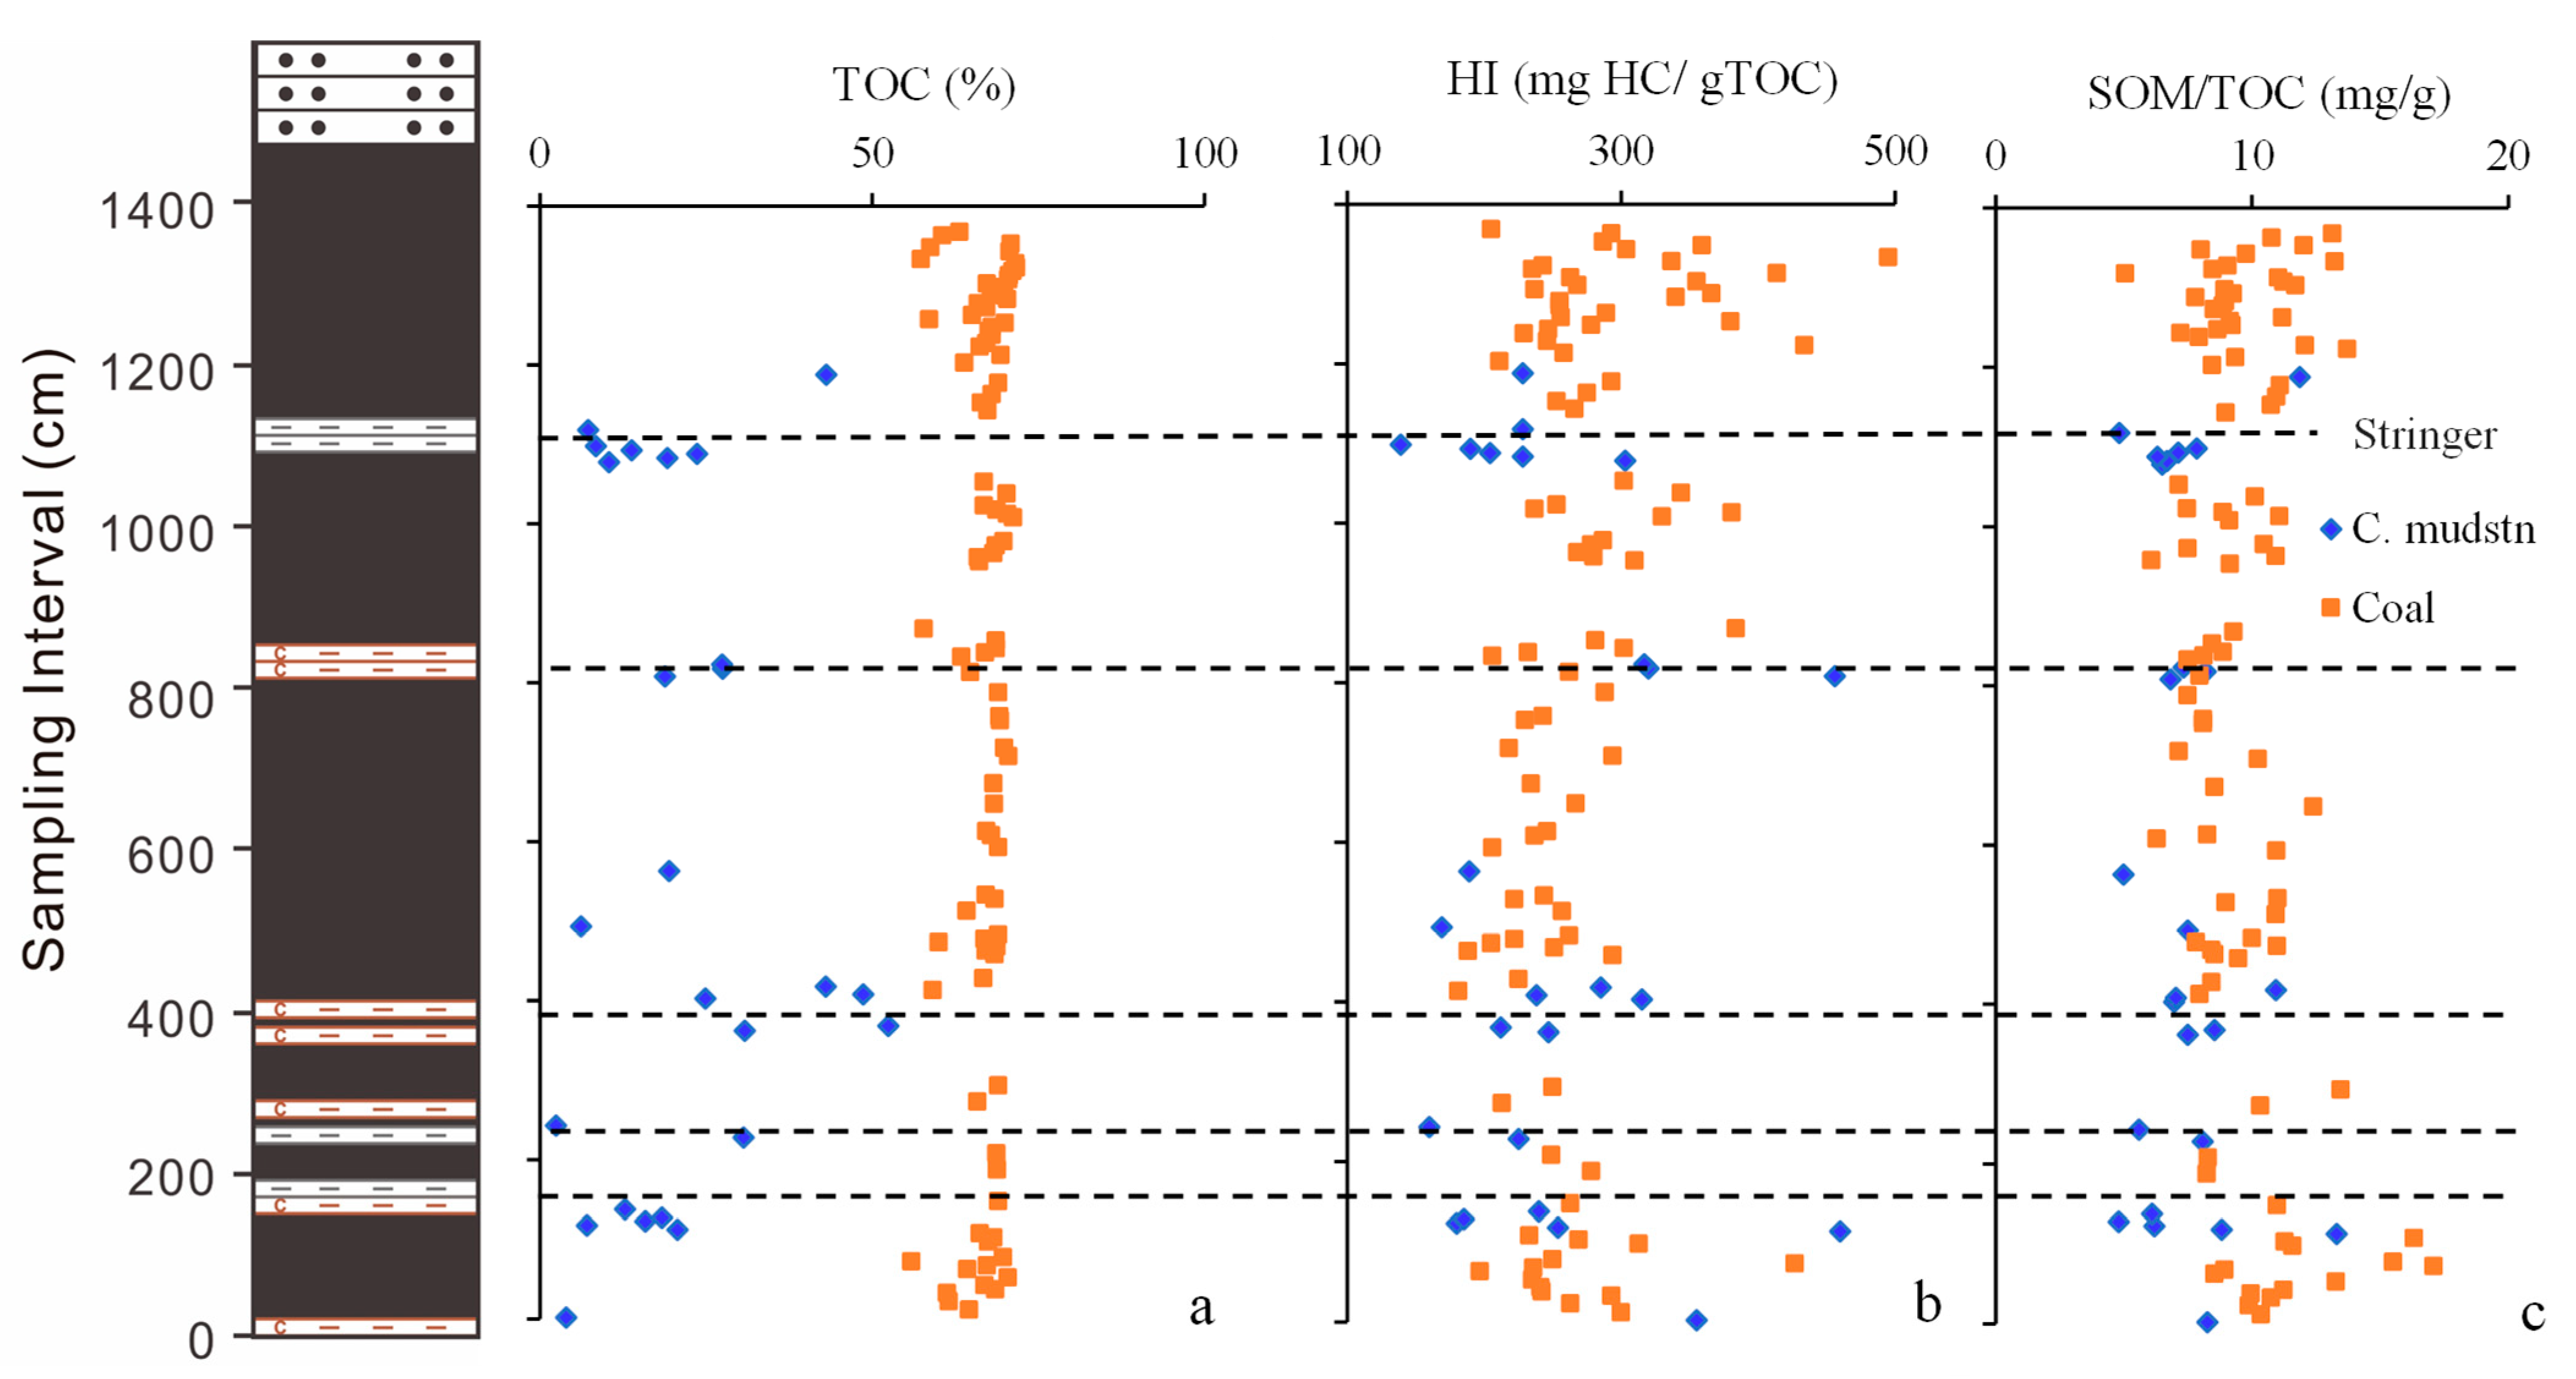
4.1. Bulk Composition

The TOC content spanned from 2.4 to 71.2 wt%. The samples were categorized into two groups based on a TOC cutoff of 55 wt%. This categorization was established by considering the minimum carbon content of 50 wt% for lignite and 60 wt% for bituminous coal, owing to their low maturity levels. A total of 87 coal samples displayed a TOC content ranging from 55.9 to 71.2 wt%, and 25 carbonaceous mudstone samples exhibited a TOC content within the range of 2.4 to 52.4 wt% (see Appendix A for details) (Figure 3a). Within the carbonaceous mudstone samples, HI values spanned within the range from 139 to 460 mg HC/g TOC. The coal samples displayed HI values ranging from 181 to 495 mg HC/g TOC (see Appendix A for details) (Figure 3b). Carbonaceous mudstones displayed SOM yields within the range from 4.8 to 11.8 mg/g TOC. Coal samples exhibited SOM yields ranging from 5.0 to 17.1 mg/g TOC (Figure 3c). The vitrinite reflectance measured at the sample site was approximately 0.5%, indicating a subbituminous A rank classification.
The amount of hydrocarbon yield (S2) released during pyrolysis exhibits a strong positive correlation with the TOC content in carbonaceous mudstones, with a notably high linear correlation coefficient of 0.863. However, in the case of coal samples, where S2 values range from 107.1 to 292.0 mg HC/g rock, there is almost no discernible correlation with TOC content (Figure 4a). The generally low levels of free hydrocarbons (S1) are indicative of low maturity, with values ranging from less than 0.1 to 1.8 mg HC/g rock for coaly shales and 0.4–3.9 mg HC/g rock for coals. Notably, S1 and S2 values demonstrate an overall positive correlation (see Appendix A for details) (Figure 4b).
The SOM values range from less than 0.33 to 4.69 mg HC/g rock in carbonaceous mudstones and from 3.58 to 10.8 mg HC/g rock in coals. In carbonaceous mudstones, there is a positive correlation between total SOM and S1 values obtained from Rock-Eval pyrolysis, whereas this correlation is weak in coal samples. Although both SOM and S1 represent free oil in the samples, the yield obtained through solvent extraction is significantly higher than that from thermal evaporation due to the differing analytical methods. (Figure 4c). The coals and carbonaceous mudstones of the Guchengzi Formation align with the immature stage of oil generation, as indicated by Tmax values ranging from 411 to 426 °C for coal samples and 415 to 436 °C for carbonaceous mudstones (see Appendix A for details). The Tmax versus HI plot further indicates the presence of mixed Type II–III kerogens in the analyzed sample set (Figure 4d).

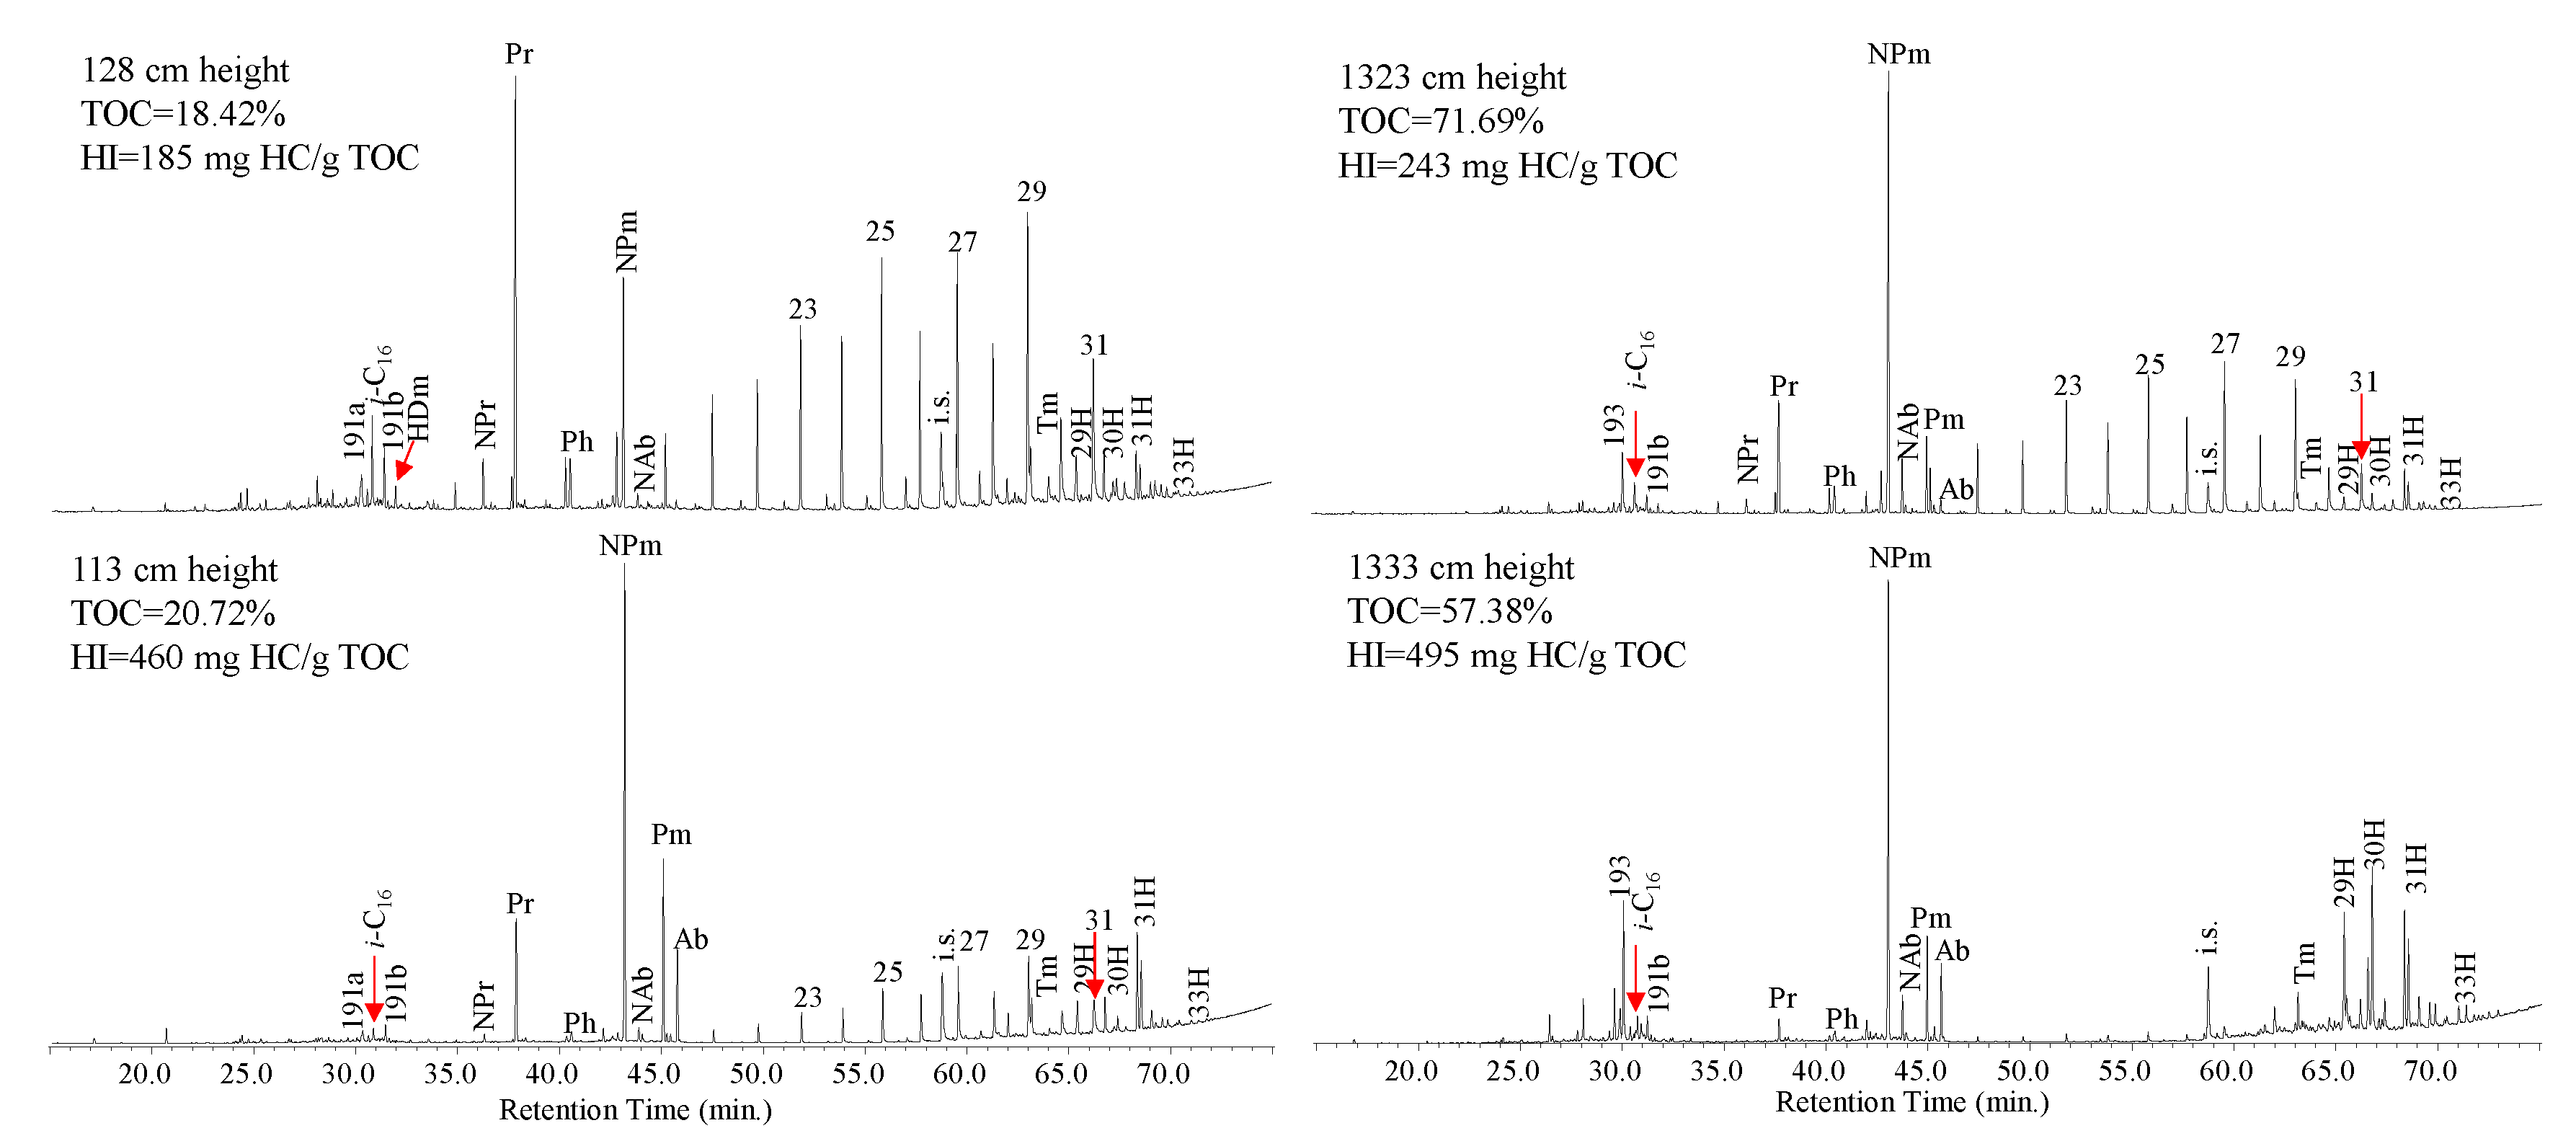
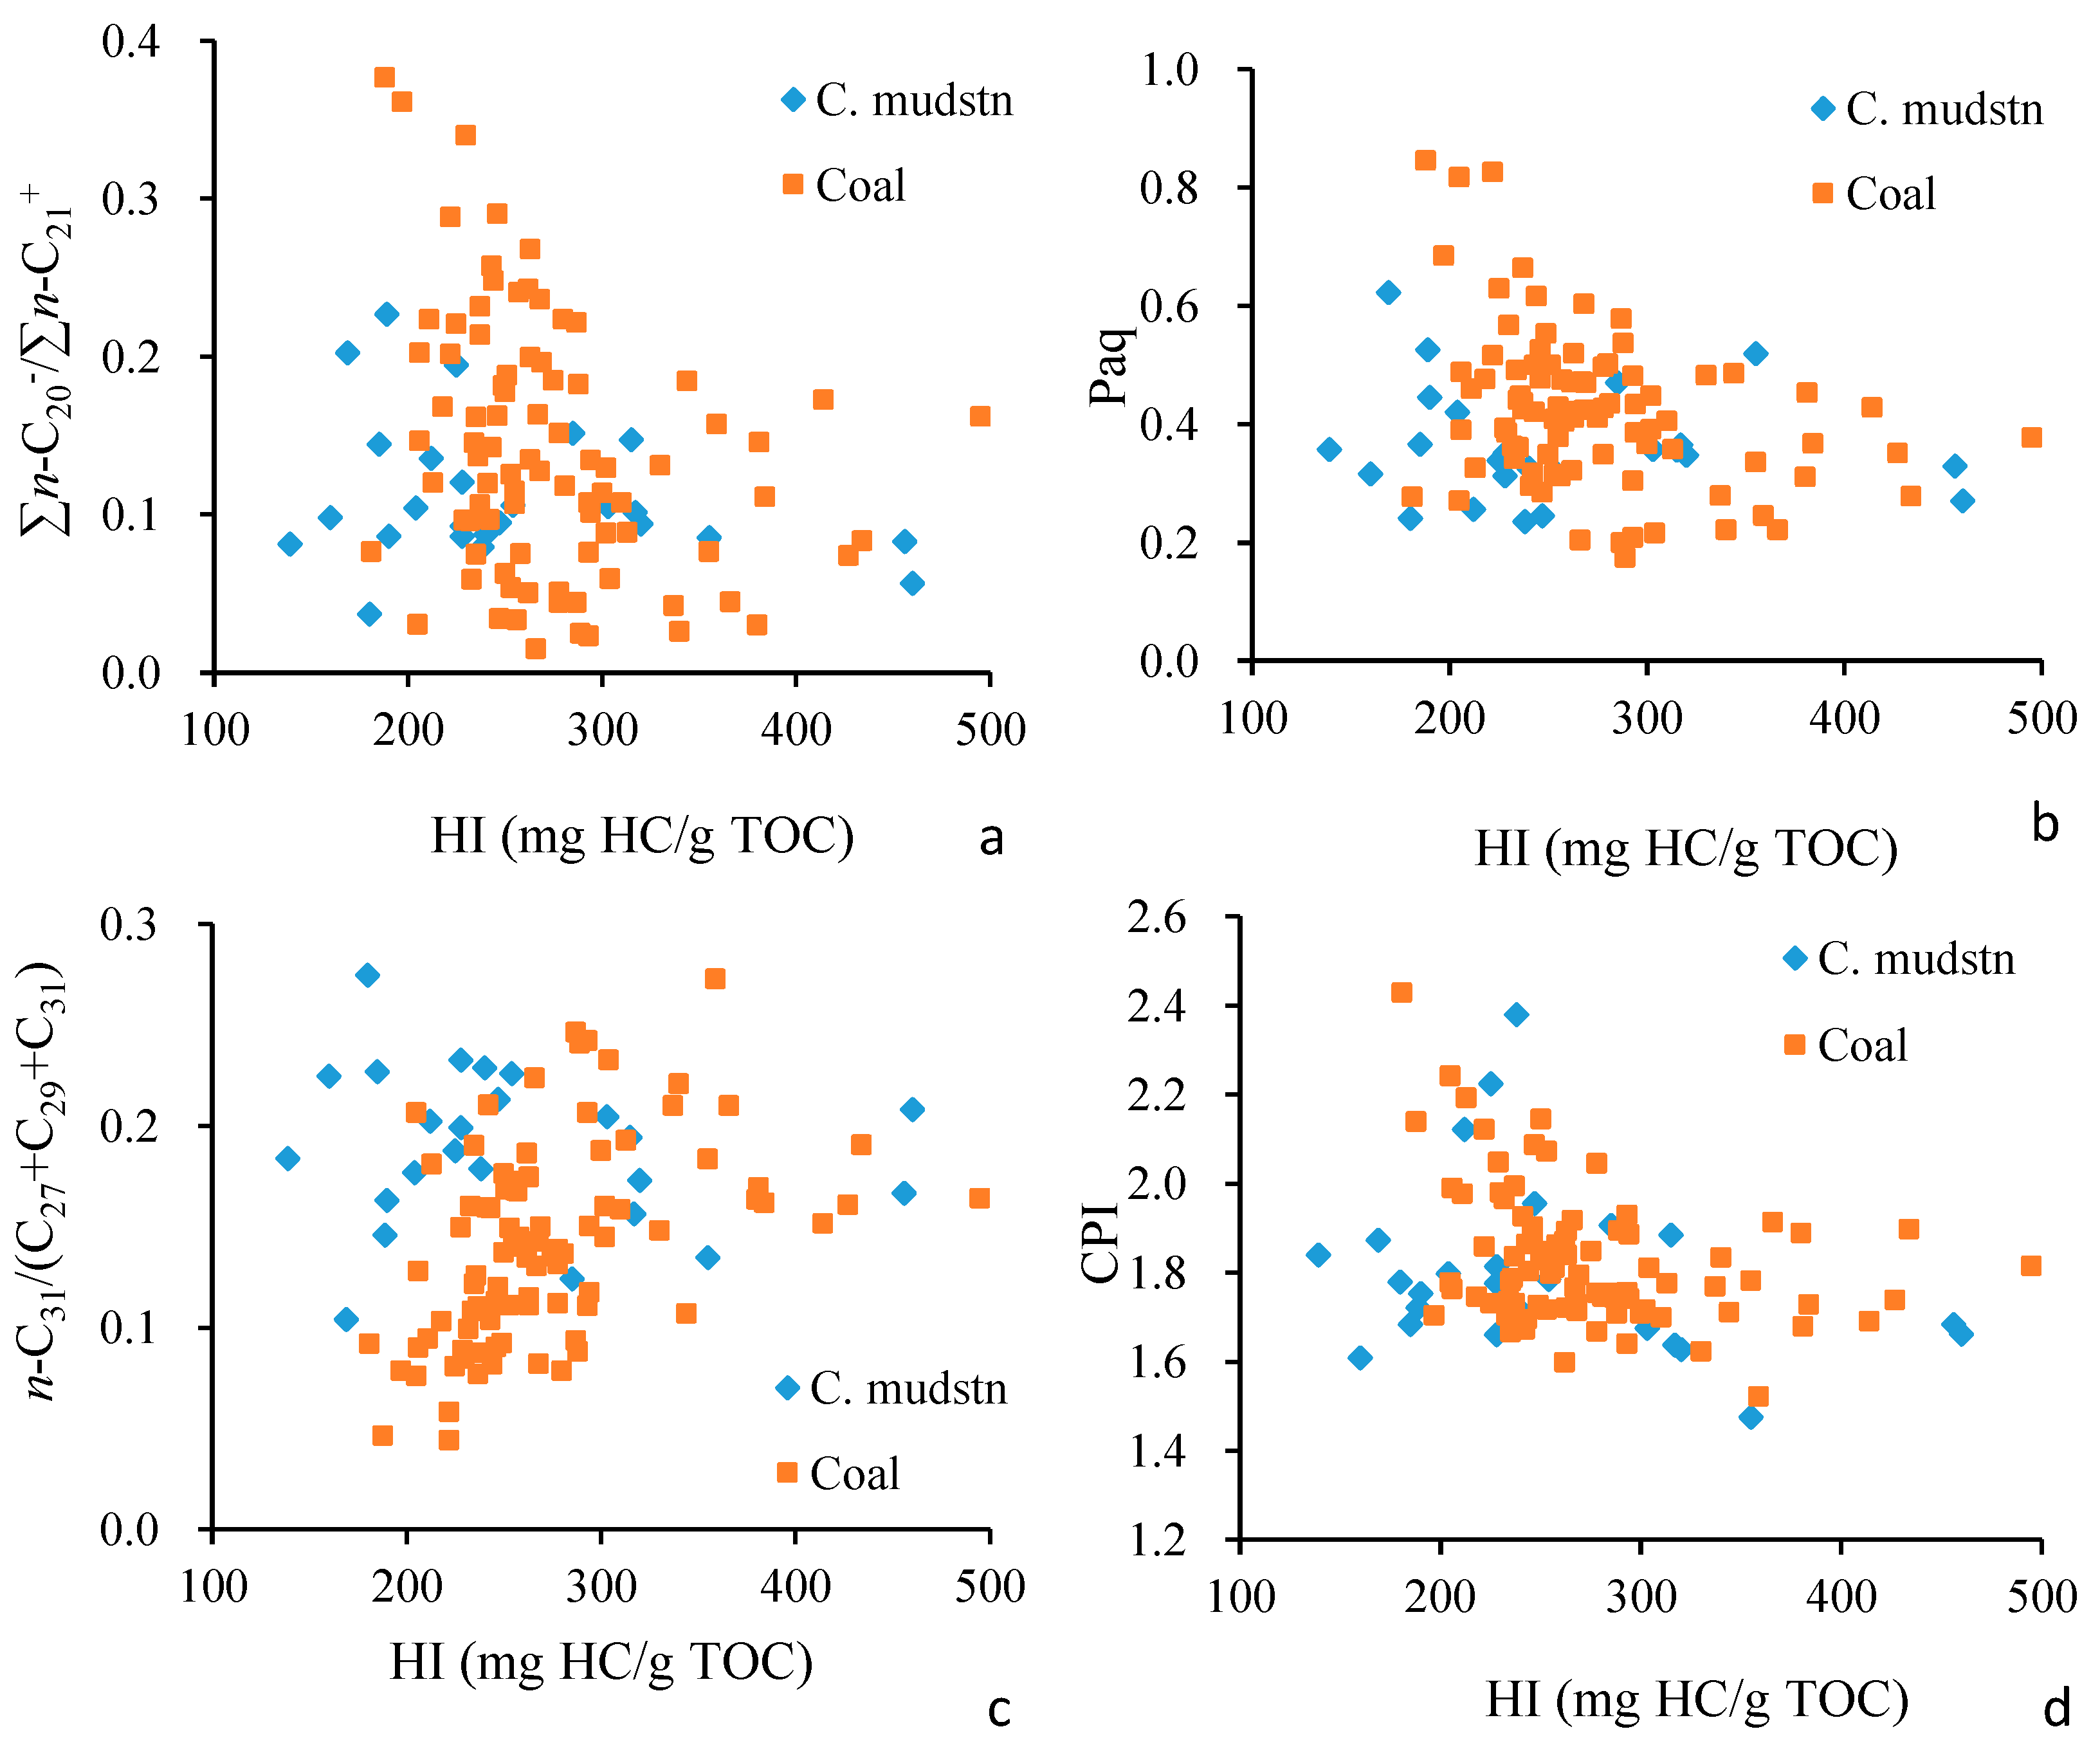
4.2. Geochemistry of Saturated Hydrocarbons

Figure 5 displays the Total Ion Chromatograms (TICs) of the saturated hydrocarbon fractions in representative samples taken from both low and high Hydrogen Index (HI) values of coaly shale and coals within the Guchengzi Formation. In the low HI value carbonaceous mudstone (185 mg HC/g TOC) and coal (243 mg HC/g TOC) samples, the primary components of the saturated fraction consist of n-alkanes, isoprenoid alkanes, and diterpanes. The high HI value carbonaceous mudstone (460 mg HC/g TOC) and coal (495 mg HC/g TOC) samples are predominantly tricyclic diterpanes and hopanes, with n-alkanes being present in significantly lower concentrations. Additionally, bicyclic sesquiterpanes are observed in all samples, with generally modest relative abundance (Figure 5).
The short-chain n-alkanes (<C20) are typically derived from freshwater photosynthetic organisms (algae) and microorganisms [31]. The ∑n-C20/∑n-C21+ ratios are mostly below 0.3, indicating that the contribution of algae and microorganisms to the total alkanes was minimal. A weak negative correlation is observed between ∑n-C20/∑n-C21+ ratios and HI values in both carbonaceous mudstones and coals, suggesting that the increase in HI values in coal is not linked to biomass inputs from algae and/or microorganisms (Figure 6a).
The Paq ratio quantifies the relationship between mid-chain n-alkanes (n-C23, n-C25), attributed to submerged/floating freshwater plants (macrophytes) and peat moss (Sphagnum), and long-chain n-alkanes (n-C27, n-C29, n-C31), which originate from terrestrial plants. The Paq ratio (Paq = (C23 + C25)/(C27 + C29 + C31), [31]) shows a modest negative correlation with the HI values (Figure 6b).
The presence of n-C27, n-C29, and n-C31 derived from terrestrial plants serves as a marker for changes in climate conditions or plant groups [32]. However, our examination of coal samples failed to uncover a distinct correlation between the relative proportions of n-alkanes in n-C27/(n-C27 + n-C29 + n-C31), n-C29/(n-C27 + n-C29 + n-C31) and the HI values. Nevertheless, there was a marginal increase in the n-C31/(n-C27 + n-C29 + n-C31) ratios with higher HI values, indicating a linear correlation coefficient of 0.189 (Figure 6c).
The high Carbon Preference Index (CPI), as defined by Bray and Evans [33] [CPI = 2 × (C25 + C27 + C29 + C31)/(C24 + 2 × (C26 + C28 + C30) + C32], is recognized as a distinguishing characteristic of low-rank coal. Within our study, CPI values were observed within the range from 1.5 to 2.4 for both coaly shale and coal samples. A negative correlation was identified between the CPI and HI values in coals, with a linear coefficient of 0.139 (Figure 6d).
All samples contain the acyclic isoprenoids, in particular pristane (Pr) and phytane (Ph). The Pr/Ph ratio displayed a wide range, with values ranging from 1.5 to 13.7 for the coals and from 5.6 to 11.2 for the carbonaceous mudstones. A significant portion of samples with high Pr/Ph ratios (>3.0) indicates the deposition of terrigenous organic matter under oxic conditions [34]. Conversely, a few samples with low Pr/Ph ratios (<3.0) can be interpreted as products of deposition under dysoxic to oxic conditions. The Pr/Ph ratios show a general increasing trend with HI values in the carbonaceous mudstones but a slight decreasing trend within the coals (Figure 7a).
The ratios of Pr/n-C17 and Ph/n-C18 are strongly linked to variations in depositional conditions, thermal maturity, and the effects of biodegradation [35]. In the carbonaceous mudstones, the Pr/n-C17 ratio spans from 3.2 to 38.6, while in coal samples, it ranges from 5.2 to 92.6. Similarly, the Ph/n-C18 ratio varies from 0.4 to 3.4 in carbonaceous mudstones and from 0.3 to 26.0 in coal samples (Figure 7b). The elevated abundance of Pr and Ph relative to n-C17 and n-C18 observed in our samples results from biodegradation, as aerobic bacteria tend to preferentially degrade n-alkanes over isoprenoids. However, there is no discernible correlation between isoprenoid/n-alkane ratios and HI values, further emphasizing the absence of an inherent relationship between depositional conditions and hydrocarbon generation potential in coal seams.
A detailed examination of the samples has uncovered the presence of bicyclic sesquiterpanes (C14 to C16). In addition to the detection of 4β (H)-eudesmane, 8β (H)-drimane, and 8β (H)-homodrimane in the m/z 123 partial mass chromatograms, two unsaturated sesquiterpenoids, C15H26, with M+ at m/z 206 and a base peak at m/z 191 (referred to as 191a and 191b in Figure 3), have been positively identified. These compounds are likely β-patchoulanes and are believed to originate from vascular plants [36]. The presence of 8β (H)-drimane and 8β (H)-homodrimane predominantly indicates a bacterial contribution [23]. The ratio of drimane-type compounds (drimane + homodrimane) to patchoulanes (m/z 191a + 191b) exhibits a positive correlation with HI values (Figure 8a).
In most coal and carbonaceous mudstone samples, norpimarane emerges as the dominant compound among tricyclic diterpenoids, followed by pimarane, norabietane, and abietane. Tetracyclic diterpenoids, such as phyllocladanes and kauranes, are found in low relative abundance. Fleck (2001) [37] introduced the diterpane ratio Rdit, which is calculated as (19-norisopimarane + isopimarane + 16α-kaurane)/(ent-beyerane + 16β-phyllocladane + 16α-phyllocladane), as an indicator of changes in depositional conditions related to paleovegetation. An Rdit value exceeding 1.5 signifies a prevalence of pteridophytes over gymnosperms, suggesting a high-water table in the swamp and a wetter climate during those periods. Conversely, an Rdit value below 1.1 indicates a low water table and a drier climate. Remarkably, the majority of Rdit values in the studied samples exceed 1.5, with the highest ratio reaching 143, suggesting warm and wet conditions during deposition. However, there is no correlation between Rdit and HI values, implying that changes in vegetation and climate do not appear to impact the hydrocarbon generation potential of coal seams (Figure 8b).
Hopanoids are well known as biomarkers for bacteria and cyanobacteria [38]. Hopanes, ranging from C27 to C33 (excluding C28), have been identified in both coal and coaly shale samples. The absence of C34 and C35 homohopanes (Figure 5) is indicative of the presence of bacteria in the swamp associated with an oxic-type paleoenvironment [23].
In carbonaceous mudstones, the ratio of C29 norhopane to C30 hopane (C29H/C30H) ranges from 0.56 to 1.80, while in coal samples, it spans from 0.61 to 1.04. This ratio shows a weak negative correlation with HI values, suggesting that terrestrial organic matter, such as ferns, lichens, or mosses, as represented by C29H [39], reduces the hydrocarbon generation potential, while prokaryotic organisms, indicated by C30 hopane, enhance the hydrocarbon generation potential (R2 of 0.234) (Figure 9a).
To further underscore the significant influence of bacterial contributions on hydrocarbon generation potential, the ratios of ∑C27–33 hopanes/(n-C27 + n-C29 + n-C31) were plotted against HI values. As anticipated, an increase in these ratios with rising HI values was observed in both coaly shale and coal samples, thus reaffirming the central role played by bacteria in enhancing hydrocarbon generation potentials (Figure 9b).
Additionally, the relationship between the concentration of total hopanes and HI values was explored. The linear correlation coefficients were determined, resulting in values of 0.379 and 0.493 for coals in mg/g EOM and mg/g TOC, respectively. In the case of coaly shales, the linear correlation coefficients for mg/g EOM and mg/g TOC were found to be 0.331 and 0.612, respectively (Figure 9c,d). These findings offer further evidence of the significant impact of bacterial input on hydrocarbon generation potential within coal seams.
Steranes are produced from sterols present in both plants and microorganisms [23]. The prevalence of C27 steranes points to a deep lake environment and a primary source input from plankton (algae). Conversely, when C29 steranes are dominant, it suggests a shallow-water swamp environment with a primary source input from terrestrial higher plants. Therefore, the C27/C29 steranes ratio is widely used to discern between these biomass inputs [40]. The C27/C29 steranes ratio ranges from 0.2 to 0.5, with slightly lower ratios observed in carbonaceous mudstone samples. However, there is no correlation between C27/C29 steranes and HI (Figure 10a).
The hopane/sterane ratio is often used to assess the relative inputs of prokaryotic versus eukaryotic debris. Ratio values greater than 2.0 suggest a high level of bacterial inputs, commonly associated with non-marine organic matter in coals. The hopane/sterane ratio ranges from 8.0 to 36.4 in carbonaceous mudstones and from 2.7 to 50.3 in coal samples. A noticeable increase in the hopane/sterane ratio is observed with increasing HI values (Figure 10b).

4.3. Aromatic Hydrocarbons

The TIC chromatograms of the aromatic fraction of the representative samples are illustrated in Figure 11. The distribution of aromatic hydrocarbons differs significantly from mature source rock extracts or oils where alkylnaphthalenes and alkylphenanthrenes dominate. Aromatic hydrocarbons in immature coal and carbonaceous mudstones from the Fushun Basin are dominated by a few individual compounds. The low HI value samples have 1,2,5-trimethylnaphthalene (TMN) and 1-methyl-7-isopropylphenanthrene (retene) as the most abundant compounds, followed by 1,2,5,6-tetramethylnaphthalene (TeMN), 4-isopropyl-1,6-dimethylnapthalene (cadalene), 6-isopropyl-2-methyl-1-(4-methylpentyl)naphthalene (iP-iHMN), and 1,7-dimethylphenanthrene (DMP), while other alkylnaphthalenes and alkylphenanthrenes are in lower abundance. High HI value samples are characterized by the depletion of 1,2,5-TMN due to biodegradation, leaving retene as the dominant peak. The coal samples also display the relative enrichment of dehydroabietane and a depletion of 1,7-DMP, while such changes are not obvious in carbonaceous mudstone (Figure 11).
Cadalene is a common marker found in various terrestrial plants, with some connections to conifer species. On the other hand, retene is a biomarker specifically produced during the decomposition of abietic acid and is derived from conifer resins. While cadalene and retene cannot pinpoint different plant families, the presence or absence of specific diterpenoids associated with retene helps identify the exact source of these compounds. Therefore, the retene/cadalene ratio acts as an indicator for changes in ancient plant life [41]. In carbonaceous mudstones, the retene-to-cadalene ratio ranges from 1.5 to 12.0, while in coals, it ranges from 1.3 to 7.3. However, this ratio shows no correlation with HI values (Figure 12a).
Aromatic diterpenoids (dehydroabietane, simonellite, and retene) primarily originate from abietane-type diterpenoids (i.e., pimarane and phyllocladane) through the creation of abietic acid in a combination of aerobic and anaerobic processes. Under acidic conditions, the catalytic influence of clay minerals prompts the isomerization of pimarane and phyllocladane, leading to the formation of abietane. The aromatization and oxidative dehydrogenation of abietic acid and its isomers can generate dehydroabietic acid. This compound then undergoes a continuous sequence of aromatization, decarboxylation, and demethylation to produce intermediates, such as tetrahydroretene, dehydroabietane, simonellite, and eventually the relatively stable retene [42,43]. Consequently, the relative abundance of diterpanes and their aromatic derivatives may serve as indicators of diagenetic conditions. The ratios of norpimarane to retene, dehydroabietane to simonellite, and simonellite to retene are correlated with the HI values, exhibiting a weak positive correlation for all three ratios, with linear correlation coefficients of 0.169, 0.199, and 0.153, respectively (Figure 12b–d). These findings imply that diagenetic conditions, particularly the Eh value, play a significant role, with higher hydrocarbon generation potential preserved in more reducing environments.

5. Discussions

The coal samples displayed HI values ranging from 181 to 495 mg HC/g TOC, indicating significant potential for oil generation [12]. The reasons for high HI values being attributed to a suppression of vitrinite reflectance [1,19] and a decrease in TOC due to CO2 loss (decarboxylation) can confidently be excluded since the same maturity levels and very similar TOC contents were observed in all samples. Consequently, further discussion is warranted to explore the factors responsible for the substantial variability in hydrocarbon generation potential. Although a previous petrographic study [26] suggested no significant differences in the gymnosperm/angiosperm ratio between low-ash and ash-rich coal, our current, more in-depth analysis of molecular compositions from a small coal interval uncovers notable changes in the vegetation composition. It is worth noting that the input of algae and aquatic biomass does not enhance the hydrocarbon generation potential of coals, as indicated by the consistent ratios of ∑n-C20/∑n-C21+ and Paq (Figure 6a,b). Furthermore, other parameters related to biomass input, such as Rdit, C27/C29 St, and retene/cadalene, also show no correlation with HI values (Figure 8b, Figure 10a and Figure 12a).
While some of the observed variability may stem from subtle variations in floral input not captured by molecular composition, the results from this study indicate that the hydrocarbon generation potential of coals is not controlled by the type of biomass present, as no noticeable variations indicative of biomass alteration can be associated with HI. This offers insights into the relationship between coal composition and hydrocarbon generation potential.
The depositional conditions influence the hydrocarbon generation potential of coals. Hydrogen-enriched vitrinite is associated with marine-influenced coals [1,16,18]. However, this is not the case in the Fushun Basin, where the Guchengzi Formation originated in a shallow water swamp environment with a water depth of less than 20 m [24]. This limited water depth might be insufficient to establish stable lake stratification, resulting in an oxygen-rich environment [44]. The high TOC values in the Guchengzi Formation coal are more likely attributed to the elevated productivity of higher plants.
The Pr/Ph ratio [34] suggests oxic conditions. However, the variation of Pr/Ph ratios indicates a gradual transition from oxic to dysoxic conditions during the drowning phase of the seam. Nonetheless, there is no correlation between the Pr/Ph ratio and HI values, suggesting that either depositional conditions do not significantly influence hydrocarbon generation potential or the Pr/Ph ratio does not accurately reflect diagenetic conditions.
The Pr/Ph ratio can be influenced by differences in the precursors for acyclic isoprenoids. Pristane can be formed from the isoprenoidal side chain of tocopherol, which is often found in relatively high concentrations in higher plants [45]. Biomass input is not a controlling factor, and a shift in precursor types is unlikely to impact hydrocarbon generation potentials. Furthermore, alterations in the Pr/Ph ratio may be due to biodegradation, which provides an alternative explanation for the lack of correlation between Pr/Ph and HI values.
The variations in sulfur content are attributed to changes in pH values within the paleomire. Relatively high sulfur levels are associated with alkaline, calcium-rich surface waters, where pH influences both the reduction of sulfates by sulfate-reducing bacteria and the bacterial decomposition of plant material. In lignites, a high degree of gelification is typically driven by anaerobic bacterial activity, which enhances H2S availability under the wet depositional conditions necessary for sulfide formation. This process results in higher sulfur content, particularly in gelified lithotypes [46]. However, the coals in the Fushun Basin generally exhibit low sulfur content, with most samples containing sulfur levels below 1.0 wt%, indicating mire development in a freshwater environment [26]. Although sulfur content was not analyzed in the present study, the absence of organosulfur compounds in the aromatic hydrocarbon fraction suggests no significant sulfate-related influence.
Further investigation was undertaken to explore how the potential for hydrocarbon generation via the aromatization of diterpenoids is influenced by diagenetic conditions. Alterations in diterpenoids occur through both reductive and oxidative pathways [47]. The diagenesis of terpenoids is a process influenced by exposure to water, sediment burial rates, post-depositional diagenesis, and thermal transformations [47]. As a result, terpenoid structures with varying degrees of aromatization are generated. In oxidizing environments, the catalytic influence of clay minerals prompts the isomerization of pimarane and phyllocladane, leading to the formation of abietic acids [47]. The aromatization and oxidative dehydrogenation of abietic acid and its isomers can generate dehydroabietic acid [47]. This compound then undergoes a continuous sequence of aromatization, decarboxylation, and demethylation to produce intermediates such as tetrahydroretene, dehydroabietane, simonellite, and eventually the relatively stable retene. In reducing environments, diterpenoids can be subjected to hydrogenation to form diterpanes [48,49].
Fluctuations in water levels, particularly in overbank deposits and swamps, lead to changes in redox conditions, resulting in the production of both oxidized and reduced terpenoids. The degree of aromatization of abietane-type diterpenoids was expressed as the relative abundance of saturated (norpimare), monoaromatic (dehydroabietane), diaromatic (simonellite), and triaromatic (retene) diterpenoids. The positive correlation between norpimare/retene, dehydroabietane/simonellite, and simonellite/retene ratios and HI values suggests that better organic matter preservation in coals, consistently indicated by a lower degree of aromatization, leads to higher hydrocarbon generation potential (Figure 12). However, the low correlation indicates that diagenetic conditions play a secondary role in governing the hydrocarbon generation potential in coals.
There is no substantiating evidence to support the presence of a hydrogen-rich plant community. Although high liptinite contents typically correlate with high hydrogen indices, the correlation between HI and liptinite is weak, indicating the presence of additional factors that should be considered. Hopanes, which serve as bacterial biomarkers formed during the degradation of bacteriohopanepolyols [38,50], offer a direct indication of the influence of bacteria. Aerobic bacteria and archea, including methanotrophs, methylotrophs, cyanobacteria, and fungi, are likely the biological precursors of hopanoids in coals [51]. Concentrations of total hopanes exhibit the highest correlation coefficient with HI values in both coal and carbonaceous mudstone samples (Figure 9c,d), confirming the primary role of bacteria in the hydrocarbon generation potential.
Bacteria likely played a significant role in the overall turnover of organic matter, contributing to the structural and compositional evolution of coal [52]. Blumenberg et al. [53] observed a strong correlation between the high abundance of bacterial biomarkers, specifically hopanoids, and the hydrogen index of organic matter, with particular emphasis on the concentration of hop-17(21)-ene. This correlation suggests that bacterial contributions, marked by hopanoid presence, are indicative of a more hydrogen-rich composition. Furthermore, Marshall et al. [54] proposed that increased bacterial activity or a higher abundance of bacterial biomass is associated with a rise in hydrogen content within coals. This bacterial influence is crucial as it not only affects the coal’s hydrogen enrichment but also enhances its hydrocarbon generation potential by facilitating the incorporation of hydrogen into the coal matrix.
During early diagenesis, microbial activities selectively break down fatty acids with an even number of carbon atoms, which are commonly found in the cuticular waxes of vascular plants, into aldehydes, ketones, and alkanes. This reduction in the number of carbon atoms ultimately leads to the formation of n-alkanes with an odd number of carbon atoms [55]. Well-preserved plant tissue is indicated by high CPI values, while low CPI values may suggest increased bacterial activity or the reworking of organic matter by bacteria [56]. The negative correlation observed between CPI and HI values in the dataset indicates that bacterial reworking enhances the hydrocarbon generation potential of coal (Figure 6d). The slight negative correlation between the proportion of low-molecular-weight n-alkanes primarily derived from algae (∑n-C20/∑n-C21+) and HI values (Figure 6a) implies that the algal contribution has a minor effect on the hydrocarbon generation potential within the Fushun coal seam.
The ratios of ∑hopanes/n-(C27 + C29 + C31) and ∑hopanes/∑steranes estimate the presence of bacteria (hopanes) versus algae (C27 and C28 steranes) and terrestrial higher plants (n-C27, n-C29, n-C31, and C29 steranes). Their positive correlation with HI values suggests that bacterial biomass and/or microbial activity increases the hydrocarbon generation potential (Figure 9b and Figure 10b). Drimanes have a similar microbial origin to hopanes. The increasing ratio of drimanes and homodrimanes to patchoulanes derived from higher plants, along with rising HI values, supports the conclusion that microbial activity significantly contributes to hydrocarbon generation potential (Figure 8a). Therefore, hopane concentrations and their relative abundances in relation to other compound classes reflect the level of microbial activity or microbial alteration of the coal structure. Bacterial reworking during diagenesis may facilitate the re-incorporation of volatile components rich in hydrogen into the coal matrix. Extensive degradation of organic matter may be partly attributed to the presence of abundant nutrients or weak acidic conditions that stimulate the degradation process [57,58]. Diagenesis and catagenesis lead to relative hydrogen enrichment in the coal seams, resulting in high oil-generating potential. The conversion of coal into oil and gas via biodegradation processes holds great promise for sustainable energy development [59]. This method efficiently transforms coal into valuable chemicals, thereby increasing the overall utility of this abundant resource [60]. Coal bioconversion offers an alternative aligned with the growing need for energy sources [61]. This study suggests that microbial involvement significantly enhances hydrocarbon production from coal. Ongoing research in this field is vital to fully unlock the potential of coal bioconversion, addressing energy needs and environmental considerations.

6. Conclusions

Samples from the open mining pit of the Fushun Basin revealed that the Guchengzi Formation coals exhibited a wide range of Hydrogen Index (HI) variations, spanning from 181 to 495 mg HC/g TOC. All samples were thermally immature.
Molecular parameters derived from n-alkanes, isoprenoids, sesqui-, di- and triterpanes, steranes, and aromatic terpanoids indicated that variations in biomass and depositional conditions have no impact on hydrocarbon generation potential.
Saturated and aromatic diterpenoids with varying degrees of aromatization suggested that higher hydrocarbon generation potential is associated with coals preserved under more reducing conditions.
Bacterial-related parameters, including CPI, the drimanes and homodrimanes to patchoulanes ratio, the hopanes to high plant-derived n-alkanes ratio, the hopanes to steranes ratio, and concentrations of total hopanes, signify the crucial role played by bacteria and archea in governing coal’s hydrocarbon generation potential.
The wide variation in hydrocarbon generation potential in coal seams is likely due to the structural rearrangement of the coal matrix by microbial activity during diagenesis and catagenesis, which results in the re-incorporation of hydrogen-rich components, leading to the formation of coals with higher oil-generating potential.

Author Contributions

Conceptualization, H.H.; Investigation, Z.F., H.Z. and Y.M.; Writing—review & editing, Z.F., H.H., X.X., H.Z. and Y.M.; Project administration, H.H. All authors have read and agreed to the published version of the manuscript.

Funding

We acknowledge the support of the National Natural Science Foundation of China (Grant Numbers 42473034 and 42302161) and the Foundation of the National Key Laboratory of Petroleum Resources and Engineering at China University of Petroleum (Beijing) (PRP/indep-1-1810).

Data Availability Statement

The original contributions presented in the study are included in the article, further inquiries can be directed to the corresponding author.

Acknowledgments

We would like to acknowledge Steve Larter from the University of Calgary and four reviewers for valuable comments and revisions, which have greatly improved the quality of this manuscript.

Conflicts of Interest

Author Zhe Fu was employed by the company China Petroleum Engineering & Construction Corporation. The remaining authors declare that the research was conducted in the absence of any commercial or financial relationships that could be construed as a potential conflict of interest.

Appendix A

Table A1. Rock-eval analysis results of coal seam samples from the Fushun Basin.
Height (cm)S1 (mg/g)S2 (mg/g)S3 (mg/g)S3CO (mg/g)S3′CO (mg/g)Tmax (°C)PC (%)RC (%)TOC (%)OIHIOICO
2.50.3414.200.240.230.454341.232.774.0063556
121.38194.105.573.628.9741716.7247.9164.6393006
231.31162.085.645.558.1742114.1347.4161.5492639
330.78179.274.613.297.4142115.3745.9061.2782935
381.27165.915.845.487.5242114.4354.0668.4992428
431.04160.915.823.679.1142013.9552.9266.8892415
531.22165.335.995.728.3842014.4156.0270.4392358
631.15126.696.175.919.0042511.2353.1464.36101979
681.25158.845.795.498.0741713.8553.4367.2892368
731.87239.073.813.165.0441820.3535.5955.9474276
781.07174.305.855.628.2042115.1354.5969.7282508
981.03211.045.393.588.4241818.0849.3867.4783135
1030.76183.515.743.689.3041615.8152.4268.2382695
1081.26154.386.694.068.6841713.4652.7666.22102336
1130.8295.371.511.401.794268.1212.6020.7274607
1180.2417.930.630.501.024291.575.507.0692547
1230.1328.472.181.902.144272.5613.2915.851418012
1280.2934.082.371.492.594283.0415.3818.42131858
1380.4130.811.090.791.734272.6910.1212.8192406
1480.96181.406.063.629.0641715.6553.2968.9492635
1881.65191.185.715.468.0441916.5752.2568.8182788
2080.86170.965.795.438.2341714.8353.8868.7182498
2280.9068.902.721.983.824156.0324.6430.6892256
2430.073.830.390.330.424360.362.032.391716014
2731.11140.175.645.357.3441912.2753.5665.8392138
2931.39172.205.815.417.9141714.9753.9768.9482508
3620.8276.112.622.643.214246.6424.1530.7992479
3681.12111.044.644.345.814219.7542.6852.4392128
4030.3578.521.941.512.584226.7218.1724.8983156
4080.84115.974.372.956.5642310.0838.6148.6992386
4130.40107.125.915.066.584239.4449.6759.11101819
4181.29122.473.812.485.8642610.6132.4143.0192856
4281.11150.525.735.238.0141813.1453.6266.7692258
4580.95201.045.613.398.8141717.2551.1968.4582945
4630.88126.016.715.859.0542311.1655.9067.06101889
4681.10172.305.873.1510.2041714.9153.8368.7392515
4730.75123.206.985.928.6442010.9249.1160.021220510
4781.71148.575.825.388.0642013.0453.8866.9292228
4831.17180.455.933.259.9641415.5953.4068.9892625
4930.0610.500.590.630.804310.945.276.21916910
5130.76165.175.162.978.7341514.2350.0264.2482575
5281.65151.776.165.558.3441713.3255.1068.4192228
5331.20163.385.284.977.6241514.1852.9067.0882447
5630.5236.772.047.131.894263.5015.9819.471018937
5930.44142.076.365.397.8141712.4056.5968.9992068
6080.73161.016.045.378.0941913.9953.9067.8992378
6130.72165.385.763.239.5741714.2952.8967.1792465
6481.05182.815.975.467.4341715.8252.5668.3792678
6731.25159.976.195.458.0642013.9654.2968.2592348
7081.44207.275.953.509.3841517.8452.6370.4782945
7180.57152.276.215.348.3741713.2656.6469.9092188
7530.99159.396.165.388.1341813.8855.3369.2192308
7581.10167.786.395.278.0341514.5954.6069.1892438
7881.51198.405.795.337.3041717.1451.8568.9982888
8080.6085.940.971.101.424337.2911.5518.8454566
8132.05169.675.164.636.2142414.7350.0964.8182627
8181.7988.231.941.432.914247.6519.8927.5473205
8231.4087.101.971.582.894267.5319.9227.4573176
8330.79130.426.265.126.7642011.4352.0363.46102068
8381.04155.466.443.519.1442113.5153.5267.03102325
8431.81207.365.753.458.5541717.8550.7568.6083025
8531.61193.065.773.289.1142016.6551.9768.6282815
8681.53221.583.702.805.4742018.8638.8957.7463845
9531.97205.175.205.046.7741917.7048.4566.1483108
9581.23184.365.735.787.0341915.9649.9565.9192809
9631.00183.225.955.187.4241915.8352.4768.3092688
9731.55190.985.863.168.9141816.4752.1768.6492785
9781.69200.045.963.389.3741917.2552.5769.8292875
10082.12235.345.913.508.1441120.1951.0471.2483305
10132.87267.945.543.697.1541422.9447.3770.3183815
10181.11162.976.575.347.7141514.1954.5668.75102378
10231.62169.265.944.886.9542114.7052.1566.8592537
10382.20241.655.763.518.0541520.7249.5470.2683445
10532.93202.075.353.247.8942617.4749.4066.8783025
10780.4031.370.830.661.154292.717.6510.3683036
10830.5243.742.061.352.424293.8415.3419.18112287
10880.7648.352.321.472.914214.2719.4123.67102046
10930.2026.161.421.321.624232.3211.4613.781019010
10980.1911.711.498.780.954241.427.028.4418139104
11180.2216.660.850.810.864251.485.837.311222811
11430.54178.975.983.468.3241915.3951.9467.3392665
11531.39168.075.715.137.5042114.6051.7766.3892538
11631.09186.735.773.278.9941616.0851.9368.0182755
1177.51.30202.086.153.488.8541517.3951.6068.9992935
11880.2298.093.112.026.044178.4634.6143.0772285
12030.42134.776.385.578.1242111.8152.0463.84102119
12130.80178.746.433.289.5141615.4253.9069.3292585
12232.61287.544.783.445.7242224.4841.7066.1874345
12280.75165.116.525.417.5941914.3452.8467.18102468
12380.56155.696.745.477.6942113.5554.4067.96102298
12430.94166.596.645.407.7442214.4853.0567.53102478
12480.82189.276.355.457.5941816.3551.6768.0192788
12530.65266.195.464.536.5241722.6347.3569.9883806
12580.91150.325.526.716.3942113.1345.4958.62925611
12630.91188.055.935.726.8041616.2448.7865.0292899
12730.84171.366.403.459.1741814.8152.3867.19102555
12780.62167.996.623.309.5441914.5251.3965.91102555
12831.14239.145.683.397.9941820.4249.9370.3483405
12881.12255.785.463.487.2441921.7848.0869.8683665
12930.92161.186.495.217.5941914.0253.8667.87102378
12981.02185.796.153.209.1441716.0153.4169.4292685
13031.93238.595.313.257.1041820.4046.9067.3083555
13082.04185.426.515.157.3941516.1254.3970.5092637
13133.92292.015.753.716.5941325.0245.5770.5984145
13180.68167.217.523.2610.2341714.5056.6771.17112355
13231.06174.367.083.199.9641715.1056.5871.69102434
13280.70241.455.663.327.6341820.5651.0771.6283375
13331.60284.303.633.293.5241824.0533.3457.3864956
13430.93214.856.083.368.5541318.4052.2770.6793045
13480.42210.684.782.985.8842217.9140.8458.7483595
13530.59203.466.183.108.6541117.4253.4570.8892874
13630.55177.395.972.997.5842315.2245.2960.52102935
13680.38129.199.836.307.3441811.4551.7263.171620510

References

  1. Petersen, H.I.; Nytoft, H.P. Oil generation capacity of coals as a function of coal age and aliphatic structure. Org. Geochem. 2006, 37, 558–583. [Google Scholar] [CrossRef]
  2. Kamalrulzaman, K.N.; Shalaby, M.R.; Islam, M.A. Source rock characteristics and 1D basin modeling of the lower Cretaceous Latrobe Group, Gippsland Basin, Australia. Geoenergy Sci. Eng. 2023, 225, 211674. [Google Scholar] [CrossRef]
  3. Killops, S.D.; Woolhouse, A.D.; Weston, R.J.; Cook, R.A. A geochemical appraisal of oil generation in the Taranaki Basin, New Zealand. AAPG Bull. 1994, 78, 1560–1585. [Google Scholar]
  4. Escobar, M.; Márquez, G.; Suárez–Ruiz, I.; Juliao, T.M.; Carruyo, G.; Martínez, M. Source–rock potential of the lowest coal seams of the Marcelina Formation at the Paso Diablo mine in the Venezuelan Guasare Basin, Evidence for the correlation of Amana oils with these Paleocene coals. Int. J. Coal Geol. 2016, 163, 149–165. [Google Scholar] [CrossRef]
  5. Gong, D.; Cao, Z.; Ni, Y.; Jiao, L.; Yang, B.; Zhao, L. Origins of Jurassic oil reserves in the Turpan–Hami Basin, northwest China: Evidence of admixture from source and thermal maturity. J. Pet. Sci. Eng. 2016, 146, 788–802. [Google Scholar] [CrossRef]
  6. Sun, F.; Cao, G.; Xing, Z. Evaluation of the Upper Paleozoic source rocks in Western Henan, China: A case study in Luoyang Basin. Energy Rep. 2021, 7, 1574–1581. [Google Scholar] [CrossRef]
  7. Hoffmann, C.F.; Mackenzie, A.S.; Lewis, C.A.; Maxwell, J.R.; Oudin, J.L.; Durand, B.; Vandenbroucke, M. A biological marker study of coals, shales and oils from the Mahakam Delta, Kalimantan, Indonesia. Chem. Geol. 1984, 42, 1–23. [Google Scholar] [CrossRef]
  8. Alias, F.L.; Abdullah, W.H.; Hakimi, M.H.; Azhar, M.H.; Kugler, R.L. Organic geochemical characteristics and depositional environment of the Tertiary Tanjong Formation coals in the Pinangah area, onshore Sabah, Malaysia. Int. J. Coal Geol. 2012, 104, 9–21. [Google Scholar] [CrossRef]
  9. Hakimi, M.H.; Abdullah, W.H.; Alias, F.L.; Azhar, M.H.; Makeen, Y.M. Organic petrographic characteristics of Tertiary (Oligocene–Miocene) coals from eastern Malaysia, Rank and evidence for petroleum generation. Int. J. Coal Geol. 2013, 120, 71–81. [Google Scholar] [CrossRef]
  10. Varma, A.K.; Biswas, S.; Patil, D.J.; Mani, D.; Misra, S.; Hazra, B. Significance of lithotypes for hydrocarbon generation and storage. Fuel 2019, 235, 396–405. [Google Scholar] [CrossRef]
  11. Ehinola, O.A.; Ekweozor, C.M.; Oros, D.R.; Simoneit, B.R.T. Geology, geochemistry and biomarker evaluation of Lafia–Obi coal, Benue Trough, Nigeria. Fuel 2002, 81, 219–233. [Google Scholar] [CrossRef]
  12. Hunt, J.M. Generation of gas and oil from coal and other terrestrial organic matter. Org. Geochem. 1991, 17, 673–680. [Google Scholar] [CrossRef]
  13. Hakimi, M.H.; Abdullah, W.H.; Mustapha, K.A.; Adegoke, A.K. Petroleum generation modeling of the Late Cretaceous coals from the Jiza–Qamar Basin as infer by kerogen pyrolysis and bulk kinetics. Fuel 2015, 154, 24–34. [Google Scholar] [CrossRef]
  14. Hendrix, M.S.; Brassell, S.C.; Carroll, A.R.; Graham, S.A. Sedimentology, organic geochemistry and petroleum potential of Jurassic coal measures, Tarim, Junggar, and Turpan basins, northwest China. AAPG Bull. 1995, 79, 929–958. [Google Scholar]
  15. Wilkins, R.W.; George, S.C. Coal as a source rock for oil, a review. Int. J. Coal Geol. 2002, 50, 317–361. [Google Scholar] [CrossRef]
  16. Petersen, H.I.; Lindström, S.; Nytoft, H.P.; Rosenberg, P. Composition, peat–forming vegetation and kerogen paraffinicity of Cenozoic coals, Relationship to variations in the petroleum generation potential (Hydrogen Index). Int. J. Coal Geol. 2009, 78, 119–134. [Google Scholar] [CrossRef]
  17. Nath, M.; Panwar, D.S.; Chaurasia, R.C.; Kaur, J.; Kohli, D. New insight into geochemical characterization of Paleogene coals from Jarain coalfield, Meghalaya, NE India: Hydrocarbon potential and organic petrographic analysis. Geoenergy Sci. Eng. 2023, 226, 211790. [Google Scholar] [CrossRef]
  18. Sykes, R.; Snowdon, L.R. Guidelines for assessing the petroleum potential of coaly source rocks using Rock–Eval pyrolysis. Org. Geochem. 2002, 33, 1441–1455. [Google Scholar] [CrossRef]
  19. Carr, A.D. Suppression and retardation of vitrinite reflectance, Part 1. Formation and significance for hydrocarbon generation. J. Pet. Geol. 2000, 23, 313–343. [Google Scholar] [CrossRef]
  20. Lu, Z.; Li, Q.; Ju, Y.; Gu, S.; Xia, P.; Gao, W.; Yan, Z.; Gong, C. Biodegradation of coal organic matter associated with the generation of secondary biogenic gas in the Huaibei Coalfield. Fuel 2022, 323, 124281. [Google Scholar] [CrossRef]
  21. Jauro, A.; Obaje, N.G.; Agho, M.O.; Abubakar, M.B.; Tukur, A. Organic geochemistry of Cretaceous Lamza and Chikila coals, upper Benue trough, Nigeria. Fuel 2007, 86, 520–532. [Google Scholar] [CrossRef]
  22. Mackenzie, A.S.; Brooks, J.; Welte, D.H. Applications of biological markers in petroleum geochemistry. Adv. Pet. Geochem. 1984, 1, 115–214. [Google Scholar]
  23. Peters, K.E.; Walters, C.C.; Moldowan, J.M. The Biomarker Guide; Cambridge University Press: Cambridge, UK, 2005; Volume 1. [Google Scholar]
  24. Wu, C.; Yang, Q.; Zhu, Z.; Liu, G.; Li, X. Thermodynamic analysis and simulation of coal metamorphism in the Fushun Basin, China. Int. J. Coal Geol. 2000, 44, 149–168. [Google Scholar] [CrossRef]
  25. Meng, Q.; Liu, Z.; Bruch, A.A.; Liu, R.; Hu, F. Palaeoclimatic evolution during Eocene and its influence on oil shale mineralisation, Fushun basin, China. J. Asian Earth Sci. 2012, 45, 95–105. [Google Scholar] [CrossRef]
  26. Strobl, S.A.; Sachsenhofer, R.F.; Bechtel, A.; Meng, Q. Paleoenvironment of the Eocene coal seam in the Fushun Basin (NE China), Implications from petrography and organic geochemistry. Int. J. Coal Geol. 2014, 134, 24–37. [Google Scholar] [CrossRef]
  27. Xie, Y.; Wu, F.; Fang, X. Abrupt collapse of a swamp ecosystem in northeast China during the Paleocene–Eocene Thermal Maximum. Palaeogeogr. Palaeoclimatol. Palaeoecol. 2022, 595, 110975. [Google Scholar] [CrossRef]
  28. Johnson, E.A. Geology of the Fushun coalfield, Liaoning province, People’s Republic of China. Int. J. Coal Geol. 1990, 14, 217–236. [Google Scholar] [CrossRef]
  29. Zhang, B.; Cheng, W.; Zhang, Q.; Li, Y.; Sun, P.; Fathy, D. Occurrence patterns and enrichment influencing factors of trace elements in Paleogene coal in the Fushun Basin, China. ACS Earth Space Chem. 2022, 6, 3031–3042. [Google Scholar] [CrossRef]
  30. Lafargue, E.; Marquis, F.; Pillot, D. Rock–Eval 6 applications in hydrocarbon exploration, production, and soil contamination studies. Rev. Inst. Fr. Pet. 1998, 53, 421–437. [Google Scholar] [CrossRef]
  31. Ficken, K.J.; Li, B.; Swain, D.L.; Eglinton, G. An n-alkane proxy for the sedimentary input of submerged/floating freshwater aquatic macrophytes. Org. Geochem. 2000, 31, 745–749. [Google Scholar] [CrossRef]
  32. Bush, R.T.; McInerney, F.A. Leaf wax n–alkane distributions in and across modern plants, Implications for paleoecology and chemotaxonomy. Geochim. Cosmochim. Acta 2013, 117, 161–179. [Google Scholar] [CrossRef]
  33. Bray, E.E.; Evans, E.D. Distribution of n–paraffins as a clue to recognition of source beds. Geochim. Cosmochim. Acta 1961, 22, 2–15. [Google Scholar] [CrossRef]
  34. Didyk, B.M.; Simoneit, B.R.T.; Brassell, S.T.; Eglinton, G. Organic geochemical indicators of palaeoenvironmental conditions of sedimentation. Nature 1978, 272, 216–222. [Google Scholar] [CrossRef]
  35. Shanmugam, G. Significance of coniferous rain forests and related organic matter in generating commercial quantities of oil, Gippsland Basin, Australia1. AAPG Bull. 1985, 69, 1241–1254. [Google Scholar]
  36. Papanicolaou, C.; Dehmer, J.; Fowler, M. Petrological and organic geochemical characteristics of coal samples from Florina, Lava, Moschopotamos and Kalavryta coal fields, Greece. Int. J. Coal Geol. 2000, 44, 267–292. [Google Scholar] [CrossRef]
  37. Fleck, S.; Michels, R.; Izart, A.; Elie, M.; Landais, P. Palaeoenvironmental assessment of Westphalian fluvio–lacustrine deposits of Lorraine (France) using a combination of Organic Geochemistry and sedimentology. Int. J. Coal Geol. 2001, 48, 65–88. [Google Scholar] [CrossRef]
  38. Ourisson, G.; Albrecht, P.; Rohmer, M. The hopanoids, palaeochemistry and biochemistry of a group of natural products. Pure Appl. Chem. 1979, 51, 709–729. [Google Scholar] [CrossRef]
  39. Ramanampisoa, L.; Radke, M.; Schaeffer, R.G.; Littke, R.; Rullkötter, J.; Horsfield, B. Organic–geochemical characterisation of sediments from the Sakoa coalfield, Madagascar. Org. Geochem. 1990, 16, 235–246. [Google Scholar] [CrossRef]
  40. Huang, W.Y.; Meinschein, W.G. Sterols as ecological indicators. Geochim. Cosmochim. Acta 1979, 43, 739–745. [Google Scholar] [CrossRef]
  41. van Aarssen, B.G.; Alexander, R.; Kagi, R.I. Higher plant biomarkers reflect palaeovegetation changes during Jurassic times. Geochim. Cosmochim. Acta 2000, 64, 1417–1424. [Google Scholar] [CrossRef]
  42. Simoneit, B.R.; Grimalt, J.O.; Wang, T.G.; Cox, R.E.; Hatcher, P.G.; Nissenbaum, A. Cyclic terpenoids of contemporary resinous plant detritus and of fossil woods, ambers and coals. Org. Geochem. 1986, 10, 877–889. [Google Scholar] [CrossRef]
  43. Hautevelle, Y.; Michels, R.; Malartre, F.; Trouiller, A. Vascular plant biomarkers as proxies for palaeoflora and palaeoclimatic changes at the Dogger/Malm transition of the Paris Basin (France). Org. Geochem. 2006, 37, 610–625. [Google Scholar] [CrossRef]
  44. McCabe, P.J. Depositional environments of coal and coal-bearing strata. Spec. Pub. Int. Ass. Sediment. 1984, 7, 13–42. [Google Scholar]
  45. Goossens, H.D.; De Leeuw, J.W.; Schenck, P.A.; Brassell, S.C. Tocopherols as likely precursors of pristane in ancient sediments and crude oils. Nature 1984, 312, 440–442. [Google Scholar] [CrossRef]
  46. Bechtel, A.; Gruber, W.; Sachsenhofer, R.F.; Gratzer, R.; Lücke, A.; Püttmann, W. Depositional environment of the Late Miocene Hausruck lignite (Alpine Foreland Basin): Insights from petrography, organic geochemistry, and stable carbon isotopes. Int. J. Coal Geol. 2003, 53, 153–180. [Google Scholar] [CrossRef]
  47. Otto, A.; Simoneit, B.R. Chemosystematics and diagenesis of terpenoids in fossil conifer species and sediment from the Eocene Zeitz formation, Saxony, Germany. Geochim. Cosmochim. Acta 2001, 65, 3505–3527. [Google Scholar] [CrossRef]
  48. Laflamme, R.E.; Hites, R.A. The global distribution of polycyclic aromatic hydrocarbons in recent sediments. Geochim. Cosmochim. Acta 1978, 42, 289–303. [Google Scholar] [CrossRef]
  49. Diefendorf, A.F.; Freeman, K.H.; Wing, S.L. A comparison of terpenoid and leaf fossil vegetation proxies in Paleocene and Eocene Bighorn Basin sediments. Org. Geochem. 2014, 71, 30–42. [Google Scholar] [CrossRef]
  50. Rohmer, M.; Bisseret, P.; Neunlist, S. The hopanoids, prokaryotic triterpenoids and precursors of ubiquitous molecular fossils. Biol. Markers Sediments Pet. 1992, 54, 1–17. [Google Scholar]
  51. Talbot, H.M.; Farrimond, P. Bacterial populations recorded in diverse sedimentary biohopanoid distributions. Org. Geochem. 2007, 38, 1212–1225. [Google Scholar] [CrossRef]
  52. Wang, Y.; Bao, Y.; Hu, Y. Recent progress in improving the yield of microbially enhanced coalbed methane production. Energy Rep. 2023, 9, 2810–2819. [Google Scholar] [CrossRef]
  53. Blumenberg, M.; Naafs, B.D.A.; Lückge, A.; Lauretano, V.; Schefuß, E.; Galloway, J.M.; Scheeder, G.; Reinhardt, L. Biomarker Reconstruction of a High-Latitude Late Paleocene to Early Eocene Coal Swamp Environment Across the PETM and ETM-2 (Ellesmere Island, Arctic Canada). Paleoceanogr. Paleoclimatol. 2024, 39, e2023PA004712. [Google Scholar] [CrossRef]
  54. Marshall, C.; Large, D.J.; Meredith, W.; Snape, C.E.; Uguna, C.; Spiro, B.F.; Orheim, A.; Jochmann, M.; Mokogwu, I.; Wang, Y.; et al. Geochemistry and petrology of Palaeocene coals from Spitsbergen—Part 1: Oil potential and depositional environment. Int. J. Coal Geol. 2015, 143, 22–33. [Google Scholar] [CrossRef]
  55. Cranwell, P.A.; Eglinton, G.; Robinson, N. Lipids of aquatic organisms as potential contributors to lacustrine sediments—II. Org. Geochem. 1987, 11, 513–527. [Google Scholar] [CrossRef]
  56. Havelcová, M.; Sýkorová, I.; Trejtnarová, H.; Šulc, A. Identification of organic matter in lignite samples from basins in the Czech Republic, Geochemical and petrographic properties in relation to lithotype. Fuel 2012, 99, 129–142. [Google Scholar] [CrossRef]
  57. Killops, S.D.; Funnell, R.H.; Suggate, R.P.; Sykes, R.; Peters, K.E.; Walters, C.; Woolhouse, A.D.; Weston, R.J.; Boudou, J.P. Predicting generation and expulsion of paraffinic oil from vitrinite–rich coals. Org. Geochem. 1998, 29, 1–21. [Google Scholar] [CrossRef]
  58. Boreham, C.J.; Horsfield, B.; Schenk, H.J. Predicting the quantities of oil and gas generated fromAustralian Permian coals, Bowen Basin using pyrolyticmethods. Mar. Pet. Geol. 1999, 16, 165–188. [Google Scholar] [CrossRef]
  59. Zhang, J.; Liang, Y.; Harpalani, S. Optimization of methane production from bituminous coal through biogasification. Appl. Energy 2016, 183, 31–42. [Google Scholar] [CrossRef]
  60. Yang, L.; Zhang, Y.; Hao, Z.; Ding, D.; Liu, Z. Clean utilization of lignite to produce biomethane by optimizing the microbial community. Energy 2023, 262, 125533. [Google Scholar] [CrossRef]
  61. Huang, H.; Wang, E. A laboratory investigation of the impact of solvent treatment on the permeability of bituminous coal from Western Canada with a focus on microbial in-situ processing of coals. Energy 2020, 210, 118542. [Google Scholar] [CrossRef]
Figure 1. Geological map of the Fushun Basin with the location of our sampling site (modified from Meng et al. [25]).
Energies 18 00519 g001
Figure 2. The stratigraphy of the Guchengzi Formation in the eastern open mining pit of the Fushun Basin, along with the distribution of the sampling section.
Energies 18 00519 g002
Figure 3. Profiles of bulk organic compositions in studied section. (a) TOC content; (b) Hydrogen Index (HI); (c) soluble organic matter (SOM).
Energies 18 00519 g003
Figure 4. Hydrocarbon yield (S1 and S2) and TOC correlations, SOM analysis, and kerogen characterization in carbonaceous mudstones and coals. C. mudstn: carbonaceous mudstone (applies to the legend in subsequent figures). (a) TOC versus S2; (b) S1 versus S2; (c) SOM versus S1; and (d) HI versus Tmax.
Energies 18 00519 g004
Figure 5. Total ion chromatograms (TICs) of saturated hydrocarbon fractions from representative samples with low and high HI values in carbonaceous mudstone and coals of the Guchengzi Formation. n-Alkanes are labeled based on their carbon number. i-C16—2,6,10-trimethyl tridecane; Pr—pristane; Ph—phytane; 191a and 191b—base peak with m/z = 191 sesquiterpanes; 193—base peak with m/z = 193 sesquiterpanes; NPm—norpimarane; Pm—pimarane; NAb—norabietane; Ab—abietane; Tm—C27, 17α (H)-22,29,30-trisnorneohopane; 29–33H—C29-C33 17α, 21β hopanes.
Energies 18 00519 g005
Figure 6. Relation between n-alkane-related parameters and HI values in the analyzed samples. (a) ∑n-C20/∑n-C21+ vs. HI; (b) Paq vs. HI; (c) n-C31/(C27 + C29 + C31) vs. HI; (d) CPI vs. HI.
Energies 18 00519 g006
Figure 7. (a) Relation between Pr/Ph and HI values; (b) Relation between Pr/n-C17 and Ph/n-C18 ratios in studied samples.
Energies 18 00519 g007
Figure 8. Relation between sesqui- and diterpane-related parameters and HI values in the analyzed samples. (a) Dramanes/patchoulanes vs. HI; (b) Rdit vs. HI.
Energies 18 00519 g008
Figure 9. Relation between hopane-related parameters and HI values in the studied samples. (a) C29H/C30H vs. HI; (b) Hopanes/n-(C27 + C29 + C31) vs. HI; (c) Hopanes (μg/g SOM) vs. HI; (d) Hopanes (μg/g TOC) vs. HI.
Energies 18 00519 g009
Figure 10. Relation between C27/C29 St and HI values (a) and between ∑Hopanes/∑Steranes and HI values (b) in the studied samples.
Energies 18 00519 g010
Figure 11. TICs of aromatic hydrocarbon fractions from samples with low and high HI values in carbonaceous mudstone and coals of the Guchengzi Formation. Peak assignments are as follows: MN—methylnaphthalene; DMN—dimethylnaphthalenes; TeHTeMN—1,2,3,4-tetrahydro-2,2,5,7-tetramethylnaphthalene; PMDHIn—1,1,4,5,6-pentamethyl-2,3-dihydro-1H-indene; C3N—trimethylnaphthalenes (TMN); Cad—cadalene (4-isopropyl-1,6-dimethylnapthalene); iP-iHMN—6-isopropyl-2-methyl-1-(4-methylpentyl)naphthalene; P—phenanthrene; MP—methylphenanthrenes; DMP—dimethylphenanthrenes; DHAb—dehydroabietane; Sim—simonellite; Ret—retene; MRet—methylretenes.
Energies 18 00519 g011
Figure 12. Relation between source input and the degree of diterpenoid aromatization parameters and HI values in the examined samples: (a) Retene/Cadalene vs. HI values; (b) Norpimare/Retene vs. HI values; (c) Dehydroabietane/Simonellite vs. HI values; (d) Simonellite/Retene vs. HI values.
Energies 18 00519 g012
Disclaimer/Publisher’s Note: The statements, opinions and data contained in all publications are solely those of the individual author(s) and contributor(s) and not of MDPI and/or the editor(s). MDPI and/or the editor(s) disclaim responsibility for any injury to people or property resulting from any ideas, methods, instructions or products referred to in the content.

