Article

Quantitative Analysis Method of Conversion of Type of Microscopic Remaining Oil Based on CT Technology

1
Research Institute of Petroleum Exploration and Development, Petrochina, Beijing 100083, China
2
Institute of Porous Flow and Fluid Mechanics, Chinese Academy of Sciences, Langfang 065007, China
*
Author to whom correspondence should be addressed.
Energies 2025, 18(3), 563; https://doi.org/10.3390/en18030563
Submission received: 10 December 2024 / Revised: 15 January 2025 / Accepted: 15 January 2025 / Published: 25 January 2025
(This article belongs to the Section H: Geo-Energy)

Abstract

:
The distribution and mutual conversion of remaining oil during the process of oilfield development constitute an important basis for guiding the exploitation of remaining oil potential. Based on the visual core displacement method of CT scanning technology, CT scanning images of the oil–water phase in core models at different displacement stages were obtained, and the remaining oil types were classified. On this basis, image segmentation technology was employed to establish the transformation analysis method of remaining oil types, and the mutual transformation of microscopic remaining oil types at different displacement stages was clarified. The ability of displacement media to utilize various remaining oils was further clarified. The results demonstrate that there are significant differences in the distribution of remaining oil after the injection of different displacement media. The displacement media can not only spread the continuous-phase oil in large pores to varying degrees but also transform the discontinuous oil into continuous-phase oil in some small pore tubes, showing a “converging” transformation law, thereby enhancing the utilization degree of various remaining oils. Additionally, the surfactant’s unique capabilities of “micellar solubilization, emulsification, and oil carrying” have good adaptability to the discontinuous oil phase and can transform the discontinuous-phase remaining oil into continuous-phase remaining oil, namely columnar–film–cluster–recovery.

1. Introduction

In recent years, the majority of oilfields in China have stepped into the medium-to-high water-cut stage [1], where the macroscopic residual oil is highly scattered, resulting in a gradual reduction in oil output [2,3,4]. Hence, the study of residual oil holds great significance for the further exploitation of oilfields. The research emphasis lies in clarifying the status of residual oil in different exploitation phases (water injection phase, chemical flooding phase, and subsequent water flooding phase) [5,6,7,8], the extent of utilization [9,10], and the type of transformation [11].
At present, two principal approaches are adopted to study microscopic residual oil. The first one is the direct method, which relies on imaging technology to depict the distribution of remaining oil in diverse development stages, such as microscopic glass etching models, fluorescence analysis, nuclear magnetic resonance, and other techniques. Some scholars employ microscopic glass etching models to visualize the formation and distribution of remaining oil during water flooding, predict the potential exploitation of remaining oil, and present the distribution law of remaining oil by varying different influencing factors, like displacement speed and viscosity ratio [12,13,14]. Hou Jian et al. [15,16] carried out oil displacement experiments based on the microscopic glass etching model, summarized the formation mechanism of remaining oil, divided the occurrence state of remaining oil, and quantitatively described the geometric shape of the microscopic remaining oil through the shape index in graphics. The fluorescence analysis method distinguishes the oil–water layer based on the variance of fluorescence intensity emitted by ground-state electrons after excited transition when the fluid (water) is exposed to the light quantum irradiated by a special light source. Based on this characteristic, the microscopic oil–water occurrence state and proportion in different development stages are determined [8,11]. Since nuclear magnetic resonance technology has been widely utilized in the field of rock analysis, it is often adopted to simulate oil by dehydrogenation to shield water signals and obtain the distribution law of oil and water in pores [7,10]. These direct methods can merely simulate the occurrence state and distribution law of remaining oil on the two-dimensional plane and fail to present the proportion of crude oil utilization and the distribution characteristics of remaining oil in the three-dimensional space. The other method is the indirect method; namely, a mathematical simulation model is established and described by a computer. The advantage of this method lies in that it is not influenced by external conditions, such as geological complexity, experimental conditions, sample representativeness, etc., and can present the evolution law of residual oil in three-dimensional space [17,18,19]. However, the law of oil–water two-phase seepage in the reservoir is complex, and it is challenging to establish an accurate mathematical model [20,21]. Some scholars [19,20,21] consider the effects of pore heterogeneity, rock wettability, and other factors on the formation and distribution of residual oil based on the micro-residual oil simulation model. Currently, regardless of whether the direct method or the indirect method is used, few problems related to the transformation of remaining oil types are involved. Assuming that certain means can clarify the transformation problems of remaining oil types in different stages of reservoir development, it is bound to assist researchers in further understanding the oil displacement mechanism.
Owing to its strong stability and high resolution characteristics, CT technology has been extensively applied in the field of petroleum geology and has facilitated the quantitative characterization of microscopic remaining oil [5,9,22,23,24,25]. In this article, by integrating indoor displacement experiments, Micro-CT scanning technology, image processing technology, and programming technology, CT scanning imaging was conducted for sandstone cores in the Daqing Saartu oil formation at different stages (water flooding stage, surfactant flooding, and subsequent water flooding), and image processing technology was employed to obtain the mutual conversion mechanism of remaining oil types at various stages and the actual utilization degree of diverse remaining oil types. The adaptability of different displacement media to various remaining oils was determined [26,27,28,29].

2. Principle of the Conversion of Remaining Oil Types

During the process of waterflood development, the water absorption of each layer varies significantly. The rapid advancement of the water phase along the high-permeability zone forms the “advantageous channel”, and the uneven advancement of the vertical and planar low-permeability zones leads to a small water drive sweep volume, resulting in the scattered and relatively enriched distribution of remaining oil. Therefore, it is a prerequisite to clarify the types of microscopic remaining oil. Li J.J. et al. [9,24] utilized image segmentation technology to categorize the remaining oil into five types based on the specific Euler number, shape factor, and contact ratio, namely cluster, porous, columnar, film, and isolated. This paper will adopt the classification method to complete the transformation of micro-residual oil types and utilization ratios in different stages.
Based on image processing technology, the types of remaining oil were classified into CT scan images at different stages (Figure 1).
The composition and proportion of pixels at the identical position in diverse stages were selected. That is, the proportion of remaining oil was determined, along with the type and proportion of remaining oil that could be transformed at different stages, such as cluster remaining oil, the type and proportion of convertible remaining oil, and the proportion of cluster remaining oil production at a certain stage. Taking the conversion of cluster residual oil in the saturated oil–water flooding process as an instance, the specific process is depicted in Figure 2. Figure 2a presents the 3D topology of the clustered remaining oil in the saturated oil state, where oil clusters exhibit large continuous phases. After water flooding to a certain extent, the whereabouts of oil clusters are categorized into two types: the first type of oil clusters are gradually dispersed, and the areas affected by water are produced with injected water (Figure 2c); the second type of oil cluster is the unused cluster residual oil. This portion of the cluster residual oil constitutes a large proportion and exists in the area far from the dominant channel; thus, the sweep amplitude is small, and it commences to transform into a discontinuous phase, that is, from cluster to porous, columnar, film, and other remaining oil types (Figure 2b). Similarly, after the conclusion of water flooding, the composition of the cluster remaining oil can be divided into two categories. The first type is the cluster remaining oil that has not been driven by water or has not been fully utilized (Figure 2f), which is the main target for the further exploration of the potential of the oilfield. Another type of cluster residual oil originates from the transformation of porous, columnar, and other residual oils (Figure 2d,e). The proportion of cluster remaining oil is mainly influenced by the transformation type of remaining oil and the heterogeneity of the micro-pore throat structure. For the reservoirs with complex microstructures, small pore throats, and strong heterogeneity, the remaining oil type conversion is prone to occur due to the dominant capillary action during waterflood development.
In this regard, the core in the low-permeability zone of the Daqing Oilfield was chosen for displacement experiments at diverse stages, covering water displacement, surfactant displacement, and subsequent water displacement. CT in situ scanning imaging was implemented to quantitatively depict the conversion ratio of remaining oil types in low-permeability reservoirs and to examine the adaptability and utilization capability of different displacement media to various remaining oil types.

3. Results and Discussion

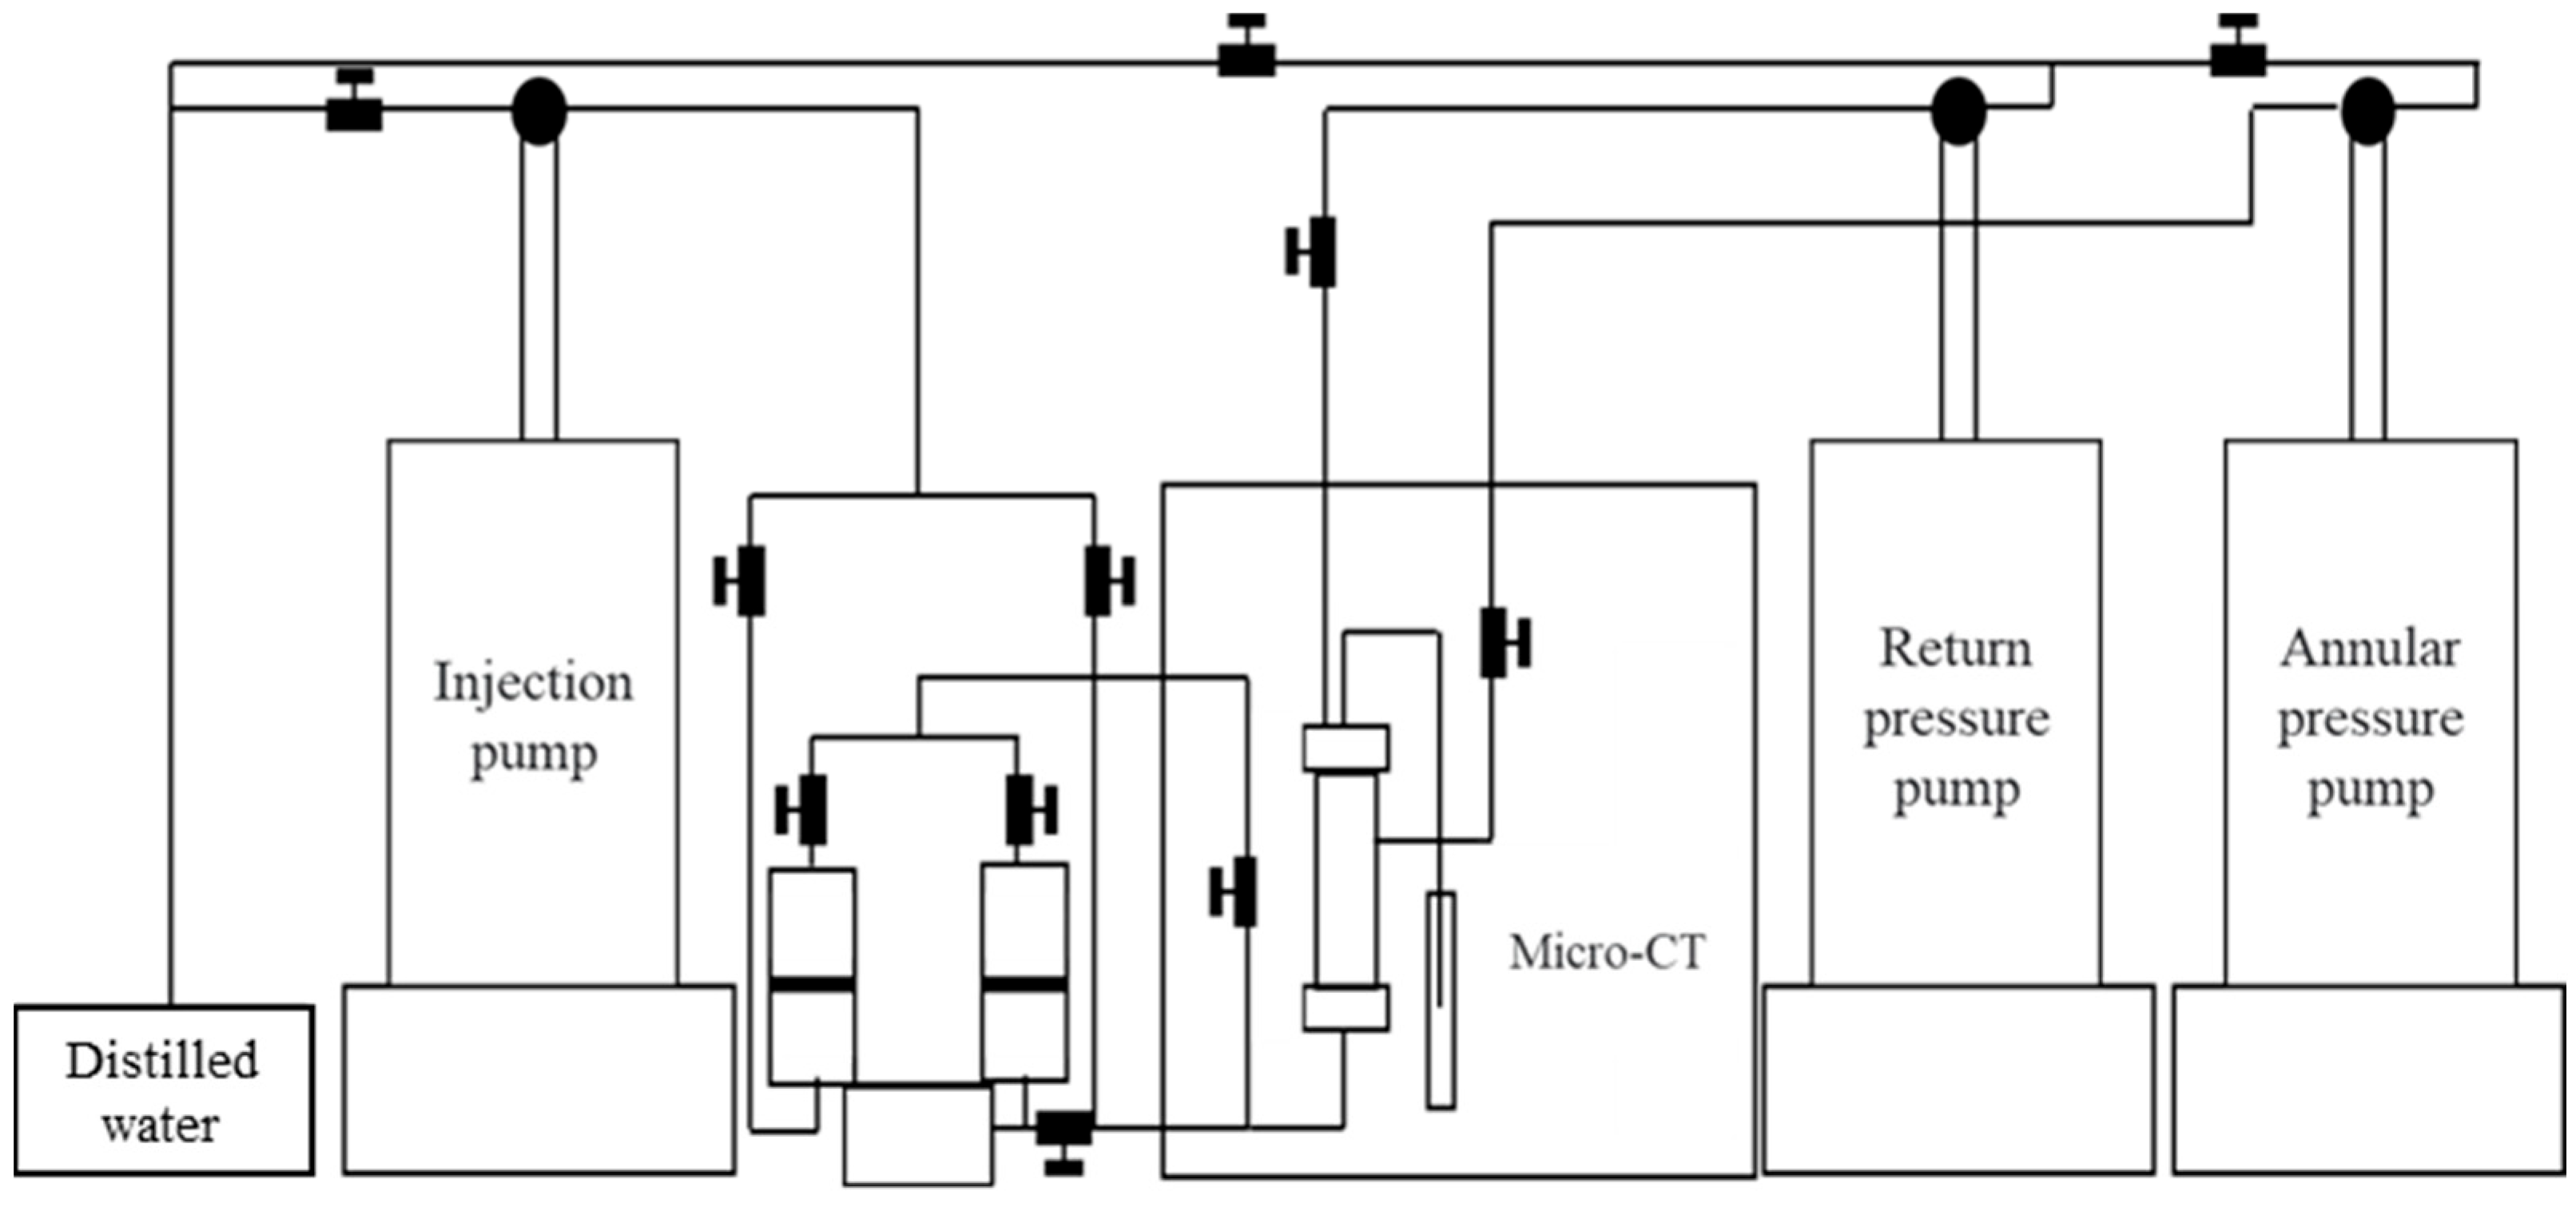
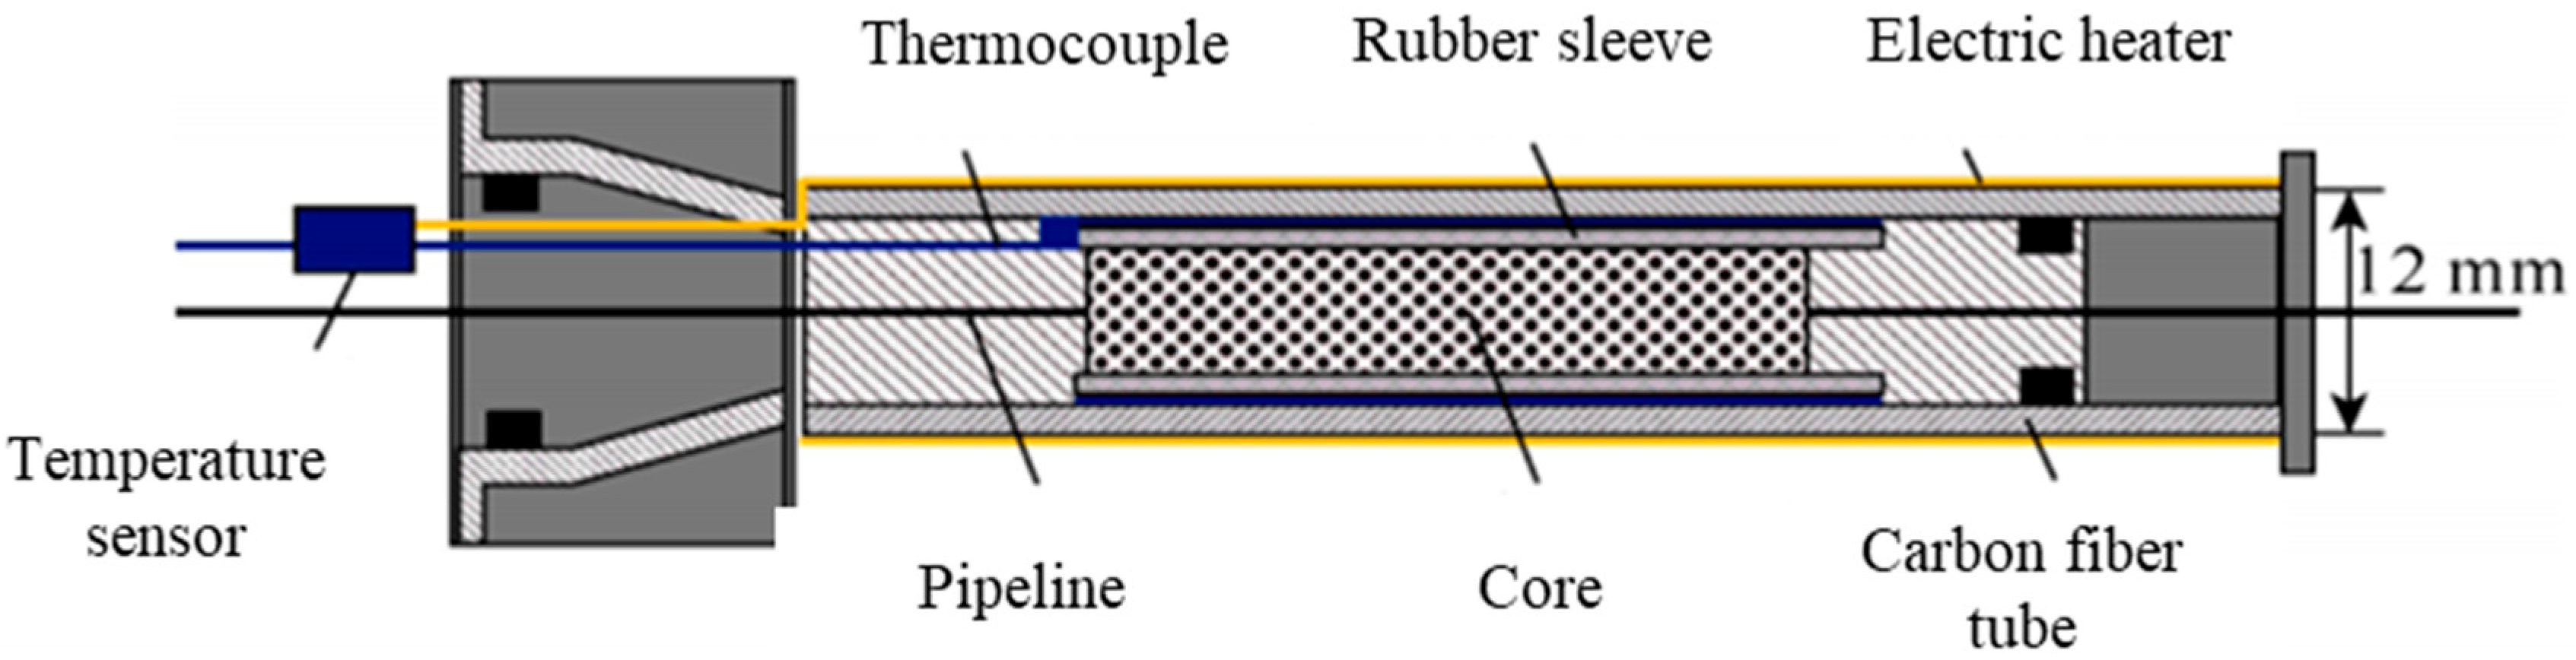
3.1. Experimental Equipment

The experimental device comprises three parts: the microinjection system, the oil–water seepage simulation system, and the CT scanning imaging system (Figure 3).
  • Microinjection system: This consists of an ISCO 100DX (TELEDYNE-ISCO, New York, NY, USA) metering pump and an intermediate container (50 mL), which is utilized to control the displacement flow rate, multiple injections, etc., in the oil–water displacement simulation experiment.
  • Oil–water seepage simulation system: The special core gripper [25] (Figure 4), made of carbon fiber resistant to high temperatures and high pressures, is employed to achieve online in situ CT scanning [9,23,25] and auxiliary heating functions.
  • CT scanning imaging system: This is composed of a MicroXCT-200 micron CT scanner (Xradia, New York, NY, USA). The X generated by the X-ray source in the MicroXCT-200 micron CT scanner is transformed into pixels with different resolutions by measuring the number of X-rays transmitted, thereby achieving the acquisition of the microscopic distribution image of the remaining oil inside the piston during the displacement process.

3.2. Experimental Consumables

  • A piece of conventional 2.5 cm clastic fine rock sand within the low-permeability zone of the Daqing Saartu oil formation was selected. Subsequently, a small core plunger with a diameter of 8 mm was drilled on this basis. Conventional parameters such as the core permeability and porosity of the two sizes were measured, respectively (Table 1).
2.
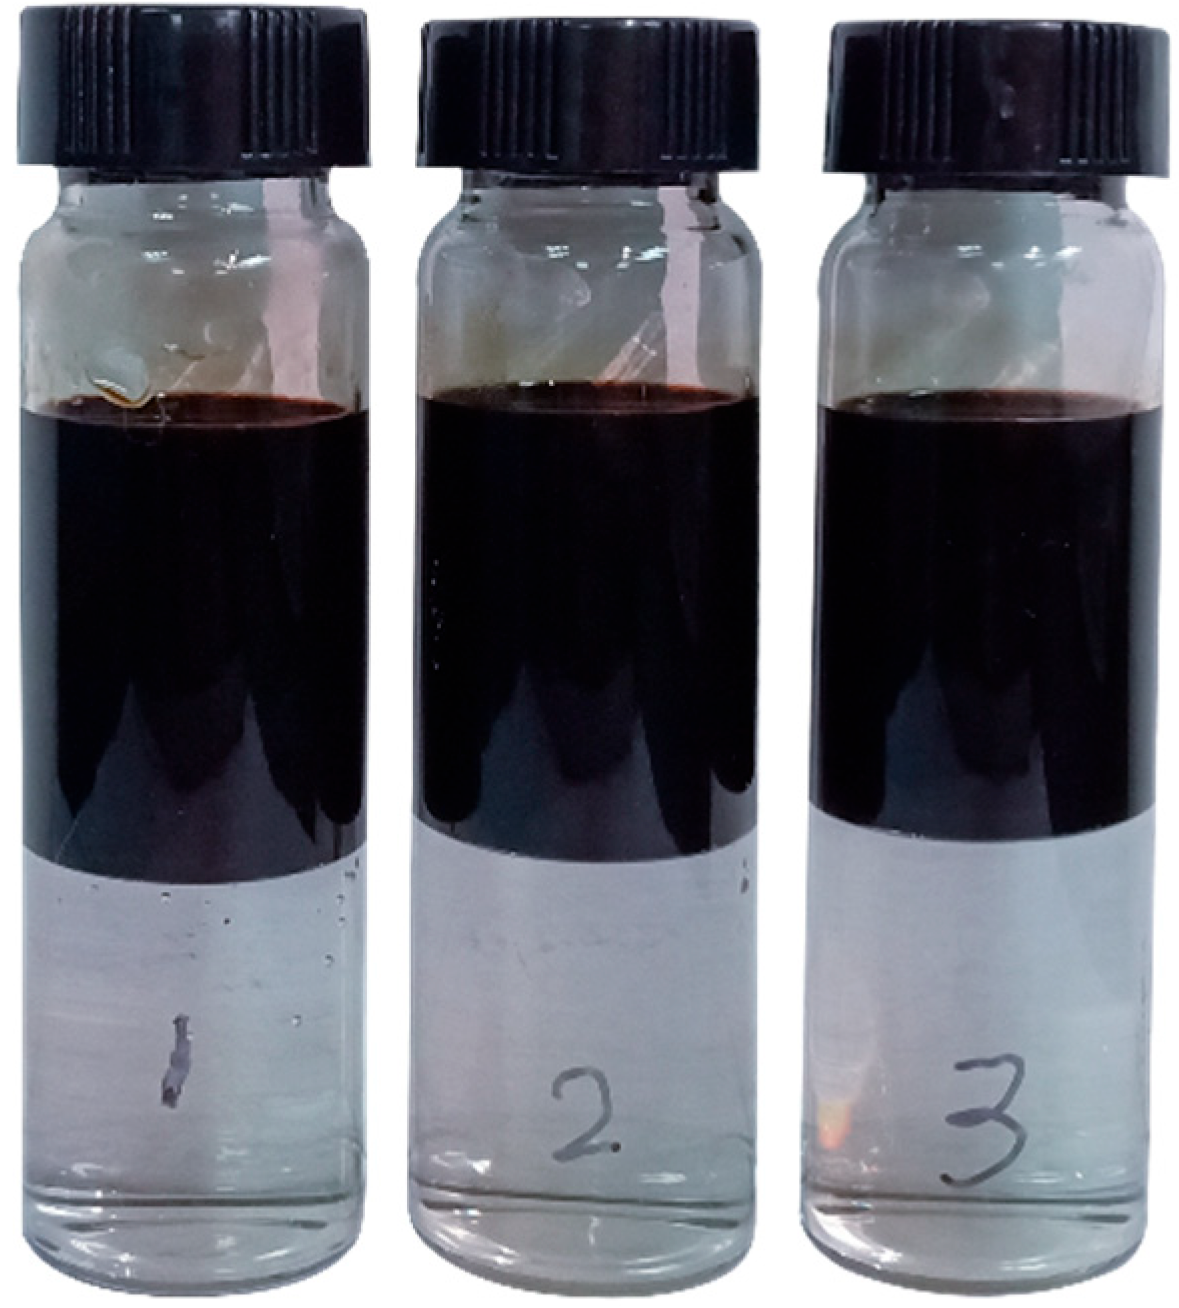
The experimental fluid comprises simulated formation water (with a salinity of 6778 mg/L), a petroleum sulfonate solution with a mass percentage of 0.2%, and simulated oil fabricated from crude oil and kerosene from Daqing No. 1 Plant. Li JJ et al. [9] discriminated the contrast of gray values of oil and water in CT scans and added 10% NaI to water. Nevertheless, the influence of brine salinity on the wettability of the plunger is neglected, which is significantly different from the actual formation water salinity in the reservoir. By adding CH2I2, the density disparity and gray value contrast between oil and water are amplified to enhance the accuracy of oil–water segmentation. The density, viscosity, and interfacial tension of the simulated oil and surfactant solution were, respectively, measured at room temperature and pressure (Table 2 and Figure 5).

3.3. Experimental Procedure

The experimental procedures were classified into three steps: (1) The rock sample was drilled, washed with oil, and dried, and the special core clamp was positioned within the CT scanner. The clamp was fixed on the platform of the CT scanner. The experimental temperature was normal. The confining pressure was elevated to 5 MPa, and nitrogen was injected until the pore pressure attained 2 MPa. The first dry CT scan was executed after 3–5 h of stabilization. (2) The small plunger pumped saturated water for 12 h each time and inundated it at a constant rate of 0.01 mL/min. After achieving stability, the small plunger water was calculated to measure the permeability. (3) The pore volume of 0.01 mL/min, 0.02 mL/min, and 0.05 mL/min constant rate oil flooding water was 10 times each, and the second CT scan was conducted after stability. (4) The third CT scan was carried out based on the actual injection rate on the site, which was approximately 0.027 mL/min, and a constant rate of water flooding was maintained until the moisture content of the produced liquid reached 100%. (5) The surfactant and subsequent water flooding were implemented at the same speed until the moisture content of the produced liquid reached 100%, respectively, and the fourth and fifth CT scans were performed.

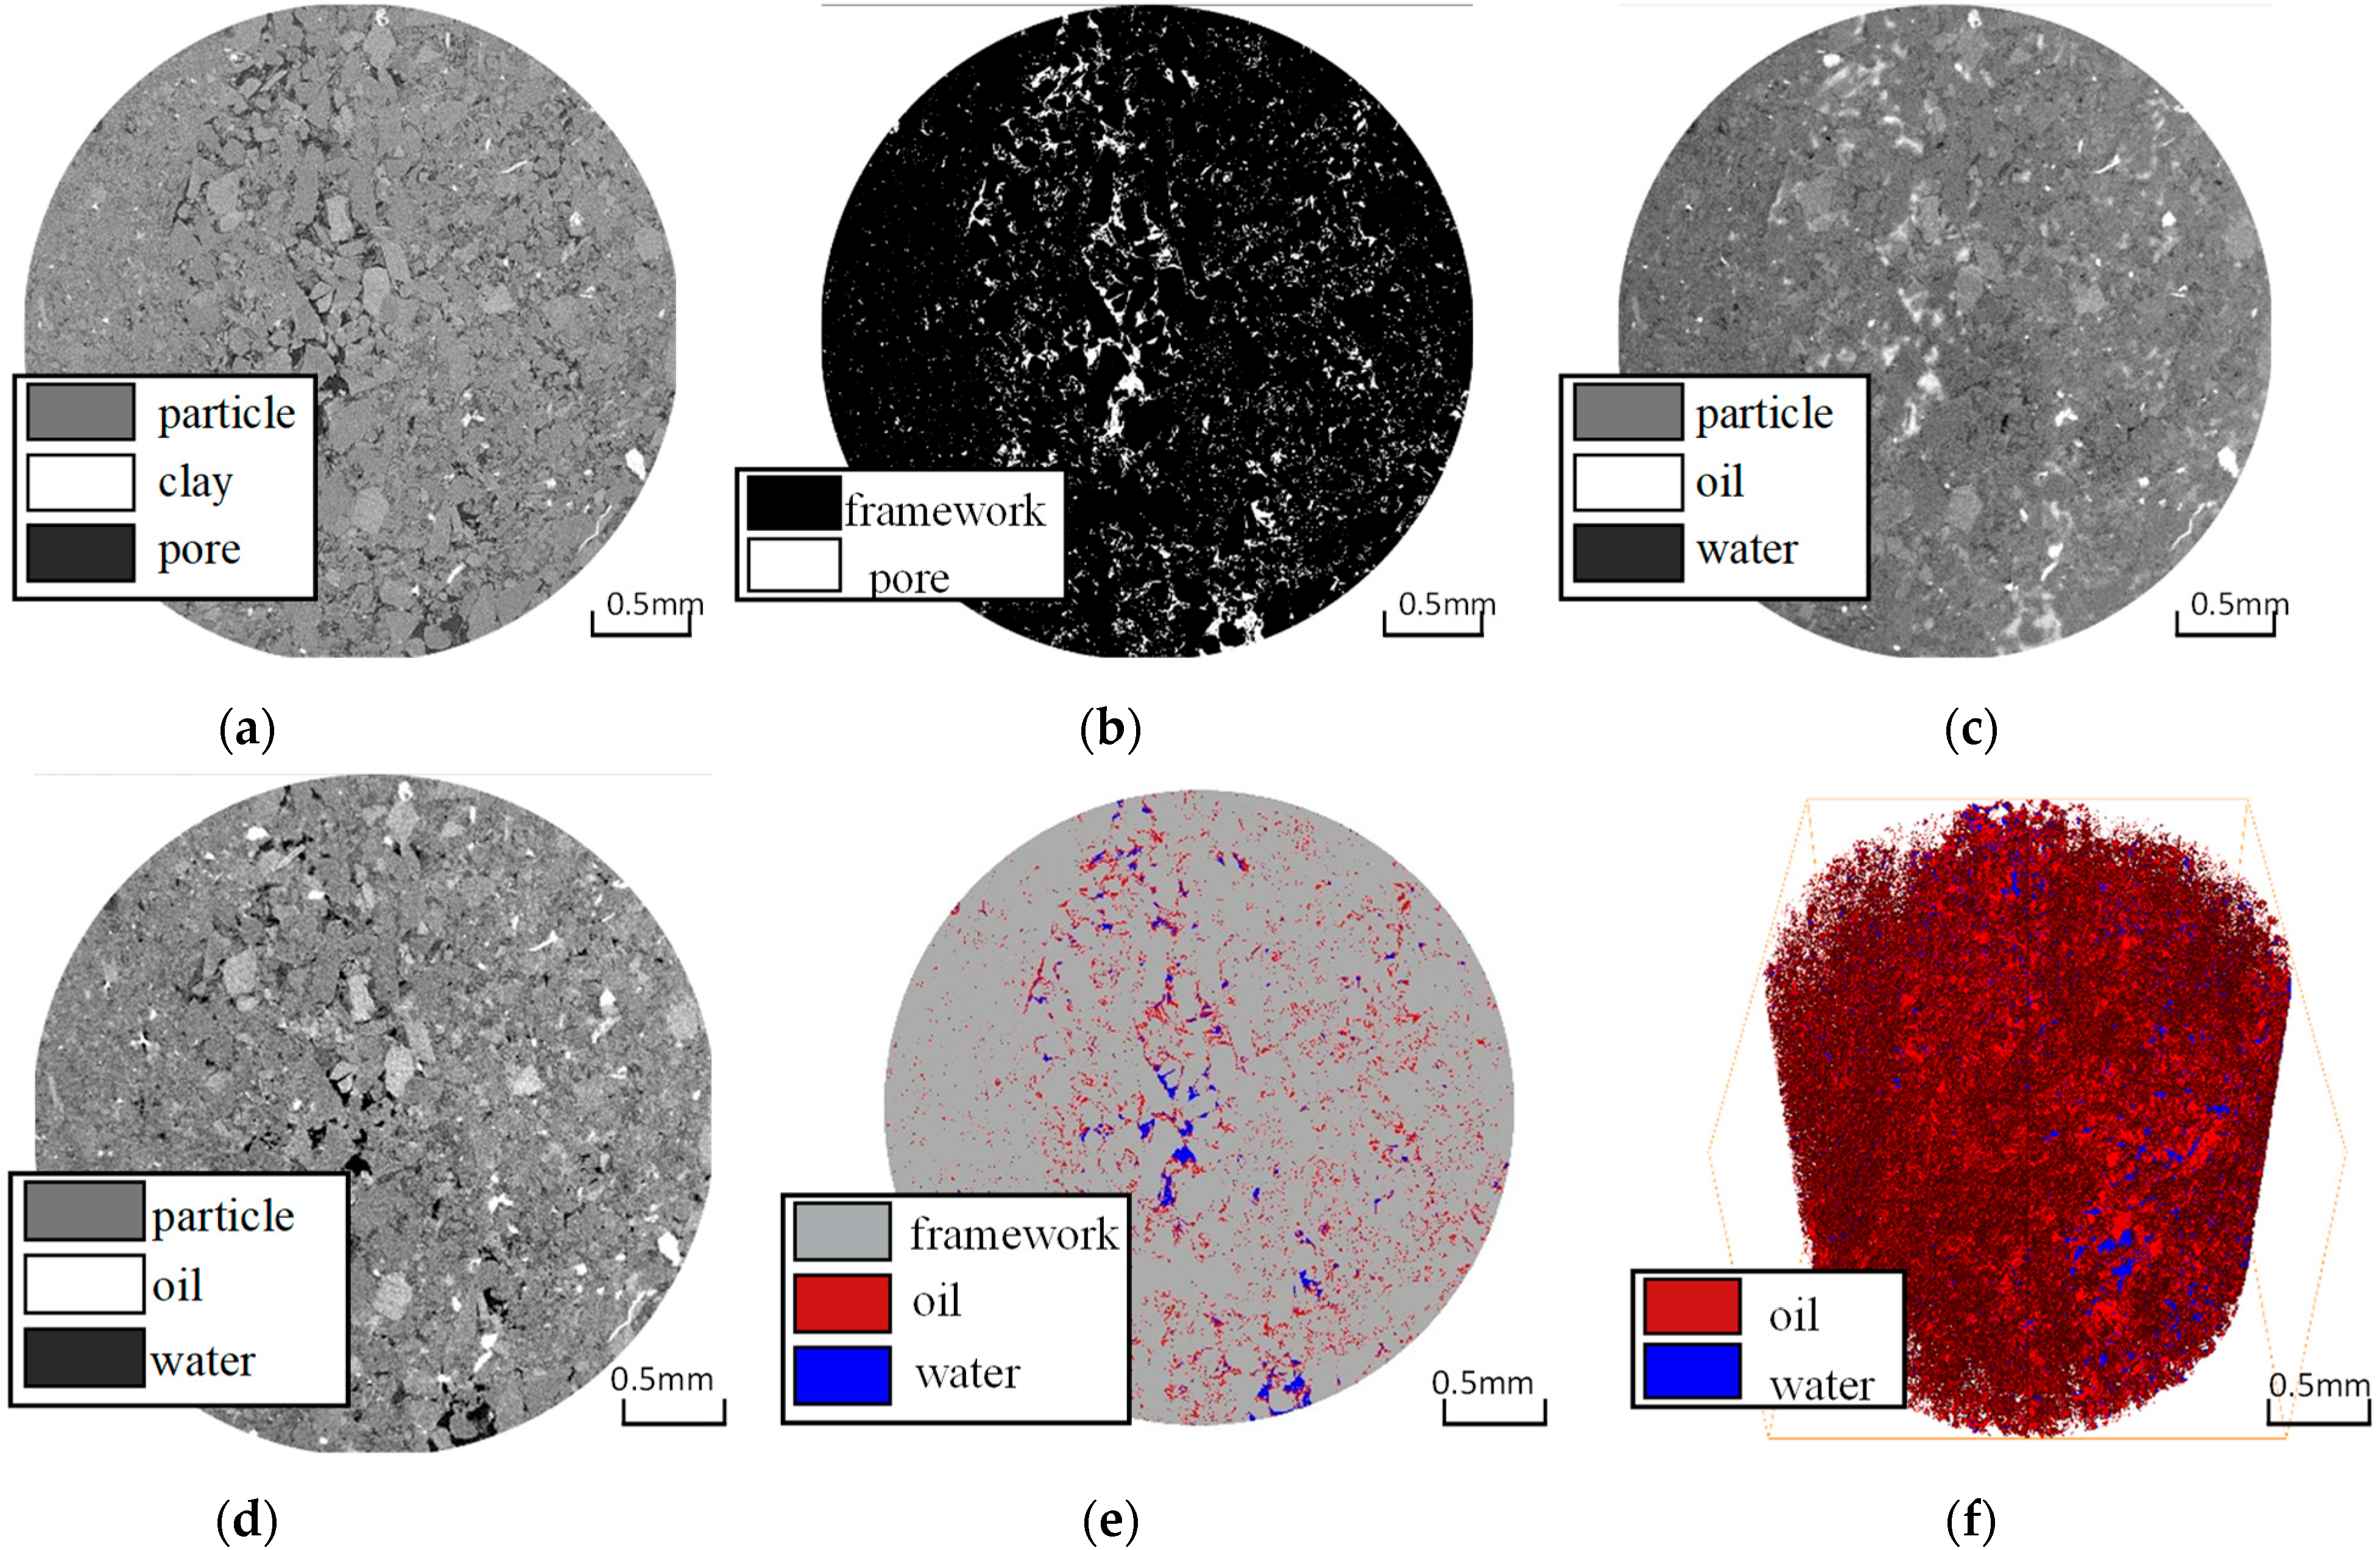
3.4. Manipulation of Images

The software “Imagel” (1.8.0) is utilized to undertake noise reduction, gray binarization, and color gamut adjustment on the reconstructed data subsequent to CT scanning. The distribution of gray value is modulated in accordance with the mineral density and atomic number within the rock. The greater the density and atomic number, the higher the gray value after scanning, which is manifested in the image as a more luminous color. Figure 6a constitutes a small plunger dry sweep map presenting a large gradient of gray value, facilitating the discrimination of the pore structure from the rock skeleton (refer to Figure 6b). The clay content is substantial, the pore distribution is dispersed, and the large and connected pores are mainly distributed in the center and lower edge area, accompanied by strong heterogeneity. After constant-velocity oil flooding (refer to Figure 6c), the gray values of the clay and oil phases are analogous, and the segmentation of threshold values is inclined to induce a considerable error. Hence, by taking the white areas common to Figure 6b,c, the actual oil phase distribution and proportion subsequent to the elimination of clay minerals can be acquired. When the identical method is applied to the CT scan images of different displacement stages, such as the water displacement stage (refer to Figure 6d), a three-phase segmentation diagram of the oil phase, water phase, and rock skeleton with high precision can be attained (refer to Figure 6e). Eventually, the oil–water three-dimensional recombination is executed, the remaining oil types are categorized (refer to Figure 6f), and the proportion of crude oil utilization and type transformation in different stages is determined.

4. Quantitative Analysis of Microscopic Residual Oil

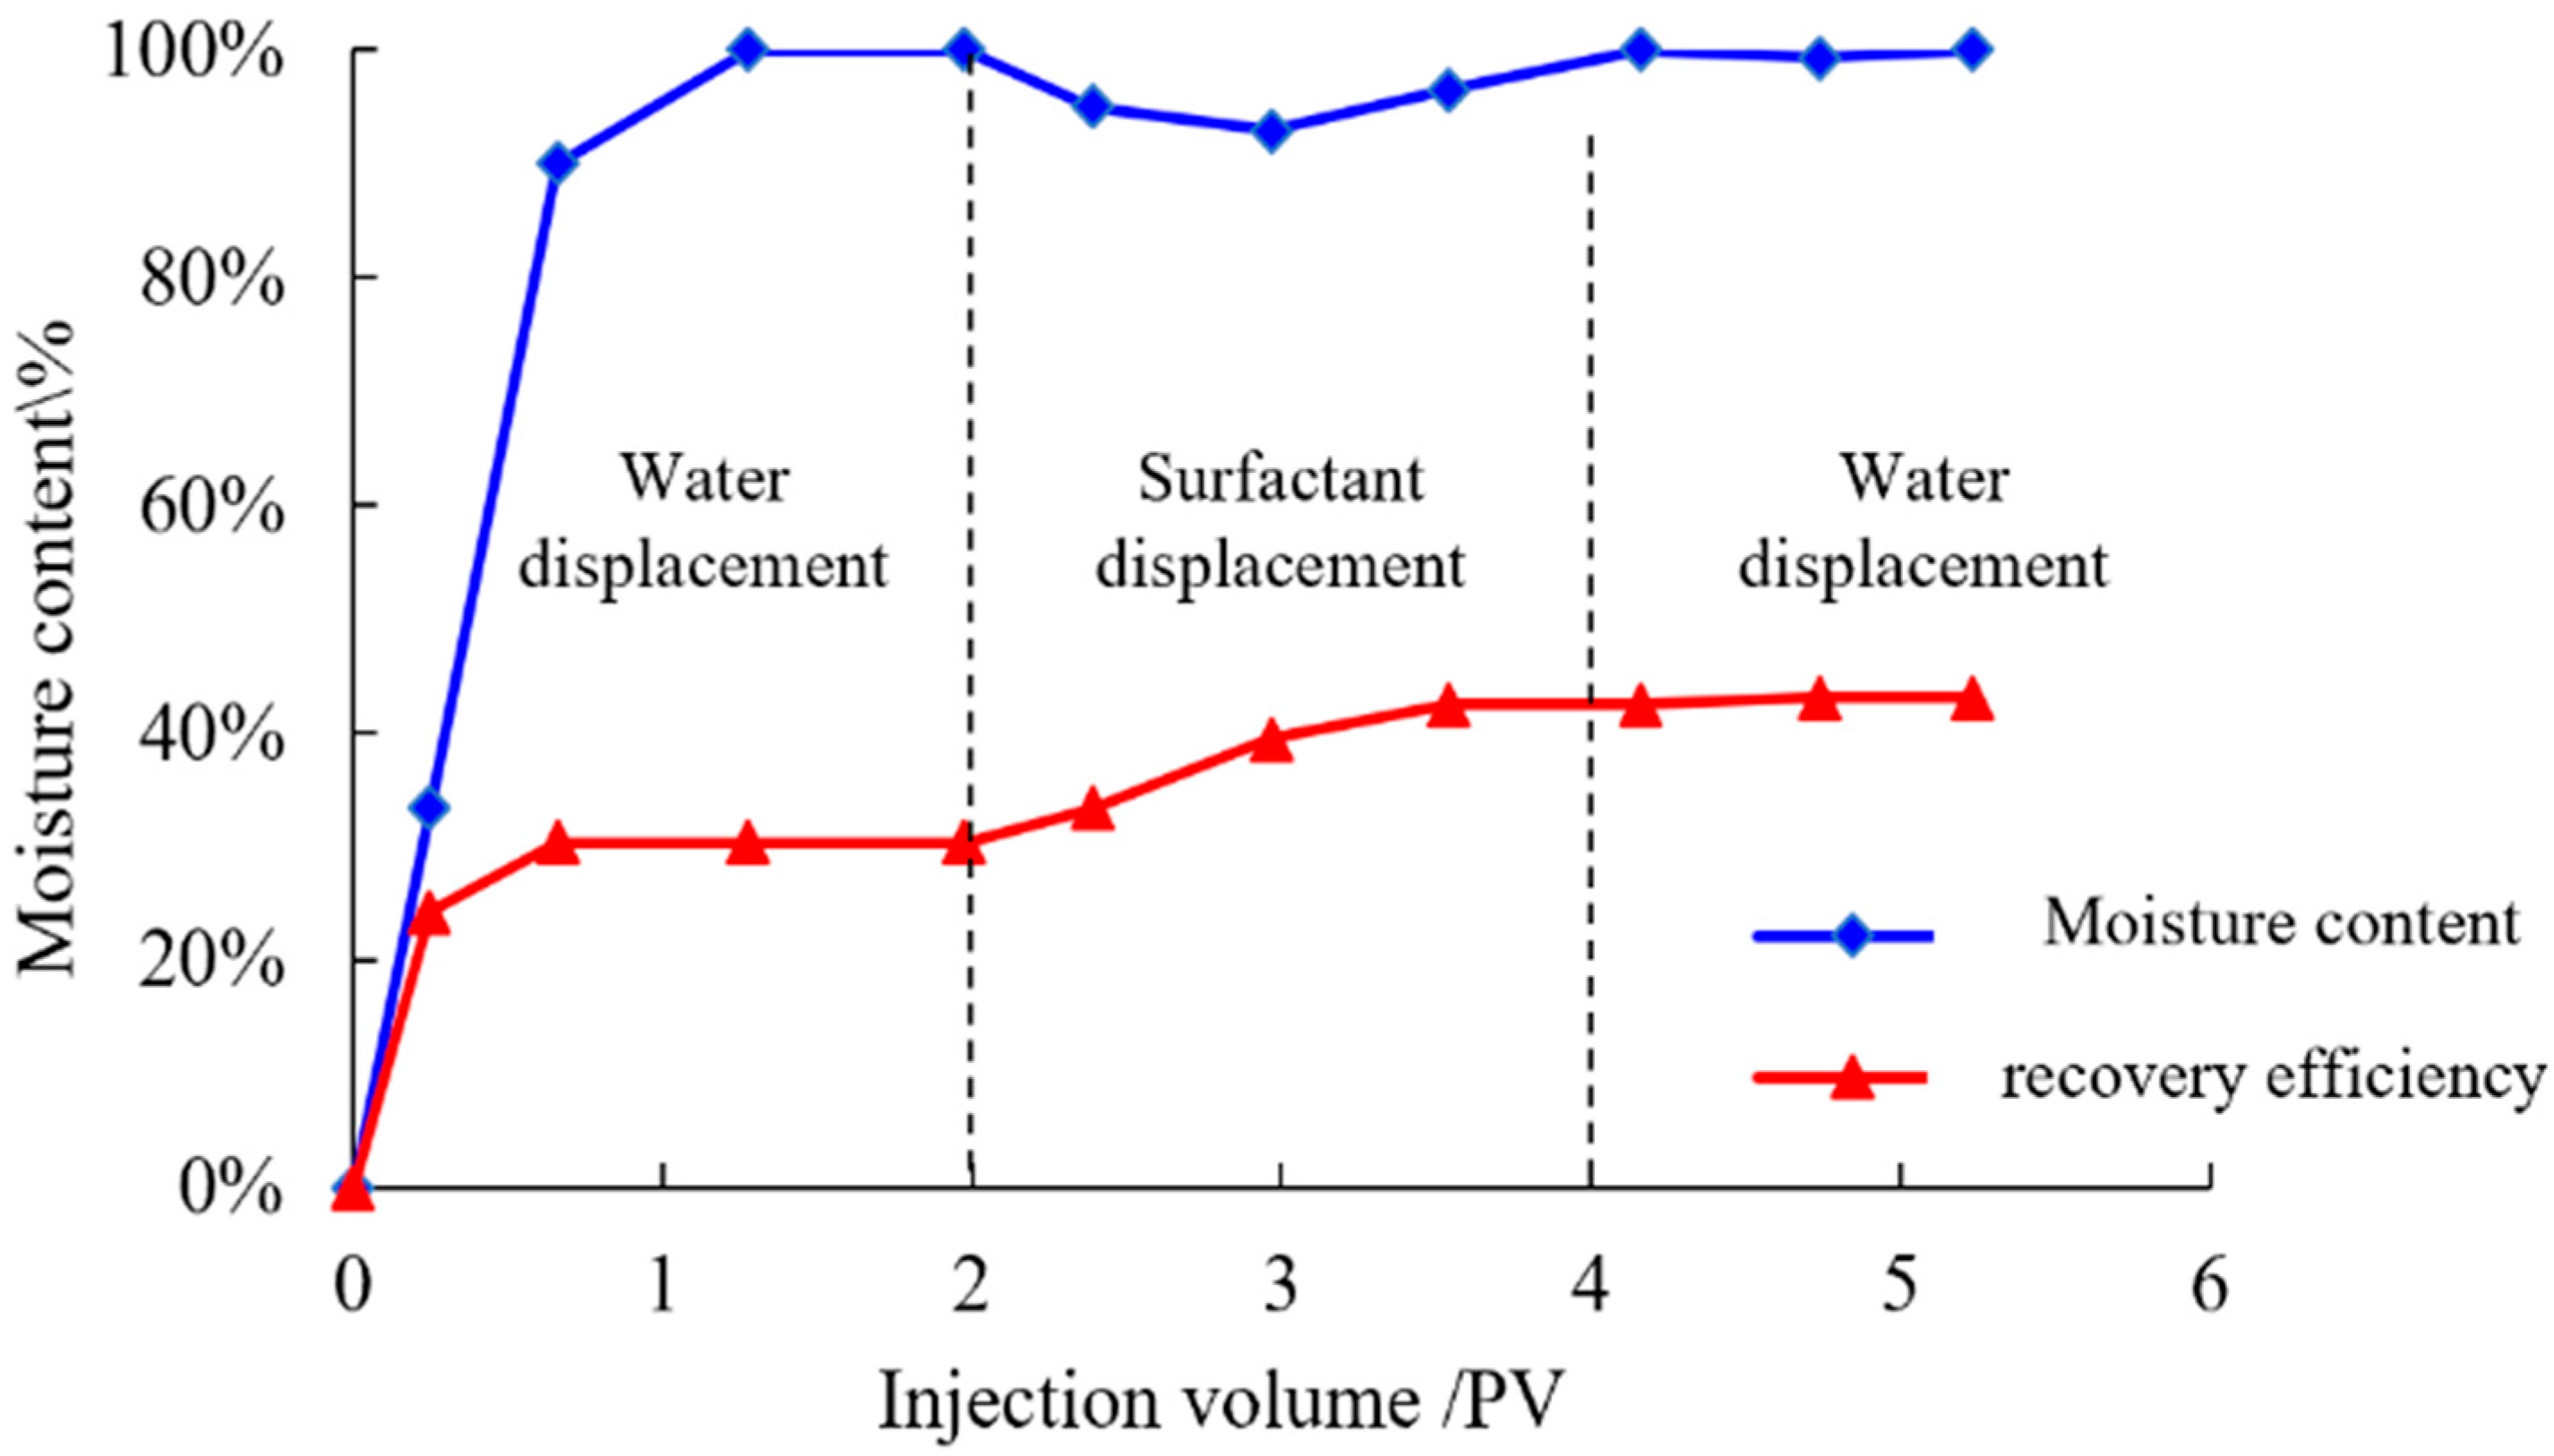
4.1. The Exploitation of Remaining Oil

Figure 7 delineates the variations in the utilization of remaining oil and alterations in water cuts during the entire displacement process. After 2PV of water flooding, the water cut attains 100%, and the recovery rate amounts to 30.3%. With 2PV of surfactant flooding, the water cut initially declines and subsequently increases. In comparison to the water flooding stage, the recovery rate ascends by 12.1 percentage points. After the subsequent 1PV of water flooding, the recovery rate experiences a marginal increase of merely 0.6%.
Surfactants are endowed with the capabilities of “micellar solubilization, emulsification, and oil carrying”. To disclose the surfactant’s ability to exploit residual oil from a mechanistic perspective, this paper will expound on the surfactant’s capacity to utilize five types of residual oil from an experimental viewpoint.

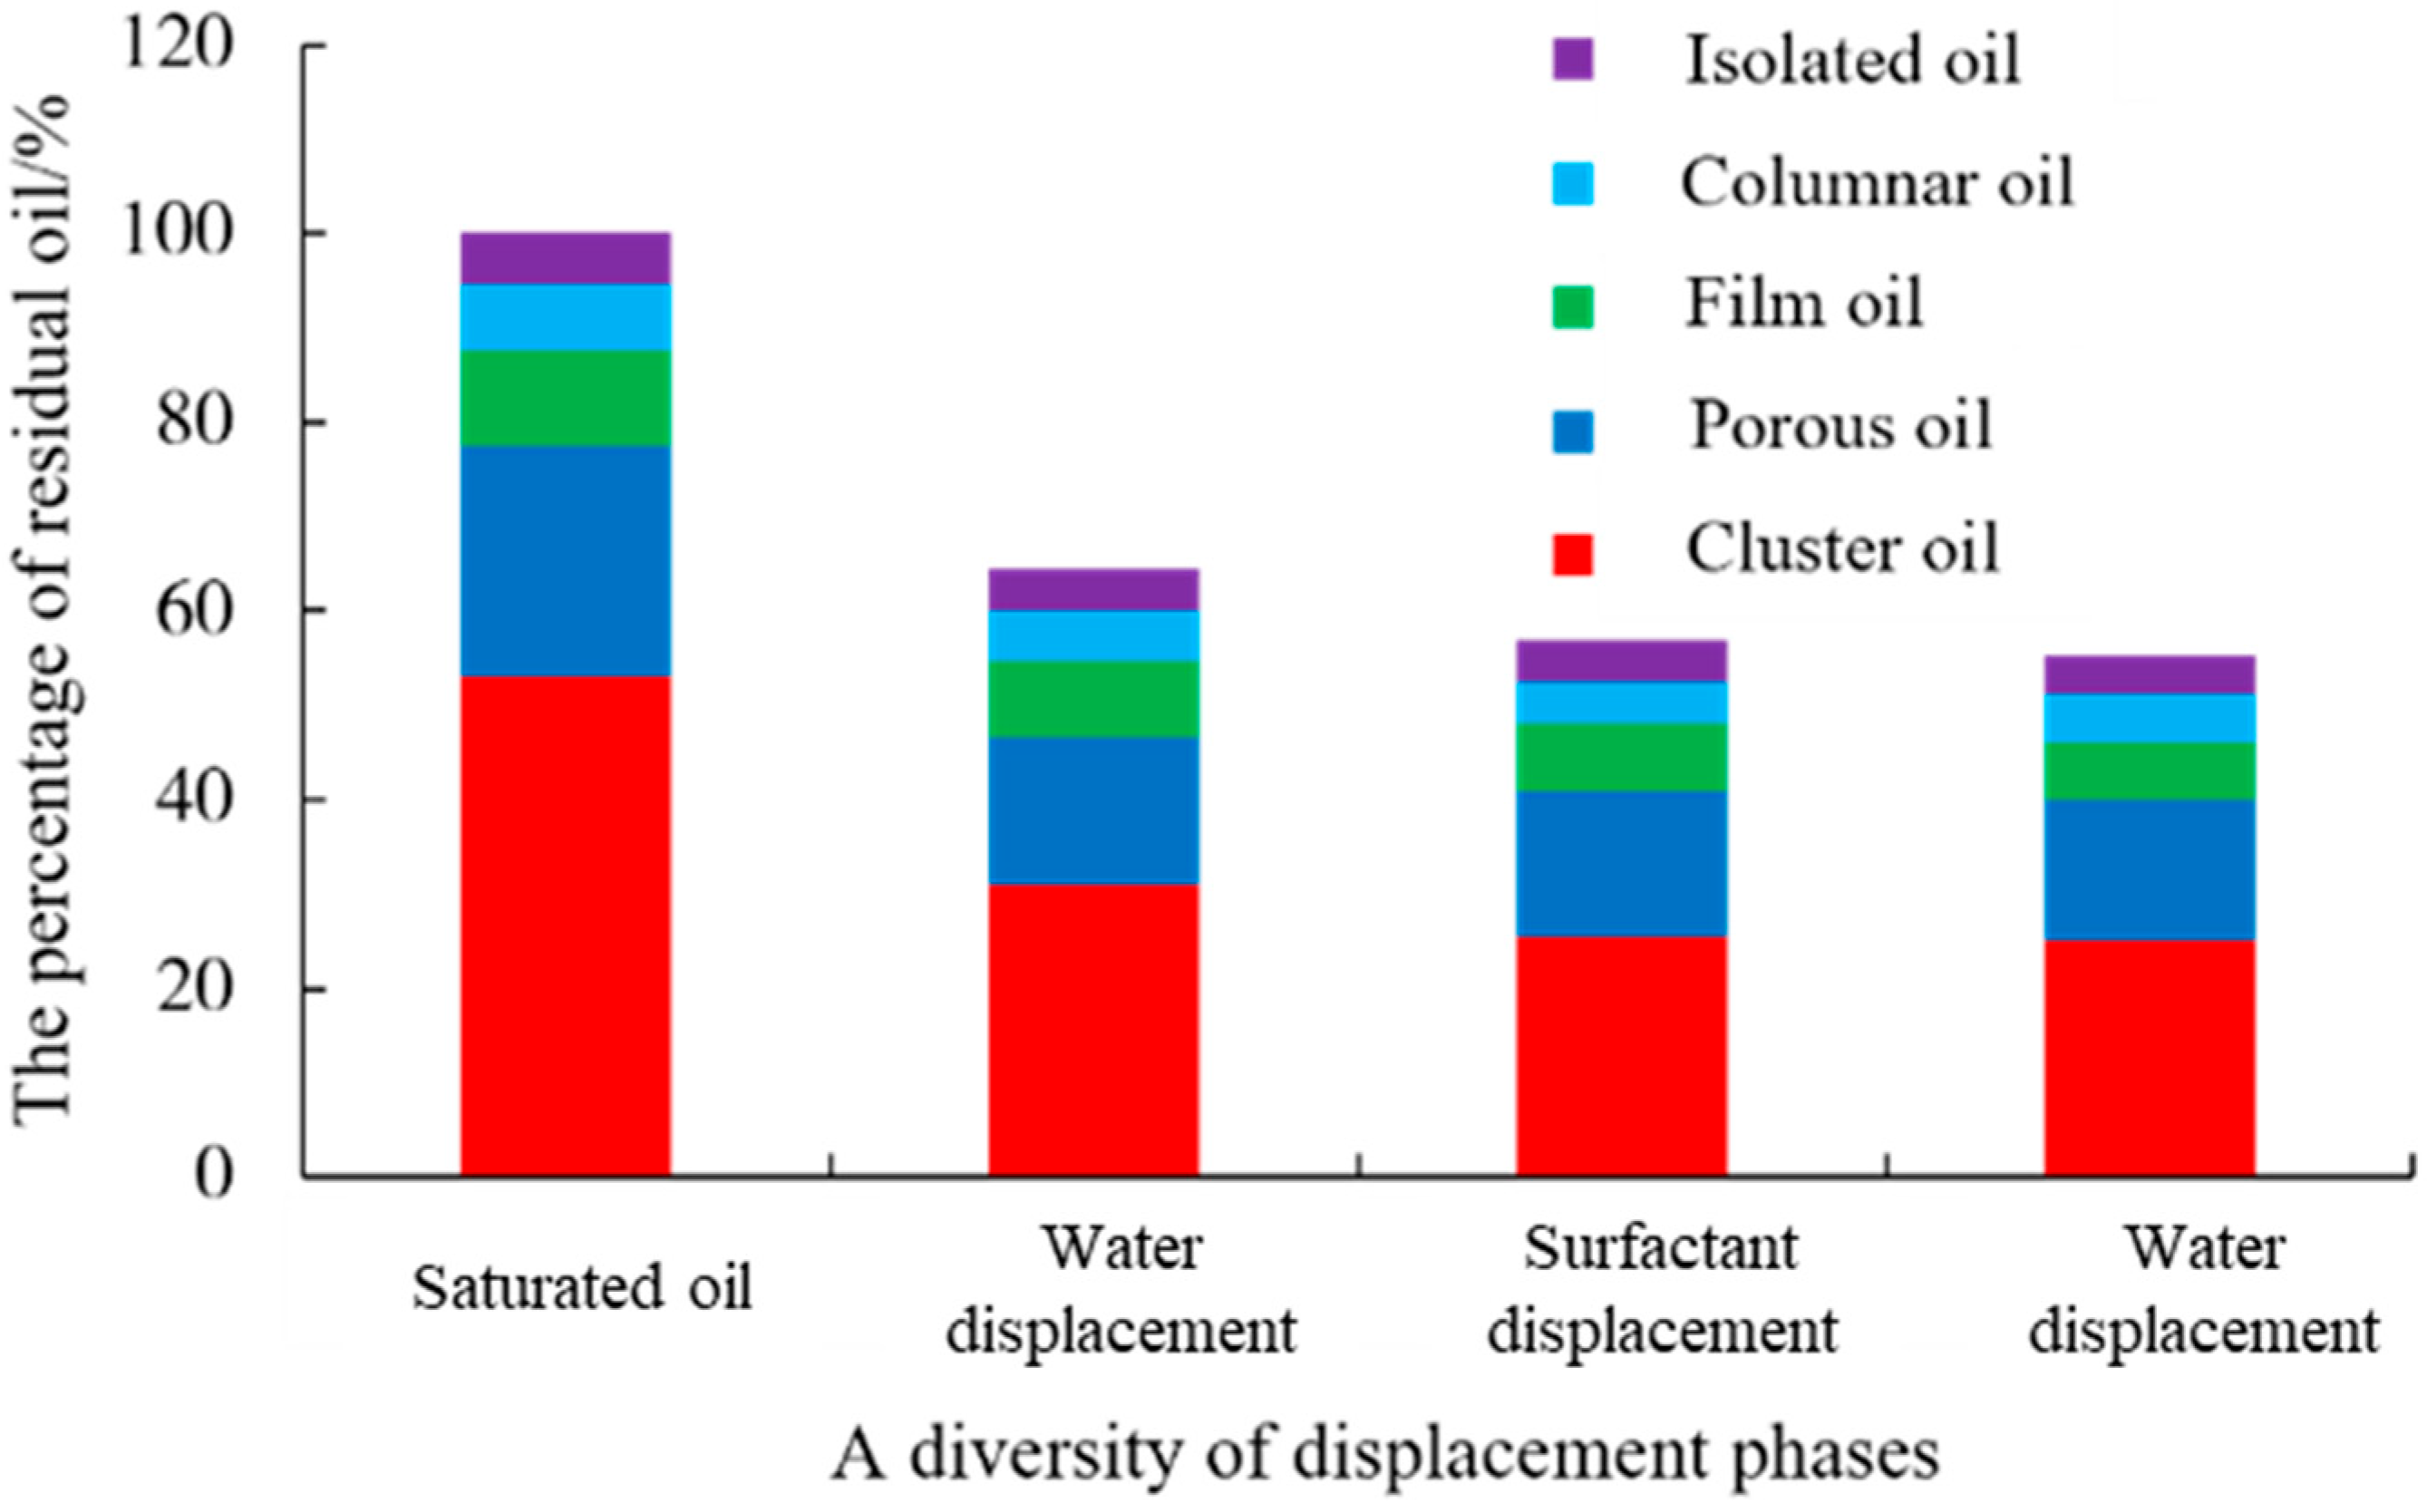
4.2. The Proportion of Remaining Oil at Each Stage

To quantify the conversion amount of five types of residual oil, the notion of “residual oil proportion” is introduced.
T h e   p e r c e n t a g e   o f   r e s i d u a l   o i l = A t y p e   o f   r e s i d u a l   o i l   p i x e l   c o u n t F i v e   t y p e   o f   r e s i d u a l   o i l   p i x e l   c o u n t
Upon noise reduction, gray-scale binarization, and the image segmentation of the CT scan images of the small plunger (with a diameter of 8 mm), the proportion of remaining oil of the small plunger (with a diameter of 8 mm) was extracted and calculated in four phases: the initial state, water flooding, surfactant flooding, and subsequent water flooding (Figure 8). The low-permeability core is characterized by small pore throats and pronounced heterogeneity, leading to the scattered distribution of crude oil in the initial stage. The discontinuous phases, such as film, columnar, and isolated forms, accounted for 22.5%. After water flooding until a 100% moisture content was attained, the continuous-phase remaining oil (cluster and porous) was exploited to a greater extent, with the proportion decreasing by 30.8%, while the non-continuous-phase remaining oil (film, columnar, and isolated) was exploited to a lesser extent, only 4.6%. After surfactant flooding until a 100% water content was reached, the remaining oil of the continuous phase and non-continuous phase decreased by 5.83% and 1.94%, respectively. After subsequent water flooding until a 100% moisture content was achieved, the proportion of the five types of remaining oil remained essentially unchanged.
Presently, the investigation regarding residual oil based on CT scanning technology quantifies the variance of residual oil in diverse stages, disregarding the influence of the mutual transformation of various types of residual oil on the oil displacement efficiency in each stage (particularly surfactant flooding).

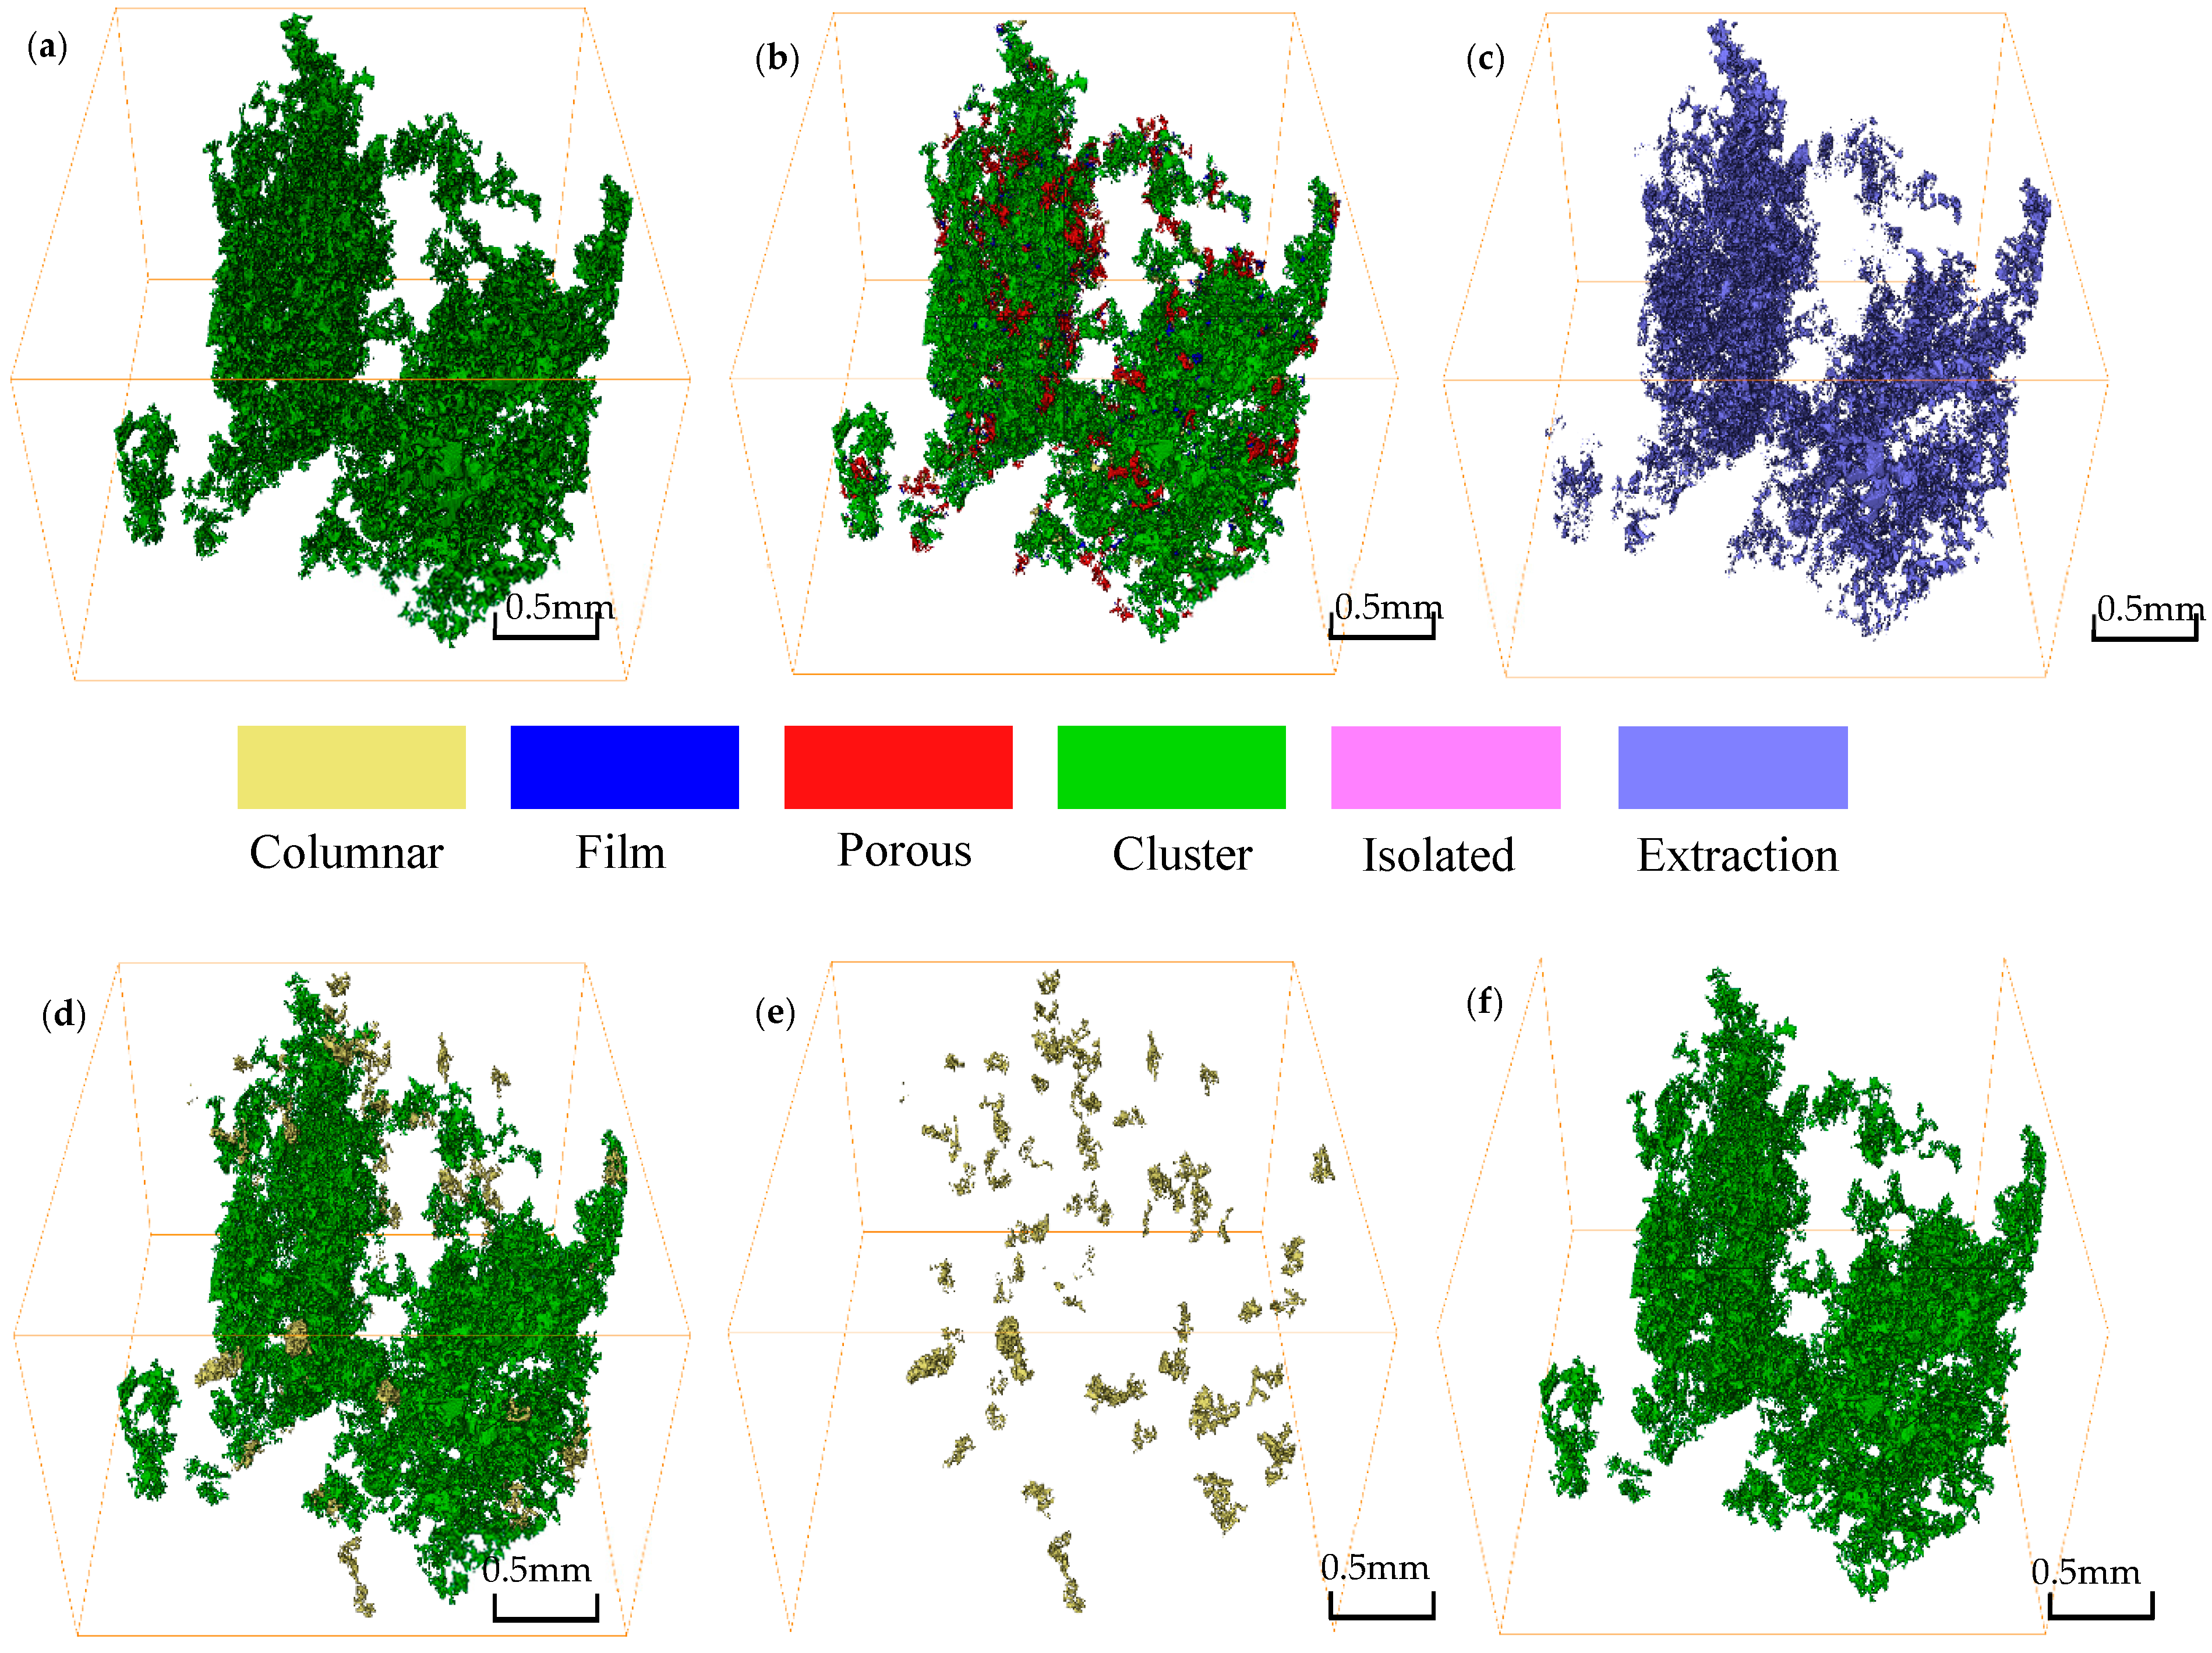
4.3. The Transformation of Micro Residual Oil Types

Table 3 depicts the variations in the types of five microscopic remaining oils within the scanning area of the plunger in relation to the displacement stage throughout the entire displacement process. The proportion of the five kinds of remaining oil diminished with each displacement stage, and all types of remaining oil underwent diverse degrees of transformation in different displacements. (1) In the saturated oil stage, the remaining oil of the continuous phase (cluster and porous) and the non-continuous phase (film, columnar, and porous) constituted 77.5% and 22.5%, respectively. (2) After water flooding, the proportion of the five types of remaining oil was classified as clustered, porous, film, columnar, and isolated. Among them, the continuous oil phases (cluster and porous) were successively swept and expelled by the water phase. The cluster remaining oil accounted for 24%, and the porous remaining oil accounted for merely 2.1%. For some discontinuous oil phases (film and columnar), the transformation law of “converging” was manifested, that is, the transformation from the discontinuous to the continuous phase (see Table 1). The recovery ratio of the film remaining oil was merely 1.7%, and the conversion rate of the remaining oil was 25.4%, of which 16.6% was transformed into porous and clustered remaining oil. The recovery ratio of the residual oil was 1.6%, and the conversion rate of the residual oil was 33.3%. During the water drive process, the proportion of the isolated remaining oil remained relatively unchanged as a whole, indicating that it was challenging to utilize this type of remaining oil during the water drive. (3) In the surfactant flooding stage, surfactants were capable of reducing the interfacial tension of oil and water and enhancing the solubility of micelles, exerting varying degrees of influence on the five types of remaining oils, particularly the non-continuous oil phase. As can be observed from Table 1, the proportion of the isolated, film, and columnar remaining oil production appeared to be small, which was 0.43%, 0.8%, and 0.56%, respectively. However, considering the small quantity of remaining oil at the end of water flooding, the utilization capacity (the proportion of surfactant production/the remaining oil of a single type after the end of water flooding) was 9.1%, 10%, and 10.1%, respectively. The remaining oil conversion capacity was 6.99%, 16.2%, and 29.9%, respectively. The columnar residual oil exhibited a strong conversion capacity, and the membrane residual oil could be further transformed into the continuous oil phase. (4) After subsequent water flooding, the five types of microscopic remaining oil were essentially unutilized, and the type conversion rate was extremely small.

5. Conclusions

  • The analysis approach for residual oil type transformation was established. By tracing back to the composition and direction of various remaining oils, the mutual conversion of various remaining oils at different stages was achieved based on image processing technology, and the oil displacement mechanism of different displacement media was further clarified, offering a new concept for the potential exploitation of remaining oil in the subsequent site.
  • When applying the above method to the Saartu sandstone cores in Daqing, significant differences were found in the conversion rules of various remaining oils. After the displacement medium enters the large pores with good connectivity, the continuous oil phase will be gradually separated. Meanwhile, the discontinuous oil phase in the pore tubes with poor connectivity will enter the dominant channel with the displacement medium due to the influence of capillary imbibition, wetting reversal, and emulsification oil carrying performance, and the discontinuous oil phase will undergo a transformation of “coalescence”. Additionally, the surfactant’s unique ability of “micellar solubilization, emulsification, and oil carrying” shows good adaptability to the discontinuous oil phase and can transform the discontinuous-phase remaining oil into the continuous-phase remaining oil, namely columnar–film–cluster–recovery.

Author Contributions

Methodology, C.F.; Software, L.S.; Formal analysis, Z.Y.; Writing—original draft, C.F. All authors have read and agreed to the published version of the manuscript.

Funding

This research was supported by The Major Project of CNPC’s “CCUS oil displacement geological body fine description and reservoir engineering key technology research” (No. 2021ZZ01-03).

Data Availability Statement

The original contributions presented in this study are included in the article. Further inquiries can be directed to the corresponding author.

Conflicts of Interest

All authors were employed by the Research Institute of Petroleum Exploration and Development, Petrochina. The authors declare no conflict of interest.

References

  1. Hou, Q.J.; He, H.Q.; Li, J.Z.; Yang, T. Recent progress and prospect of oil and gas exploration by PetroChina Company Limited. China Pet. Explor. 2018, 23, 1–13. [Google Scholar]
  2. Hu, W.R.; Wei, Y.; Bao, J.W. Development of the theory and technology for low permeability reservoirs in China. Pet. Explor. Dev. 2018, 45, 646–656. [Google Scholar] [CrossRef]
  3. Li, W.C.; Yao, G.Q.; Zhou, F.D.; Huang, Z.; Liang, J.F. Water displacing oil efficiency with cores grouped in parallel of different flow units in low-permeability reservoirs. Acta Pet. Sin. 2011, 32, 658–663. [Google Scholar]
  4. Hearn, C.L.; Ebanks, W.J.; Tye, R.S.; Ranganathan, V. Geological Factors Influencing Reservoir Performance of the Hartzog Draw Field, Wyoming. J. Pet. Technol. 1984, 36, 1335–1344. [Google Scholar] [CrossRef]
  5. Hou, J.; Qiu, M.X.; Lu, N.; Qu, Y.T.; Li, F.; Meng, X.H.; Shi, X.L. Characterization of Residual oil Microdistribution at Pore Scale Using Computerized Tomography. Acta Pet. Sin. 2014, 35, 319–325. [Google Scholar]
  6. Peng, H.L.; Zhou, X.P.; Yao, G.J.; Sun, L.T. Laboratory research on microscopic distribution of residual oil after polymer driving and how to improve recovery factor for reservoirs with big porous channels. Nat. Gas Explor. Dev. 2005, 28, 62–65. [Google Scholar]
  7. Wang, W.M.; Guo, H.K.; Sun, D.Q.; Zhang, S.Z. A study on polymer flooding by MRI techniques. Acta Pet. Sin. 1997, 18, 54–59. [Google Scholar]
  8. Bai, Z.Q.; Wu, S.H.; Fu, Z.G. The distribution of microcosmic remaining oils after polymer flooding in Daqing oilfield. Acta Pet. Sin. 2013, 34, 924–931. [Google Scholar]
  9. Li, J.J.; Liu, Y.; Gao, Y.J.; Cheng, B.Y.; Meng, F.L.; Xu, H.M. Effects of microscopic pore structure heterogeneity on the distribution and morphology of remaining oil. Pet. Explor. Dev. 2018, 45, 1043–1052. [Google Scholar] [CrossRef]
  10. Wang, X.W.; Yang, Z.M.; Li, H.B.; Guo, H. Microscopic Distribution of Remaining oil of ultra-low permeability reservoir by using NMR technique. J. Basic Sci. Eng. 2013, 21, 702–709. [Google Scholar]
  11. Song, K.P.; Li, S.J.; Fang, W.; Wu, J.W.; Mu, W.Z. Fluorescence analysis on changeable rules of microscopic remaining oil after polymer flooding. Acta Pet. Sin. 2005, 26, 92–95. [Google Scholar]
  12. Liu, J.J.; Liu, X.G.; Feng, X.T. Physical simulation of water-oil microcosmic flow through fractured porous media. Chin. J. Rock Mech. Eng. 2003, 22, 1646–1650. [Google Scholar]
  13. Ling, Z.F.; He, S.L.; Yang, W.X.; Men, C. Physical simulation on experiment of water driving by micro-model and fractal features of residual oil distribution. J. China Univ. Pet. 2006, 30, 68–71. [Google Scholar]
  14. Zhu, W.Y.; Tian, Y.G.; Weidong, W.; Song, Z.Y.; Han, H.Y.; Song, Y.T.; Li, C.F. Mechanisms of oil displacement by indigenous microorganism producing bio-emulsifier using microscopic modeling. J. Cent. South Univ. (Sci. Technol.) 2016, 47, 3280–3288. [Google Scholar]
  15. Yan, W.C.; Sun, J.M. Analysis of research present situation of microscopic remaining oil. Prog. Geophys. 2016, 31, 2198–2211. [Google Scholar]
  16. Zhang, S.K.; Hou, J.; Li, Z.Q.; Chen, Y.M.; Xu, Y.D. Automatic segmentation of polymer-flooding microvadose images by image processing. J. China Univ. Pet. 2005, 29, 75–78. [Google Scholar]
  17. Mehmain, A.; Tokan, L.A.; Prodanovic, M.; Sheppard, A.P. The Effect of Microporosity on Transport Properties in Tight Reservoirs; SPE: Richardson, TX, USA, 2011; p. 144384. [Google Scholar]
  18. Blunt, M.J.; Jackson, M.D.; Piri, M.; Valvatne, P.H. Detailed Physics Predictive Capabilities and Macroscopic Consequences for Porenetwork Models of Multiphase Flow. Adv. Water Resour. 2002, 25, 1069–1089. [Google Scholar] [CrossRef]
  19. Xu, S.Y.; Zhu, L.Z.; Wang, D.J. Dynamic simulation and evolvement model for microscopic remaining oil. Acta Pet. Sin. 2005, 34, 69–72. [Google Scholar]
  20. Sun, H.Q.; Sun, G.; Cheng, H.M.; Wu, S.Y. The simulation models of remaining oil distribution at super-high water cut stage of Shentuo oil field. Pet. Explor. Dev. 2002, 29, 66–68. [Google Scholar]
  21. Hu, X.T.; Li, Y. Study of microcosmic distribution of residual oil with stochastic simulation in networks. Acta Pet. Sin. 2000, 21, 46–51. [Google Scholar]
  22. Li, J.; Jiang, H.; Wang, C.; Zhao, Y.; Gao, Y.; Pei, Y.; Wang, C.; Dong, H. Pore-scale investigation of microscopic remaining oil variation characteristics in water-wet sandstone using CT scanning. J. Nat. Gas Sci. Eng. 2017, 48, 36–45. [Google Scholar] [CrossRef]
  23. Iglauer, S.; Lebedev, M. High pressure-elevated temperature x-ray micro-computed tomography for subsurface applications. Adv. Colloid Interface Sci. 2018, 256, 393–410. [Google Scholar] [CrossRef]
  24. Cheng, Z.L.; Sui, W.B.; Ning, Z.F.; Gao, Y.; Hou, Y.; Chang, C.; Li, J. Microstructure characteristics and its effects on mechanical properties of digital core. Chin. J. Rock Mech. Eng. 2018, 37, 449–460. [Google Scholar]
  25. Li, J.J.; Gao, Y.J.; Zhao, Y.Y.; Liu, Y.; Yu, F.W.; Su, H. One Kind of Core Holder for CT Scanning. Patent CN106706684A, 24 May 2017. [Google Scholar]
  26. Tong, C.B.; Cheng, S.Q.; Shi, L.H.; Xue, Y.; Shi, B. Micro-residual oil distribution experiment of periodic water injection in tight reservoir based on microfluidic model. Pet. Geol. Dev. Daqing 2024, 1–9. [Google Scholar] [CrossRef]
  27. Zhang, Y.; Lin, C.; Ren, L. Analysis of Microscopic Remaining Oil Based on the Fluorescence Image and Deep Learning. J. Fluoresc. 2024, 34, 1–18. [Google Scholar] [CrossRef] [PubMed]
  28. He, Y.; Zheng, X.; Wu, J.; Wang, Z.; Wu, J.; Wang, Q.; Gong, W.; Gai, X. Microscopic Remaining Oil Classification Method and Utilization Based on Kinetic Mechanism. Energies 2024, 17, 5467. [Google Scholar] [CrossRef]
  29. Sun, C.; Wang, X.; Zhao, J.; Zhang, J.; Wu, X.; Wang, W.; Yan, X. Study on the Mobilization Mechanisms of Microscopic Residual Oil in High-Water-Cut Sandstone Reservoirs. Processes 2024, 12, 1608. [Google Scholar] [CrossRef]
Figure 1. The 3D topological morphology of five types of remaining oil after saturation.
Energies 18 00563 g001
Figure 2. The conversion procedure of cluster residual oil. (a) Cluster oil—the process of saturated oil; (b) transformation of type—the process of water displacement; (c) the extraction of cluster oil—the process of water displacement; (d) cluster oil—the process of water displacement; (e) the porous residual oil is converted into the cluster residual oil in the process of water displacement; (f) the old cluster residual oil is converted into the new cluster residual oil in the process of water displacement.
Energies 18 00563 g002
Figure 3. The flow diagram of the experiment.
Energies 18 00563 g003
Figure 4. Diagram of the special core gripper.
Energies 18 00563 g004
Figure 5. The density diagram of simulated oil and injected water (1 represents conventional simulated oil and injected water; 2 and 3 are simulated oil and injected water containing diiodomethane).
Energies 18 00563 g005
Figure 6. The processing flow of CT scan images (with an image resolution of 2.0197 μm). (a) Dry sweeping. (b) Pore extraction. (c) The process of oil displacement. (d) The process of water displacement. (e) Three phases of oil, water, and skeleton. (f) Three-dimensional recombination of oil and water.
Energies 18 00563 g006
Figure 7. The correlation between recovery efficiency, water content, and injection volume.
Energies 18 00563 g007
Figure 8. The relationship between microscopic remaining oil and different displacement stages.
Energies 18 00563 g008
Table 1. The chemical properties of white oil and kerosene used in the experiment.
Core
Number
Well
Number
HorizonDiameter
mm
Length
mm
Permeability
×10−3 μm2
Porosity
%
1Z44-JP204K2y125.2108.72.1321.7%
2Z44-JP204K2y17.84501.2620.3%
Table 2. Table of the Basic Physical Properties of Fluids.
Type of FluidDensity
g/cm3
Viscosity
mPa·s
Interfacial Tension
mN/m
Simulated oil0.819.20.08
Simulated oil containing diiodomethane0.879.50.09
surfactant/3.2/
Table 3. Table of the remaining oil types and conversion ratios at different stages.
Water DisplacementSurfactant DisplacementWater Displacement
The Type of Residual OilBeforeAfterBeforeAfterBeforeAfter
Proportion (%)TypeProportion (%)Proportion
(%)
TypeProportion (%)Proportion
(%)
TypeProportion (%)
Cluster oil53.1Cluster2730.9Cluster23.9725.65Cluster24.79
Porous2.1Porous1.38Porous0.19
Columnar0Columnar0Columnar0
Film0Film0Film0
Isolated0Isolated0Isolated0
extraction24extraction4.61extraction0.41
Porous oil24.4Cluster2.815.8Cluster0.7815.22Cluster0.12
Porous12.6Porous13.41Porous14.9
Columnar1.2Columnar0.95Columnar0.1
Film0.4Film0.28Film0.04
Isolated0Isolated0Isolated0
extraction7.4extraction1.92extraction0.27
Columnar oil6.9Cluster0.45.5Cluster0.14.53Cluster0.01
Porous0.5Porous0.14Porous0.03
Columnar3Columnar3.51Columnar5
Film1.3Film1.34Film0.14
Isolated0.1Isolated0.16Isolated0.01
extraction1.6extraction0.56extraction0.08
Film oil10.2Cluster0.57.9Cluster0.787.16Cluster0.01
Porous0.5Porous0.09Porous0.02
Columnar1.2Columnar0.06Columnar0.07
Film5.9Film5.46Film5.95
Isolated0.4Isolated0.28Isolated0.03
extraction1.7extraction0.8extraction0.06
Isolated oil5.4Cluster0.24.5Cluster0.034.27Cluster0
Porous0.1Porous0.2Porous0
Columnar0.1Columnar0.01Columnar0
Film0.3Film0.08Film0.01
Isolated4Isolated3.83Isolated3.89
extraction0.7extraction0.43extraction0.03
Disclaimer/Publisher’s Note: The statements, opinions and data contained in all publications are solely those of the individual author(s) and contributor(s) and not of MDPI and/or the editor(s). MDPI and/or the editor(s) disclaim responsibility for any injury to people or property resulting from any ideas, methods, instructions or products referred to in the content.

