Review

A Review of Diagnostic Methods for Yaw Errors in Horizontal Axis Wind Turbines

1
Huaneng Clean Energy Research Institute, Huaneng Group Ltd., Beijing 102209, China
2
The State Key Laboratory of Nonlinear Mechanics, Institute of Mechanics, Chinese Academy of Sciences, Beijing 100190, China
3
School of Engineering Sciences, University of Chinese Academy of Sciences, Beijing 100049, China
*
Author to whom correspondence should be addressed.
These authors contributed equally to this work.
Energies 2025, 18(3), 588; https://doi.org/10.3390/en18030588
Submission received: 16 August 2024 / Revised: 21 December 2024 / Accepted: 23 January 2025 / Published: 26 January 2025
(This article belongs to the Section A3: Wind, Wave and Tidal Energy)

Abstract

:
Yaw errors occur in wind turbines either during the installation stage or because of the aging of devices. It reduces the wind speed in the rotor axial direction and increases the structural loads in the lateral direction. Diagnosing yaw error rapidly and accurately is crucial for avoiding the introduced under-performance. In this review paper, we first introduce the fundamental concepts and principles of wind turbine yaw control strategies, and we discuss two types of yaw errors (i.e., the static yaw error and the dynamic yaw error) with their corresponding causes. Subsequently, we outline the existing yaw error diagnostic methods, which are based on the LiDAR (light detection and ranging) data, the SCADA (supervisory control and data acquisition) data, or a combination of the two, and we discuss the advantages and disadvantages of various methods. At last, we emphasize that the diagnostic performance can be improved via the combination of the LiDAR data and the SCADA data, and it benefits from an in-depth understanding of the salient features and influential factors associated with the yaw error. Meanwhile, the potential of intelligent clusters and digital twins for detecting yaw errors is discussed.

1. Introduction

The development of wind energy is crucial for achieving the goal of sustainable energy [1,2]. The Global Wind Energy Council (GWEC) reported that the wind power industry experienced record-high growth in 2023, that the world’s newly installed wind capacity was 106 GW for onshore and 10.8 GW for offshore, totaling about 117 GW; an increase of 50% compared to the last year, which raised the global wind installation capacity to 1021 GW [3]. In the World Energy Transitions Outlook, the International Renewable Energy Agency (IRENA) forecasted that the cumulative installed capacity of onshore wind will be 3040 GW and that of offshore wind will be 494 GW, with the total installed capacity reaching 3534 GW by 2030 [4]. The 2030 wind energy goals require an annual increase in installed wind capacity from the current 117 GW to at least 320 GW over the course of the decade [3]. The advent of the wind energy era leads to a rise in operation and maintenance (O&M) expenditure. Effective diagnosis of the system error is important for lowing the O&M cost. In this paper, we focus on reviewing the diagnostic methods for errors in the wind turbine yaw system.
Horizontal axis wind turbines typically employ active yaw control. The yaw system, a critical component of the wind turbine, aligns the wind turbine with the incoming wind and maximizes the capture of wind energy. In operational scenarios, the frequent changes in wind direction relative to the nacelle axis may result in wind turbines operating under yaw conditions. Yaw error frequently occurs in practice due to external reasons [5]. Studies have shown that a small yaw error can significantly reduce wind power production [6]. The relationship between the power output and the yaw angle is given by P = P 0 cos 3 θ [7], where P is the actual power, P 0 represents the power without yaw, and θ denotes the yaw angle. It is estimated that accomplishing the calibration of yaw errors on wind turbines globally would improve wind energy production by 1%~2% [8,9]. It was demonstrated that the presence of yaw error increases the O&M expenditure in both numerical simulations and measurements [10,11,12,13]. Moreover, the yaw error also affects the effectiveness of yaw-based active wake control (AWC) strategies [14,15,16].
The supervisory control and data acquisition (SCADA) system monitors the operation of wind turbines [17]. The yaw error cannot be directly identified using the SCADA data because of the complexity of the system, as different signals and malfunctions of different components are correlated. Therefore, it is crucial to have a baseline reference for identifying yaw errors using SCADA data. This reference is often taken as the curve of the maximum power or power coefficient vs. the yaw angle, and it is obtained from the SCADA data under normal wind turbine operation conditions.
This paper reviews the diagnostic methods for yaw error in horizontal axis wind turbines. First, Section 2 introduces the fundamental operation principle of the yaw control system and describes the classification and causes of yaw errors. Then, Section 3 presents diagnostic methods of different types. Finally, Section 4 summarizes this review and discusses future research directions.

2. Yaw Control System and Yaw Error

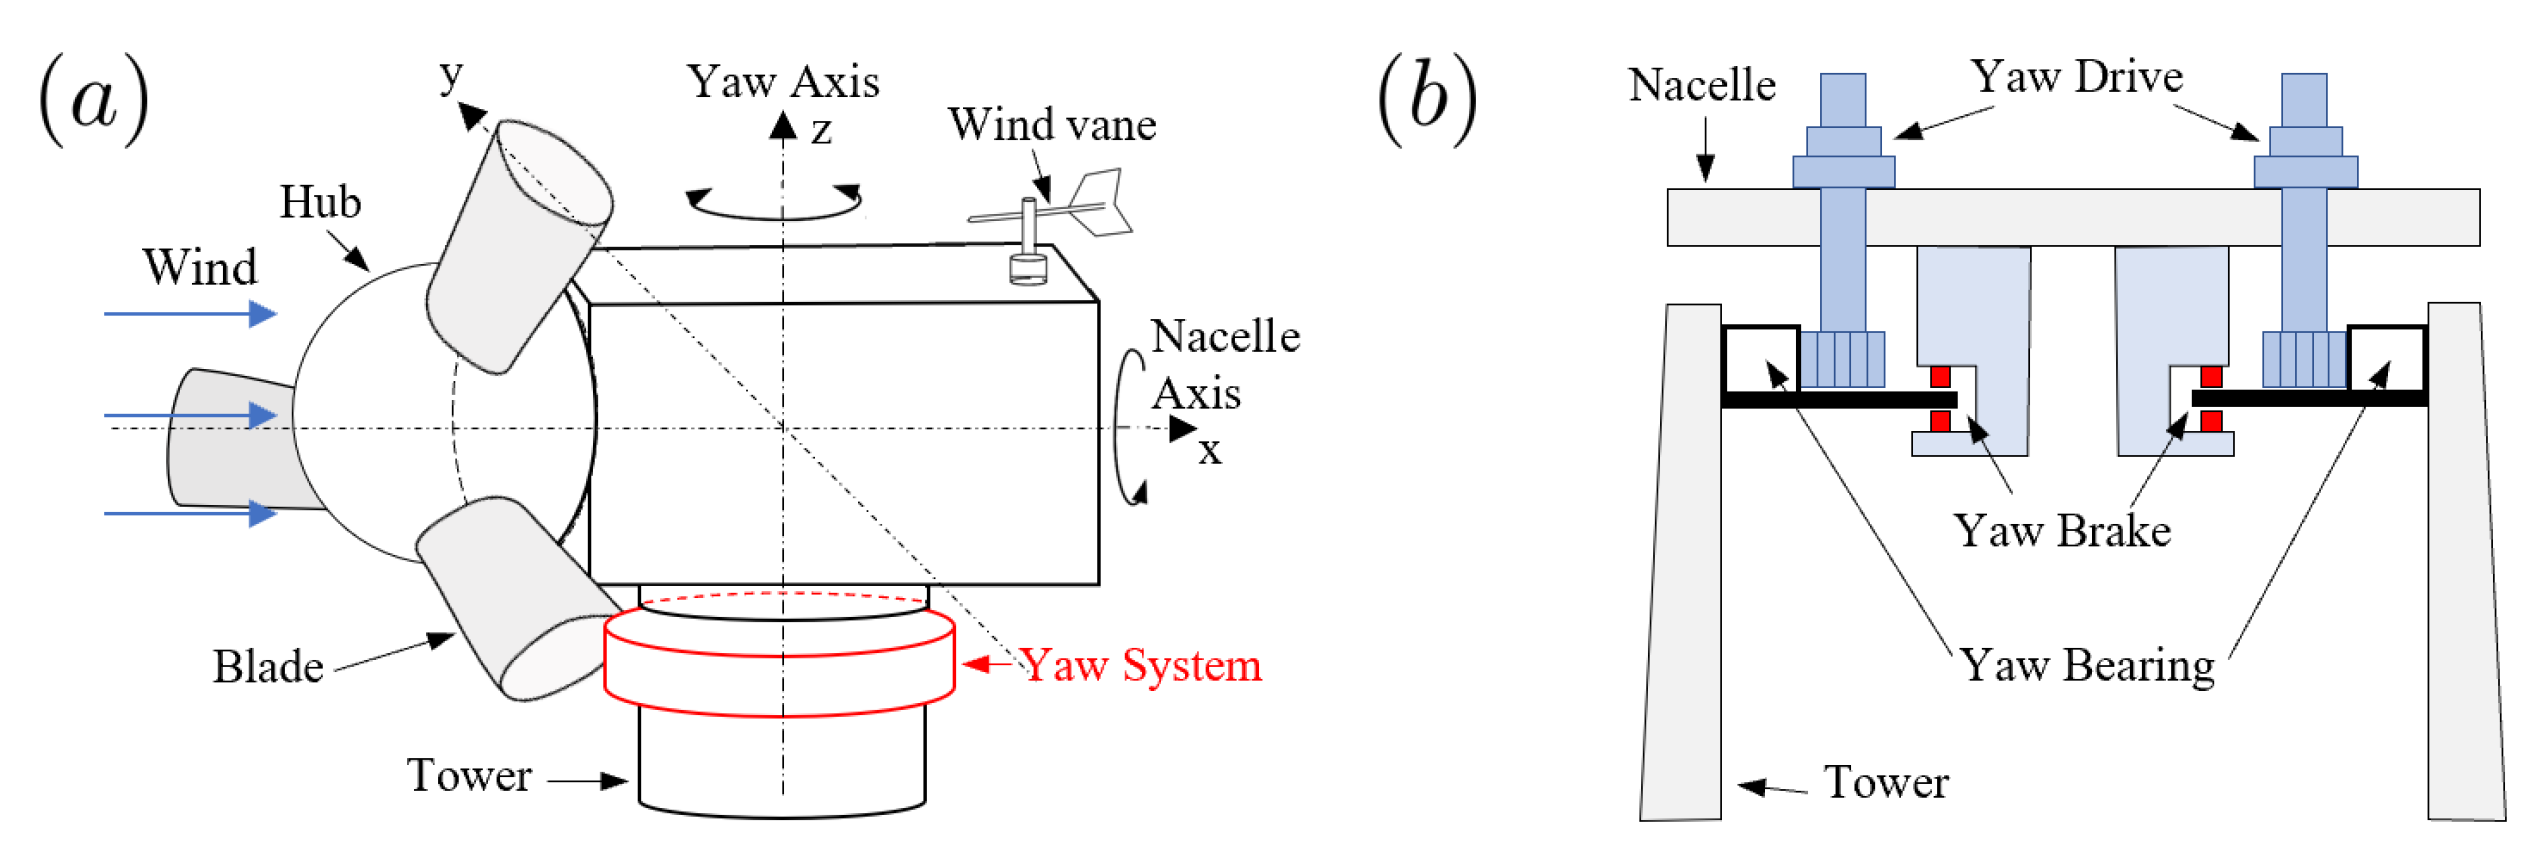
2.1. Yaw Control System

The stochastic nature of wind in its speed and direction necessitates a complex control system for a wind turbine to operate as designed. Figure 1a presents a model diagram for a wind turbine control system. The yaw control system, situated between the tower and the nacelle, is responsible for controlling the rotation of the rotor and the nacelle in the vertical direction. The wind information is fed to the control unit to execute appropriate control actions. The mechanical structure of a yaw control system is shown in Figure 1b. As seen, it is comprised ofa yaw bearing, yaw drive, and yaw brake [18]. A yaw bearing is the rotatable connection between the nacelle and the tower, ensuring the stable rotation of the nacelle. A yaw drive, which consists of an electric motor and a gearbox, rotates the nacelle. A yaw brake serves to stop the yaw movement.
Logic control is often employed for wind turbines. Different strategies for yaw control have been summarized in the literature [19,20,21]. Figure 2 illustrates the procedure of a logic control. When a predefined threshold is reached in the measured yaw angle, the yaw brake is triggered to perform the corresponding movement. A detailed procedure for the logic control is summarized as follows:
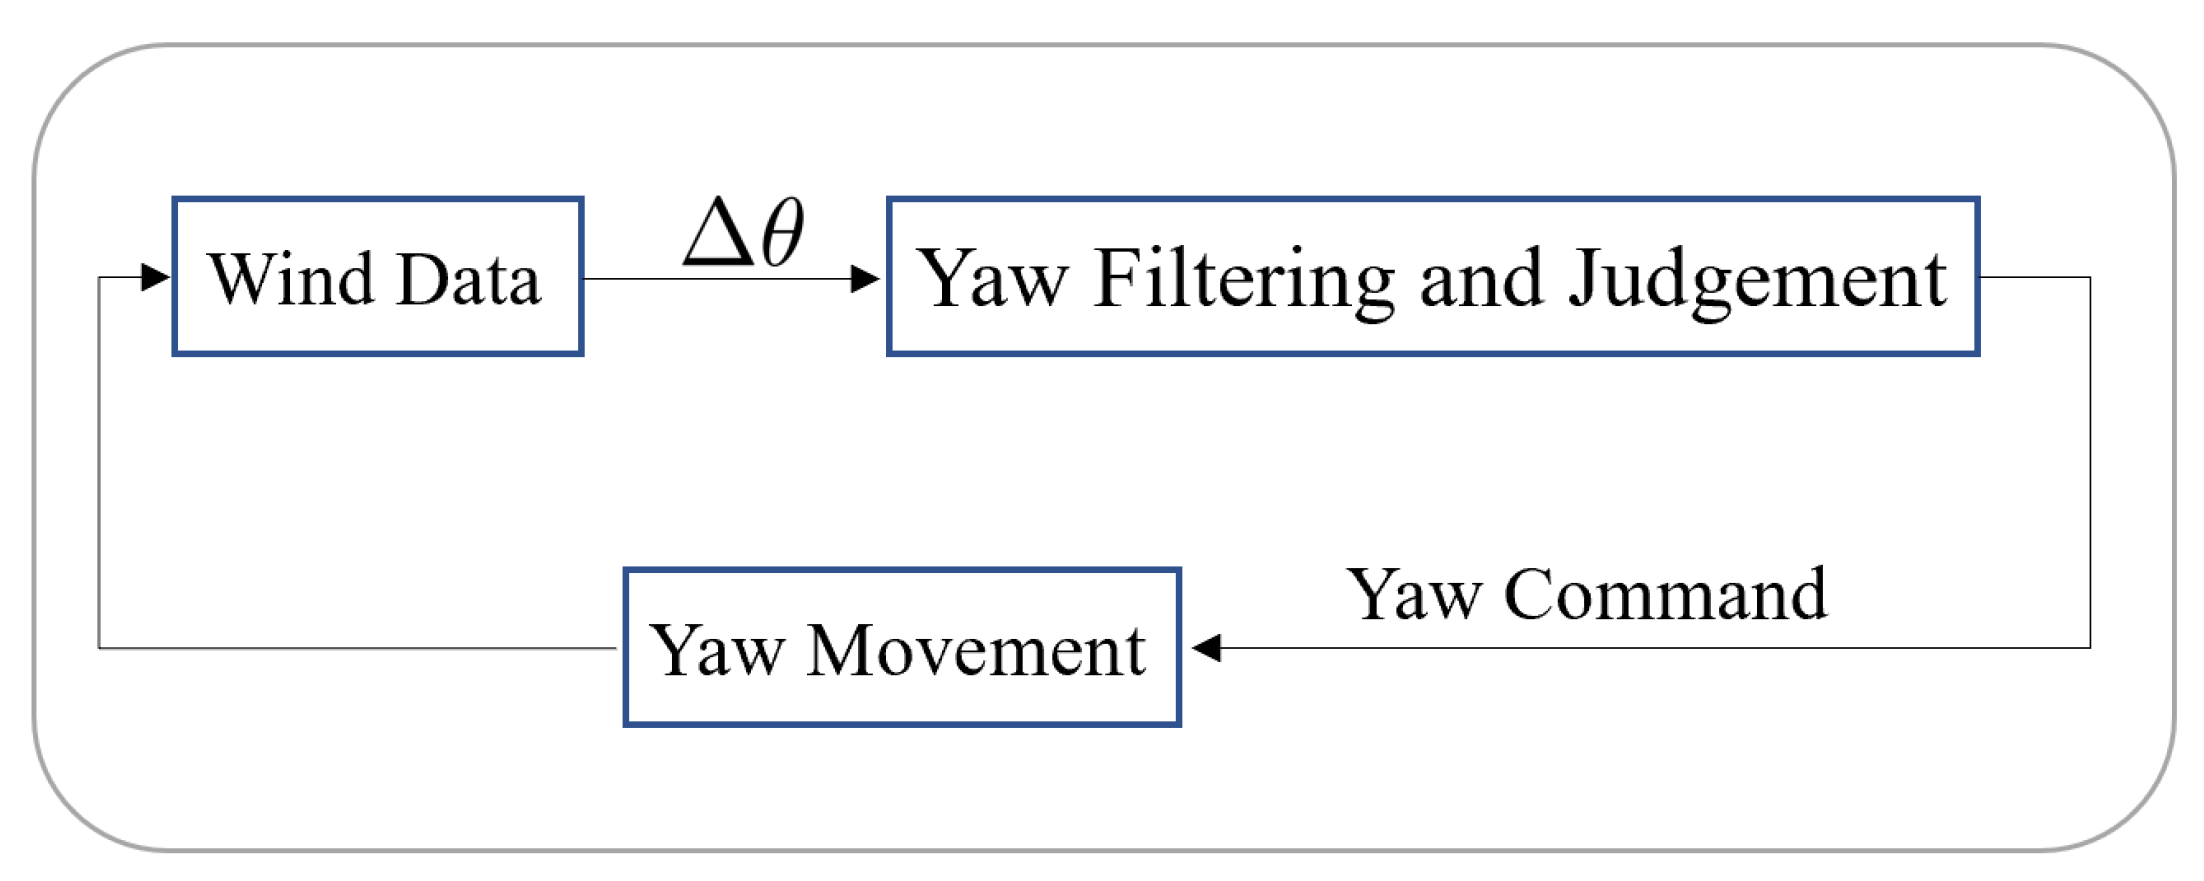
  • Temporally filter the input yaw angle for different periods.
  • Decide the need for the rotor rotation by comparing the result of the first step with the predefined threshold. If yes, compute the information about yaw braking.
  • Rotate the rotor against the wind based on yaw braking information to reduce the yaw angle.
Ideally, a yaw control system maintains the wind turbine in alignment with the incoming wind in order to maximize wind energy capture. Considering the operational lifetime of a wind turbine and the stochasticity of the wind direction, the yaw system does not require accurate yaw control at small timescales. However, incorrect alignment of wind vanes or inaccurate wind direction measurements can lead to errors in the input yaw angles, impacting the yaw movement of a wind turbine and thus reducing its performance.

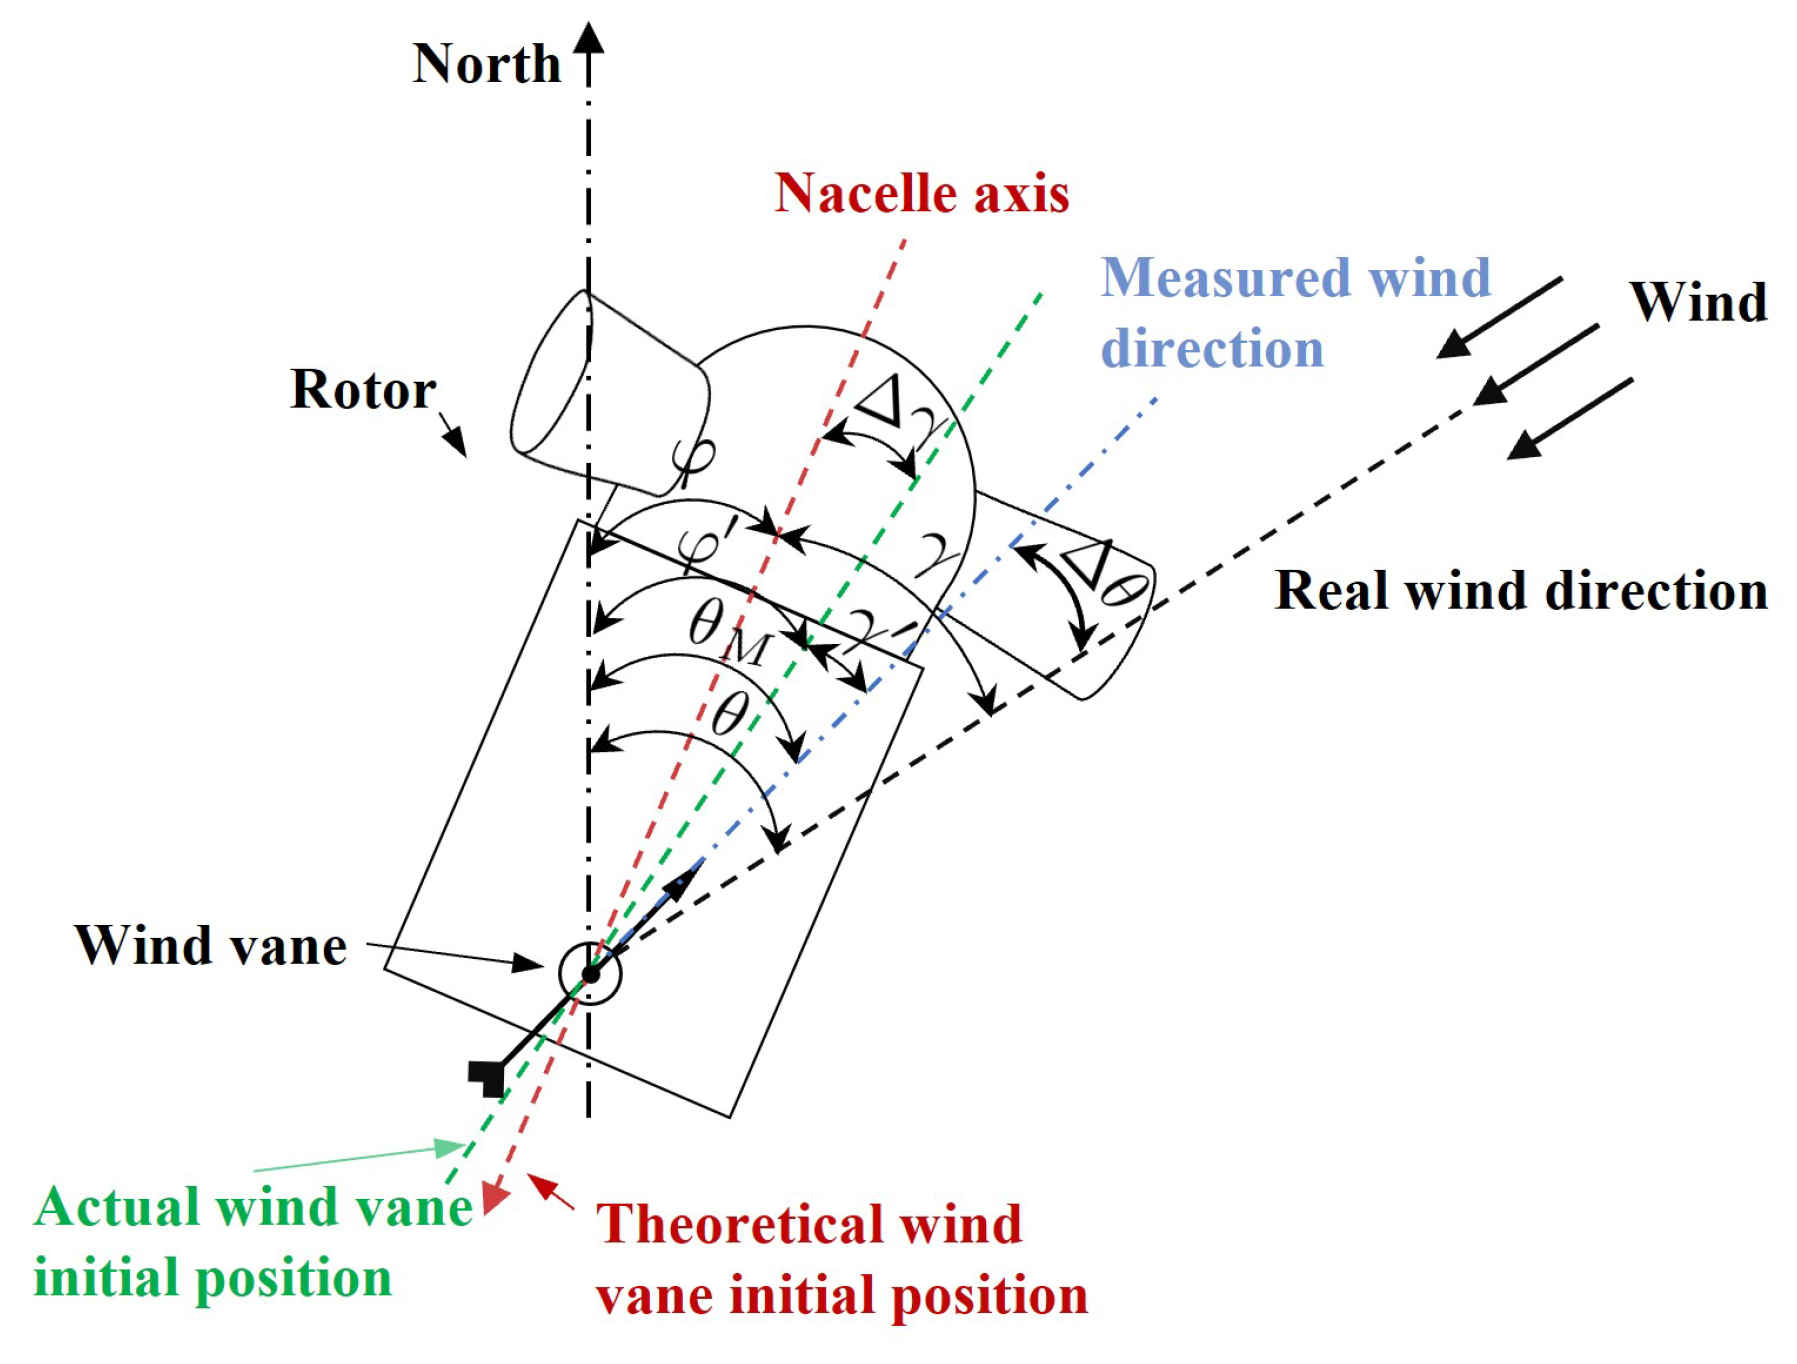
2.2. Definition and Classification of Yaw Error

The angle between the rotating axis of the rotor and the incoming wind direction is defined as the yaw angle for a horizontal axis wind turbine:
γ = θ φ
where θ is the angle of the incoming wind direction and φ denotes the angle of the nacelle orientation.
During the operation of wind turbines, a number of factors can result in yaw error, including control strategies, air flow distortion, and wind vane malfunction. Yaw error can be classified into two categories: dynamic yaw error and static yaw error. Yaw errors occur in both the wind vane and the sonic anemometer for a modern wind turbine. Considering that the wind vane is more widely utilized, it is the focus of this review. A schematic of wind turbine yaw error is shown in Figure 3.
The dynamic yaw error is primarily attributed to the error in sensing the incoming wind direction using the wind vane [22,23]. The yaw control system is activated [19,20,21] when the yaw angle computed using θ , which is measured at wind vane, exceeds a predefined threshold value within a specified time interval. As seen in Figure 3, the wind vane is placed downstream of the rotor. The incoming wind of the wind vane is distorted by the rotating blades, and the measured wind direction can be different from the actual value, causing errors in the estimation of yaw angle. The differences between the measured wind direction and the real one vary in time because of the fluctuating nature of the flow distortion induced by the rotating blades. The magnitude of the dynamic yaw error is correlated with the wind direction and wind speed [24]. Normally, when the wind speed and direction are stable, the dynamic yaw error is distributed as a Gaussian distribution Δ θ N ( μ , σ ) , where μ is generally non-zero, and μ and σ are functions of the incoming wind speed and direction.
The static yaw error can be categorized into two types: the yaw motion error (YME) [25] and the zero-point shifting error (ZPSE) [25,26,27,28]. The yaw motion error is attributed to factors including local meteorology and flow distortion of the blades [25]. Typically, the yaw angle error due to the wind vane is close to the Gaussian distribution with zero mean, i.e., μ = 0 . However, there are exceptions, possibly due to the local meteorology, that the time-averaged value is not zero, resulting in the yaw motion error, a systematic error of the yaw control strategy under specific conditions. To guarantee the accurate measurement of the yaw angle, it is essential that the zero point of the wind vane and its sensor are aligned with the center of the nacelle. However, there is misalignment of the wind vane observed in the field, which can be due to the installation defect, its inadequate manufacturing accuracy, or the gradual deterioration over time. Such error is defined as the zero-point shifting error. As illustrated in Figure 3, when there is a zero-point shifting error, i.e., there is a shift in angle between the actual zero point of the wind vane and the theoretical zero point, the relationship between the zero-point shifting error, the measured yaw angle, and the actual yaw angle is as follows:
γ = θ M φ γ = γ + Δ γ + Δ θ
where γ is the measured yaw angle, θ M denotes the wind direction measured by the wind vane, φ denotes the actual point of the wind vane, Δ γ is the zero-point shifting error, Δ θ represents the dynamic yaw error, and γ stands for the actual yaw angle of the wind turbine.

3. Diagnostic Methods for Yaw Error

With the increasing scale of wind energy, there is an urgent demand for the development of advanced yaw error diagnostic techniques with the capability to identify the causes of errors. The existing methods for yaw error diagnosis can be classified based on the data employed, i.e., LiDAR (light detection and ranging) data-based methods, SCADA data-based methods, and hybrid data-based methods, or based on the capability of the methods, either for static error or dynamic error. A comprehensive categorization of these methods is presented in Table 1. Procedure of the literature review is outlined in the Appendix A.

3.1. Diagnostic Methods Based on LiDAR Data

The LiDAR-based method employs the exact information of the incoming wind to identify yaw errors [19,31,45]. For a ground-based LiDAR, the method employs the measured wind directions at different heights and the nacelle position data for yaw error diagnosis. For a nacelle-based LiDAR, on the other hand, the yaw error can be computed directly. Detailed yaw error diagnosis can then be carried out by analyzing the temporal evolution of the residuals of the contemporaneous wind vane measurement data [46]. A variety of LiDAR-based yaw error diagnostic methods is listed in Table 1.
Two methodologies exist for the calibration of yaw error using LiDAR measurements. The first is static alignment, where the deviations between the yaw angle measured using LiDAR and the yaw angle measured by the wind vane are averaged for an extended sampling period, and the average of the deviations is recognized to be the static yaw error. The yaw control system then compensates for this static yaw error. The second methodology is the dynamic alignment, which continuously compares the yaw angle measured by the LiDAR and the wind vane. the yaw system is calibrated frequently to keep the wind turbine aligned with the wind as accurately as possible.
In some earlier studies [19,29,30,31,32,33], researchers employed data averaged over multiple time periods (hours or more) for yaw error diagnosis. However, the diagnosis of yaw error with averaged data can only detect the zero-point shifting error. It has been shown in the literature [23,24,34] that there are differences in the yaw error at certain wind speeds even after yaw alignment. Figure 4 compares the yaw errors before (green scatter and black line) and after alignment (blue scatter and red line) using the averaged data. It is seen that yaw errors persist at low wind speeds, even though the yaw errors have been compensated to a certain extent. This implies that the averaged data cannot compensate for the yaw error accurately, which will result in a reduction in power efficiency. One explanation is that the disturbances introduced by the rotating blades to the inflow of the wind vane can be significantly different for different incoming wind speeds because of the different blade pitch control algorithms. With the vigorous development of wind energy in complex terrain and the development of floating offshore wind turbines, wind turbines are confronted with increasingly complex operational conditions and environments [47,48]. There is an urgent demand for the development of advanced diagnostic methods of yaw error.
A recent study took into account the contribution of blade turbulence and azimuth on yaw error. Zhang et al. [24] proposed a charting method based on LiDAR measurement data to calibrate the yaw deviation. Firstly, the LiDAR measurement data, wind vane measurement data, and active power for a period of time were collected. Subsequently, the data were analyzed to create a yaw error table correlated with the active power (wind speed) and azimuth. The error table was plotted as a rose diagram, as displayed in Figure 5a. The entire azimuth range (360 degrees) is divided into 12 sectors, where each solid line represents the active power at different wind speeds. It can be observed that the yaw error exhibits variability with power within the same sector and also differs across sectors at the same power level. Finally, the yaw error table is combined into the yaw control system in Figure 5b, where the dashed box contains the yaw error calibration model. The current yaw error Δ ϕ is derived from the calculated yaw value, yaw azimuth sector, and the corresponding active power lookup error table, then combined with the yaw angle ϕ as the final yaw angle reference value ϕ to govern the movement of the yaw system. The power performance of the two wind turbines before and after the application of the strategy is illustrated in Figure 6. A significant improvement in the performance of the wind turbines (especially #2) is apparent. This method optimizes yaw error diagnosis by utilizing power and azimuth partitioning. However, the method is constrained by the resolution of the power and azimuth partitioning.
The diagnostic method based on LiDAR data can accurately identify the yaw error. However, the high cost of LiDAR represents a significant limitation for its large-scale application in wind turbines, despite the fact that the literature [24,44] indicates that the cyclic application of LiDAR can effectively reduce the cost. Moreover, LiDAR devices are not as stable as wind vanes and may fail due to factors such as terrain, weather, and marine environments [44].

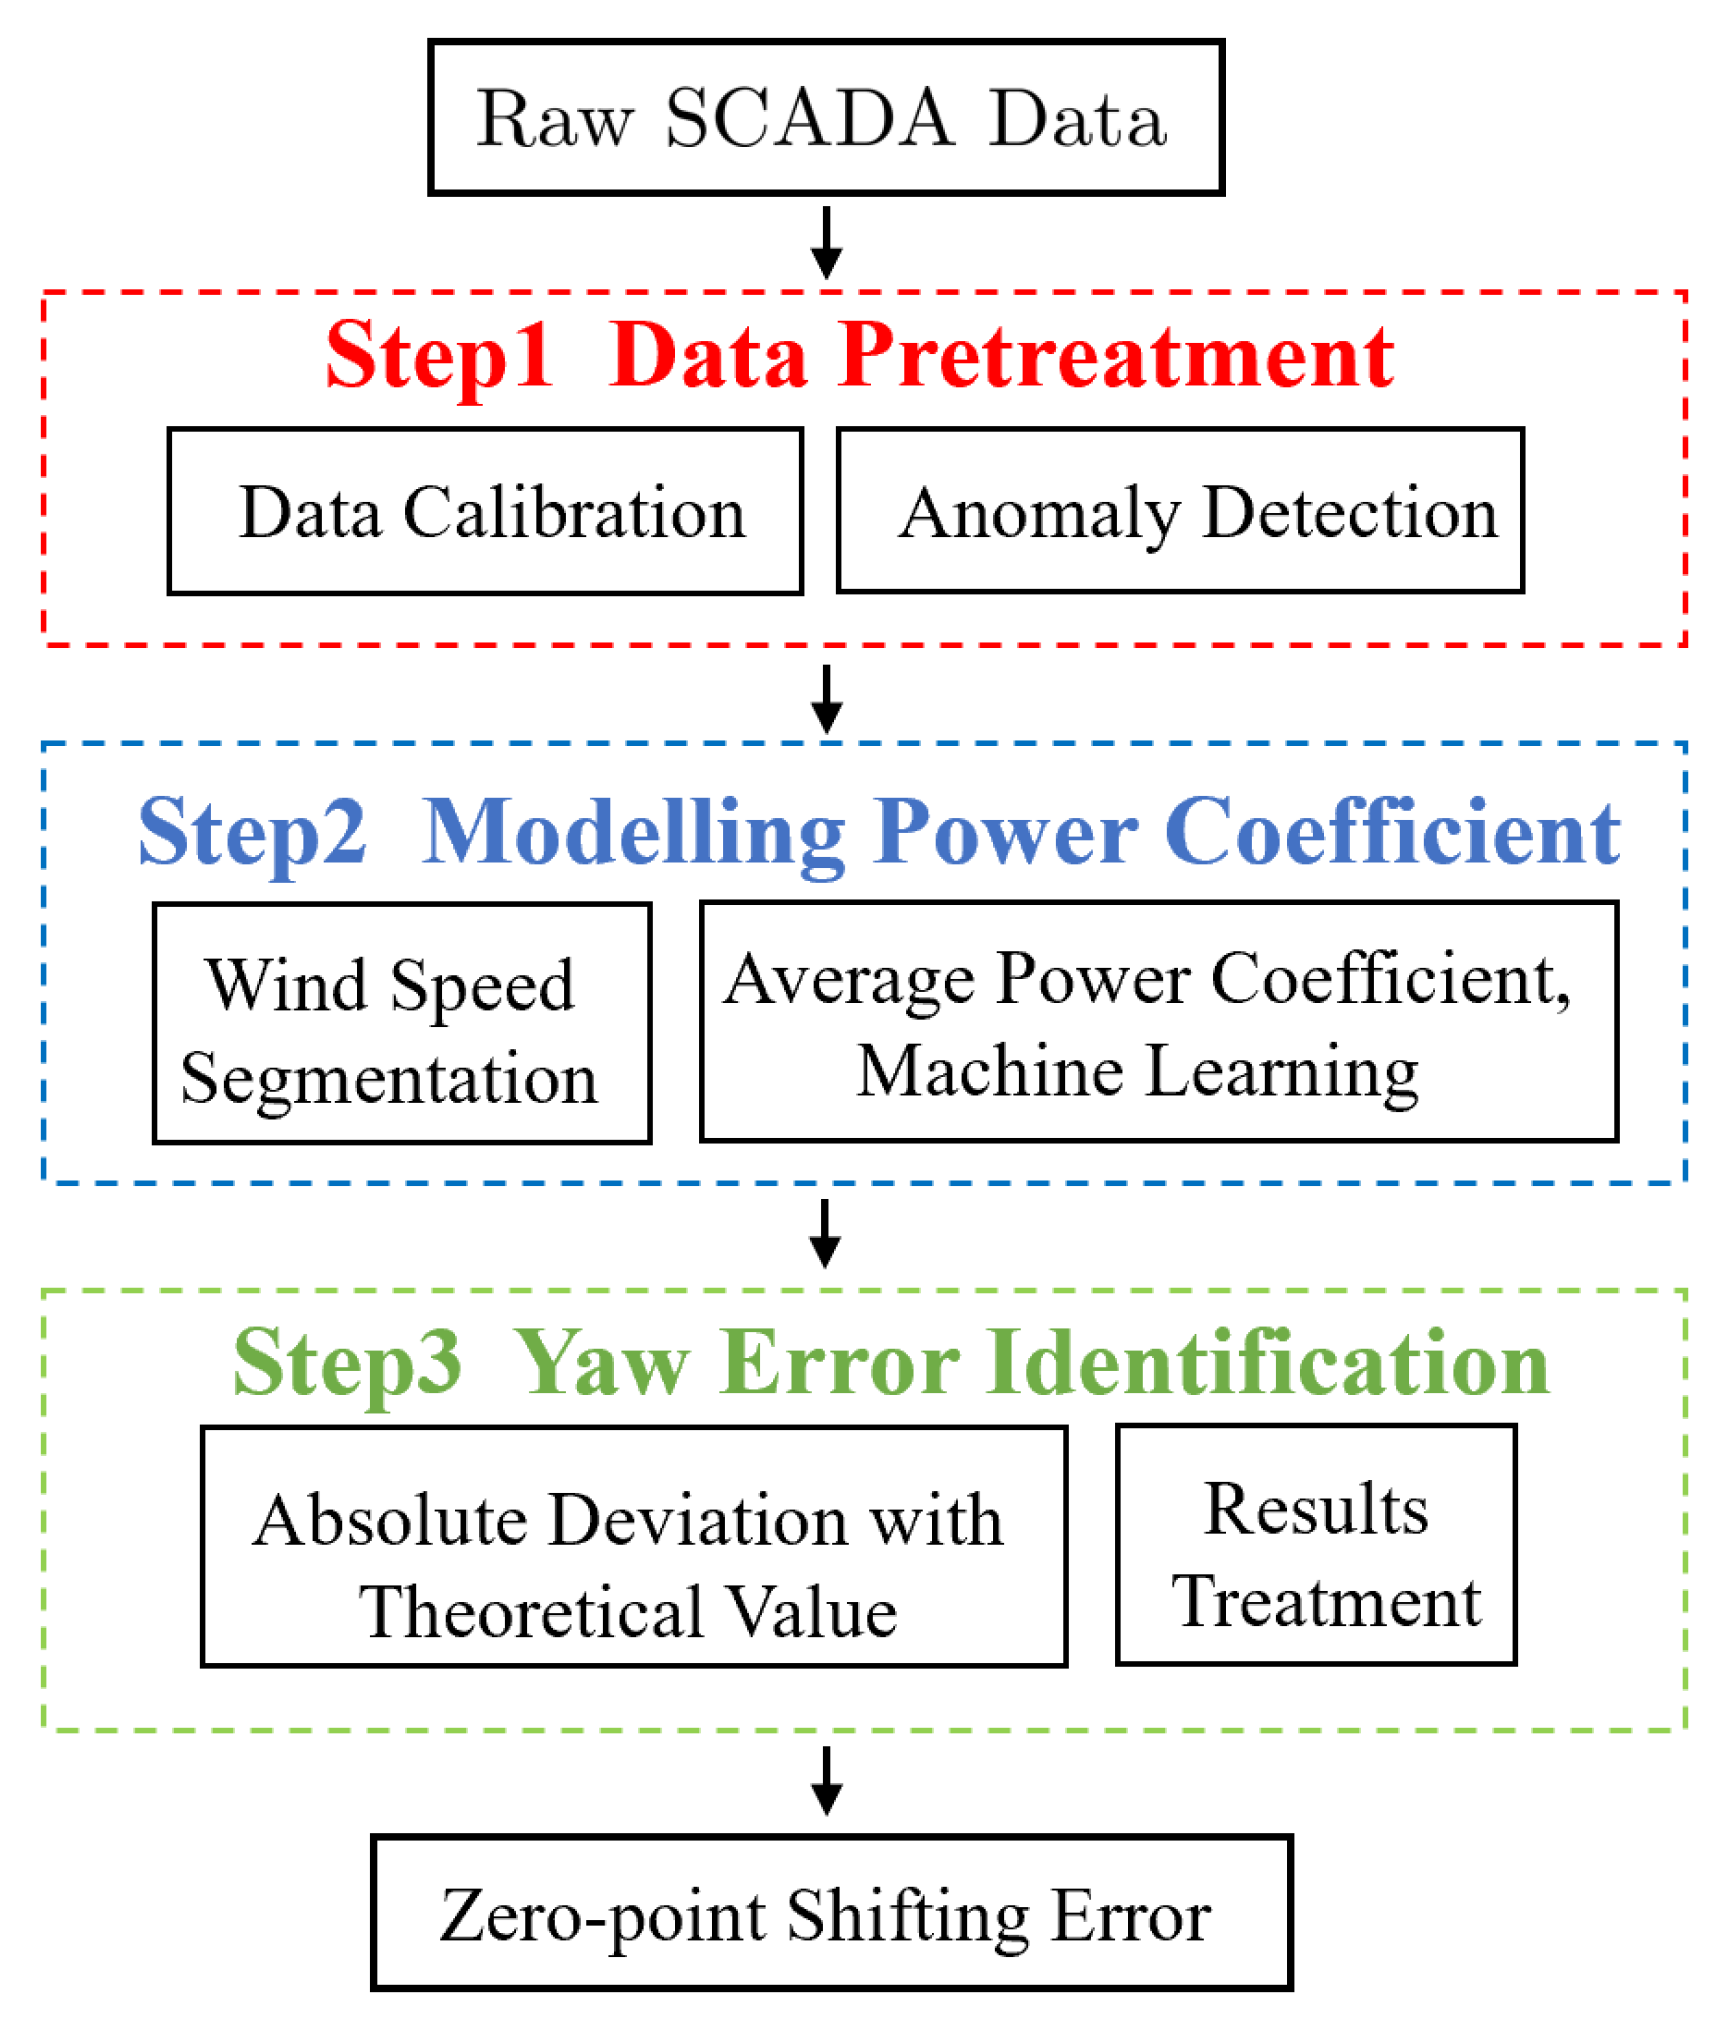
3.2. Diagnostic Methods Based on SCADA Data

It is acknowledged that yaw error cannot be directly identified based on the difference between the wind direction measured at the wind vane and the nacelle orientation from the SCADA data. The performance of a wind turbine exhibits multivariate dependence on environmental conditions and operating parameters [49] with repeating statistical features [46]. The performance of a wind turbine is inevitably compromised when it experiences a yaw error, resulting in a variation of the characteristics, including power and rotational speed, etc. The diagnostic method based on SCADA data is to detect the yaw error by utilizing the correlation between yaw and other characteristic quantities. This approach is based on the mechanism of yaw error and characteristic quantities, employs data mining technology to investigate the mapping relationship, and finally obtains the potential yaw error and its evolution. The acquisition of wind data can be achieved through the deployment of either a wind vane, which possesses an accuracy of ±2° [25,26], or a sonic anemometer, which has a superior degree of accuracy. However, it should be noted that both devices are subject to the influence of the nacelle boundary layer, which invariably introduces a certain degree of inaccuracy. The advantages of the data-driven method are low cost, short research and development cycle, and high application value [46]. Based on the differences in feature selection and diagnostic principles, the classification of data-driven methods based on SCADA data is presented in Table 1.
One widely employed diagnostic method is based on the power curve [23,25,26,34,35,36,37]. It is a method based on the binning of power output for different yaw angles. In the method, the binning of SCADA data for various yaw angles is completed first, followed by the analysis of power performance in different bins, and finally the diagnosis of yaw error. The methods include three key components: (1) data preprocessing, during which the raw data collected by the SCADA system are preprocessed and divided based on different yaw angles; (2) power curve modeling, in which the power curve is modeled based on the divided data set; (3) yaw error identification, which establishes an evaluation indicator of the power curve performance, evaluates it under different yaw angles, and finally analyzes the indicator to derive the yaw error. Figure 7 displays the fundamental framework of the diagnostic method based on the power curve. The differences between different methods are found in the above three components. An overview of the various power curve modeling approaches and evaluation indicators is given later.
In the study by Bao et al. [34], the least-squares B-spline curve was utilized to model the power curve, with the equivalent operating time as the evaluation indicator. Pei et al. [26] performed the diagnosis of yaw error by comparing the average power magnitude between different yaw bins. However, it should be noted that both methods require a substantial amount of input data to ensure their stability. To address this issue, Jing et al. [25] employed a cubic polynomial to fit the power curves of each sub-dataset and the integral of the power curves over wind speeds as a criterion. Moreover, they analyzed the coupling of yaw motion error and the zero-point shifting error. The performance of two wind turbines before and after yaw error calibration by applying Jing et al.’s method is illustrated in Figure 8. The blue and red lines show the power curve before and after calibration, respectively. As seen, yaw error calibration increases the power output of the wind turbine. Approaches similar to those discussed above can be found in other studies [35,36,37].
The diagnostic method based on the analysis of power curves is straightforward, widely applicable, and capable of diagnosing the static yaw error of wind turbines. However, the method relies on the poor performance of wind turbines to establish a statistical model when yaw error exists. There are many factors (other systematic errors [50], environmental factors [51,52,53], etc.) that may induce the poor performance. Moreover, methods based on power curves are also constrained by the quality and quantity of monitoring data, which may be of low accuracy and poor stability. The approach is constrained by the bin size of the yaw partition. Based on the power curve analysis, the yaw angle is partitioned with a size of 2°, and the accuracy is tested to be within ±1° [54].
In light of the numerous factors that impact active power, several studies have sought to diagnose yaw error by examining phenomena that are specific to yaw error. The literature [27,28,38] utilized the relationship between yaw error and power coefficient to diagnose the yaw error. The definition of the power coefficient is as follows:
C p = P 0.5 ρ A u 3 cos 3 θ
where C p is the actual power coefficient of the wind turbine, P stands for the active power, ρ represents the air density, A is the swept area of the wind turbine, u stands for the wind speed perpendicular to the rotor plane, and θ is the actual measured yaw angle.
The idea of the power coefficient method is to model the power coefficients at different speed bins and observe the discrepancy between the actual yaw value, where the maximum power coefficient occurs in the monitoring data, and the theoretical yaw value (generally zero) to detect the yaw error of the wind turbine. Figure 9 depicts the basic framework of the power coefficient approach. Astolfi et al. [28] derived the power coefficient curve from the average power coefficients of the speed bins. This method is widely applicable, while the accuracy is limited by the binning resolution. Yang et al. [27] improved the method by modeling the power coefficient curves with the nonparametric sparse Gaussian process regression algorithm. The anomaly values were processed by applying the quartile method for different speed bins. However, the model does not take into account the effects of turbulence intensity and ambient temperature.
In comparison to the power curve method, the power coefficient method is more accurate and requires a smaller amount of data. This increased accuracy is attributed to the selection of the power coefficient C p rather than the active power P as the feature for analyzing. C p is relatively less dependent on the wind speed compared to P, which provides for a more reliable connection between power coefficients and yaw errors. The accuracy is tested within ±0.3° for the method based on power coefficient analysis [54]. Nevertheless, the generalization of the power coefficient method remains to be investigated. The methods based on the power curves or the power coefficients are designed for diagnosing the zero-point shifting error.
The majority of approaches to the study of the dynamic error using the SCADA data are primarily based on the relationship between the operational parameters (wind speed, wind direction, etc.) and the yaw angle [9,20,36,39,40,41,42]. Models can be constructed on the basis of historical data to predict future changes in yaw angle. The measured yaw angles are then compared with the predicted values to determine the dynamic error.
In contrast to the data-driven approach based on SCADA data mentioned above, Solomin et al. [43] simulated the aerodynamic flow of the wind turbine using computational fluid dynamics (CFD) analysis. This analysis was designed to model the dynamic response between wind speed, rotational speed, and yaw angle. Subsequently, the response model was applied to complete the yaw error diagnosis by incorporating the wind speed and rotational speed data recorded by the SCADA system. This method is capable of predicting the static yaw error more accurately through numerical simulation, but further improvements in accuracy are required. Additionally, it requires the parameters of wind turbine blade shape to complete the modeling, and the process of establishing the dynamic response model is complicated and time-consuming.

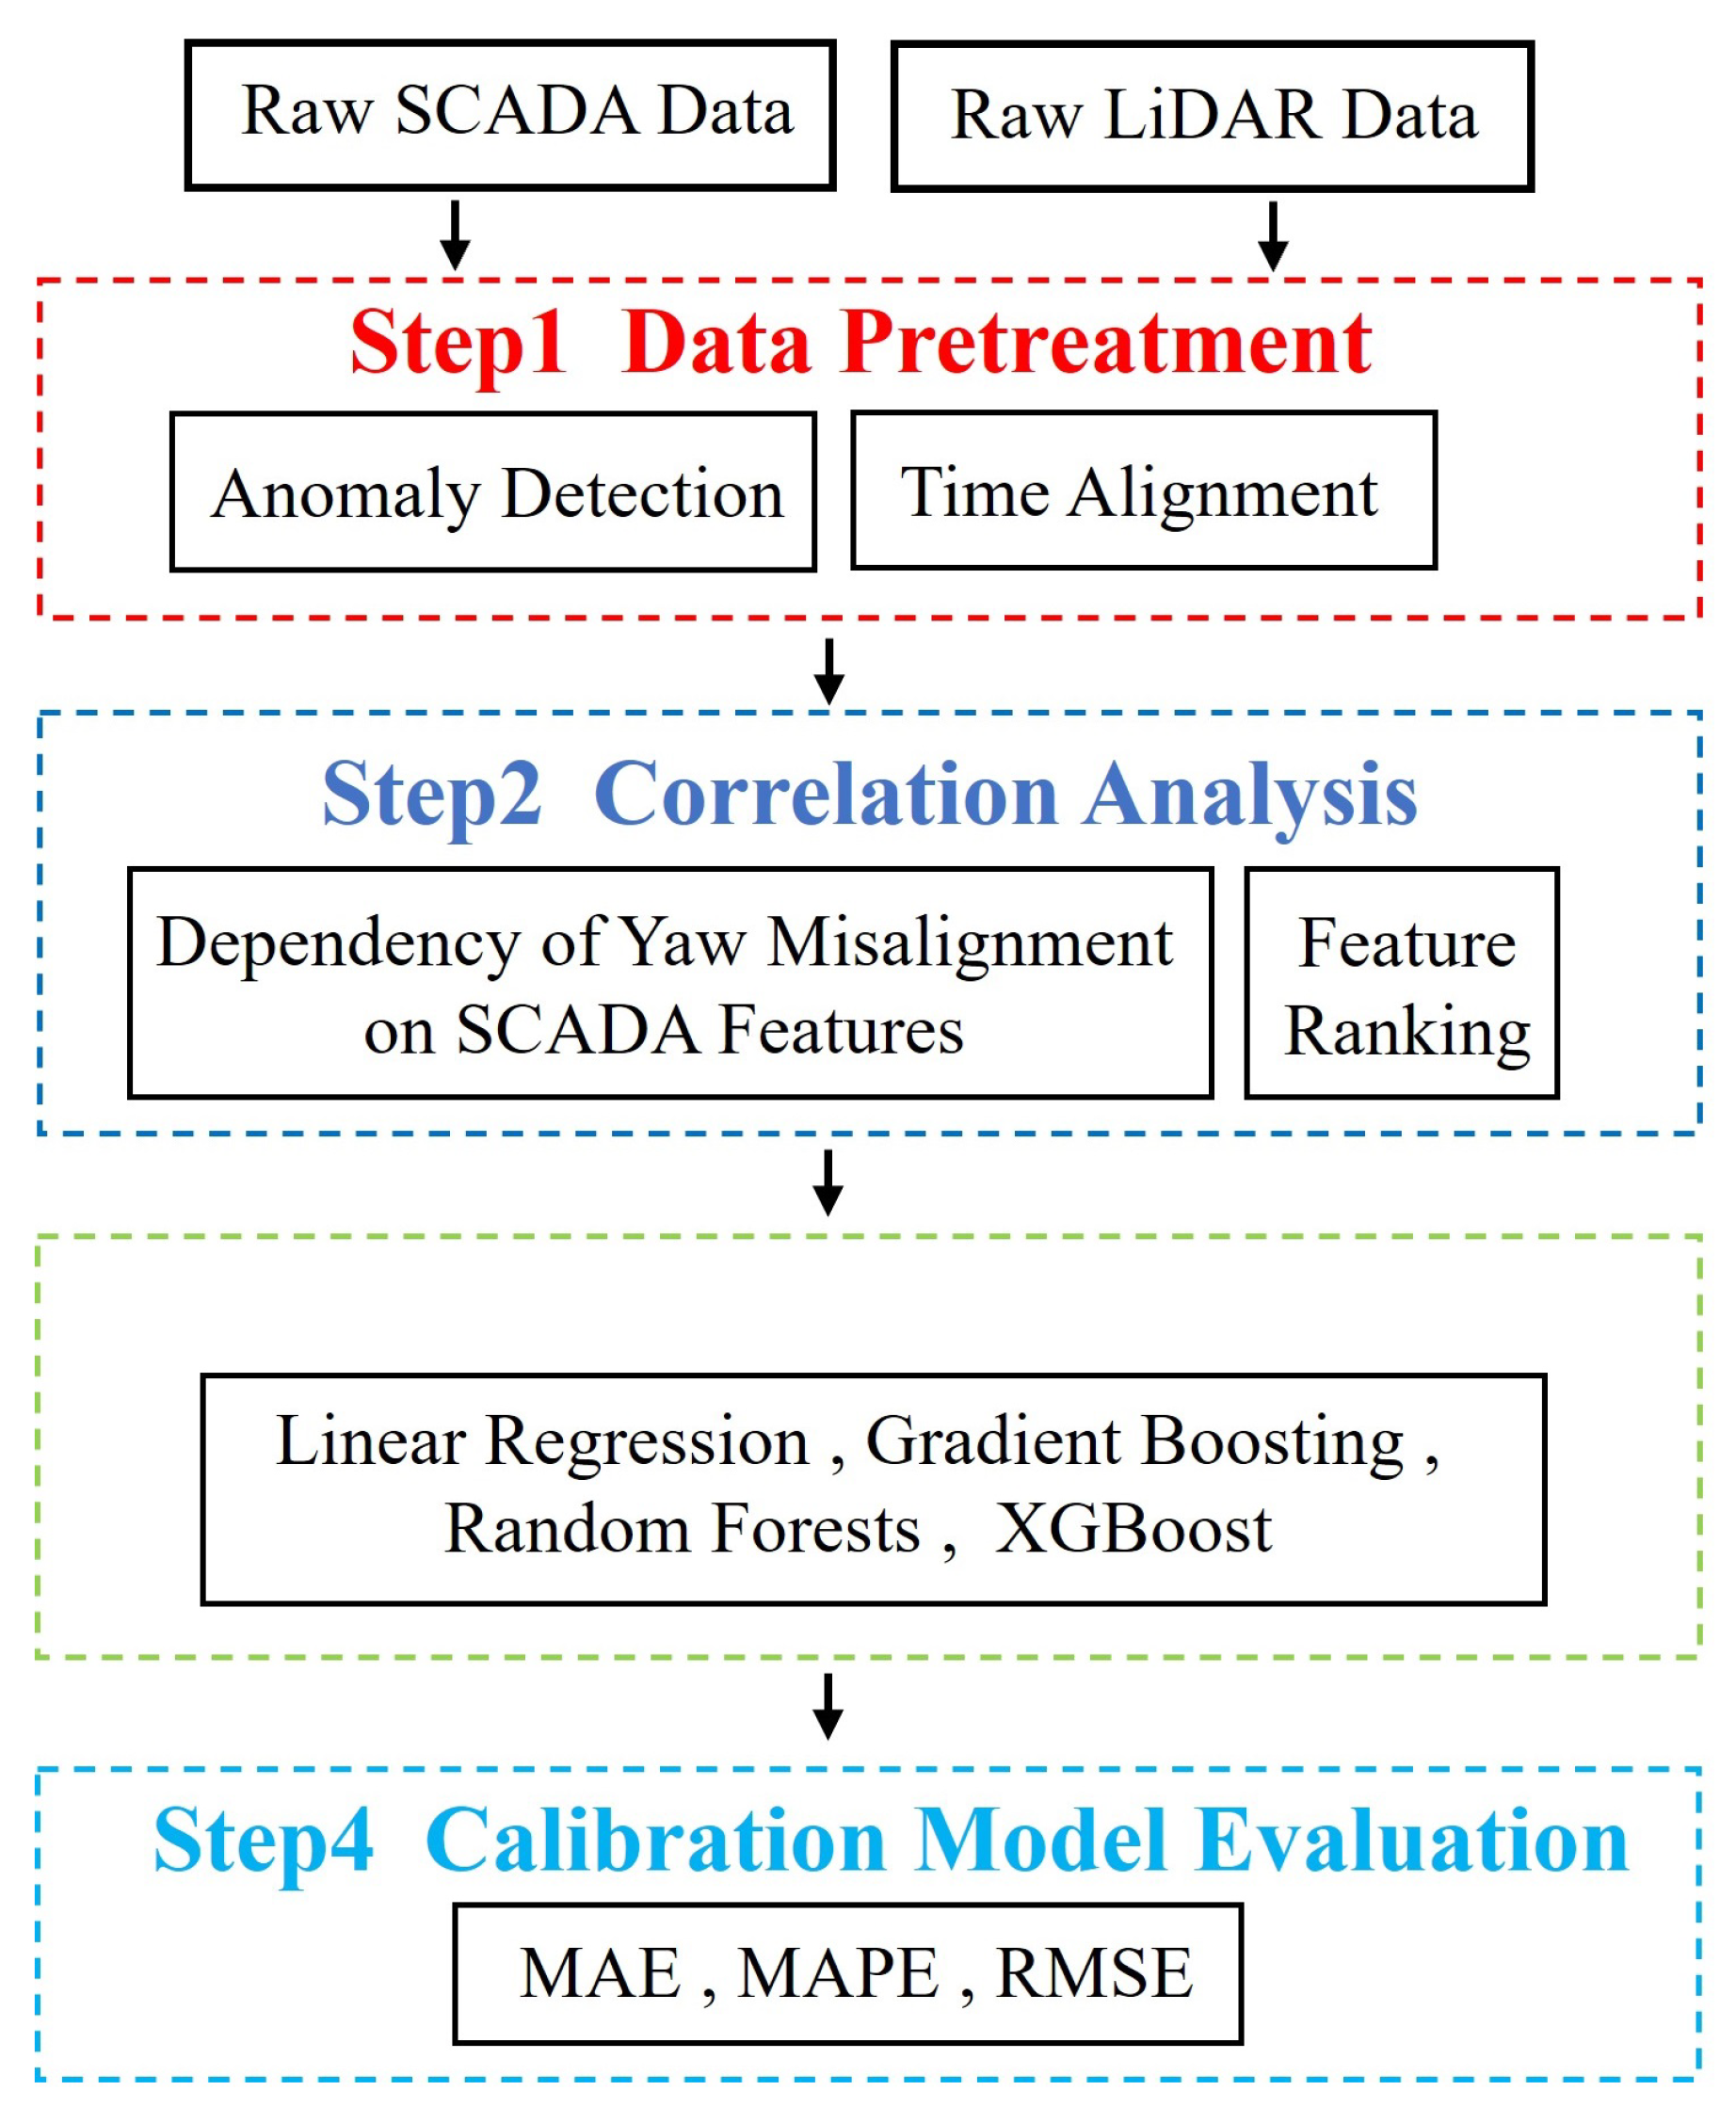
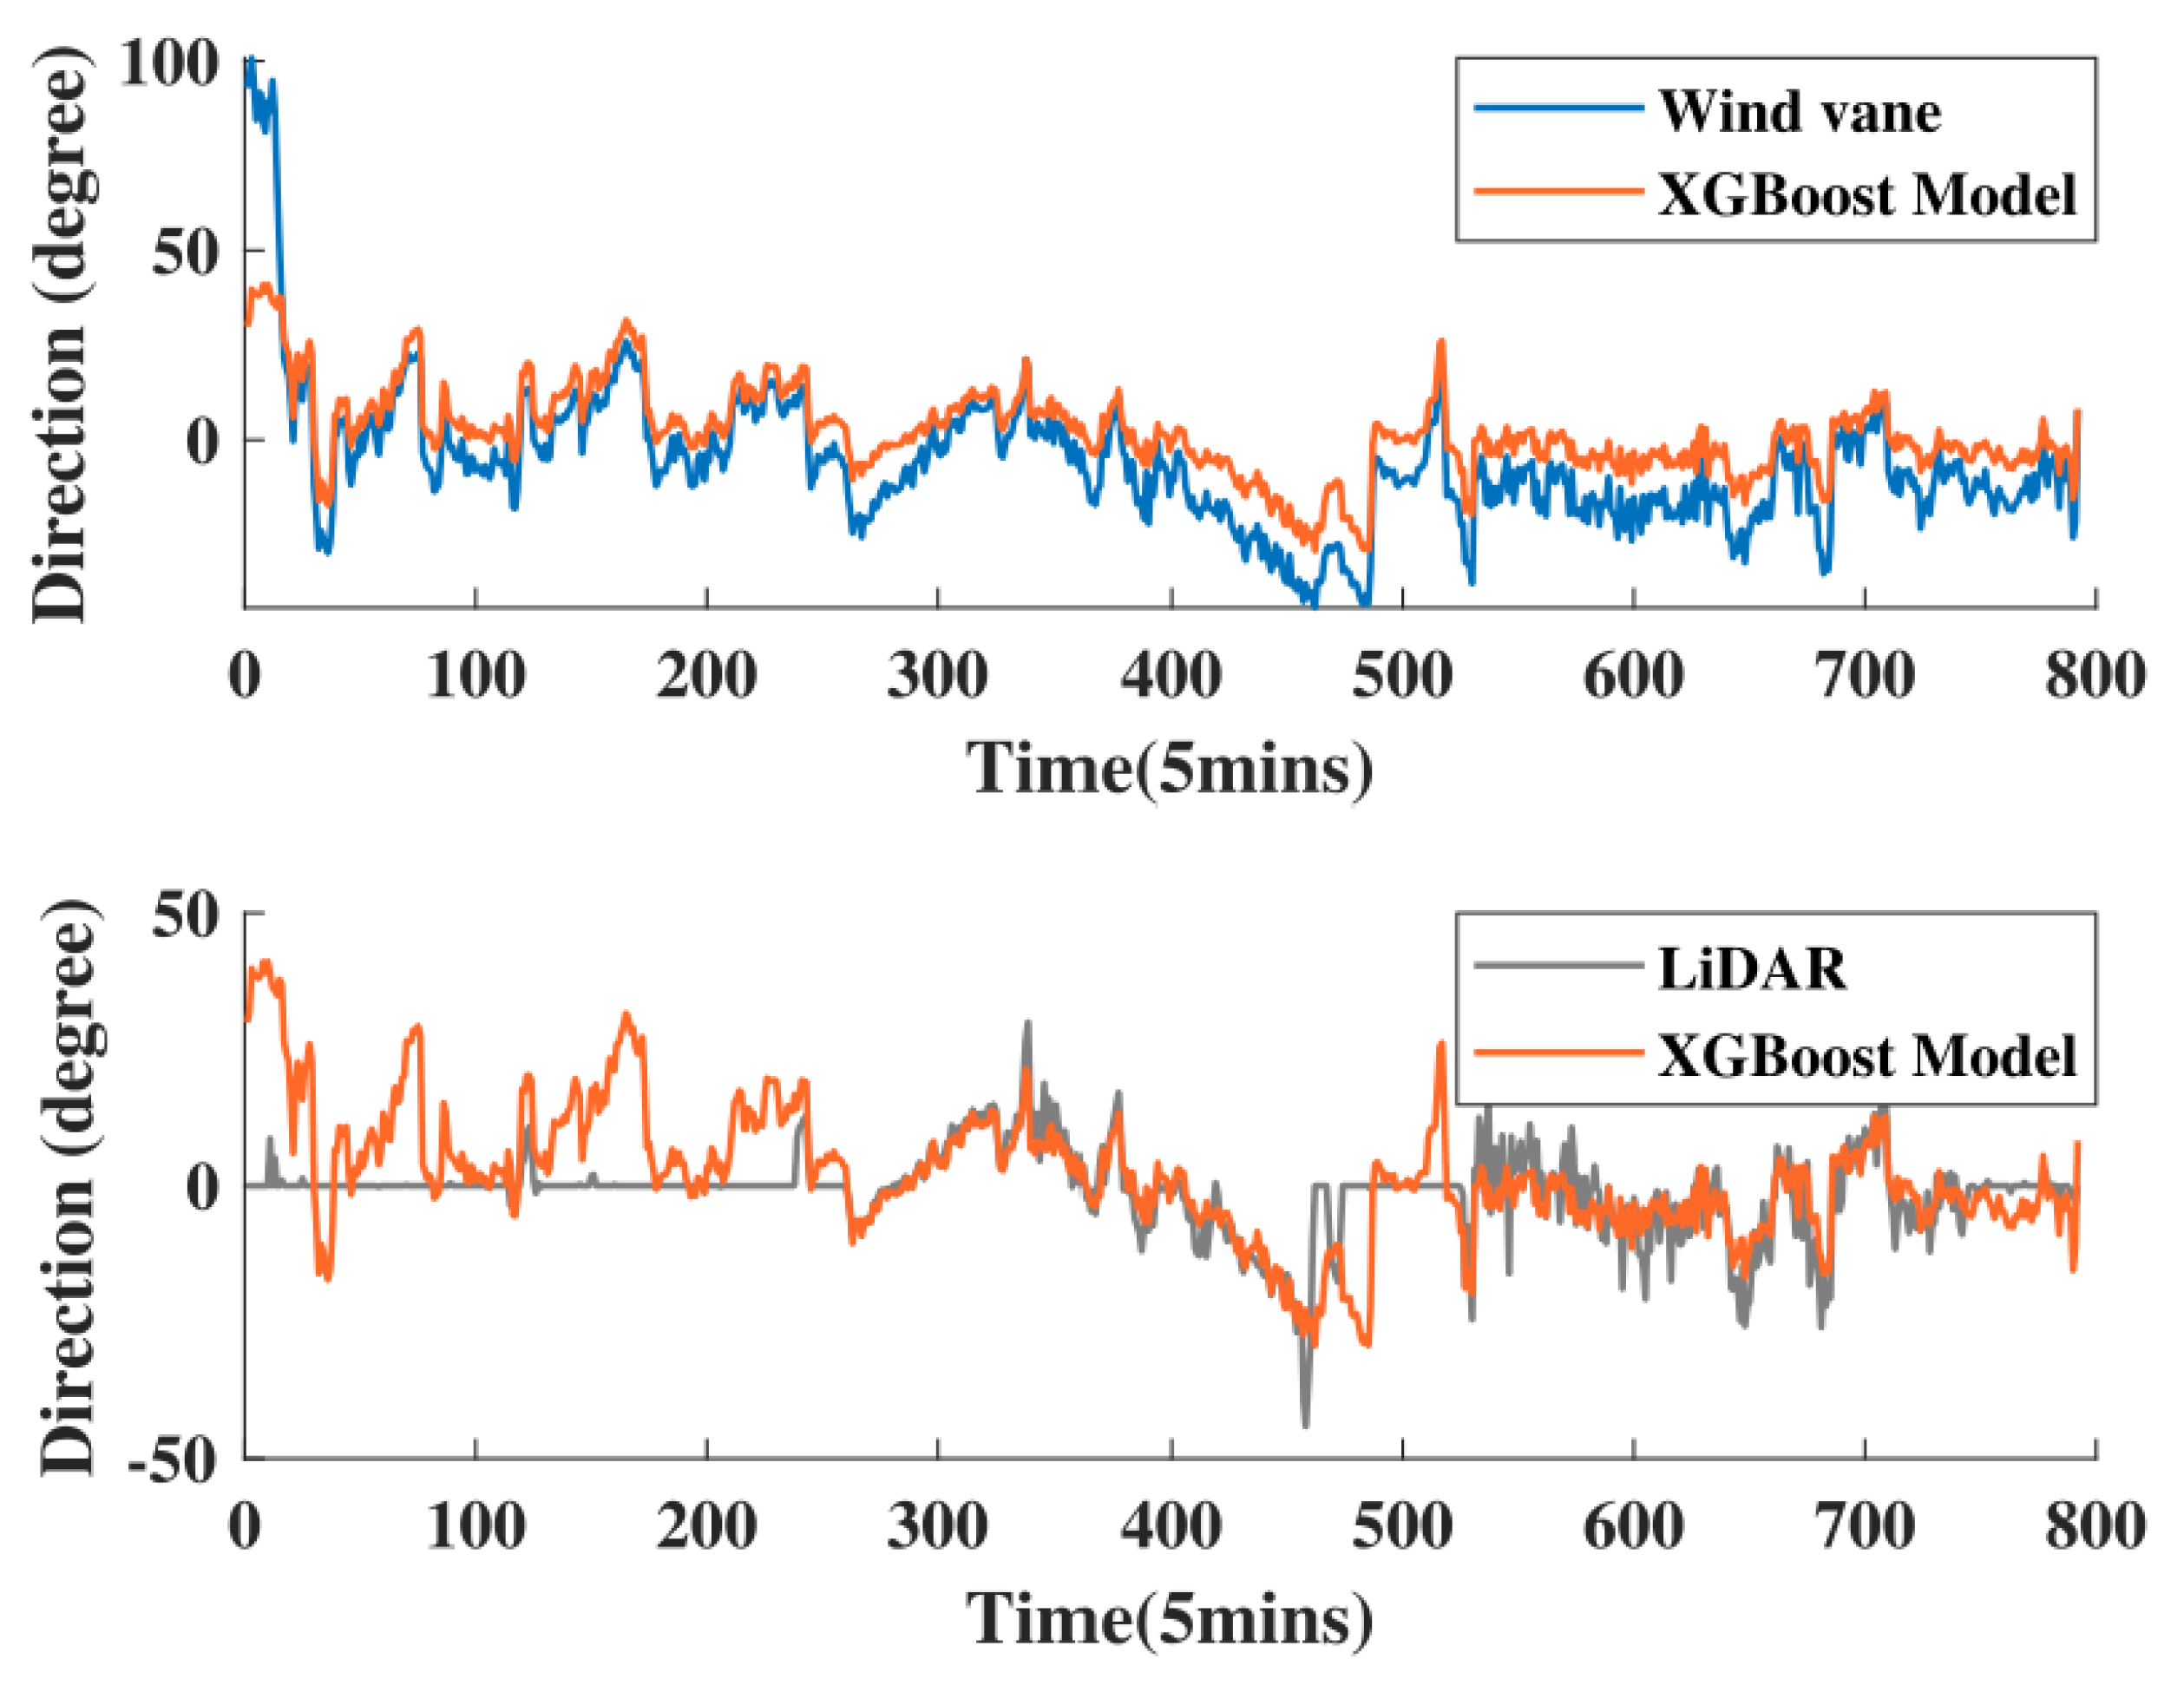
3.3. Diagnostic Methods Based on the LiDAR and SCADA Data

Diagnostic methods based on LiDAR data are generally capable of accurately diagnosing two main errors. Firstly, the zero-point shifting error is determined by the mean of the difference between the wind directions measured by the LiDAR and by the wind vane over a long sample period. Secondly, dynamic yaw error is determined by the dynamic alignment of LiDAR and wind vane measurements [24]. However, the relatively high cost of LiDAR is the major limitation of its widespread application. Lower-cost methods based on SCADA data to fulfill the diagnosis of yaw error are possible, although the accuracy and generalization of these methods are yet to be demonstrated. Hybrid methods using both LiDAR and SCADA data, leveraging the strength of the two methods, have the potential to yield promising results in the diagnosis of yaw error. The advantages of the hybrid approach are twofold. Firstly, it has the potential to reduce the amount of the LiDAR data required, resulting in cost savings. Secondly, it facilitates the calibration of wind vane data through the utilization of the LiDAR data, thereby improving the accuracy and reliability of the results.
Currently, there are only a few studies that have developed diagnostic methods based on both LiDAR and SCADA data. In 2024, Chen et al. [44] proposed a yaw error calibration model based on machine learning methods. The model framework is shown in Figure 10. The model employs LiDAR data as a benchmark and selects the SCADA measurement features that had high correlations with the LiDAR data. The model was trained using the selected data and the LiDAR data. Initially, calibration models were developed based on four different machine learning approaches. Subsequently, performance metrics related to errors were evaluated and analyzed for these models. Figure 11 illustrates the comparison results of wind direction during the field test. It is apparent that the wind direction estimation results that are very close to the valid LiDAR data are from the XGBoost model, while the wind vane is unable to accurately measure the wind direction. This outcome indicates that the model is more capable of identifying the dynamic yaw error. The experimental results show that the minimum MAE for predicting dynamic yaw error is 3.148°. This work demonstrates the ability of machine learning methods to utilize data to accomplish continuous detection of yaw errors by learning the influences implicit in the data.

4. Summary of the Review

The existence of yaw error reduces the rotor alignment accuracy, an important factor affecting the performance of yaw-based wind turbine control strategies. With the increase in the total installed capacity of wind energy, the importance of rapid and accurate yaw error diagnostic methods for improving the performance of wind turbines is becoming evident. The intricate structure of the wind turbine system presents a challenge in diagnosing malfunctions: malfunction in a single component can result in variations in multiple operational parameters, and malfunctions in different components may affect the same operational parameters. The art of diagnostic methods leverages the comprehensive set of monitored data of diverse features, integrates it with the yaw control strategy, and considers the intricate operational environment to uncover the cause of yaw errors and improve the effectiveness and efficiency of rotor alignment.
This paper reviews the available methods for diagnosing yaw errors in horizontal axis wind turbines. The principles of the diagnostic methods and their advantages and disadvantages, the causes of yaw errors, and the classification of the diagnostic methods based on the data employed for diagnosis are discussed. The utilization of LiDAR provides accurate information regarding the incoming wind, which can be directly employed to detect the yaw error. However, the cost of employing LiDAR-based diagnostic methods in large-scale wind farms is high [24,44]. One solution is to employ the SCADA data together with the LiDAR data, taking advantage of the temporal and spatial correlations of the flows to enable yaw error diagnosis for groups of wind turbines. For instance, in some works [55,56], the correlation was employed to construct the wind speed and direction model based on so-called group intelligence.
Because of the complexity of the atmospheric environment and the wind turbine system, identifying the cause and solving the problem effectively using conventional statistical methods is difficult. In the literature, the data-driven approach has shown promising results. For instance, it was employed to investigate the causality between power output and yaw error [49], leveraging the principles of system operation to mine the features that are uniquely correlated with yaw error, which cannot be identified using the simple relationship of the power for yawed wind turbines, i.e., P = P 0 cos 3 θ , where P 0 is for zero yaw angle and θ is the yaw angle. A significant challenge confronting data-driven methodologies is their generalizability, which can be improved by integrating knowledge into the model learning process. Moreover, the digital twin (DT) technology provides a novel concept for identifying and predicting errors by facilitating seamless integration and real-time mapping between analogue and physical spaces. The development of twin carriers within information technology platforms has the potential to facilitate the data interaction and service integration with physical entities. The preliminary fault detection algorithms by Dinh et al. [57] have yielded promising results. In addition to LiDAR data, data from numerical simulations at various scales (e.g., wind turbines, wind plants, and mesoscale meteorology) can be employed to improve the range of temporal and spatial scales and the spatiotemporal resolutions of the atmospheric environment. Moreover, a digital twin of different wind energy system components is necessary for a comprehensive description of the status of the system operation together with the SCADA data.

Funding

This work was supported by NSFC Basic Science Center Program for “Multiscale Problems in Nonlinear Mechanics” (no. 11988102), the Strategic Priority Research Program of Chinese Academy of Sciences (CAS, No. XDB0620102), National Natural Science Foundation of China (No. 12172360), and CAS Project for Young Scientists in Basic Research (YSBR-087).

Data Availability Statement

The original contributions presented in the study are included in the article, further inquiries can be directed to the corresponding author.

Conflicts of Interest

Authors Qian Li and Hangbing Lin were employed by the company Huaneng Clean Energy Research Institute, Huaneng Group Ltd. The remaining authors declare that the research was conducted in the absence of any commercial or financial relationships that could be construed as a potential conflict of interest.

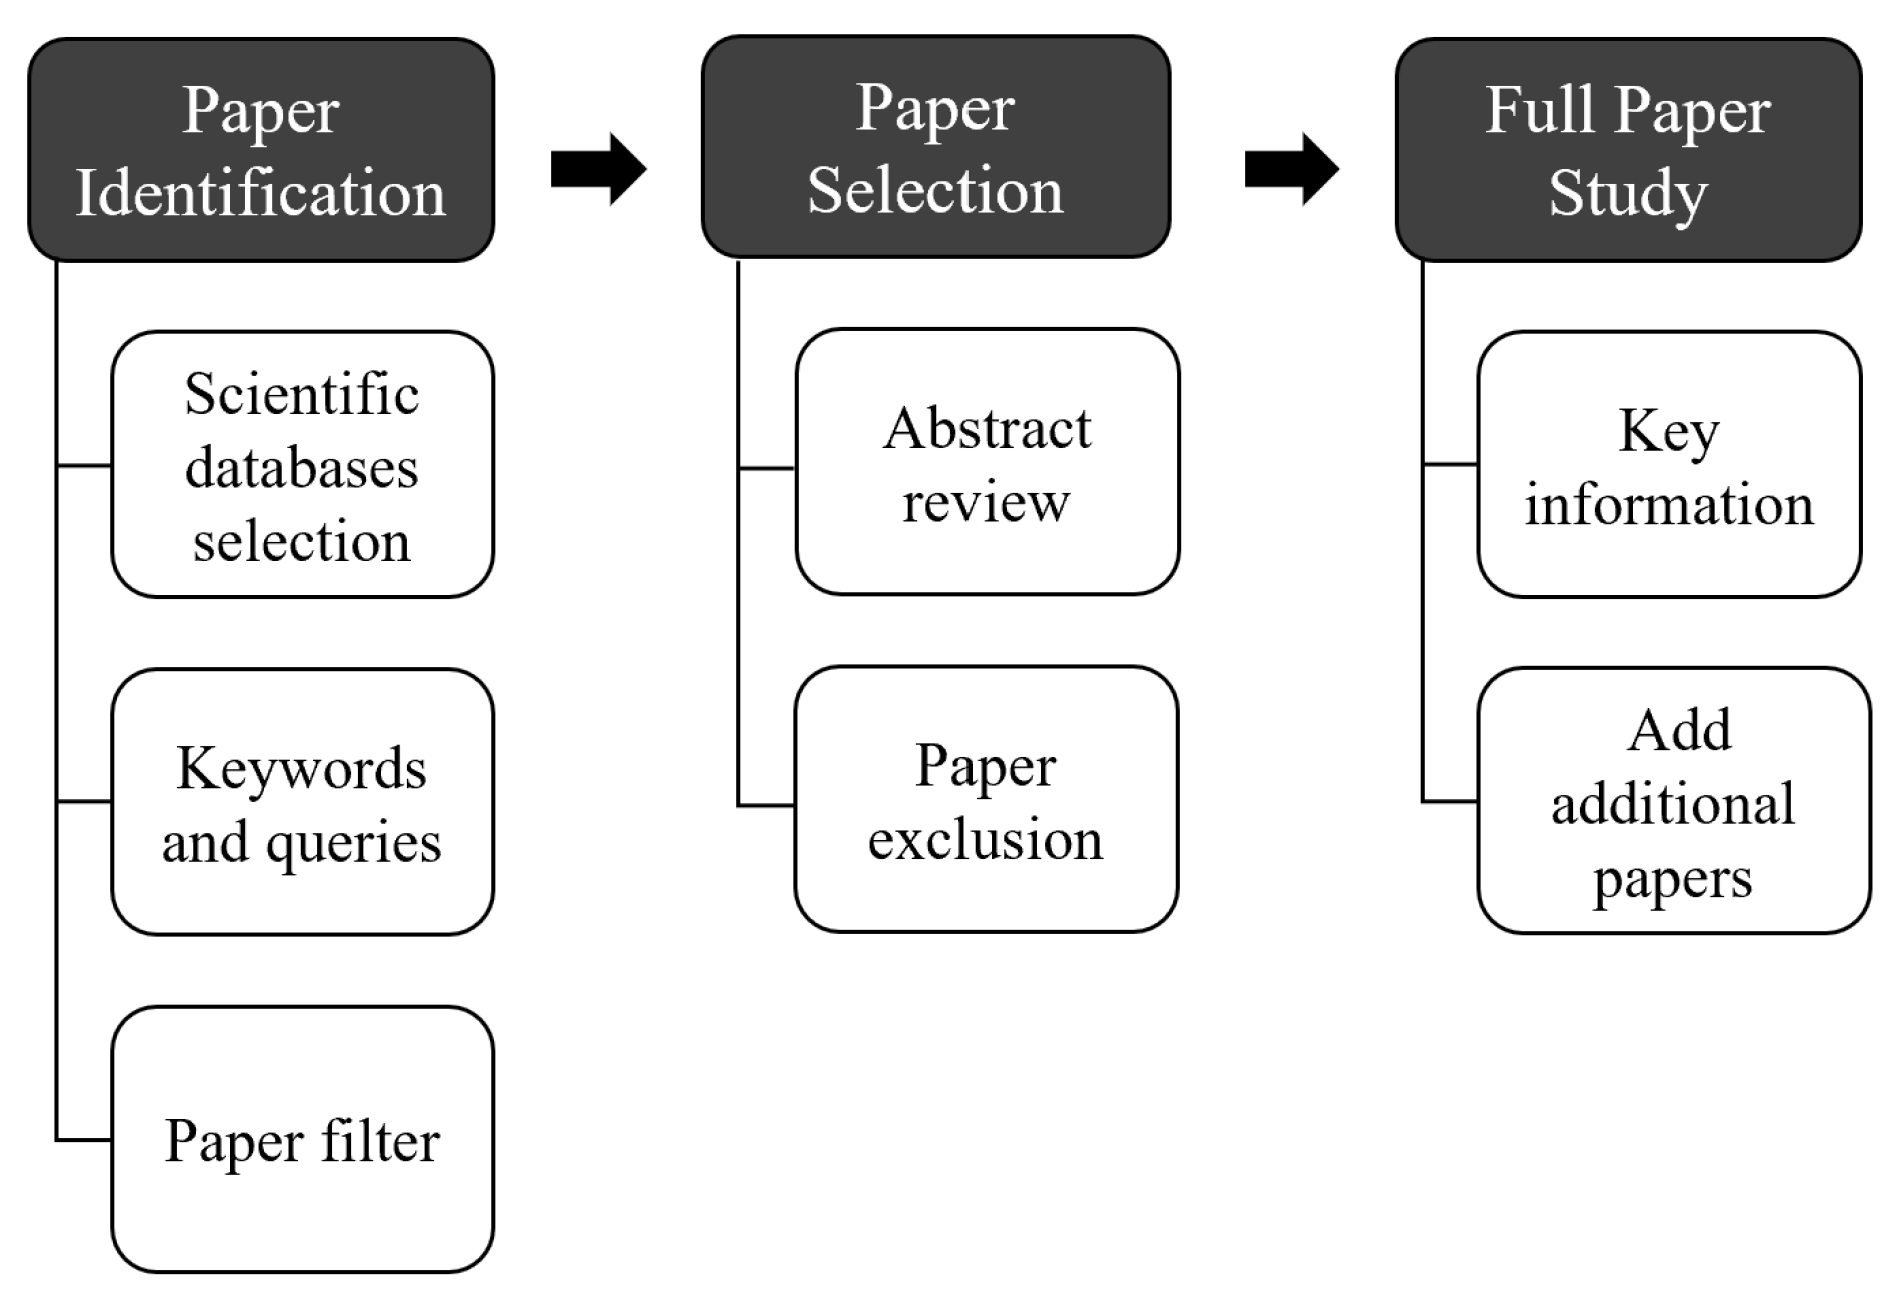
Appendix A. Procedure of the Literature Review

This section describes the procedure implemented for the literature review. As shown in Figure A1, it is divided into three phases, i.e., paper identification, paper selection, and full paper review.
Figure A1. Schematic of the procedure of the literature review.
Energies 18 00588 g0a1
The first phase involves the determination of the databases to be searched and the keywords used for the search queries. In this paper, we used two well-known databases, Web of Science (WOS) and Scopus. Both databases provide access to a range of information, including journals, abstracts, and books. The key words used for the search are listed in Table A1.
Table A1. Keywords and queries employed in WoS and Sopus.
KeywordsWeb of ScienceScopus
wind turbine, wind turbines, yaw error, yaw misalignment, detection, detecting, diagnosis, diagnosticTS = (wind turbine OR wind turbines) AND TS = (yaw error OR yaw misalignment AND TS = (detection OR detecting OR diagnosis OR diagnostic)(TITLE-ABS-KEY(“wind turbine”) OR TITLE-ABS-KEY(“wind turbines”) AND TITLE-ABS-KEY(“yaw error”) OR TITLE-ABS-KEY(“yaw misalignment”) AND TITLE-ABS-KEY(“detection”) OR TITLE-ABS-KEY(“detecting”) OR TITLE-ABS-KEY(“diagnosis”) OR TITLE-ABS-KEY(“diagnostic”)
The second phase consists of reading abstracts and selecting articles. The final phase involves systematic research and analysis of the selected articles. In this phase, other relevant papers may be selected from the references of the selected articles. The literature study focuses on the following four aspects:
  • The source of the data (e.g., SCADA, LiDAR, etc.) used for diagnosis.
  • The methods employed for diagnosis.
  • The types of errors that can be identified.
  • The merits and demerits of the employed diagnostic methods.
For the present study, the query in the Scopus and WoS databases identified 370 articles in total (257 in Scopus and 113 in WoS). After removing the articles that were not related to any of the above four aspects, 37 articles were selected for the literature review. Figure A2 shows the numbers of publications over the past 13 years in terms of the data employed for error diagnosis.
Figure A2. Numbers of articles published in recent years.
Energies 18 00588 g0a2
Specialized software (e.g., Bibliometri 4.3.1) was not employed in this work, which is mainly because of the small number of articles in this specific research field. Moreover, the present review focuses on the technical aspect of the field, which largely depends on the expert’s knowledge. It is difficult to obtain useful information from the statistics of the literature.

References

  1. Sadorsky, P. Wind energy for sustainable development: Driving factors and future outlook. J. Clean. Prod. 2021, 289, 125779. [Google Scholar] [CrossRef]
  2. Chang, L.; Saydaliev, H.B.; Meo, M.S.; Mohsin, M. How renewable energy matter for environmental sustainability: Evidence from top-10 wind energy consumer countries of European Union. Sustain. Energy Grids Netw. 2022, 31, 100716. [Google Scholar] [CrossRef]
  3. GWEC. Global Wind Report 2024; Technical Report; Global Wind Energy Council: Lisbon, Portugal, 2024. [Google Scholar]
  4. IRENA. World Energy Transitions Outlook 2023: 1.5 °C Pathway; Technical Report; International Renewable Energy Agency: Abu Dhabi, United Arab Emirates, 2023. [Google Scholar]
  5. Gebraad, P.M.O.; Teeuwisse, F.W.; van Wingerden, J.W.; Fleming, P.A.; Ruben, S.D.; Marden, J.R.; Pao, L.Y. Wind plant power optimization through yaw control using a parametric model for wake effects-a CFD simulation study. Wind Energy 2016, 19, 95–114. [Google Scholar] [CrossRef]
  6. Bowen, A.; Zakay, N.; Ives, R. The field performance of a remote 10 kW wind turbine. Renew. Energy 2003, 28, 13–33. [Google Scholar] [CrossRef]
  7. Rauh, A.; Seelert, W. The Betz Optimum Efficiency for Windmills. Appl. Energy 1984, 17, 15–23. [Google Scholar] [CrossRef]
  8. Wan, S.; Cheng, L.; Sheng, X. Effects of Yaw Error on Wind Turbine Running Characteristics Based on the Equivalent Wind Speed Model. Energies 2015, 8, 6286–6301. [Google Scholar] [CrossRef]
  9. Astolfi, D.; Pandit, R.; Lombardi, A.; Terzi, L. Diagnosis of wind turbine systematic yaw error through nacelle anemometer measurement analysis. Sustain. Energy Grids Netw. 2023, 34, 101071. [Google Scholar] [CrossRef]
  10. Boorsma, K. Power and Loads for Wind Turbines in Yawed Conditions. Analysis of Field Measurements and Aerodynamic Predictions. 2012. Available online: https://publications.tno.nl/publication/34629178/y56dz3/e12047.pdf (accessed on 15 August 2024).
  11. Jeong, M.S.; Kim, S.W.; Lee, I.; Yoo, S.J.; Park, K.C. The impact of yaw error on aeroelastic characteristics of a horizontal axis wind turbine blade. Renew. Energy 2013, 60, 256–268. [Google Scholar] [CrossRef]
  12. Dai, L.; Zhou, Q.; Zhang, Y.; Yao, S.; Kang, S.; Wang, X. Analysis of wind turbine blades aeroelastic performance under yaw conditions. J. Wind. Eng. Ind. Aerodyn. 2017, 171, 273–287. [Google Scholar] [CrossRef]
  13. Bernardoni, F.; Rotea, M.A.; Leonardi, S. Impact of yaw misalignment on turbine loads in the presence of wind farm blockage. Wind Energy 2024, 27, 535–548. [Google Scholar] [CrossRef]
  14. Howland, M.F.; Bas Quesada, J.; Pena Martinez, J.J.; Palou Larranaga, F.; Yadav, N.; Chawla, J.S.; Sivaram, V.; Dabiri, J.O. Collective wind farm operation based on a predictive model increases utility-scale energy production. Nat. Energy 2022, 7, 818–827. [Google Scholar] [CrossRef]
  15. Lopez, D.; Kuo, J.; Li, N. A novel wake model for yawed wind turbines. Energy 2019, 178, 158–167. [Google Scholar] [CrossRef]
  16. Medici, D. Experimental Studies of Wind Turbine Wakes: Power Optimisation and Meandering. Doctoral Dissertation, KTH, Stockholm, Sweden, 2005. [Google Scholar]
  17. Cherdantseva, Y.; Burnap, P.; Blyth, A.; Eden, P.; Jones, K.; Soulsby, H.; Stoddart, K. A review of cyber security risk assessment methods for SCADA systems. Comput. Secur. 2016, 56, 1–27. [Google Scholar] [CrossRef]
  18. Kim, M.G.; Dalhoff, P.H. Yaw Systems for wind turbines—Overview of concepts, current challenges and design methods. J. Phys. Conf. Ser. 2014, 524, 012086. [Google Scholar] [CrossRef]
  19. Fleming, P.A.; Scholbrock, A.K.; Jehu, A.; Davoust, S.; Osler, E.; Wright, A.D.; Clifton, A. Field-test results using a nacelle-mounted lidar for improving wind turbine power capture by reducing yaw misalignment. J. Phys. Conf. Ser. 2014, 524, 012002. [Google Scholar] [CrossRef]
  20. Song, D.; Yang, J.; Fan, X.; Liu, Y.; Liu, A.; Chen, G.; Joo, Y.H. Maximum power extraction for wind turbines through a novel yaw control solution using predicted wind directions. Energy Convers. Manag. 2018, 157, 587–599. [Google Scholar] [CrossRef]
  21. Kragh, K.; Fleming, P. Rotor Speed Dependent Yaw Control of Wind Turbines Based on Empirical Data. In Proceedings of the 50th AIAA Aerospace Sciences Meeting including the New Horizons Forum and Aerospace Exposition, Nashville, Tennessee, 9–12 January 2012. [Google Scholar] [CrossRef]
  22. Choi, D.; Shin, W.; Ko, K.; Rhee, W. Static and Dynamic Yaw Misalignments of Wind Turbines and Machine Learning Based Correction Methods Using LiDAR Data. IEEE Trans. Sustain. Energy 2019, 10, 971–982. [Google Scholar] [CrossRef]
  23. Bao, Y.; Yang, Q. A Data-Mining Compensation Approach for Yaw Misalignment on Wind Turbine. IEEE Trans. Ind. Informatics 2021, 17, 8154–8164. [Google Scholar] [CrossRef]
  24. Zhang, L.; Yang, Q. A Method for Yaw Error Alignment of Wind Turbine Based on LiDAR. IEEE Access 2020, 8, 25052–25059. [Google Scholar] [CrossRef]
  25. Jing, B.; Qian, Z.; Pei, Y.; Zhang, L.; Yang, T. Improving wind turbine efficiency through detection and calibration of yaw misalignment. Renew. Energy 2020, 160, 1217–1227. [Google Scholar] [CrossRef]
  26. Pei, Y.; Qian, Z.; Jing, B.; Kang, D.; Zhang, L. Data-Driven Method for Wind Turbine Yaw Angle Sensor Zero-Point Shifting Fault Detection. Energies 2018, 11, 553. [Google Scholar] [CrossRef]
  27. Yang, J.; Wang, L.; Song, D.; Huang, C.; Huang, L.; Wang, J. Incorporating environmental impacts into zero-point shifting diagnosis of wind turbines yaw angle. Energy 2022, 238, 121762. [Google Scholar] [CrossRef]
  28. Astolfi, D.; Castellani, F.; Terzi, L. An Operation Data-Based Method for the Diagnosis of Zero-Point Shift of Wind Turbines Yaw Angle. J. Sol. Energy Eng. 2019, 142, 024501. [Google Scholar] [CrossRef]
  29. Kragh, K.; Hansen, M.; Mikkelsen, T. Improving Yaw Alignment Using Spinner Based LIDAR. In Proceedings of the 49th AIAA Aerospace Sciences Meeting including the New Horizons Forum and Aerospace Exposition, Orlando, FL, USA, 4–7 January 2011. [Google Scholar] [CrossRef]
  30. Kragh, K.A.; Hansen, M.H.; Mikkelsen, T. Precision and shortcomings of yaw error estimation using spinner-based light detection and ranging. Wind Energy 2013, 16, 353–366. [Google Scholar] [CrossRef]
  31. Scholbrock, A.K.; Fleming, P.A.; Wright, A.; Slinger, C.; Medley, J.; Harris, M. Field Test Results from Lidar Measured Yaw Control for Improved Power Capture with the NREL Controls Advanced Research Turbine. In Proceedings of the 33rd Wind Energy Symposium, Kissimmee, FL, USA, 5–9 January 2015. [Google Scholar] [CrossRef]
  32. Bakhshi, R.; Sandborn, P. Analysis of Wind Turbine Capacity Factor Improvement by Correcting Yaw Error Using LIDAR. In ASME International Mechanical Engineering Congress and Exposition; American Society of Mechanical Engineers: New York, NY, USA, 2017; Volume 6, p. V006T08A092. [Google Scholar] [CrossRef]
  33. Bakhshi, R.; Sandborn, P. Using LIDAR on Wind Turbines for Yaw Error Correction: A Financial Prospective. In ASME Power Conference; American Society of Mechanical Engineers: New York, NY, USA, 2018; Volume 2, p. V002T12A007. [Google Scholar] [CrossRef]
  34. Bao, Y.; Yang, Q.; Li, S.; Miao, K.; Sun, Y. A data-driven approach for identification and compensation of wind turbine inherent yaw misalignment. In Proceedings of the 2018 33rd Youth Academic Annual Conference of Chinese Association of Automation (YAC), Nanjing, China, 18–20 May 2018; pp. 961–966. [Google Scholar] [CrossRef]
  35. Qu, C.; Lin, Z.; Chen, P.; Liu, J.; Chen, Z.; Xie, Z. An improved data-driven methodology and field-test verification of yaw misalignment calibration on wind turbines. Energy Convers. Manag. 2022, 266, 115786. [Google Scholar] [CrossRef]
  36. Gao, L.; Hong, J. Data-driven yaw misalignment correction for utility-scale wind turbines. J. Renew. Sustain. Energy 2021, 13, 063302. [Google Scholar] [CrossRef]
  37. Astolfi, D.; Castellani, F.; Scappaticci, L.; Terzi, L. Diagnosis of wind turbine misalignment through SCADA Data. Diagnostyka 2017, 18, 17–24. [Google Scholar]
  38. Astolfi, D.; Castellani, F.; Becchetti, M.; Lombardi, A.; Terzi, L. Wind Turbine Systematic Yaw Error: Operation Data Analysis Techniques for Detecting It and Assessing Its Performance Impact. Energies 2020, 13, 2351. [Google Scholar] [CrossRef]
  39. Sheibat-Othman, N.; Othman, S.; Tayari, R.; Sakly, A.; Odgaard, P.F.; Larsen, L.F. Estimation of the wind turbine yaw error by support vector machines. IFAC-PapersOnLine 2015, 48, 339–344. [Google Scholar] [CrossRef]
  40. Tsioumas, E.; Karakasis, N.; Jabbour, N.; Mademlis, C. Indirect estimation of the Yaw-Angle misalignment in a horizontal axis wind turbine. In Proceedings of the 2017 IEEE 11th International Symposium on Diagnostics for Electrical Machines, Power Electronics and Drives (SDEMPED), Tinos, Greece, 29 August–1 September 2017; pp. 45–51. [Google Scholar] [CrossRef]
  41. Ouyang, T.; Kusiak, A.; He, Y. Predictive model of yaw error in a wind turbine. Energy 2017, 123, 119–130. [Google Scholar] [CrossRef]
  42. Pandit, R.; Astolfi, D.; Tang, A.M.; Infield, D. Sequential Data-Driven Long-Term Weather Forecasting Models’ Performance Comparison for Improving Offshore Operation and Maintenance Operations. Energies 2022, 15, 7233. [Google Scholar] [CrossRef]
  43. Solomin, E.V.; Terekhin, A.A.; Martyanov, A.S.; Shishkov, A.N.; Kovalyov, A.A.; Ismagilov, D.R.; Ryavkin, G.N. Horizontal axis wind turbine yaw differential error reduction approach. Energy Convers. Manag. 2022, 254, 115255. [Google Scholar] [CrossRef]
  44. Chen, P.; Lin, Z.; Xie, Z.; Qu, C. Real-time yaw-misalignment calibration and field-test verification of wind turbine via machine learning methods. Mech. Syst. Signal Process. 2024, 208, 110972. [Google Scholar] [CrossRef]
  45. Held, D.P.; Mann, J. Lidar estimation of rotor-effective wind speed—An experimental comparison. Wind. Energy Sci. 2019, 4, 421–438. [Google Scholar] [CrossRef]
  46. Hu, Y.; Liu, H.; Shi, P.; Chen, X.; Fang, C. Overview of fault diagnosis and life prediction for wind turbine Yaw system. Zhongguo Dianji Gongcheng Xuebao/Proc. Chin. Soc. Electr. Eng. 2022, 42, 4871–4883. [Google Scholar] [CrossRef]
  47. Yang, X.; Howard, K.B.; Guala, M.; Sotiropoulos, F. Effects of a three-dimensional hill on the wake characteristics of a model wind turbine. Phys. Fluids 2015, 27, 025103. [Google Scholar] [CrossRef]
  48. Porte-Agel, F.; Bastankhah, M.; Shamsoddin, S. Wind-Turbine and Wind-Farm Flows: A Review. Bound.-Layer Meteorol. 2020, 174, 1–59. [Google Scholar] [CrossRef]
  49. Astolfi, D.; Pandit, R.; Gao, L.; Hong, J. Individuation of Wind Turbine Systematic Yaw Error through SCADA Data. Energies 2022, 15, 8165. [Google Scholar] [CrossRef]
  50. Liu, Y.; Liu, S.; Zhang, L.; Cao, F.; Wang, L. Optimization of the Yaw Control Error of Wind Turbine. Front. Energy Res. 2021, 9, 626681. [Google Scholar] [CrossRef]
  51. Little, M.; Pope, K. Performance modelling for wind turbines operating in harsh conditions. Int. J. Energy Res. 2017, 41, 417–428. [Google Scholar] [CrossRef]
  52. Skvorc, P.; Kozmar, H. Wind energy harnessing on tall buildings in urban environments. Renew. Sustain. Energy Rev. 2021, 152, 111662. [Google Scholar] [CrossRef]
  53. Mittelmeier, N.; Kühn, M. Determination of optimal wind turbine alignment into the wind and detection of alignment changes with SCADA data. Wind Energy Sci. 2018, 3, 395–408. [Google Scholar] [CrossRef]
  54. Yang, J.; Wang, L.; Song, D. Diagnostic Method of Zero-point Shifting of Wind Turbine Yaw Angle Based on Isolated Forest and Sparse Gaussian Process Regression. Proc. CSEE 2021, 41, 6198–6211. [Google Scholar] [CrossRef]
  55. Kou, P.; Wang, C.; Liang, D.; Cheng, S.; Gao, L. Deep learning approach for wind speed forecasts at turbine locations in a wind farm. IET Renew. Power Gener. 2020, 14, 2416–2428. [Google Scholar] [CrossRef]
  56. Pargoo, N.S.; Amini, E.; Zadeh, M.M.; Hajj, M. A Swarm Intelligence Approach for Statistical Modeling of Wind Speed and Direction: A Case Study of New York Bight. In Computing in Civil Engineering 2023; ASCE: Reston, VA, USA, 2023; pp. 176–185. [Google Scholar] [CrossRef]
  57. Dinh, M.C.; Ngo, M.T.; Kim, C.; Lee, S.J.; Yu, I.K.; Park, M. Implementation of Digital Twin-Assisted Condition Monitoring and Fault Diagnosis for Wind Turbines. In Proceedings of the 2023 12th International Conference on Renewable Energy Research and Applications, ICRERA, Oshawa, ON, Canada, 29 August–1 September 2023; pp. 146–150. [Google Scholar] [CrossRef]
Figure 1. A model diagram for a wind turbine control system and the mechanical structure of a yaw system. (a) wind turbine control system. (b) yaw system.
Energies 18 00588 g001
Figure 2. Schematic of logic yaw control.
Energies 18 00588 g002
Figure 3. Schematic of wind turbine yaw error.
Energies 18 00588 g003
Figure 4. Relationship between yaw error and wind speed [24].
Energies 18 00588 g004
Figure 5. Model based on yaw error table [24]. (a) Yaw error corresponding to different power segments and azimuthal sectors (b) Flowchart of yaw control.
Energies 18 00588 g005
Figure 6. Comparison of power curves of wind turbines before and after yaw error calibration using a diagnostic method based on LiDAR data [24].
Energies 18 00588 g006
Figure 7. Framework for yaw error diagnosis based on the analysis of power curves.
Energies 18 00588 g007
Figure 8. The power curves of the wind turbines with and without yaw error calibration based on power curve analysis of SCADA data [25].
Energies 18 00588 g008
Figure 9. Framework for yaw error diagnosis based on power coefficients.
Energies 18 00588 g009
Figure 10. Diagnostic model based on machine learning methods using both LiDAR data and SCADA data [44].
Energies 18 00588 g010
Figure 11. Evaluation of the XGBoost model for wind direction prediction using field data [44].
Energies 18 00588 g011
Table 1. Comparison of diagnostic methods for yaw error.
Diagnostic MethodsMethod DescriptionType of ErrorAdvantages and Disadvantages
Based on LiDAR dataTime-averaged yaw error [19,29,30,31,32,33]Static yaw errorDesigned for static yaw error.
Yaw error table [24]Yaw errorAccurate for static yaw error; insufficient for dynamic yaw error.
Based on SCADA dataAnalysis of power curves [23,25,26,34,35,36,37]Zero-point shifting errorWidely applicable with straightforward principles and accuracy depending on the quality and quantity of monitoring data.
Analysis of power coefficients [27,28,38]Zero-point shifting errorLow data requirements, while susceptible to environmental factors.
Prediction of yaw angle utilizing wind speed and direction [9,20,36,39,40,41,42]Dynamic yaw errorAccurate diagnosis of dynamic yaw error, with high data requirements.
Dynamic response model [43]Yaw errorAccurate diagnosis of static and dynamic yaw error but troublesome modelling.
Based on both LiDAR and SCADA dataYaw error model based on machine learning [44]Yaw errorAccurate diagnosis of yaw error, requires analysis of historical data.
Disclaimer/Publisher’s Note: The statements, opinions and data contained in all publications are solely those of the individual author(s) and contributor(s) and not of MDPI and/or the editor(s). MDPI and/or the editor(s) disclaim responsibility for any injury to people or property resulting from any ideas, methods, instructions or products referred to in the content.

