Article

Long-Term Reliability of Semi-Transparent Photovoltaic Panels Based on Luminescent Solar Concentrators †

1
Department of Physics and Earth Sciences, University of Ferrara, Saragat 1, 44122 Ferrara, FE, Italy
2
Laboratorio Energetica Elettrica, Sardegna Ricerche, VI Strada Ovest-Z.I. Macchiareddu, 09010 Cagliari, CA, Italy
3
Department of Electrical and Electronic Engineering, University of Cagliari, Marengo 2, 09123 Cagliari, CA, Italy
4
Consorzio Futuro in Ricerca, Saragat 1, 44122 Ferrara, FE, Italy
*
Author to whom correspondence should be addressed.
This article is a revised and expanded version of a paper entitled “A comparative study on Luminescent Solar Concentrator photodegradation and hail impact resistance”, which was presented at the International Conference on Sustainable Energies and Technologies (SET 2024), Shanghai, China, 13–15 August 2024.
Energies 2025, 18(3), 674; https://doi.org/10.3390/en18030674
Submission received: 7 January 2025 / Revised: 28 January 2025 / Accepted: 29 January 2025 / Published: 31 January 2025
(This article belongs to the Section A2: Solar Energy and Photovoltaic Systems)

Abstract

:
Long-term reliability is crucial for the commercialization of semi-transparent photovoltaic panels based on Luminescent Solar Concentrators (LSCs). This study addresses key challenges such as photodegradation and hail resistance using glazed LSC prototypes functionalized with organic Lumogen F dyes. A pilot-scale batch of LSC prototypes (10 × 10 cm2) underwent extensive outdoor exposure tests following the IEC 62108 “10.15 Outdoor Exposure Test” to evaluate long-term stability under natural solar radiation. Continuous monitoring revealed that prototypes with Lumogen F Red 305 experienced a 29% efficiency drop initially, which stabilized over time, indicating potential long-term stability. In contrast, those with Lumogen F Violet 570 showed minimal degradation, with only a 9% efficiency reduction. Additionally, the hail resistance of LSC panels was tested using the IEC 62108 “10.9 Hail Impact Test”. Panels with varying glass thickness, tempering methods, and surface areas were subjected to impact from 25 mm hailstones launched at 22.4 ± 5% m/s. All samples remained undamaged, highlighting their excellent hail resistance, a critical feature for preserving performance despite potential surface damage. This study demonstrates that combining glazed lightguides with polyvinyl butyral improves photostability and provides a cost-effective alternative to expensive fluorophores, while ensuring compliance with hail resistance standards.

1. Introduction

The ever-growing global population demands a sustainable solution for our energy needs. With zero CO2 emissions and the potential for widespread implementation, photovoltaic (PV) technologies offer a promising path towards achieving this goal [1]. Nevertheless, due to high land costs, and limited installation spaces, current PV installations primarily occur in non-urbanized areas [2] creating a paradoxical situation—the areas with the highest energy demand often have the fewest PV installations. Building integrated photovoltaic (BIPV) devices are PV solutions which are completely integrated with the building envelope that have the potential to overcome this paradox [3], especially if efficiently coupled with storage solutions [4,5,6,7]. However, despite the expanding applications of PV solutions, coupled with several human activities in urban environments [8,9], BIPV have yet to achieve widespread market adoption, compared to ground or roof mounted PV solutions.
The need to investigate innovative solutions that are not only efficient in generating renewable energy but also esthetically pleasing and cost-effective is an essential aspect for BIPV devices. Ref. [10] reported that thin-film solutions are preferred to crystalline panels due to their superior flexibility and esthetic appeal, despite being less efficient. In fact, 44% of BIPV products installed on building facades are thin-film solutions, compared to 34% of crystalline systems (the remaining 22% refers to attached PV panels). This aspect is even more important if the integration of the semi-transparent building element is considered, as windows are fundamental architectural elements, which allow natural light to illuminate indoor spaces. The potential to generate electricity without compromising esthetics or transparency is therefore vital for the social acceptance of semi-transparent PV technologies.
Devices offering even greater flexibility with respect to thin-film solutions are PV panels based on luminescent solar concentrators (LSCs), which are particularly suited for integration in urban environments because they maintain the same efficiency under both direct and diffuse radiation [11,12]. An LSC panel consists of a highly transparent host matrix, typically a plastic or glazed lightguide, in which luminescent emitters are embedded. These optically active centers, called fluorophores, absorb a portion of the solar spectrum, impinging on the slab re-emitting it at longer wavelengths. Thanks to optical lightguiding principles, approximately 75% of fluorescence light is trapped inside the slab and guided to its edges, while 25% of the light emitted by the luminophores exits the slab within the escape cone. The coupling between the semi-transparent lightguide and PV cells allows for the conversion of fluorescence photons into electricity [13]. The installation of solar cells on the lightguide main surface would allow the collection of solar radiation transmitted by the slab, as well as the fluorescence light exiting from the “escape cone”, ensuring a higher electricity production [14]. Nevertheless, in LSC panels designed for BIPV applications, the integration of PV cells along only the lightguide edges presents two main advantages [15]. First, it decreases the amount of PV cells for the active area, thus reducing the panel costs [16]. Second, the absence of cells, busbars, collection grids, or electrodes within the light harvesting area, results in continuous transparent surfaces, which are particularly appreciated if these devices are installed in building façades or windows [17].
Despite their scientific promise since 1977, LSCs panels remain a niche technology in the BIPV market. Consequently, their technological advancement was primarily focused on academic aspects such as the functionalizing material [18,19,20,21,22], the optimization of the geometrical design [23,24,25], and the typology or electrical connection of the employed PV cells [26,27,28]. The efficiency of LSC panels depends heavily on the optimal integration of various features [29], nevertheless, in most cases these efforts limit their widespread adoption. Indeed, these enhancements significantly increase the overall cost of LSC panels, resulting in a price-to-watt ratio that is uncompetitive when compared to traditional PV or BIPV. An effective approach to improving the overall efficiency of these devices, without directly modifying their main components, is the coupling of the panels with other technologies that mitigates the LSC parasitic effects [30,31,32].
Despite the development of higher-performing solutions, the utilization of organic fluorophores and Si solar cells remains the most common choice for LSC panels designed for BIPV applications [33]. A further challenge for these devices is their long-term reliability from both a structural and an electro-optical perspective. The utilization of total internal reflection to efficiently convey the fluorescent light from the generation site to the solar cells make LSC panels less resilient to the presence of surface cracks or scratches. Moreover, in addition to the long-term vulnerabilities shared with traditional solar panels—damage from wind, hail, and fluctuating temperatures/humidity—these modules face a unique challenge that potentially leads to significant performance losses: luminophore photodegradation. Recent studies on the long-term stability of organic dyes show conflicting results. On the one hand, ref. [34] demonstrated the photostability of pilot-scale (10 × 10 cm2) LSC devices in a combined indoor–outdoor set-up using a LG structure based on an EVA encapsulant. On the other hand, ref. [35] found Lumogen Red 305 to be the worst-performing fluorophore, experiencing a 60% decrease in performance.
This discrepancy highlights the need for further research into the interaction between encapsulant materials and dye stability, and the work here presented aims to gain a deeper understanding of the design strategies required for the successful industrialization of LSCs. To investigate whether industrially scalable LSC devices may be based on organic dyes, we analyze their long-term photostability and operational resilience. We compare the performance of prototypes functionalized with Lumogen F Violet 570 and Red 305 under extended light exposure, thus assessing the suitability of two different organic dyes for real-world applications. Furthermore, to provide a more comprehensive picture of real operating conditions, we incorporate hail impact tests alongside the photostability evaluations. Lastly, the characterization of the LSC panel optical properties have been evaluated by calculating their Average Visible Transparency (AVT) and Color Rendering Index (CRI). The combined approach presented is essential to understanding how the LSC devices respond to both light degradation and mechanical stress, in order to optimize their design to not only prevent photodegradation but to also improve their stability against long-term vulnerabilities. These properties were evaluated following the international standard IEC 62108 Edition 2.0 2016-09 “Concentrator photovoltaic (CPV) modules and assemblies—Design qualification and type approval” [36].

2. Materials and Methods

The research here presented was carried out in two steps. Firstly, the degradation effects due to exposure to outdoor environmental conditions were evaluated according to procedure “10.15 Outdoor Exposure Test”. Secondly, the panel hail impact resistance was determined following the procedure “10.9 Hail impact Tests”. The LSCs were based on a laminated glass (LG) lightguide as the presence of glass layers minimizes the amount of UV radiation directly absorbed by the organic dye, theoretically improving its long-term stability. Furthermore, Polyvinyl butyral (PVB) was chosen as the encapsulating polymer due to its superior resistance to UV radiation compared to ethyl vinyl acetate (EVA) [34]. The glazed structure offers an additional benefit by enhancing the panel’s mechanical and thermal resistance, thereby mitigating challenges associated with integrating polymeric LSCs into buildings. Specifically, compared to plastic slabs, LG offers improved fire safety for both building occupants and firefighters, and enhanced resistance against surface damage caused by external agents.

2.1. Prototype Assembly

The samples were manufactured using LG lightguides with a surface area of 10 × 10 cm2 functionalized with two commercially available organic dyes, the perylene-based Lumogen F Red 305 and the naphtalimide-based Lumogen F Violet 570. The first dye exhibits a reddish color because it absorbs solar radiation up to 600 nm and emits light at longer wavelengths. Conversely, the second dye is characterized by high visible transparency, appearing nearly colorless, as it absorbs photons in the UV range and has an emission peak at 420 nm. The assembly process involved the lamination of 1 mm fluorescent PVB film between two 3 mm thick, low-iron float glasses, and resulted in a fluorescent lightguide with an average surface concentration of (150 ± 5) μg/cm2. The functional LSC panels were then fabricated by optically coupling two PV arrays on opposite sides of the luminescent slab thanks to an optical UV glue (Delo Photobond GB369, DELO, Windach, Germany) and by covering the remaining sides with an adhesive high-efficiency dielectric mirror film (DF2000MA, manufactured by 3M, Milan, Italy). This configuration results in a uniform light distribution and intensity on the solar cells [16]. The two PV arrays, each of them consisting of four monocrystalline Si solar cells (SunPower C50, SunPower, San Jose, CA, USA) soldered onto the front of a printed circuit board (PCB) designed to ensure the series connection of the cells, were in turn connected in series. To mitigate power loss caused by shaded cells, bypass diodes were coupled to each cell using the back surface of the PCB. LSC panels were then encapsulated within a waterproof PVC frame sealed with a low-viscosity, low-corrosion silicone sealant (CHT AS1620, CHT Silicones, Tübingen, Germany), and the electrical connections were made using two silicone-insulated wires exiting the PVC frame. Figure 1 displays a diagram depicting the assembled device as well as a picture of the tested modules.

2.2. Optical Characterization

Both the AVT and CRI were calculated from a measurement of the LSCs transmittances. To measure the transmittance, the samples were placed between and in direct contact with two collimators aligned with each other. The first collimator receives light via an optical fiber cable from a light source and illuminates a spot on the sample. The second collimator receives both the transmitted light and the fluorescence light from the sample, which are then guided by an optical fiber cable to an OceanOptics Spectrometer (OceanOptics, Duiven, The Netherlands). The transmittance was then calculated as the ratio between the intensity at each wavelength with the sample and the intensity without the sample. For the purpose of the AVT and CRI calculations, the fluorescence light can be considered as an indistinguishable part of the transmitted light.
The AVT combines the LSC transmittance over the solar spectrum with the response curve of the human eye and it allows us to estimate how much of the perceivable solar radiation the LSCs are blocking. Analytically speaking, the AVT is defined as follows [37]:
A V T [ % ] = λ m i n λ m a x T λ S λ W m 2 P λ d λ λ m i n λ m a x S λ W m 2 P λ d λ 100 ,
with T(λ) being the transmission spectrum of the LSCs, S(λ) the solar photon flux, and P(λ) the photopic human eye response curve. In principle, the integration should be carried out over the entire solar spectrum wavelength range, however, P(λ) is non-zero only in the 400–700 nm interval, so it is possible to take those values as λmin and λmax, as any other wavelength gives no contribution to the AVT [38].
The CRI indicates the ability of a test light source to faithfully reproduce colors as they appear under a reference light source. Since the solar spectrum at the Earth’s surface varies with time and weather conditions, the CIE Standard Illuminant D65 was adopted as a reference. The D65 illuminant, often referred to as the daylight illuminant, approximates the average midday sunlight spectrum in Europe, accounting for both direct and diffused light. Based on this framework, the CRI and AVT were calculated. The CRI, a widely used metric in colorimetry, quantitatively evaluates a light source’s ability to render the colors of various objects accurately when compared to a reference light source. It is determined as the average performance across eight standardized test color samples (TCS01-TCS08) [39]. Higher CRI means higher chromatic fidelity with respect to reference light source. The two CRI were calculated according to the CIEUVW 1964 procedure detailed by the International Commission on Illumination (CIE), although in this case, the CRI was evaluated over the 400–700 nm range instead of the 380–780 nm one, as it is the interval where the photopic luminous efficiency function of the human eye is significantly different from zero [38]. The CIEUVW 1964 standard makes use of 8 standard color samples (denoted with the subscript i = 1, …, 8) and three Color Matching Functions (CMFs) [40]. The two light sources are denoted with the subscript k = D, L, with D for the D65 spectrum and L for the LSC-filtered spectrum. Eight sets of tristimulus values (Xk,i, Yk,i, Zk,i) are calculated for each source starting from their spectrum, the reflectances of the standard samples, and the CMFs. The (Xk,i, Yk,i, Zk,i) are then converted to the (xk,i, yk,i) coordinates of the CIE 1931 chromaticity space, and are subsequently converted to (uk,i, vk,i) coordinates of the CIE 1960 uniform color space. From these sets of coordinates, the Wk,i, Uk,i, Vk,i parameters are calculated for each sample and finally the Euclidean distance.
E i = ( U D , i U L , i ) 2 + ( V D , i V L , i ) 2 + ( W D , i W L , i ) 2 ,
E i is the color difference between the CIE samples under solar light and under LSC-filtered light. From there, the specific color rendering indices, R i , are obtained for each sample and the general CRI is just the average of all the R i .
R i = 100 E i ,
C R I = i = 1 8 R i 8 .
According to Equation (3), the R i may have positive or negative values depending on the distances in the color space. The CRI value ranges from 0 to 100. Illuminants with a CRI between 0 and 55 are classified as poor, since they lead to significant color distortion. Illuminants with a CRI between 56 and 90 are considered acceptable, although some degree of color distortion may still occur. A CRI exceeding 90 is indicative of excellent illumination quality, ensuring highly accurate color rendering [41,42,43].

2.3. Photodegradation Analysis

As presented in Figure 2a, the photodegradation tests were performed by exposing the LSC panels to natural sunlight. Each device was connected to a maximum power point tracker (MPPT) until it was exposed to a cumulative irradiation energy of 450 kWh/m2. Subsequently, the samples were placed in open-circuit conditions and subjected to 50 kWh/m2. In both cases, the exposure thresholds were reached considering only irradiation conditions with values greater than 600 W/m2. A global solar radiation sensor GHI (Kipp&Zonen CMP 11 pyranometer, Kipp&Zonen, Delft, The Netherlands) was installed on the same tracker coplanar with the samples, so as to acquire the plane of array irradiance (POAI) impinging on the panels. Data were recorded thanks to a National Instruments acquisition system consisting of a cRIO-9014 and an NI 9205 module, which were managed using a program developed in the LabView environment.
The electrical power produced by the modules was continuously monitored, however, regular visual inspections and IV characteristic measurements were alternated to the outdoor exposure. Indoor characterization of the samples was performed by using an Abet Technologies Sun 2000 Solar Simulator (Abet Technologies, Milford, CT, USA) and the B1500 Agilent Semiconductor Analyzer (Agilent, St. Clara, CA, USA) (see Figure 2b). The PCE panel is calculated following Equation (5):
P C E = I M P P A · V M P P [ V ] P O A I W m 2 · A [ m 2 ] · 100 ,
where I M P P and V M P P are the maximum power point current and voltage, respectively. P O A I the plane of array irradiance, and A the LSC surface area.

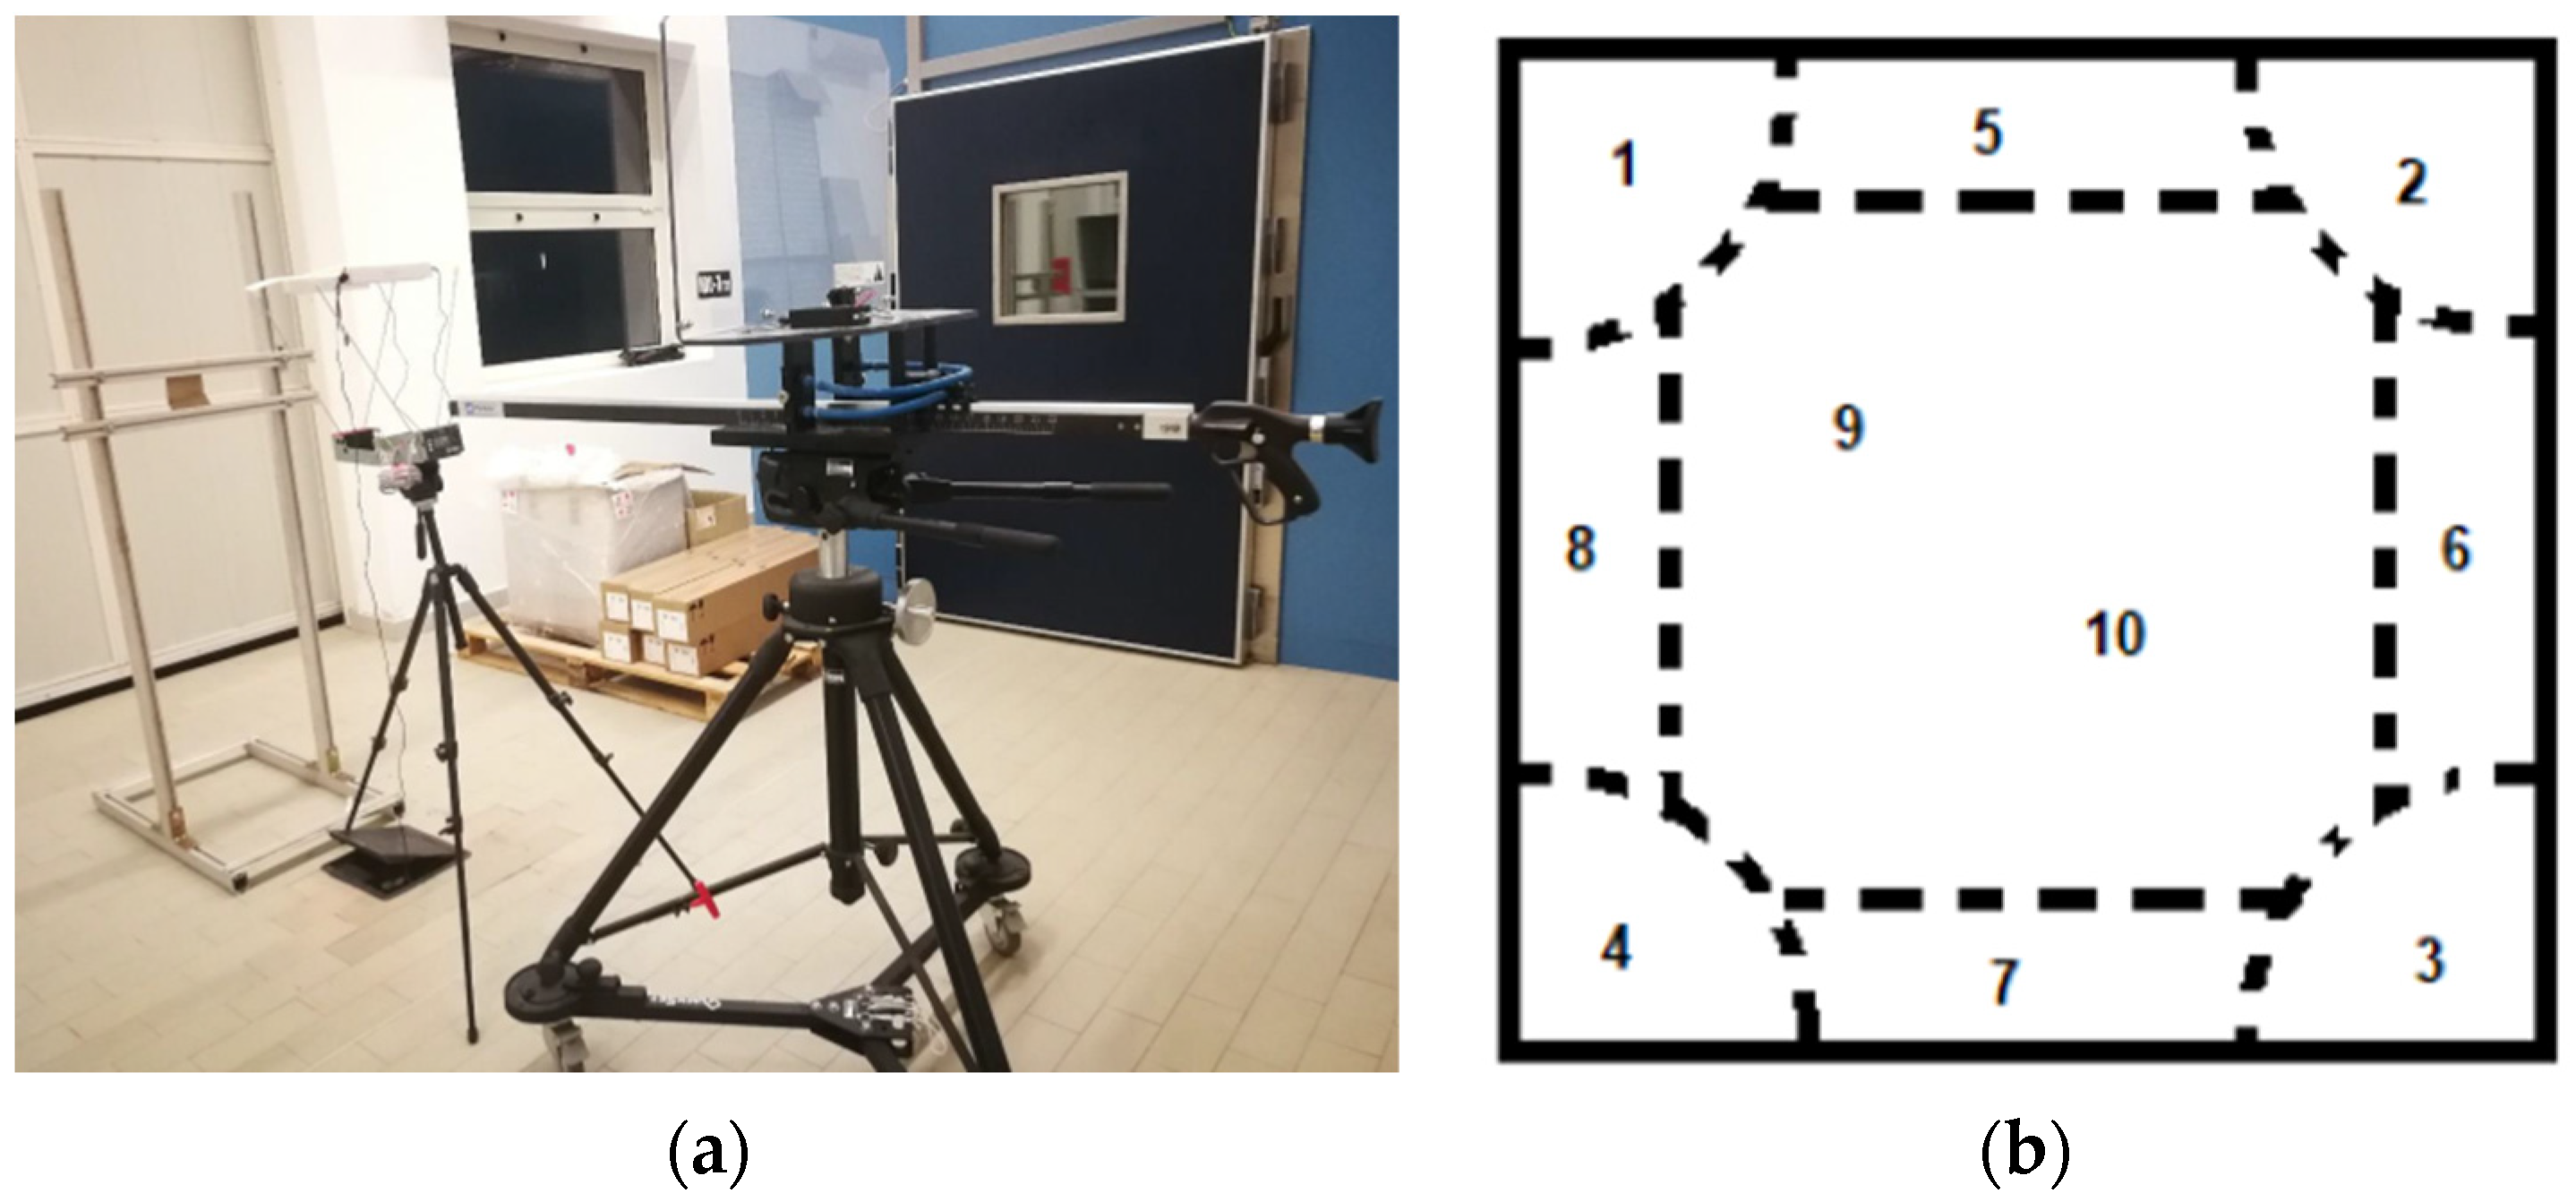
2.4. Hail Impacts Analysis

Due to the diverse atmospheric conditions during their formation, hailstones can sometimes adopt unusual shapes, such as pyramids or disks; moreover, they can vary greatly in size showing dimensions which range from small pellets to baseballs or even larger. However, the majority of hailstones may be reasonably approximated as flattened spheres having protruding ice knobs on their exterior, exhibiting a layered internal structure. While the impact damage inflicted on a PV panel is directly proportional to hailstone size, number, and kinetic energy [44], literature evidence indicates that hailstones exceeding 20 mm in diameter are most likely to cause significant damage [45]. Combining this aspect with the IEC directive in this study, hailstones having a diameter of 25 mm were chosen as representative specimens.
As depicted in Figure 3a, the LSC were held perpendicular to the direction of fire thanks to a support system, and the spheres were propelled towards the theme using the IBL-7M hail test machine (Haag Global, Dallas, TX, USA). Each sample was hit several times in the impact regions displayed in Figure 3b, and a chronograph placed at the hail cannon outlet, less than one meter from the specimen holder, monitored the speed of the hailstone.
Before testing, each ice sphere underwent a rigorous quality control process to ensure it was free from cracks or air bubbles, and that its mass fell within the range of 7.9 g ± 5%. The hailstones meeting these criteria were then stored in an Indel B freezer at −10 °C and conditioned for two hours at −4 °C immediately before the test. To investigate the influence of various parameters on hail impact resistance, LSCs with different glass thicknesses, tempering methods, and surface areas were employed in this test. This approach allows us to correlate these parameters with the capability of the panels to withstand hail impacts. The list of samples used in this procedure is presented in Table 1. The reported glass thickness refers to both panes.

3. Results and Discussion

3.1. Optical Characterization—Results

The transmission spectra of the tested LSC panels are reported in Figure 4a. The lightguide functionalized with Lumogen Violet 570 (BASF, Ludwigshafen, Germany) exhibits the highest transmission values across all components of the visible spectrum. The LSC incorporating the red dye demonstrates an AVT of 21%, while the one using the UV fluorophore achieves an AVT of 80%. This disparity is also evident in the panels’ CRI values, which are 39 and 98, respectively.
The obtained CRI values highlight that the red specimen must be combined with optical filters so as to improve its colorimetric properties, as proposed in [46], whereas the UV panel presented an excellent CRI, especially considering that tungsten halogen lamps typically have CRI values between 85 and 90.
The specific color rendering indices of each sample are presented in Figure 4b. The LSC incorporating Lumogen Violet 570 demonstrates excellent performance even for the extended set of indices, such as TCS09 and TCS12, which are not included in the CRI calculation but are known to be challenging even for standard illuminants.
The TCS12 index is particularly significant for precise color rendering within the 430–500 nm range, where its primary reflectance peaks near 460 nm and diminishes entirely beyond 580 nm. This spectral range poses a notable challenge for LED sources that use blue light as their primary excitation mechanism.
In contrast, TCS09 assesses the accuracy of reproducing saturated red tones, a long-standing difficulty for fluorescent lighting systems. The TCS09 spectrum is predominantly composed of red wavelengths exceeding 600 nm, and a low TCS09 value typically results in distorted rendering of red hues. The TCS09 score of 92.8 is particularly noteworthy, especially given that most commercial lighting products rarely specify this index, and when they do, it seldom surpasses 50. The optical properties of the tested samples are summarized in Table 2.

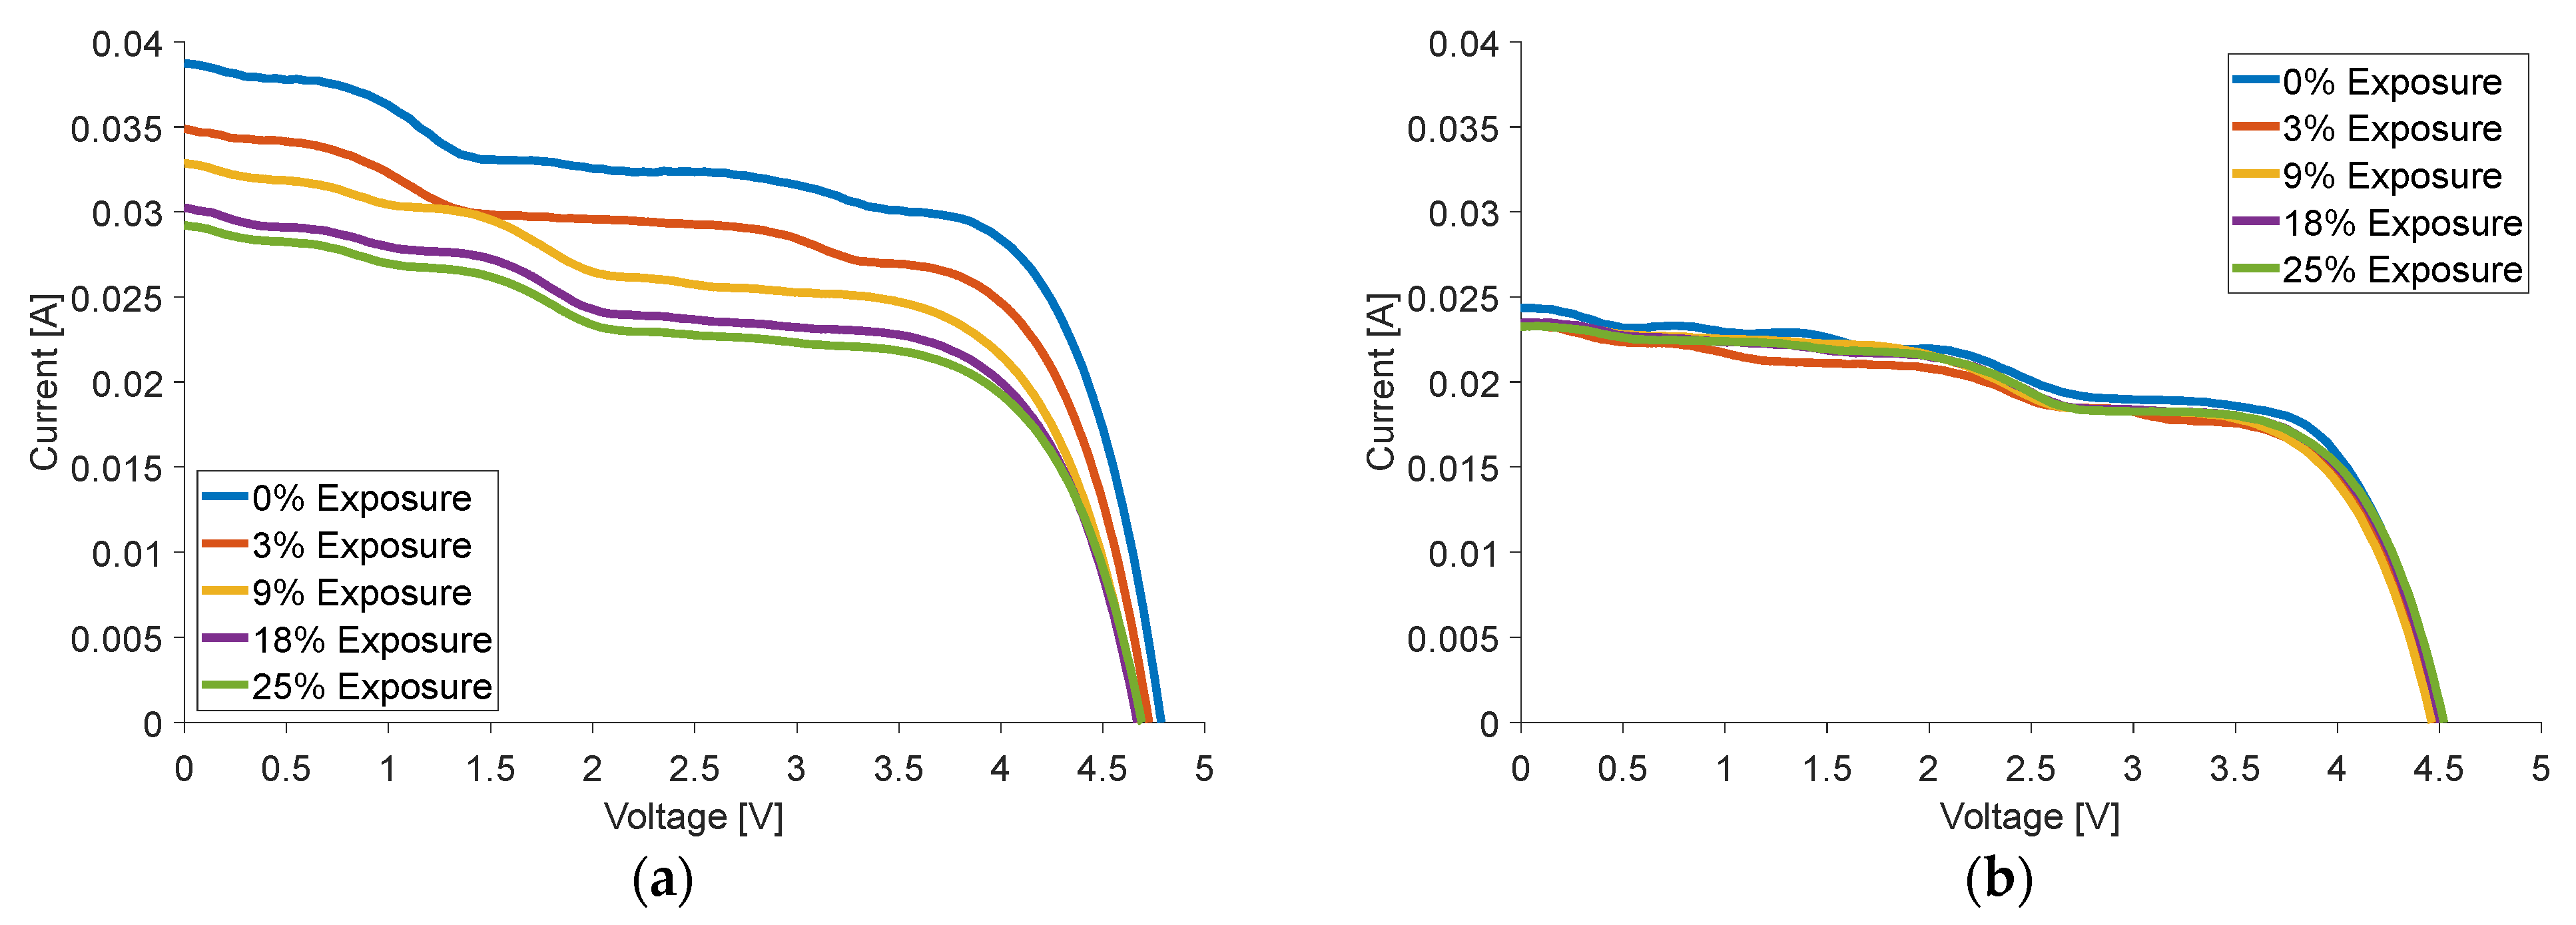
3.2. Photodegradation Analysis—Results

Photodegradation plays a crucial role in determining the long-term performance and durability of LSCs. This section dives into the analysis conducted to assess how light exposure affects the degradation of the samples. Table 3 provides the key parameters considered during the photodegradation analysis focusing on the comparison between the cumulative light energy received by the prototypes and the target irradiation prescribed by the IEC 62108 standard. This standard establishes guidelines for testing photovoltaic modules to ensure consistent and comparable degradation assessment across different laboratories, and it differentiates between the energy received under two conditions: MPP and Open-Circuit Voltage (OCV). The analysis of both conditions provides a more complete picture of the potential degradation across different operating scenarios.
Table 4 delves more deeply into the degradation process by providing the cumulative light energy per square meter (kWh/m2) received by the samples in the moment in which each IV characteristic curve was measured. The final column of Table 4 reports the exposure level achieved at each measurement point, expressed as a percentage with respect to the total target irradiation (450.7 kWh/m2). Figure 5 complements the data presented in Table 4 by visually depicting the measured IV curves, allowing for a direct comparison of the degradation patterns between the two dyes. These curves represent the electrical performance of the samples. Figure 5a specifically focuses on the LSC panel functionalized with Lumogen F Red 305, whereas Figure 5b presents the IV curves of the prototype functionalized with Lumogen F Violet 570.
The presence of secondary knees in most IV curves highlights the critical role of bypass diodes in the PV arrays and indicates a current mismatch between individual PV cells connected in series [47]. Although the assembly process itself might introduce some minor current mismatch, the adopted method appears to promote a uniform illumination profile exiting the LSC lightguide [16]. Therefore, considering the non-uniform surrounding environment, the most likely source of the irregular illumination of the PV arrays is the stray light transmitted through the semi-transparent silicone sealant and reflected by the mirror film [46]. Nevertheless, it is important to note that additional stray light reaching the cells does not negatively impact the system’s power output, even with non-uniform illumination the current of the cells is always increased compared with a situation with no stray light.
The presented IV curves offer a qualitative assessment of degradation for the two luminophores. By comparing the plots, we can clearly see how the performance of the violet dye remains relatively independent of exposure conditions. In contrast, the red dye shows a not negligible degradation under outdoor exposure. However, the performance decrease appears to reach a plateau after reaching a specific exposure level, suggesting a potential limit to the observed decline. This hypothesis is further supported by the plot in Figure 6, in fact, the red sample exhibits a plateau in its degradation at later stages. Key parameters for each IV curve were acquired, such as the short-circuit current (ISC), open-circuit voltage (VOC), maximum power point voltage (VMAX) and current (IMAX), and the Fill Factor (FF). At 25% of the total exposure, the short-circuit current (Isc) and open-circuit voltage (Voc) of the red LSC panel decreased by 24% and 3%, leading to a reduction in the maximum power (Pmax) and power conversion efficiency (PCE) of 28% and 29%, respectively. On the contrary, the sample functionalized with Lumogen F Violet 570 showed remarkable stability without changing the Voc and a minimal reduction in the Isc and Pmax. In particular, the Isc decrease was limited to 3% and the Pmax one to 2%. The final PCE was equal to 96% of the initial value.
Table 5 summarizes the main electrical parameters for the Lumogen F Red 305 LSC panel.
Upon further exposure, the panel exhibited a dramatic decline in performance, even though no visible signs of dye degradation were observed. Taking into account the PCE reduction presented by [34], who investigated the photodegradation of LSCs functionalized with the same dye and having almost identical structures, the complete performance degradation of the specimen here presented must be combined with other factors that have a dominant contribution. Therefore, the prototype was disassembled to identify the source of the decrease in PCE, and postmortem analyses revealed damage to the photovoltaic receivers consistent with water infiltration caused by an incorrect application of silicone sealant. The efficiency decrease was therefore primarily attributed to water infiltration, and the monitoring of the electrical performance for this sample was interrupted. Nevertheless, the bare functionalized wavelength continued to be exposed to solar radiation until it was subjected to the prescribed energy levels. The visual inspections performed for the remaining exposure levels did not show visible signs of degradation. However, transmittance measurements performed after the 100% exposure (see Figure 4a) revealed that the overall transmittance of the LSC increased by 9.22%. This difference can be reasonably ascribed to the dye degradation, therefore even if the process had occurred entirely before the electrical monitoring stopped, the dominant contribution (~18%) to PCE loss could still be attributed to water infiltration. This hypothesis is further corroborated by the measurement performed on the LSC panel functionalized with Lumogen F Violet 570. Indeed, after the full exposition to the cumulative energy value prescribed by the IEC 62108 standard, the overall transmittance of the UV LSC increased by 7.1% (see Figure 4b) in view of a 9% PCE reduction. Therefore, in absence of external agents, the contribution of additional phenomena with respect to the UV degradation had an impact of approximately 1.9% on the panel efficiency. The data presented in Table 6 testified the small variations in the electrical parameter related to the prototype functionalized with UV dye.
Once 100% exposure was reached, the PCE was equal to 91% of the initial value and PMAX experienced a reduction of 8.5%. Even for this specimen, the visual inspection conducted after the photodegradation test confirmed the absence of any visible signs of degradation.
The evidence that one of the prototypes presented in this work displays a decrease in efficiency compatible with the one presented by [34] proves that this assembly configuration highly increases the photostability of LSC based on organic dyes. Limiting the comparison to organic luminophore, the use of glass slabs as structural components and PVB as lamination layers prevents direct exposure of the active material to direct UV radiation, thus ensuring higher long-term stability with respect to PMMA slabs [35]. The enhancement of the long-term stability of these devices plays a pivotal role towards their market penetration, as it overcomes one of the main drawbacks of LSC technology, thus avoiding the utilization of more expensive fluorophores. Indeed, since they are synthesized from readily available chemical precursors, and by using relatively simple and cost-effective manufacturing processes, organic dyes are generally cheaper to produce with respect to other luminophores such as quantum dots, or fluorophores based on rare-earth elements. Economic feasibility is a crucial aspect for the industrial scalability of PV technology that up to now presents a higher price-to-watt ratio with respect to standard semi-transparent solutions. Furthermore, the functionalization of plastic films with organic dyes presents further advantages. Firstly, these films can be manufactured by using standard extrusion processes, and the uniform dispersion of organic dyes in polymeric matrixes or plastic films presents lower challenges with respect to QDs [48]. Lastly, due to their lower toxicity and environmental impact, organic dyes are more likely to meet regulatory standards across different regions, facilitating easier market entry and acceptance.

3.3. Hail Impact Analysis—Results

The size, weight, and velocity of the ice balls used in various rounds of the experiments are presented in Table 7. Each column (S#) corresponds to a different shot, while the rows contain two different types of information. Specifically, in addition to the sample subjected to the test, the characteristics of each fired hailstone are reported. From top to bottom, these characteristics include the mass (m), speed (v), and impact zone (IZ). The IZ numbers are reported in Figure 3b.
All samples were carefully examined after each shot. No damage or visible defects were detected in any of the five samples. In particular, no cracks, filaments, or holes visible to the naked eye were observed, and no pieces of any sample detached or exploded.
Hail has a significant impact on the output of PV modules, leading to an energy loss of up to 30%, which is mainly due to the presence of cracks in the solar cells [49]. The importance of hail impact resistance for the prototypes presented in this work extends beyond the physical integrity of their PV components, as hail damage can profoundly impact the ability of the lightguide to harness and concentrate fluorescence light towards its edges. The formation of cracks or surface scratches can result in increased escape losses, thus reducing the overall panel PCE even if the PV cells themselves remain fully operational. The realization of a batch of samples that have been shown to withstand hail impact despite having different properties testifies that the LG lightguide increases not only the device photostability but also its mechanical properties.

4. Conclusions

This study investigated the long-term stability of LSC panels combining natural outdoor exposure with hail impact analysis. The findings suggest promising results for the application of LSCs, particularly those incorporating Lumogen F Violet 570. While the photostability test on the Lumogen F Red 305 sample was interrupted prematurely, the results are encouraging. The glazing appears to effectively filter UV radiation, limiting the degradation of the luminophore. In fact, the performance decrease was exhibited before 10% of exposure, and then plateaued between 15% and 25%. The associated reduction in maximum power and PCE was equal to 28% and 29%, respectively. The decrease in higher efficiency compared to evidence in the literature was attributed to water infiltration caused by an erroneous application of the silicone sealant. In fact, the second panel, which has identical properties except for the dye used, showed minimal degradation, even after reaching the exposure levels prescribed by the “10.15 Outdoor exposure test”. The corresponding reductions in short-circuit current and maximum power remained below 9%. The hail resistance analysis revealed no damage or defects on any sample. This suggests that, at least under the test conditions employed, the chosen design ensures hail resistance in accordance with the IEC directive, regardless of the thickness or treatments.
To propel the development of LSC panels towards practical applications and bridge the gap between LSC prototypes and commercially viable products, future work should explore several key areas. One avenue for investigation involves the substitution of organic dyes with commercially available inorganic quantum dots, so as to perform a comparative analysis encompassing both PV performance and economic feasibility of the different fluorophores. A second step includes the extension of the performed analyses by exposing LSC panels to additional reliability tests, such as thermal cycling, humidity freeze, and damp heat tests, thus allowing a wider perspective of their long-term performance and durability in real-world environments. Additionally, scaling up the presented lab-scale devices by fabricating LSC panels with dimensions compatible with the building sector will allow researchers to investigate how these larger panels behave under realistic integration scenarios.

Author Contributions

Conceptualization, G.M.; methodology, M.G.; validation, M.G. and C.S.; formal analysis, G.M. and C.S.; investigation, V.D.; resources, A.D.; data curation, L.S.; writing—original draft preparation, G.M. and L.S.; writing—review and editing, V.D. and L.S.; visualization, L.S.; supervision, D.V. and A.D.; project administration, D.V.; funding acquisition, D.V. All authors have read and agreed to the published version of the manuscript.

Funding

This research was funded by the project PNRR ECOSISTER “Ecosystem for Sustainable Transition in Emilia-Romagna”, code ECS_00000033, Affiliated Spoke n. 2 scientific referent Prof. Donato Vincenzi, FINUE, NextGenEU, M4C2 INV. 1.5.

Data Availability Statement

All relevant data supporting the findings of this study are included within the manuscript, or available from the corresponding author upon reasonable request.

Conflicts of Interest

The authors declare no conflicts of interest.

Abbreviations

The following abbreviations are used in this manuscript:
AVTAverage Visible Transimttance
BIPVBuilding Integrated Photovoltaic
CIEInternational Commission on Illumination
CMFColor Matching Function
CPVConcentrated Photovoltaic
CRIColor Rendering Index
EVAEthyl Vinyl Acetate
LGLaminated Glass
LSCLuminescent Solar Concentrators
MPPMaximum Power Point
MPPTMaximum Power Point Tracker
OCVOpen-Circuit Voltage
PCBPrinted Circuit Board
PCEPower Conversion Efficiency
POAIPlane of Array Irradiance
PVPhotovoltaic
PVBPolyvinyl Butyral

References

  1. Masson, G.; Bosch, E.; Van Rechem, A.; de l’Epine, M. Snapshot of Global PV Markets 2023 Task 1 Strategic PV Analysis and Outreach PVPS; IEA PVPS: Paris, France, 2023; Volume I. [Google Scholar]
  2. Gürtürk, M. Economic Feasibility of Solar Power Plants Based on PV Module with Levelized Cost Analysis. Energy 2019, 171, 866–878. [Google Scholar] [CrossRef]
  3. Mangherini, G.; Diolaiti, V.; Bernardoni, P.; Andreoli, A.; Vincenzi, D. Review of Façade Photovoltaic Solutions for Less Energy-Hungry Buildings. Energies 2023, 16, 6901. [Google Scholar] [CrossRef]
  4. Fugattini, S.; Gulzar, U.; Andreoli, A.; Carbone, L.; Boschetti, M.; Bernardoni, P.; Gjestila, M.; Mangherini, G.; Camattari, R.; Li, T.; et al. Binder-Free Nanostructured Germanium Anode for High Resilience Lithium-Ion Battery. Electrochim. Acta 2022, 411, 139832. [Google Scholar] [CrossRef]
  5. Mukhopadhyay, B.; Das, D. Multi-Objective Dynamic and Static Reconfiguration with Optimized Allocation of PV-DG and Battery Energy Storage System. Renew. Sustain. Energy Rev. 2020, 124, 109777. [Google Scholar] [CrossRef]
  6. Diolaiti, V.; Andreoli, A.; Bernardoni, P.; Mangherini, G.; Ouelhazi, M.A.; Venczia, E.; Ricci, M.; Proietti, R.Z.; Vincenzi, D. Nanostructured Germanium Anode for Lithium-Ion Batteries for Aerospace Technologies. In Proceedings of the 2022 IEEE 22nd International Conference on Nanotechnology (NANO), Palma de Mallorca, Spain, 4–8 July 2022; pp. 56–59. [Google Scholar]
  7. Diolaiti, V.; Andreoli, A.; Chauque, S.; Bernardoni, P.; Mangherini, G.; Ricci, M.; Zaccaria, R.P.; Ferroni, M.; Vincenzi, D. Comparison of Porous Germanium Thin Films on SS and Mo as Anode for High-Performance LIBs. IEEE Trans. Nanotechnol. 2023, 22, 552–557. [Google Scholar] [CrossRef]
  8. Boschetti, M.; Vincenzi, D.; Mangherini, G.; Bernardoni, P.; Andreoli, A.; Gjestila, M.; Camattari, R.; Fugattini, S.; Caramori, S.; Cristino, V.; et al. Modular Stand-Alone Photoelectrocatalytic Reactor for Emergent Contaminant Degradation via Solar Radiation. Sol. Energy 2021, 228, 120–127. [Google Scholar] [CrossRef]
  9. Selimefendigil, F.; Şirin, C. Experimental Investigation of a Parabolic Greenhouse Dryer Improved with Copper Oxide Nano-Enhanced Latent Heat Thermal Energy Storage Unit. Int. J. Energy Res. 2021, 46, 3647–3662. [Google Scholar] [CrossRef]
  10. Smith, D.E.; Hughes, M.D.; Patel, B.; Borca-Tasciuc, D.A. An Open-Source Monte Carlo Ray-Tracing Simulation Tool for Luminescent Solar Concentrators with Validation Studies Employing Scattering Phosphor Films. Energies 2021, 14, 455. [Google Scholar] [CrossRef]
  11. Van Sark, W.G.J.H.M.; Barnham, K.W.J.; Slooff, L.H.; Chatten, A.J.; Büchtemann, A.; Meyer, A.; Mccormack, S.J.; Koole, R.; Farrell, D.J.; Bose, R.; et al. Luminescent Solar Concentrators-A Review of Recent Results. Opt. Express 2008, 16, 21773–21792. [Google Scholar] [CrossRef] [PubMed]
  12. Debije, M.G.; Rajkumar, V.A. Direct versus Indirect Illumination of a Prototype Luminescent Solar Concentrator. Sol. Energy 2015, 122, 334–340. [Google Scholar] [CrossRef]
  13. De Bruin, T.A.; Van Sark, W.G.J.H.M. Investigation of Quantum Dot Luminescent Solar Concentrator Single, Double and Triple Structures: A Ray Tracing Simulation Study. Ceram. Int. 2023, 49, 24454–24468. [Google Scholar] [CrossRef]
  14. Corrado, C.; Leow, S.W.; Osborn, M.; Carbone, I.; Hellier, K.; Short, M.; Alers, G.; Carter, S.A. Power Generation Study of Luminescent Solar Concentrator Greenhouse. J. Renew. Sustain. Energy 2016, 8, 043502. [Google Scholar] [CrossRef]
  15. Mangherini, G.; Bernardoni, P.; Baccega, E.; Andreoli, A.; Diolaiti, V.; Vincenzi, D. Design of a Ventilated Façade Integrating a Luminescent Solar Concentrator Photovoltaic Panel. Sustainability 2023, 15, 9146. [Google Scholar] [CrossRef]
  16. Bernardoni, P.; Mangherini, G.; Gjestila, M.; Andreoli, A.; Vincenzi, D. Performance Optimization of Luminescent Solar Concentrators under Several Shading Conditions. Energies 2021, 14, 816. [Google Scholar] [CrossRef]
  17. Bergren, M.R.; Makarov, N.S.; Ramasamy, K.; Jackson, A.; Guglielmetti, R.; McDaniel, H. High-Performance CuInS2 Quantum Dot Laminated Glass Luminescent Solar Concentrators for Windows. ACS Energy Lett. 2018, 3, 520–525. [Google Scholar] [CrossRef]
  18. Li, W.; Wang, X.; Lin, J.; Meng, X.; Wang, L.; Wang, M.; Jing, Q.; Song, Y.; Vomiero, A.; Zhao, H. Controllable and Large-Scale Synthesis of Carbon Quantum Dots for Efficient Solid-State Optical Devices. Nano Energy 2024, 122, 109289. [Google Scholar] [CrossRef]
  19. Lin, J.; Wang, L.; Jing, Q.; Zhao, H. Highly Efficient and High Color Rendering Index Multilayer Luminescent Solar Concentrators Based on Colloidal Carbon Quantum Dots. Chem. Eng. J. 2024, 481, 148441. [Google Scholar] [CrossRef]
  20. Slooff, L.H.; Bende, E.E.; Burgers, A.R.; Budel, T.; Pravettoni, M.; Kenny, R.P.; Dunlop, E.D.; Büchtemann, A. A Luminescent Solar Concentrator with 7.1% Power Conversion Efficiency. Phys. Status Solidi—Rapid Res. Lett. 2008, 2, 257–259. [Google Scholar] [CrossRef]
  21. Goldschmidt, J.C.; Peters, M.; Bösch, A.; Helmers, H.; Dimroth, F.; Glunz, S.W.; Willeke, G. Increasing the Efficiency of Fluorescent Concentrator Systems. Sol. Energy Mater. Sol. Cells 2009, 93, 176–182. [Google Scholar] [CrossRef]
  22. Bomm, J.; Büchtemann, A.; Chatten, A.J.; Bose, R.; Farrell, D.J.; Chan, N.L.A.; Xiao, Y.; Slooff, L.H.; Meyer, T.; Meyer, A.; et al. Fabrication and Full Characterization of State-of-the-Art Quantum Dot Luminescent Solar Concentrators. Sol. Energy Mater. Sol. Cells 2011, 95, 2087–2094. [Google Scholar] [CrossRef]
  23. Inman, R.H.; Shcherbatyuk, G.V.; Medvedko, D.; Gopinathan, A.; Ghosh, S. Cylindrical Luminescent Solar Concentrators with Near-Infrared Quantum Dots. Opt. Express 2011, 19, 24308. [Google Scholar] [CrossRef]
  24. Zhang, J.; Wang, M.; Zhang, Y.; He, H.; Xie, W.; Yang, M.; Ding, J.; Bao, J.; Sun, S.; Gao, C. Optimization of Large-Size Glass Laminated Luminescent Solar Concentrators. Sol. Energy 2015, 117, 260–267. [Google Scholar] [CrossRef]
  25. Bronstein, N.D.; Yao, Y.; Xu, L.; O’Brien, E.; Powers, A.S.; Ferry, V.E.; Alivisatos, A.P.; Nuzzo, R.G. Quantum Dot Luminescent Concentrator Cavity Exhibiting 30-Fold Concentration. ACS Photonics 2015, 2, 1576–1583. [Google Scholar] [CrossRef]
  26. Currie, M.J.; Mapel, J.K.; Heidel, T.D.; Goffri, S.; Baldo, M.A. High-Efficiency Organic Solar Concentrators for Photovoltaics. Science 2008, 321, 226–228. [Google Scholar] [CrossRef]
  27. Wilson, L.R.; Klampaftis, E.; Richards, B.S. Enhancement of Power Output from a Large-Area Luminescent Solar Concentrator with 4.8× Concentration via Solar Cell Current Matching. IEEE J. Photovolt. 2017, 7, 802–809. [Google Scholar] [CrossRef]
  28. Ha, S.J.; Kang, J.H.; Choi, D.H.; Nam, S.K.; Reichmanis, E.; Moon, J.H. Upconversion-Assisted Dual-Band Luminescent Solar Concentrator Coupled for High Power Conversion Efficiency Photovoltaic Systems. ACS Photonics 2018, 5, 3621–3627. [Google Scholar] [CrossRef]
  29. Castelletto, S.; Boretti, A. Luminescence Solar Concentrators: A Technology Update. Nano Energy 2023, 109, 108269. [Google Scholar] [CrossRef]
  30. Li, S.; Haussener, S. Radiative Transfer in Luminescent Solar Concentrators. J. Quant. Spectrosc. Radiat. Transf. 2024, 319, 108957. [Google Scholar] [CrossRef]
  31. Liu, H.; He, W.; Liu, X.; Zhu, J.; Yu, H.; Hu, Z. Building Integrated Concentrating Photovoltaic Window Coupling Luminescent Solar Concentrator and Thermotropic Material. Energy 2023, 284, 129237. [Google Scholar] [CrossRef]
  32. Mangherini, G.; Baccega, E.; Diolaiti, V. Integration of Phase Change Material into PV Windows to Improve the Efficiency of Semi-Transparent Panels Based on Luminescent Solar Concentrator Technology. Sustainability 2024, 16, 11148. [Google Scholar] [CrossRef]
  33. Rafiee, M.; Chandra, S.; Ahmed, H.; McCormack, S.J. An Overview of Various Configurations of Luminescent Solar Concentrators for Photovoltaic Applications. Opt. Mater. 2019, 91, 212–227. [Google Scholar] [CrossRef]
  34. Delgado-Sanchez, J.M. Luminescent Solar Concentrators: Photo-Stability Analysis and Long-Term Perspectives. Sol. Energy Mater. Sol. Cells 2019, 202, 110134. [Google Scholar] [CrossRef]
  35. De Bruin, T.A.; Terricabres-Polo, R.; Kaul, A.; Zawacka, N.K.; Prins, P.T.; Gietema, T.F.J.; de Waal, A.C.; de Boer, D.K.G.; Vanmaekelbergh, D.A.M.; Leblans, P.; et al. Analysis of the 1 Year Outdoor Performance of Quantum Dot Luminescent Solar Concentrators. Solar RRL 2023, 7, 2201121. [Google Scholar] [CrossRef]
  36. IEC 62108:2016; Concentrator Photovoltaic (CPV) Modules and Assemblies—Design Qualification and Type Approval. IEC: Geneva, Switzerland, 2016.
  37. Naim, W.; Novelli, V.; Nikolinakos, I.; Barbero, N.; Dzeba, I.; Grifoni, F.; Ren, Y.; Alnasser, T.; Velardo, A.; Borrelli, R.; et al. Transparent and Colorless Dye-Sensitized Solar Cells Exceeding 75% Average Visible Transmittance. JACS Au 2021, 1, 409–426. [Google Scholar] [CrossRef] [PubMed]
  38. Lunt, R.R. Theoretical Limits for Visibly Transparent Photovoltaics. Appl. Phys. Lett. 2012, 101, 043902. [Google Scholar] [CrossRef]
  39. De Bruin, T.A.; Van Sark, W.G.J.H.M. Shining Lights on Limits: Optimizing Luminescent Solar Concentrators for Solar Windows. Adv. Photon-Res. 2024, 6, 2400068. [Google Scholar] [CrossRef]
  40. Ohno, Y. CIE Fundamentals for Color Measurements. In Proceedings of the IS&Ts NIP16: 2000 International Conference on Digital Printing Technologies, Vancouver, BC, Canada, 15–20 October 2000; Volume 16, pp. 540–545. [Google Scholar]
  41. Eder, G.; Peharz, G.; Trattnig, R.; Bonomo, P.; Saretta, E.; Frontini, F.; Polo Lopez, C.S.; Rose Wilson, H.; Eisenlohr, J.; Martín Chivelet, N.; et al. COLOURED BIPV Market, Research and Development IEA PVPS Task 15, Report IEA-PVPS T15-07: 2019; IEA PVPS: Paris, France, 2019. [Google Scholar]
  42. Dai, P.P.; Li, C.; Zhang, X.T.; Xu, J.; Chen, X.; Wang, X.L.; Jia, Y.; Wang, X.; Liu, Y.C. A Single Eu2+-Activated High-Color-Rendering Oxychloride White-Light Phosphor for White-Light-Emitting Diodes. Light: Sci. Appl. 2016, 5, e16024. [Google Scholar] [CrossRef]
  43. Ohno, Y. Color Rendering and Luminous Efficacy of White LED Spectra. In Proceedings of the Fourth International Conference on Solid State Lighting, Denver, CO, USA, 3–6 August 2004; Volume 5530, p. 88. [Google Scholar] [CrossRef]
  44. Chakraborty, S.; Haldkar, A.K.; Manoj Kumar, N. Analysis of the Hail Impacts on the Performance of Commercially Available Photovoltaic Modules of Varying Front Glass Thickness. Renew. Energy 2023, 203, 345–356. [Google Scholar] [CrossRef]
  45. Gupta, V.; Sharma, M.; Pachauri, R.; Babu, K.N.D. Impact of Hailstorm on the Performance of PV Module: A Review. Energy Sources Part A Recovery Util. Environ. Eff. 2022, 44, 1923–1944. [Google Scholar] [CrossRef]
  46. Bernardoni, P.; Mangherini, G.; Andreoli, A.; Diolaiti, V.; Marrazzo, R.; Melchiorre, F.; Zanardi, S.; Vincenzi, D. Design of a Color Neutral Nonpatterned Photovoltaic Window Based on Luminescent Solar Concentrator. Solar RRL 2024, 8, 2400195. [Google Scholar] [CrossRef]
  47. Roche, D.; Outhred, H.; Kaye, J.R. Analysis and Control of Mismatch Power Loss in Photovoltaic Arrays. Prog. Photovolt. Res. Appl. 1995, 3, 115–127. [Google Scholar] [CrossRef]
  48. Matvienko, O.O.; Savin, Y.N.; Kryzhanovska, A.S.; Vovk, O.M.; Dobrotvorska, M.V.; Pogorelova, N.V.; Vashchenko, V.V. Dispersion and Aggregation of Quantum Dots in Polymer-Inorganic Hybrid Films. Thin Solid Film. 2013, 537, 226–230. [Google Scholar] [CrossRef]
  49. Makarskas, V.; Jurevičius, M.; Zakis, J.; Kilikevičius, A.; Borodinas, S.; Matijošius, J.; Kilikevičienė, K. Investigation of the Influence of Hail Mechanical Impact Parameters on Photovoltaic Modules. Eng. Fail. Anal. 2021, 124, 105309. [Google Scholar] [CrossRef]
Figure 1. (a) Diagram of the tested samples. (b) Picture of the assembled prototypes.
Energies 18 00674 g001
Figure 2. (a) Set-up for the outdoor characterization tests. (b) Configuration for the acquisition of IV characteristic curves.
Energies 18 00674 g002
Figure 3. (a) Hail test set-up. (b) Impact areas of the ice spheres on the samples, numbered 1–10.
Energies 18 00674 g003
Figure 4. LSC transmission spectra before and after exposure of (a) UV and (b) red dye. Specific color rendering indices of (c) UV violet and (d) red LSCs.
Energies 18 00674 g004
Figure 5. IV curves at different exposure levels of (a) red and (b) violet LSC, respectively.
Energies 18 00674 g005
Figure 6. LSC panel efficiency as a function of the different exposure levels. Dashed lines represent the plateau values of LSCs’ PCE.
Energies 18 00674 g006
Table 1. List of specimens used for the hail resistance tests.
SpecimenSurface AreaGlass ThicknessGlass Typology
Sample 110 × 10 cm23 mmNon-tempered
Sample 210 × 10 cm24 mmNon-tempered
Sample 310 × 10 cm24 mmChemically tempered
Sample 430 × 30 cm24 mmChemically tempered
Sample 530 × 30 cm24 mmChemically tempered
Table 2. Average Visual Transmittance and Color Rendering Index of the tested samples.
SpecimenAVT [%]CRI
RED20.539
VIO79.698
Table 3. Comparison between the target prescribed by the IEC 62108 and the actual exposure levels at which the samples were exposed.
ConditionTarget Exposure [kWh/m2]
>600 W/m2
Total Exposure [kWh/m2]
>600 W/m2
Total Exposure [kWh/m2]
<600 W/m2
MPP450450.7272.2
OCV5051.324.8
Table 4. Summary of the radiation absorbed by the samples at the time of IV characterizations.
Target POAI Exposure [kWh/m2]
>600 W/m2
Total POAI Exposure [kWh/m2]
<600 W/m2
Exposure Level
[%]
000%
13.49.03%
40.820.89%
81.047.518%
111.853.425%
158.475.935%
236.5189.453%
273.9213.661%
323.0229.972%
450.7272.2100%
Table 5. Summary of the electrical parameters measured for the LSC functionalized with Lumogen F Red 305.
Exposure
[%]
VOC
[V]
ISC
[mA]
PMAX
[mW]
VMAX
[V]
IMAX
[mA]
FFPOAI [W/m2]PCE
[%]
04.8038.83114.873.9529.080.629971.15
34.7335.11100.593.9125.730.619971.01
94.6833.4490.223.7324.190.589970.91
184.6830.1883.053.8921.350.599970.83
254.6829.4683.013.8921.340.609970.83
Table 6. Summary of the electrical parameters measured for the LSC functionalized with Lumogen F Violet 570.
Exposure
[%]
VOC
[V]
ISC
[mA]
PMAX
[mW]
VMAX
[V]
IMAX
[mA]
FFPOAI
[W/m2]
PCE
[%]
04.5024.2867.993.8517.660.629970.68
34.4823.3463.863.7017.260.619970.64
94.4623.2663.963.6317.620.629970.64
184.5023.4965.683.7017.750.629970.66
254.5223.2765.063.8017.120.629970.65
354.5223.4765.113.6717.740.619950.65
534.5722.6059.973.6716.340.5810040.60
614.0822.9059.833.6016.620.589950.60
714.4423.9663.163.6317.400.5910080.63
1004.5123.0262.213.7716.500.6110000.62
Table 7. Hail test details for the different samples.
Test ParametersS1S2S3S4S5S6S7S8S9S10
Sample 1m [g]8.097.998.108.008.198.137.778.017.747.80
v [m/s]22.8922.5923.0223.0222.7922.8922.6923.0222.4622.70
IZ14259106873
Sample 2m [g]8.048.037.798.067.987.977.887.968.067.81
v [m/s]22.8722.4922.6822.6422.5421.7922.3122.4122.2722.27
IZ12610984735
Sample 3m [g]7.807.998.047.797.918.048.027.928.048.13
v [m/s]22.4622.4123.0522.4622.2822.2522.1622.2322.1522.44
IZ89547106321
Sample 4m [g]7.947.877.928.018.038.028.097.878.058.14
v [m/s]22.1522.1922.2122.9522.7322.3922.8422.9422.5522.94
IZ47326910581
Sample 5m [g]8.057.908.107.977.978.037.948.027.937.91
v [m/s]22.7122.8422.2522.9822.6322.5721.7923.0122.9722.22
IZ11059663297
Disclaimer/Publisher’s Note: The statements, opinions and data contained in all publications are solely those of the individual author(s) and contributor(s) and not of MDPI and/or the editor(s). MDPI and/or the editor(s) disclaim responsibility for any injury to people or property resulting from any ideas, methods, instructions or products referred to in the content.

