
Drying Time, Energy and Exergy Efficiency Prediction of Corn (Zea mays L.) at a Convective-Infrared-Rotary Dryer: Approach by an Artificial Neural Network

 ,
, 
 , ,
, ,  and
and
Abstract
1. Introduction
2. Materials and Methods
2.1. Corn Preparation
2.2. Drying Device
2.3. Effective Moisture Diffusion
2.4. Measurement of the S.E.C, Energy and Thermal Efficiency
2.5. Measurement of the Exergy Efficiency
2.6. Qualitative Properties Investigation
2.6.1. Water Activity
2.6.2. Measurement of the Color Parameters
2.6.3. Rehydration Ratio (RR)
2.6.4. Measurement of the Shrinkage
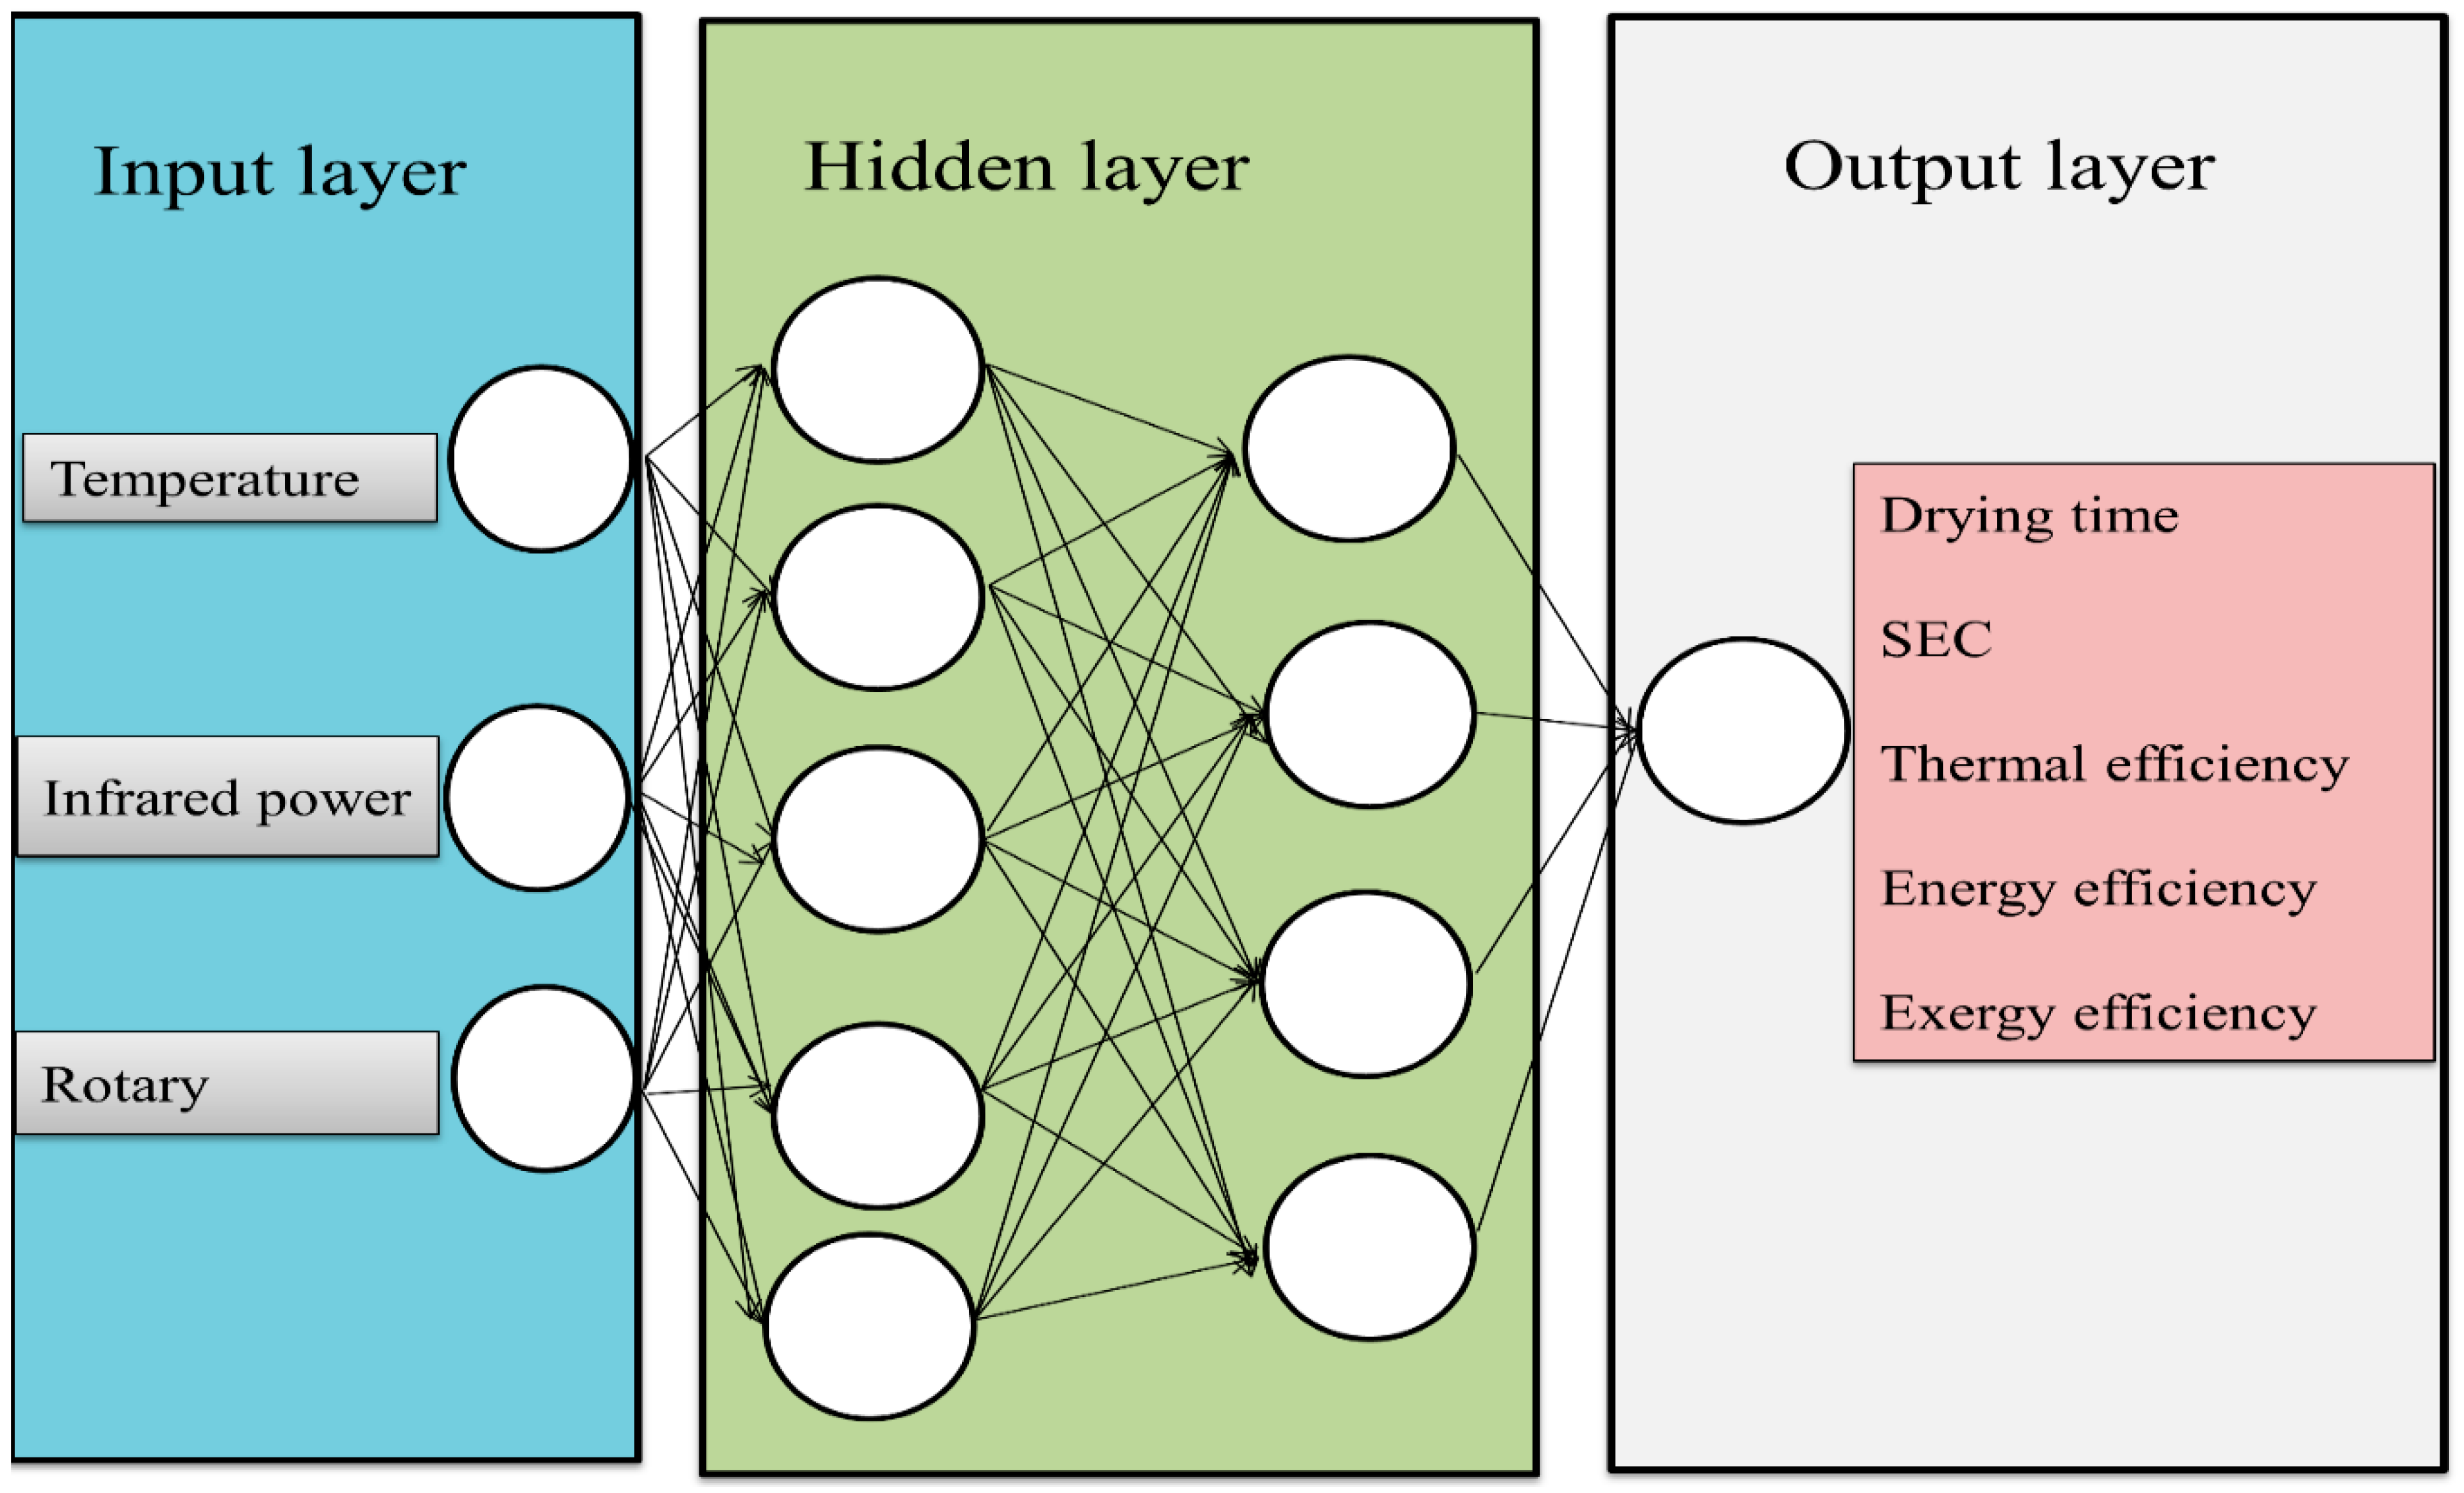
2.7. Artificial Neural Networks
2.8. Statistical Analysis
3. Results
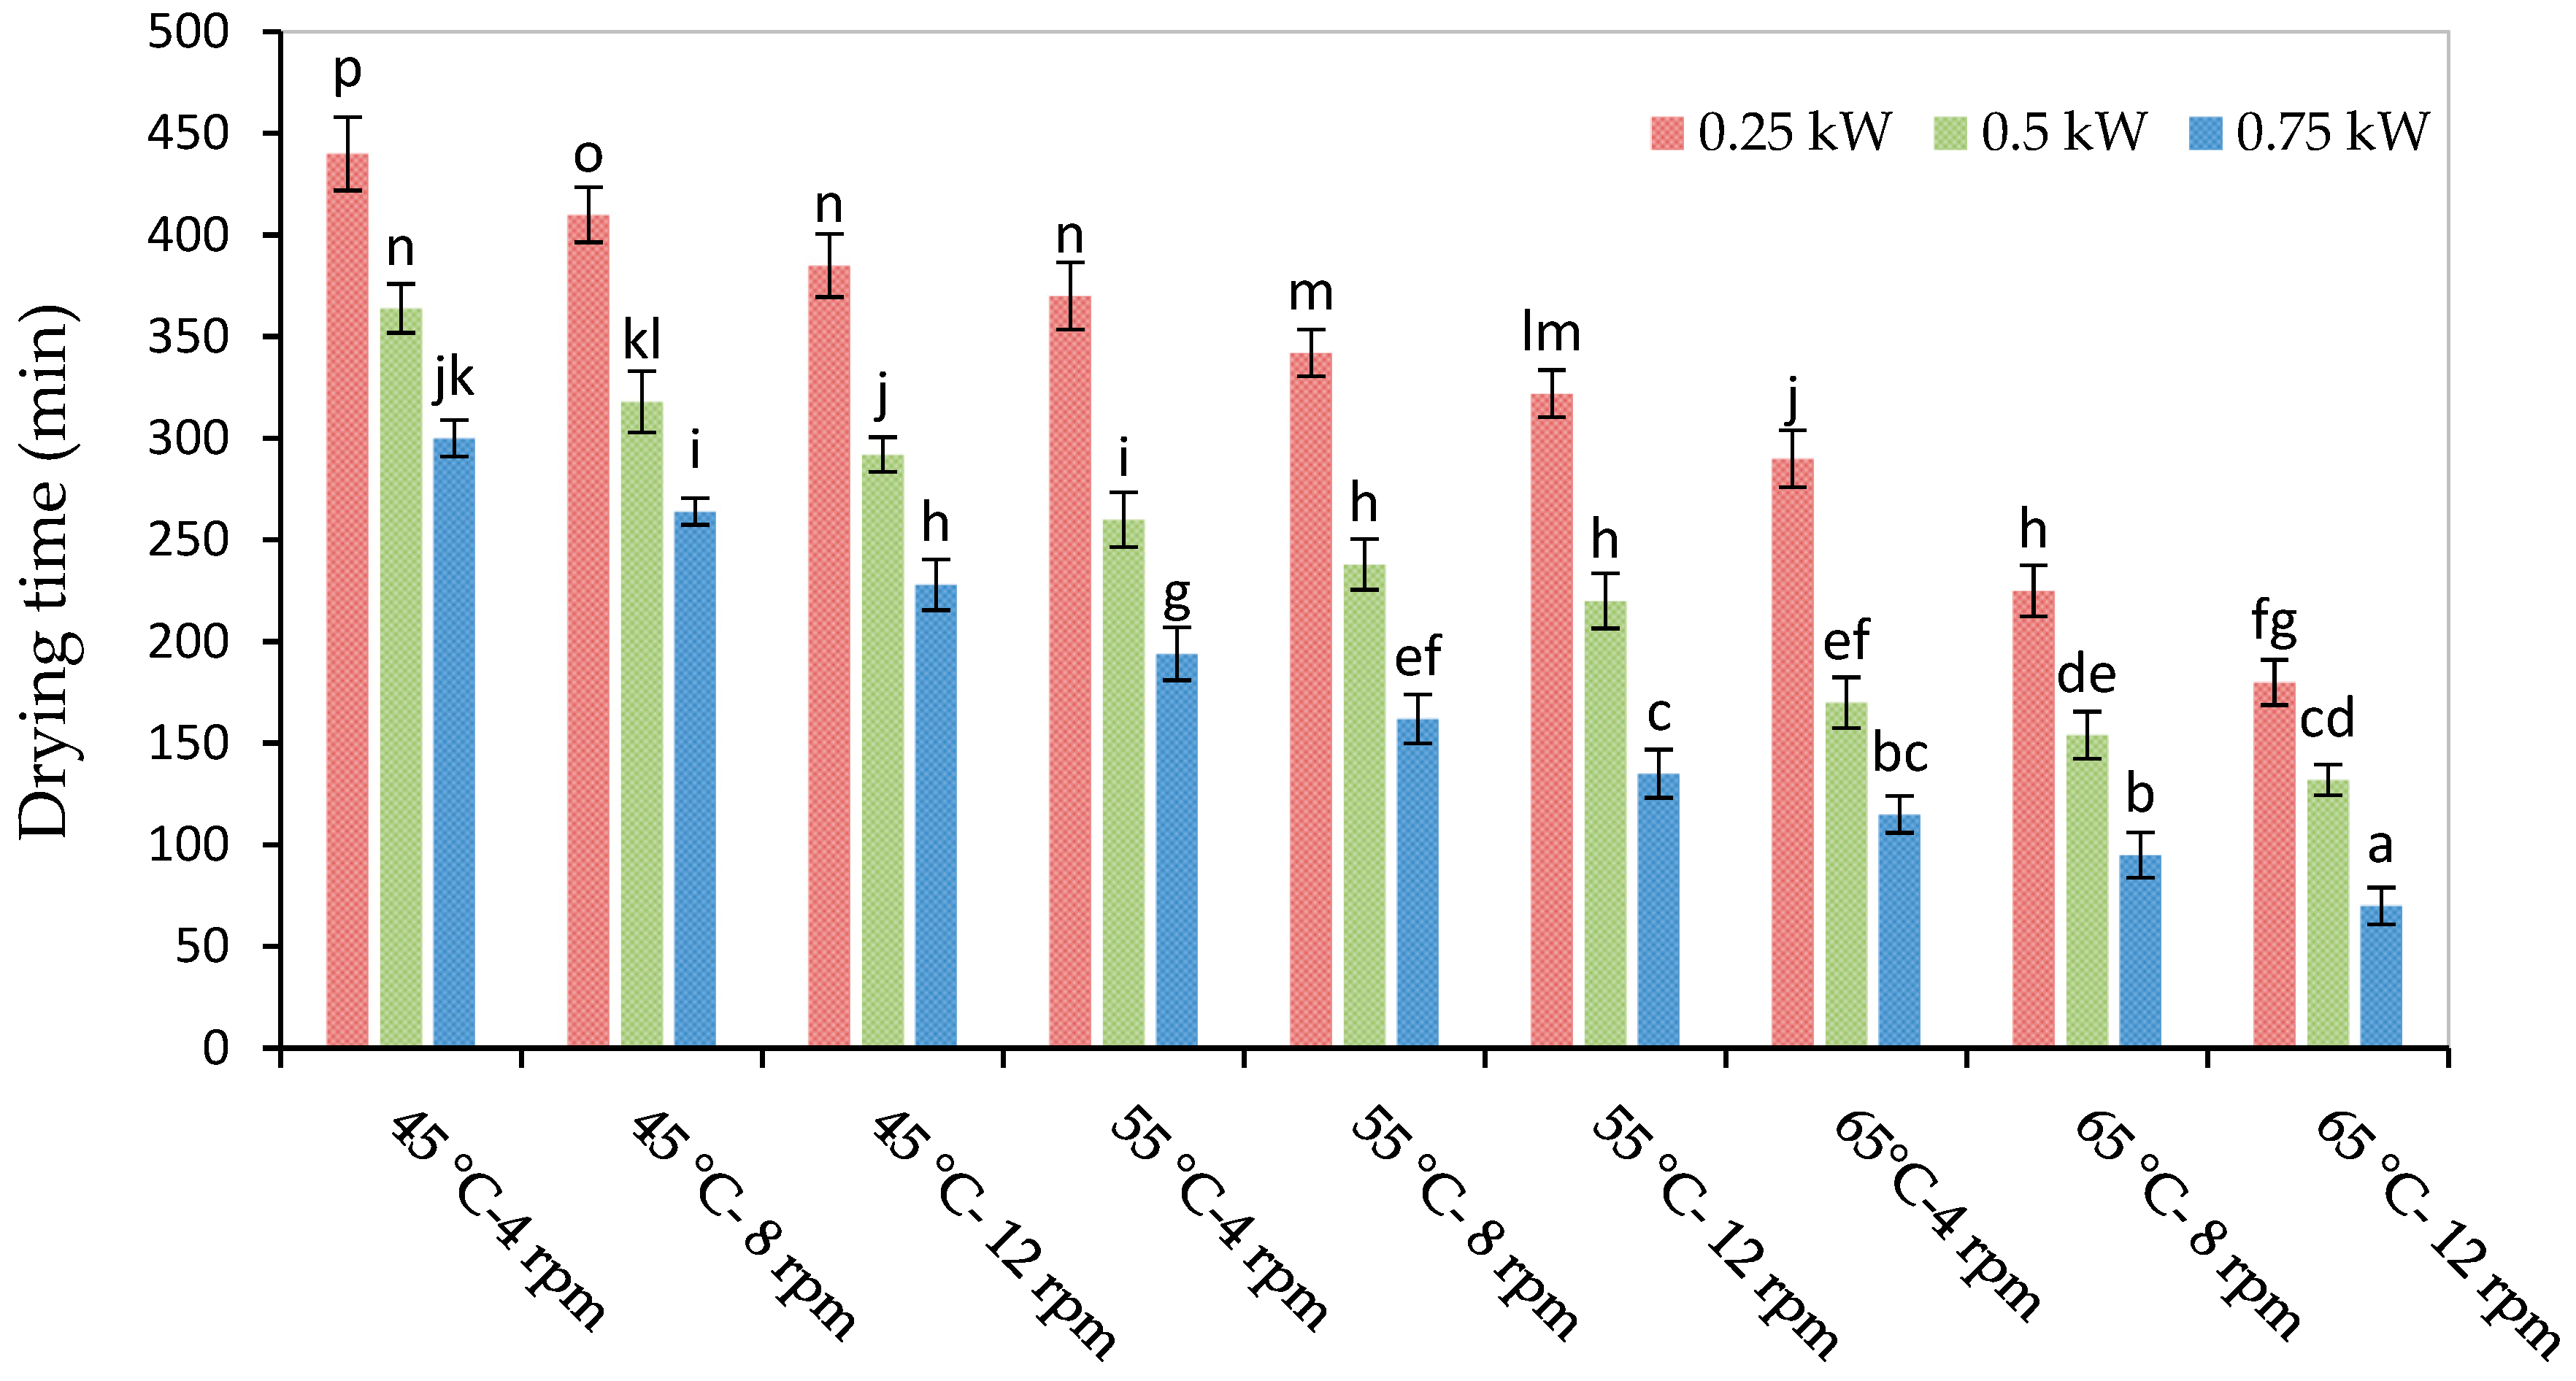
3.1. Drying Time
3.2. Effective Moisture Diffusivity
3.3. S.E.C, Energy and Thermal Efficiency
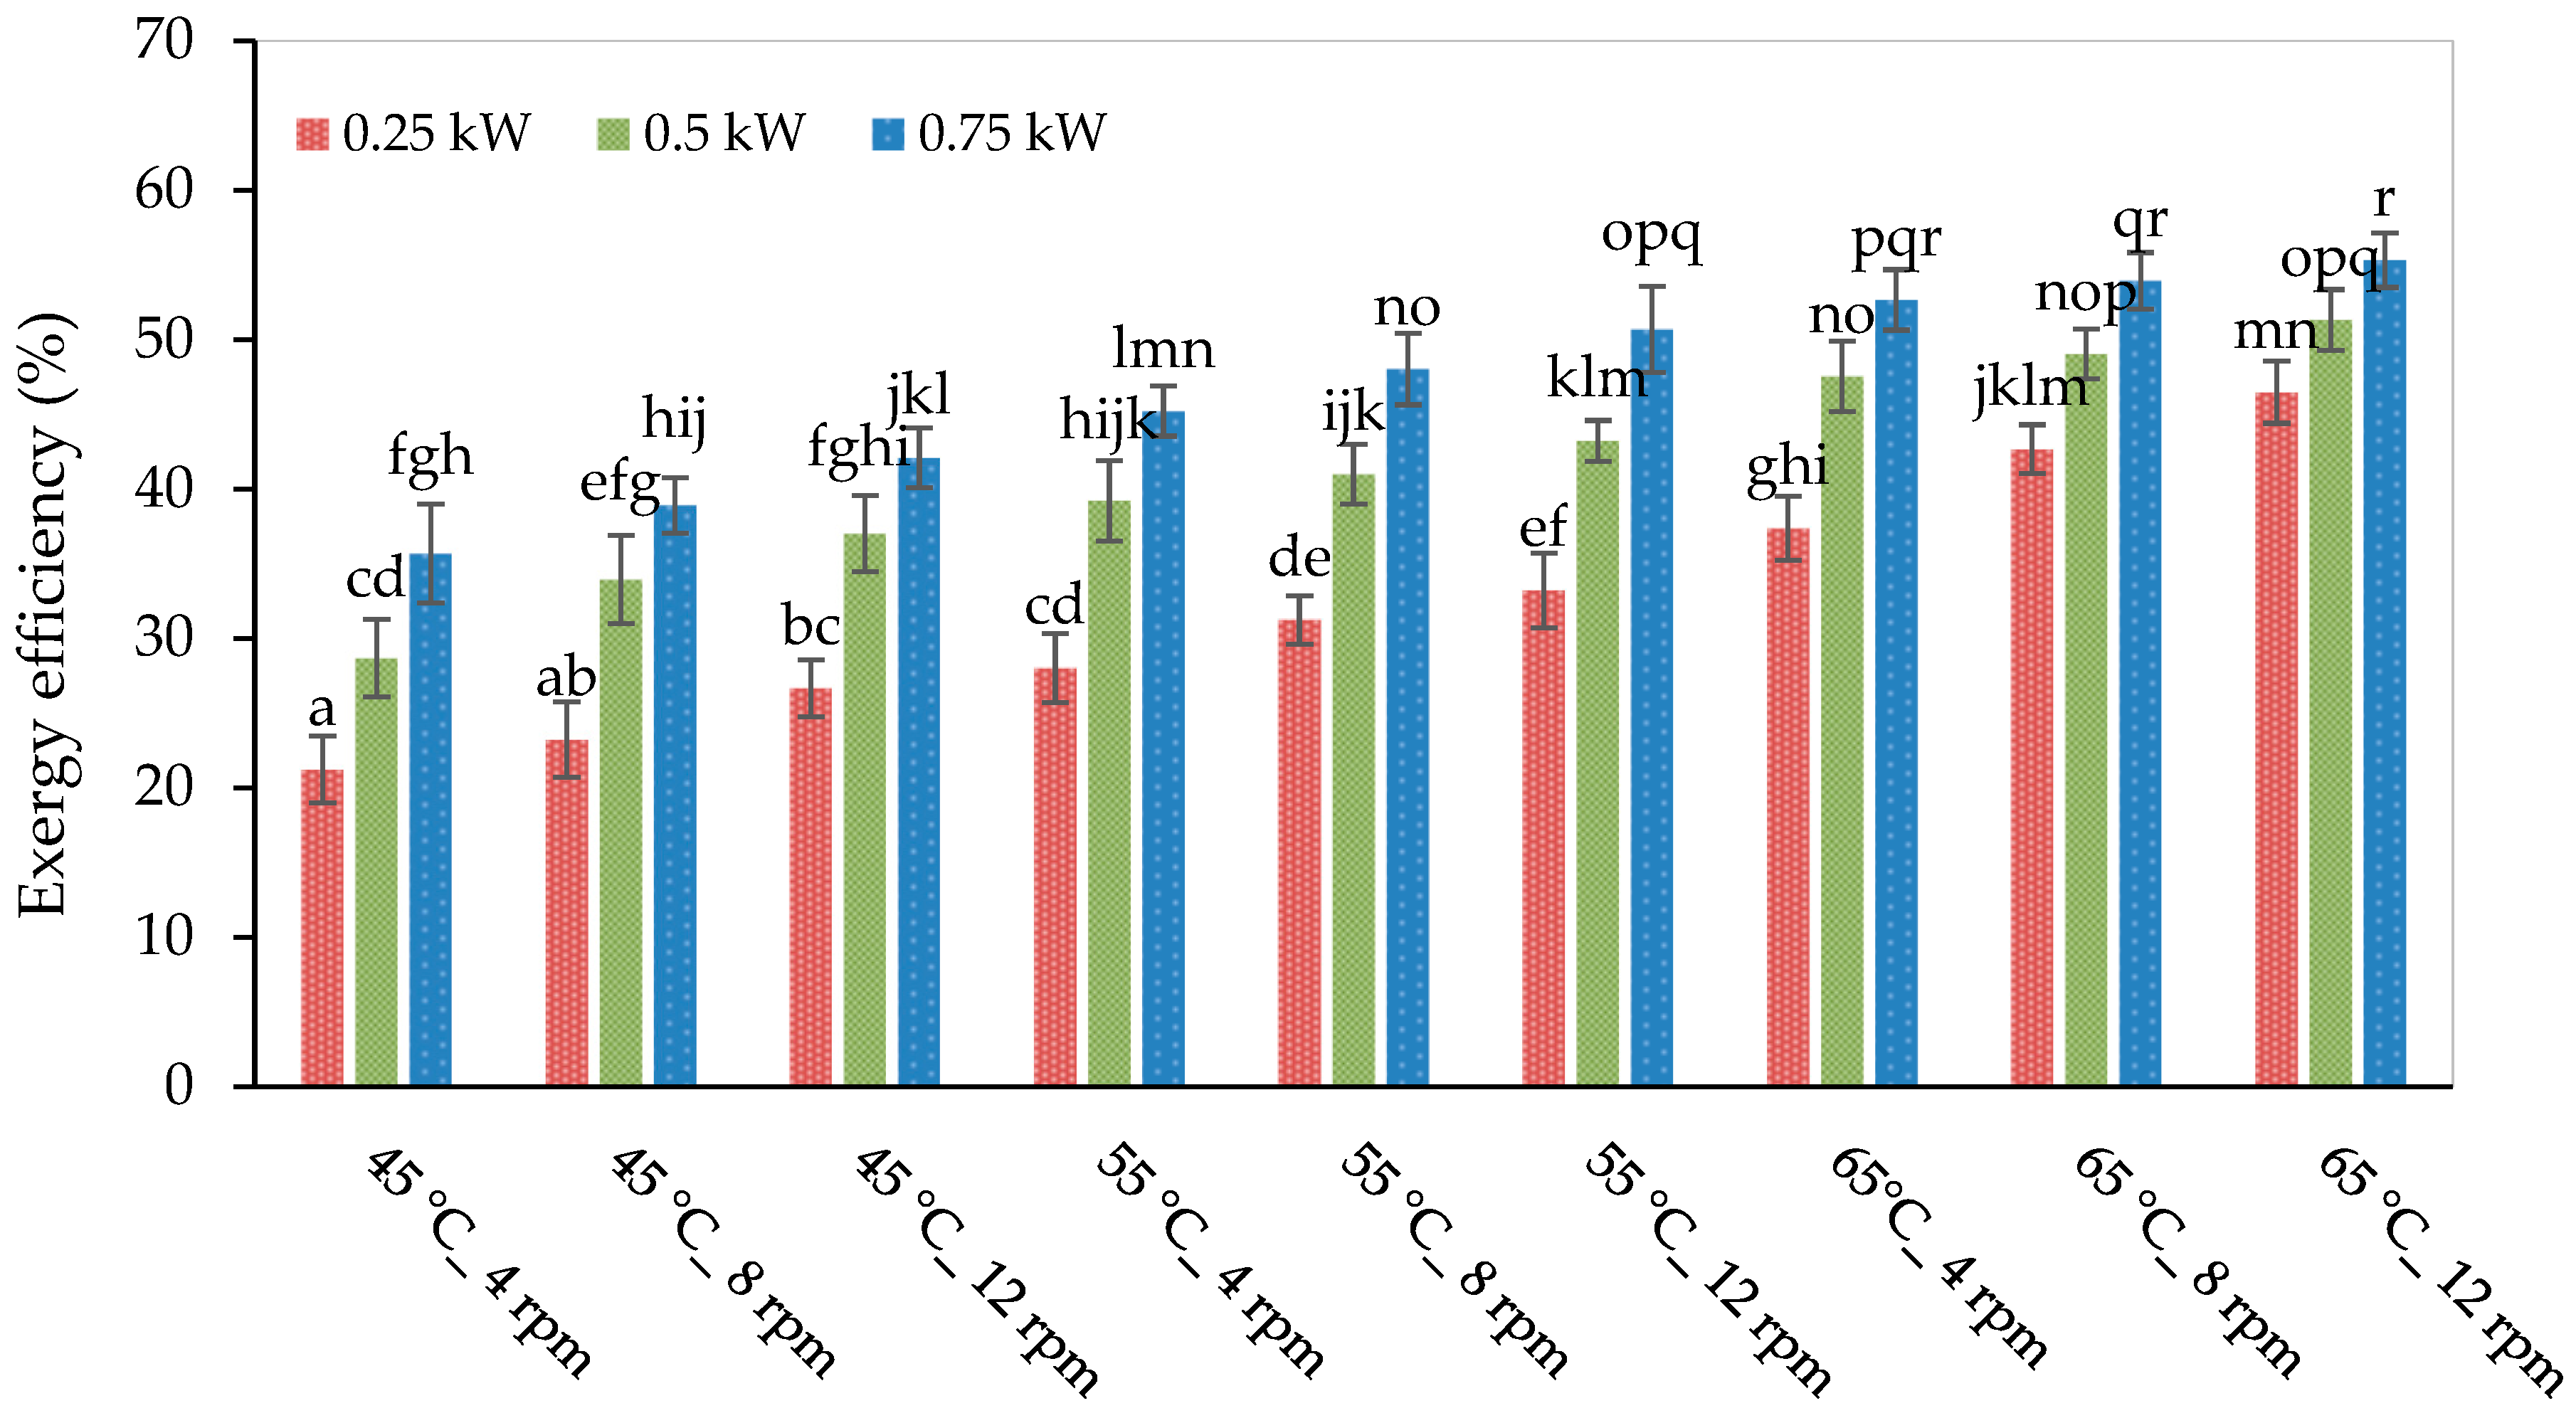
3.4. Exergy Efficiency
3.5. Water Activity (Wa)
3.6. Color
3.7. Rehydration Ratio
3.8. Shrinkage
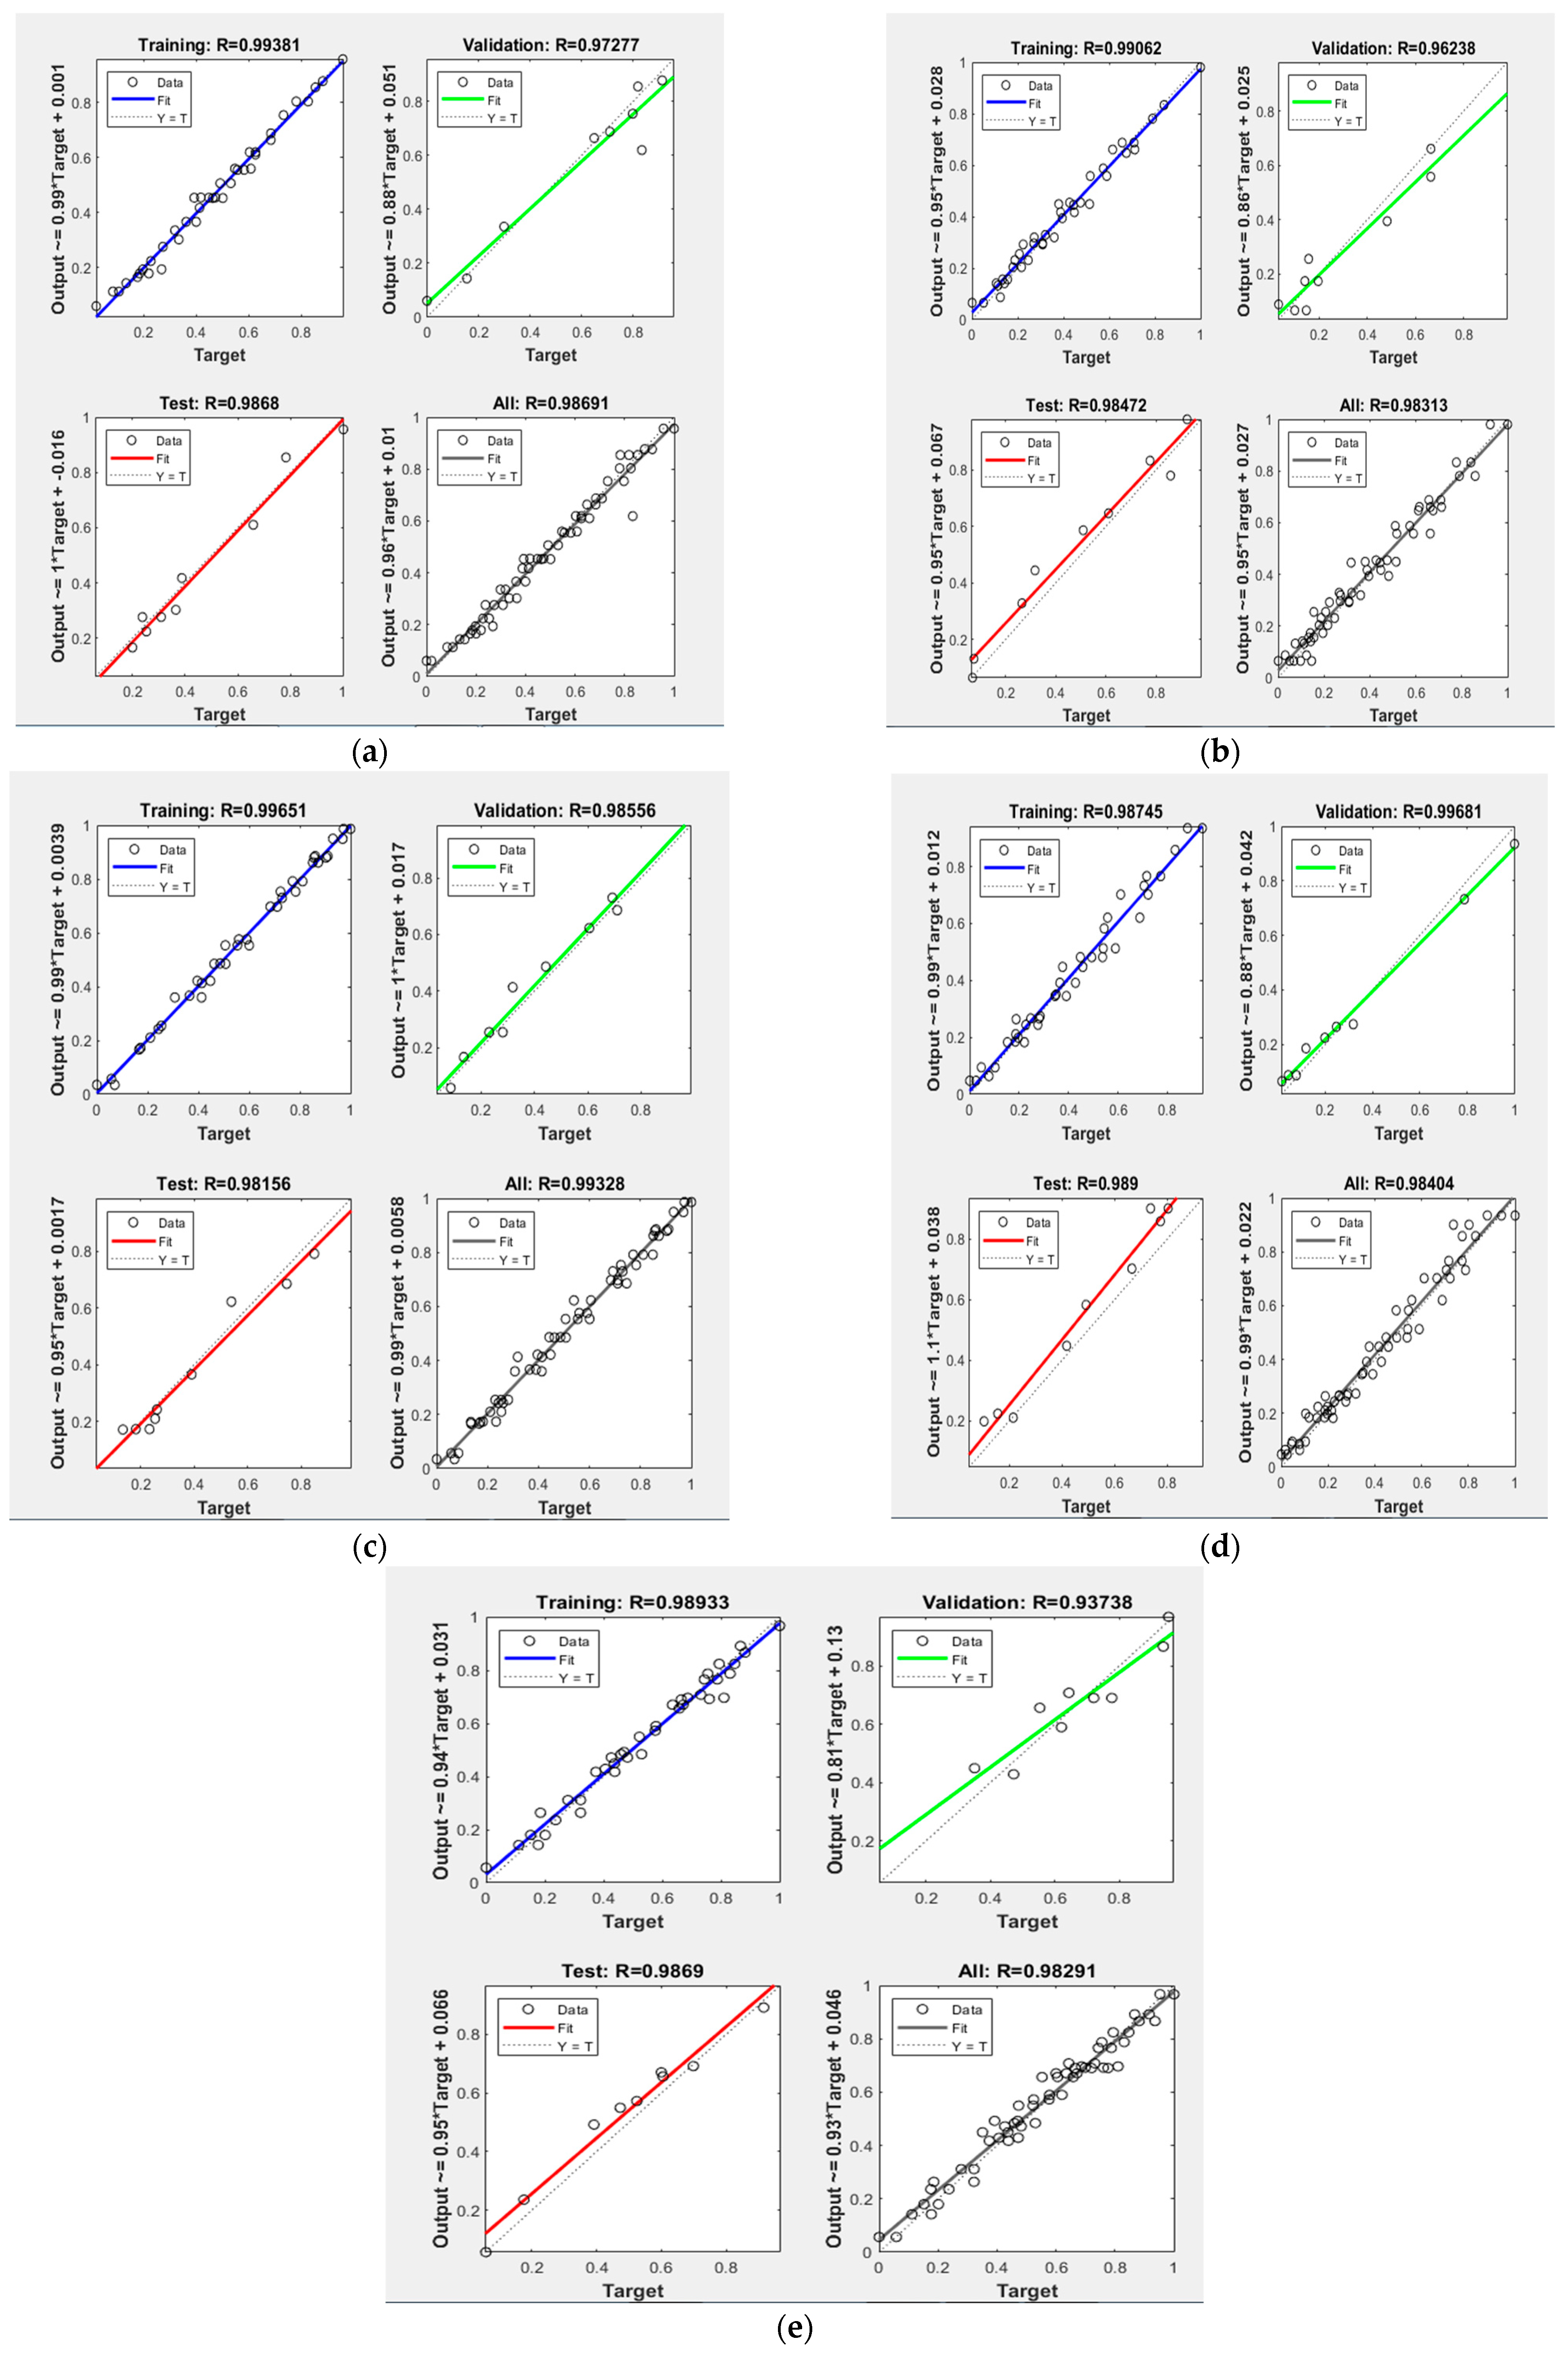
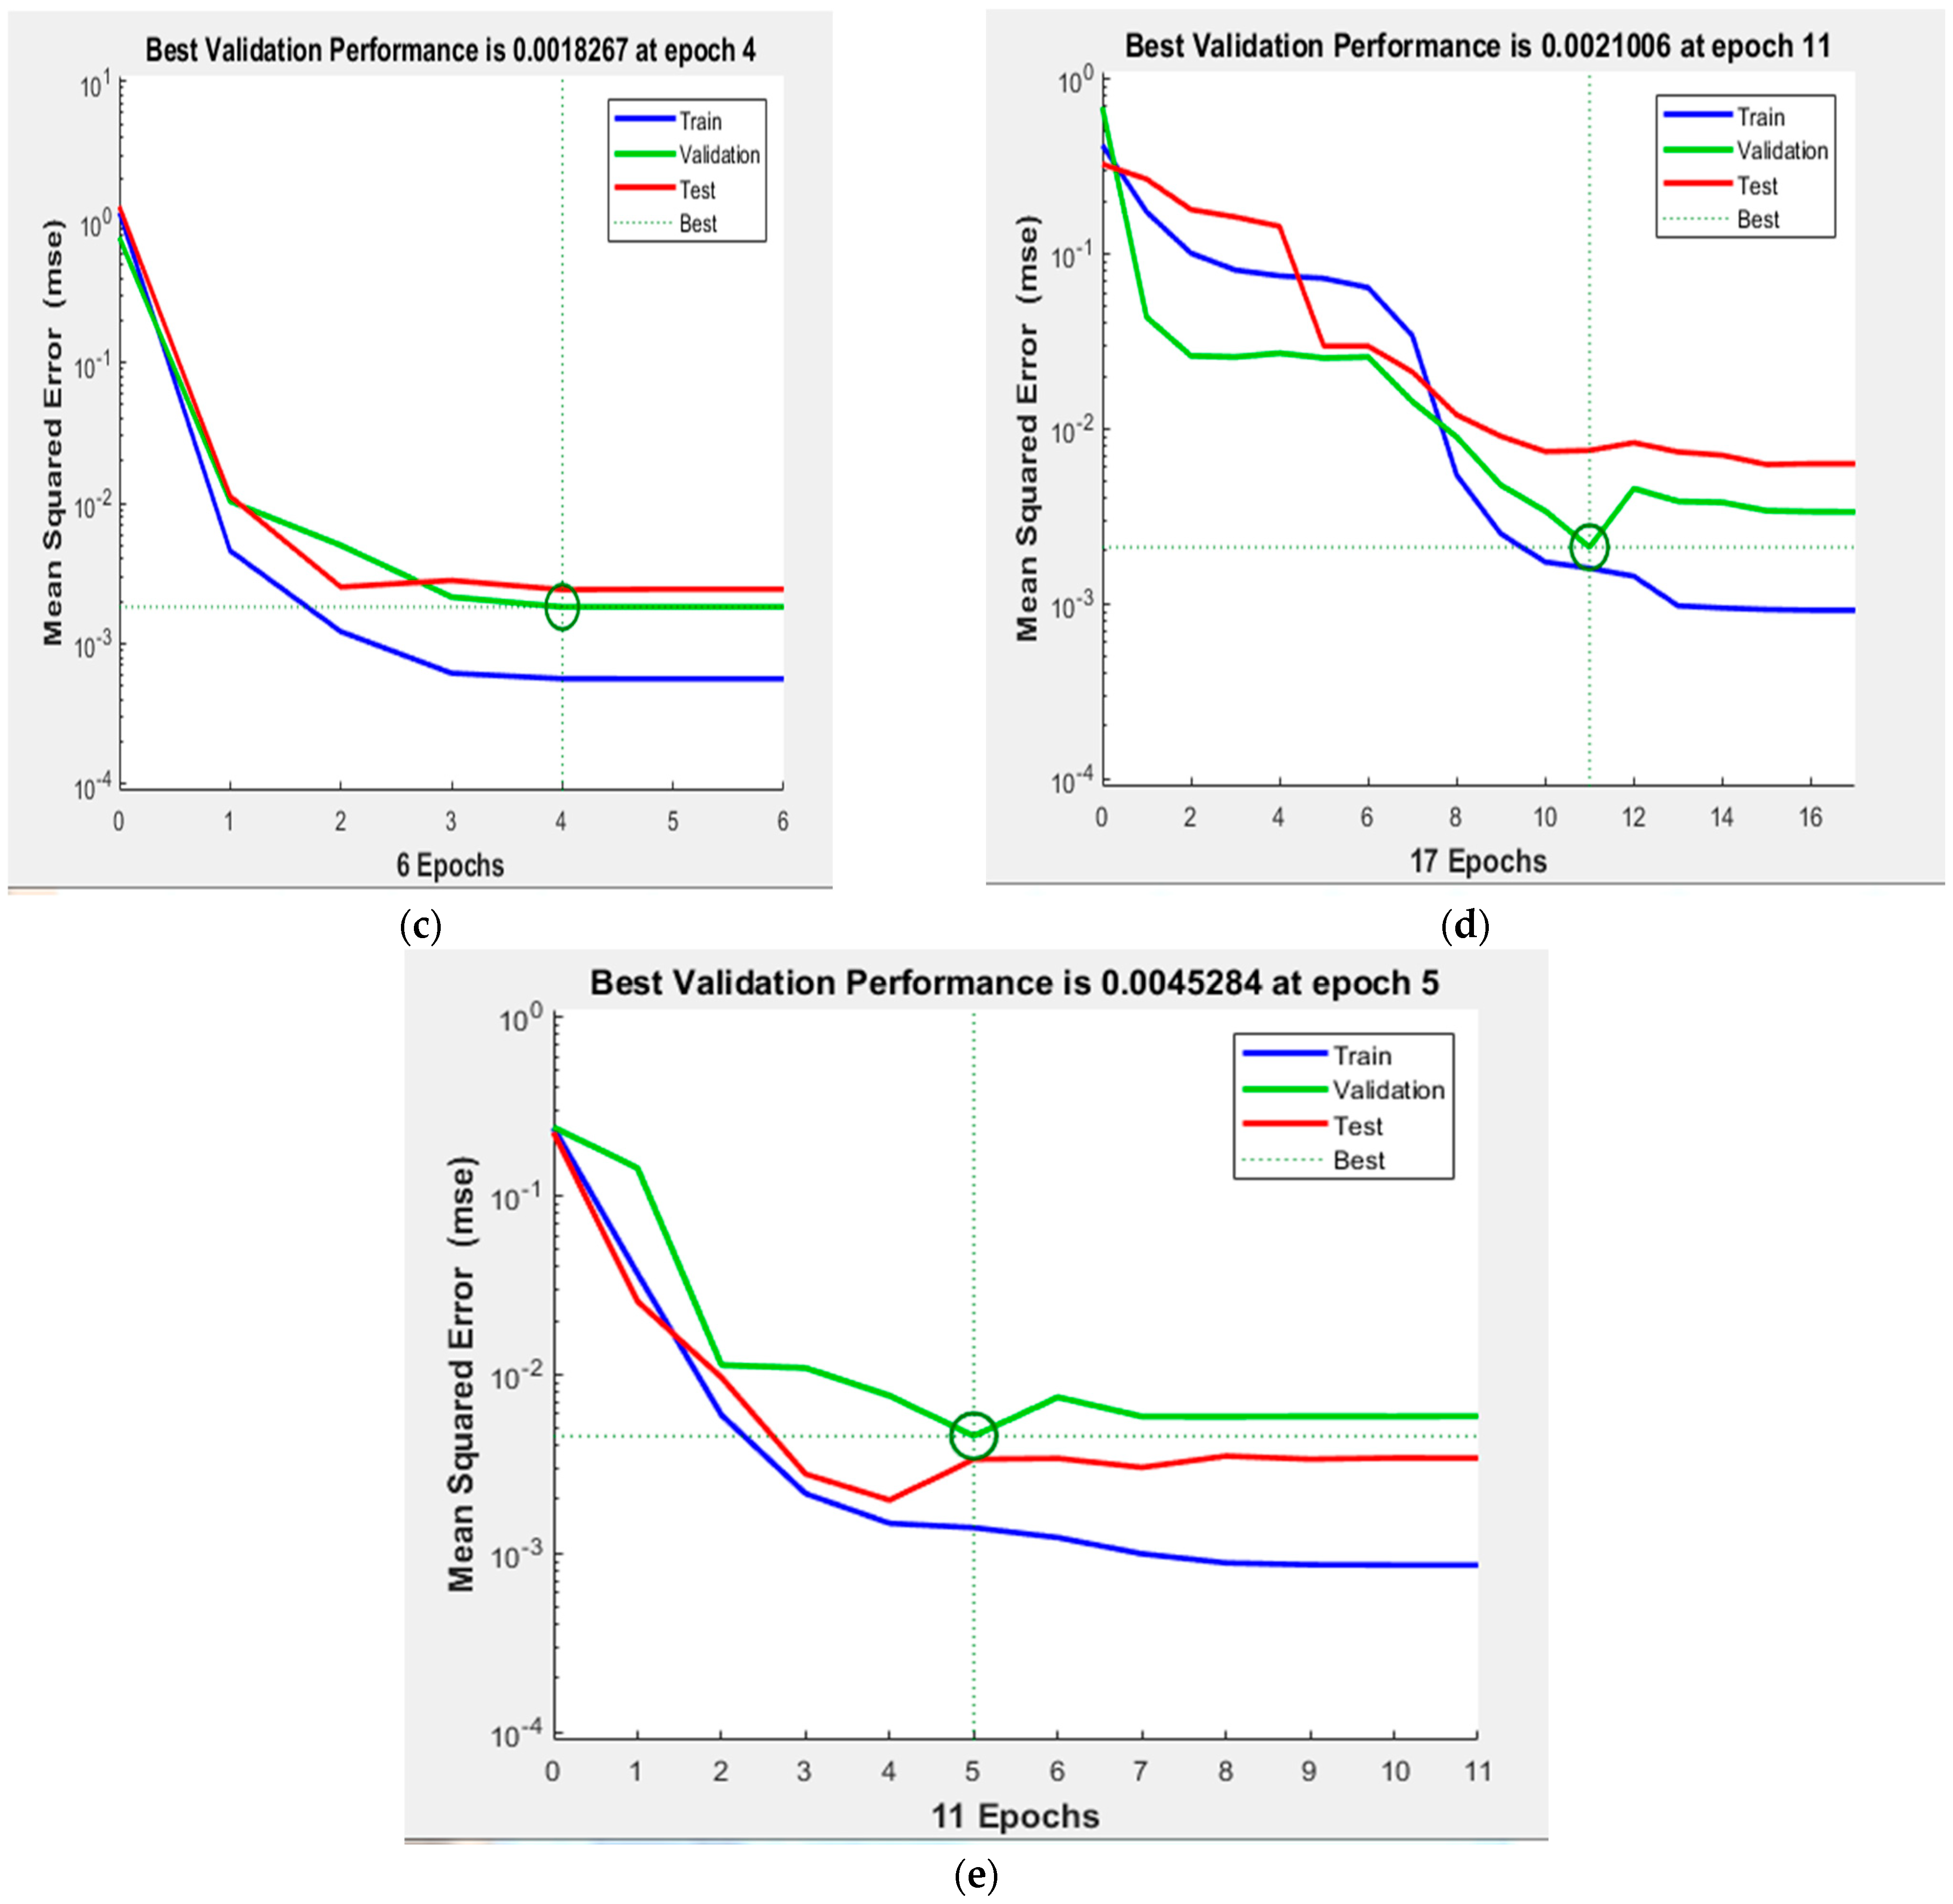
3.9. ANNs
3.10. The Limitations of the Research and Future Perspectives
4. Conclusions
Author Contributions
Funding
Data Availability Statement
Conflicts of Interest
Abbreviations
| A | m2 | Area of tray in which sample is placed |
| Ca | J/kg °C | Specific heat |
| Deff | m2/s | Effective moisture diffusivity |
| Dt | h | Total drying time of each sample |
| Dw | Kg/m2 | Weight density of foamed sample |
| kJ | Exergy destruction in the system | |
| kJ | Total exergy inflow | |
| kJ | Total exergy outflow | |
| EUter | kJ | Thermal energy consumption in convective dryer |
| EUmec | kJ | Mechanical energy consumption |
| EUIR | kJ | Thermal energy consumption in infrared dryer |
| EUD | kJ | Thermal energy consumption in rotary dryer |
| hfg | J/kg | Latent heat of evaporation of sample |
| Me | % d.b | Equilibrium moisture contents |
| MR | - | Moisture ratio |
| Mw | kg | Weight of moisture evaporated from the sample |
| Mo | % d.b | Final moisture content of the sample |
| Mt | % d.b | Moisture content at time t |
| Mi | % d.b | Initial moisture content of the corn sample |
| N | - | Number of training data |
| K | W | Infrared power |
| Oi | - | Value predicted by the ANN for the i−th pattern |
| Q | - | Represents the moisture removed per unit time |
| Qw | (kJ) | Consumed energy for the moisture evaporation |
| R | 8.314 J/mol.K | Universal gas constant |
| R2 | Correlation coefficient | |
| re | m | Equivalent radius of corn |
| Sgen | kJ/K | Has produced entropy after the process |
| SEC | MJ/kg | Specific energy consumption |
| t | s | Drying time |
| TE | % | Thermal efficiency |
| K | Dead-state temperature | |
| Ti | - | Target (trial) value for the i−th pattern |
| Tm | - | Average of predicted values |
| v | m/s | Drying air velocity |
| Wr | kg | Initial mass of product |
| Wd | kg | Mass of dried product (kg) |
| Xwf | %d.b | Final moisture content of dried samples |
| Y | W | The power of electrical motors used in different parts of dryer |
| Xi | stands for each parameter | |
| Xmax | Maximum data for each parameter | |
| Xmin | Minimum data for each parameter | |
| ρa | Kg/m3 | Density of air |
| % | Exergy efficiency | |
| % | Energy efficiency | |
| ∆L*,∆b*,∆a* | - | The difference between the color of fresh and dried samples |
| ∆T | °C | Drying temperature |
| ∆P | mbar | Different pressure |
References
- Cui, J.; Ren, H.; Wang, B.; Chang, F.; Zhang, X.; Meng, H.; Jiang, S.; Tang, J. Hatching and development of maize cyst nematode Heterodera zeae infecting different plant hosts. J. Integr. Agric. 2024, 23, 1593–1603. [Google Scholar] [CrossRef]
- Zhang, M.; Hu, Y.; Han, W.; Chen, J.; Lai, J.; Wang, Y. Potassium nutrition of maize: Uptake, transport, utilization, and role in stress tolerance. Crop J. 2023, 11, 1048–1058. [Google Scholar] [CrossRef]
- Hasnaki, R.; Ziaee, M.; Mahdavi, V. Pesticide residues in corn and soil of corn fields of Khuzestan, Iran, and potential health risk assessment. J. Food Compos. Anal. 2023, 115, 104972. [Google Scholar] [CrossRef]
- Wei, S.; Tian, B.; Fan, H.; Ren, G.; Yang, D.; Ai, Z. Radiofrequency assisted hot air drying of corn kernels: Drying characteristics, uniformity, quality, and energy consumption. Drying Technol. 2024, 42, 1846–1854. [Google Scholar] [CrossRef]
- Mondal, M.H.T.; Akhtaruzzaman, M.; Sarker, M.S.H. Modeling of dehydration and color degradation kinetics of maize grain for mixed flow dryer. J. Agric. Food Res. 2022, 9, 100359. [Google Scholar] [CrossRef]
- Kumar, A.; Kandasamy, P.; Chakraborty, I.; Hangshing, L. Analysis of energy consumption, heat and mass transfer, drying kinetics and effective moisture diffusivity during foam-mat drying of mango in a convective hot-air dryer. Biosyst. Eng. 2022, 219, 85–102. [Google Scholar] [CrossRef]
- Li, S.; Chen, S.; Liang, Q.; Ma, Z.; Han, F.; Xu, Y.; Jin, Y.; Wu, W. Low temperature plasma pretreatment enhances hot-air drying kinetics of corn kernels. J. Food Process Eng. 2019, 42, e13195. [Google Scholar] [CrossRef]
- Abdoli, B.; Zare, D.; Jafari, A.; Chen, G. Evaluation of the air-borne ultrasound on fluidized bed drying of shelled corn: Effectiveness, grain quality, and energy consumption. Drying Technol. 2018, 36, 1749–1766. [Google Scholar] [CrossRef]
- Vukić, M.; Janevski, J.; Vučković, G.; Stojanović, B.; Petrović, A. Experimental investigation of the drying kinetics of corn in a packed and fluidized bed. Iran. J. Chem. Chem. Eng. 2015, 34, 43–49. [Google Scholar]
- Wilson, S.A.; Okeyo, A.A.; Olatunde, G.A.; Atungulu, G.G. Radiant heat treatments for corn drying and decontamination. J. Food Process. Preserv. 2017, 41, e13193. [Google Scholar] [CrossRef]
- Rahmanian-Koushkaki, H.; Nourmohamadi-Moghadami, A.; Zare, D.; Karimi, G. Experimental and theoretical investigation of hot air-infrared thin layer drying of corn in a fixed and vibratory bed dryer. Eng. Agric. Environ. Food 2017, 10, 191–197. [Google Scholar] [CrossRef]
- Jibril, A.N.; Zuo, Y.; Wang, S.; Kibiya, A.Y.; Attanda, M.L.; Henry, I.I.; Huang, J.; Chen, K. Influence of drying chamber, energy consumption, and quality characterization of corn with graphene far infrared dryer. Drying Technol. 2024, 42, 1875–1890. [Google Scholar] [CrossRef]
- De Faria, R.Q.; Dos Santos, A.R.P.; Gariepy, Y.; Da Silva, E.A.A.; Sartori, M.M.P.; Raghavan, V. Optimization of the process of drying of corn seeds with the use of microwaves. Drying Technol. 2020, 38, 676–684. [Google Scholar] [CrossRef]
- Liu, H.; Liu, H.; Liu, H.; Zhang, X.; Hong, Q.; Chen, W.; Zeng, X. Microwave drying characteristics and drying quality analysis of corn in China. Processes 2021, 9, 1511. [Google Scholar] [CrossRef]
- An, N.N.; Sun, W.; Li, D.; Wang, L.J.; Wang, Y. Effect of microwave-assisted hot air drying on drying kinetics, water migration, dielectric properties, and microstructure of corn. Food Chem. 2024, 455, 139913. [Google Scholar] [CrossRef]
- Al-Hilphy, A.R.; Al-Mtury, A.A.A.; Al-Iessa, S.A.; Gavahian, M.; Al-Shatty, S.M.; Jassim, M.A.; Mohusen, Z.A.A.; Khaneghah, A.M. A pilot-scale rotary infrared dryer of shrimp (Metapenaeus affinis): Mathematical modeling and effect on physicochemical attributes. J. Food Process Eng. 2022, 45, e13945. [Google Scholar] [CrossRef]
- Yamchi, A.A.; Sharifian, F.; Khalife, E.; Kaveh, M. Drying kinetic, thermodynamic and quality analyses of infrared drying of truffle slices. J. Food Sci. 2024, 89, 3666–3686. [Google Scholar] [CrossRef] [PubMed]
- Alshehri, A.A.; Tolba, N.M.; Salama, M.A.; Saleh, M.; Kamel, R.M. Energy analysis and quality characteristics of flaxseed oil by using an infrared rotary dryer. Case Stud. Therm. Eng. 2024, 54, 103988. [Google Scholar] [CrossRef]
- Kaveh, M.; Abbaspour-Gilandeh, Y.; Chen, G. Drying kinetic, quality, energy and exergy performance of hot air-rotary drum drying of green peas using adaptive neuro-fuzzy inference system. Food Bioprod. Process. 2020, 124, 168–183. [Google Scholar] [CrossRef]
- Balakrishnan, M.; Jeevarathinam, G.; Aiswariya, S.; Ambrose, R.K.; Ganapathy, S.; Pandiselvam, R. Design, development, and evaluation of rotary drum dryer for turmeric rhizomes (Curcuma longa L.). J. Food Process Eng. 2022, 45, e14052. [Google Scholar] [CrossRef]
- Ghasemkhani, H.; Keyhani, A.; Aghbashlo, M.; Rafiee, S.; Mujumdar, A.S. Improving exergetic performance parameters of a rotating-tray air dryer via a simple heat exchanger. Appl. Therm. Eng. 2016, 94, 13–23. [Google Scholar] [CrossRef]
- Bassey, E.J.; Cheng, J.H.; Sun, D.W. Improving drying kinetics, physicochemical properties and bioactive compounds of red dragon fruit (Hylocereus species) by novel infrared drying. Food Chem. 2022, 375, 131886. [Google Scholar] [CrossRef]
- Kaveh, M.; Abbaspour-Gilandeh, Y.; Nowacka, M.; Kalantari, D.; El-Mesery, H.S.; Taghinezhad, E. Energy and exergy analysis of drying terebinth in a far infrared-rotary dryer using response surface methodology. Heat Transf. 2024, 53, 4109–4134. [Google Scholar] [CrossRef]
- Pradechboon, T.; Dussadee, N.; Unpaprom, Y.; Chindaraksa, S. Effect of rotary microwave drying on quality characteristics and physical properties of Kaffir lime leaf (Citrus hystrix DC). Biomass Convers. Biorefinery 2024, 14, 5601–5610. [Google Scholar] [CrossRef]
- Pradechboon, T.; Ramaraj, R.; Dussadee, N.; Chindaraksa, S. Advances application of a newly developed microwave rotary dryer for drying agricultural products of red chili pepper. Biomass Convers. Biorefinery 2024, 14, 9187–9196. [Google Scholar] [CrossRef]
- Ghasemkhani, H.; Khoshnam, F.; Kamandar, M.R. Drying apple slices in a rotating-tray convective dryer: A study on dehydration characteristics and qualitative attributes. Iran. J. Chem. Eng. 2021, 18, 16–32. [Google Scholar]
- Jayaram, P.; Bhattu, N.R.; Jayaraman, J.; Nagappan, B.; Subramaniam, L.S. Experimental investigation on the treatment of mixed market waste by a novel rotary air dryer. Waste Biomass Valorization 2020, 11, 2153–2162. [Google Scholar] [CrossRef]
- Singh, P.; Mahanta, P.; Kalita, P. Experimental investigation of paddy drying characteristics in a slitless rotary fluidized-bed dryer. Drying Technol. 2022, 40, 3262–3272. [Google Scholar] [CrossRef]
- El-Mesery, H.S.; Qenawy, M.; Ali, M.; Hu, Z.; Adelusi, O.A.; Njobeh, P.B. Artificial intelligence as a tool for predicting the quality attributes of garlic (Allium sativum L.) slices during continuous infrared-assisted hot air drying. J. Food Sci. 2024, 89, 7693–7712. [Google Scholar] [CrossRef] [PubMed]
- Zadhossein, S.; Abbaspour-Gilandeh, Y.; Kaveh, M.; Szymanek, M.; Khalife, E.; Samuel, O.D.; Amiri, M.; Dziwulski, J. Exergy and energy analyses of microwave dryer for cantaloupe slice and prediction of thermodynamic parameters using ANN and ANFIS algorithms. Energies 2021, 14, 4838. [Google Scholar] [CrossRef]
- Ehiem, J.C.; Oduma, O.; Igbozulike, A.O.; Raghavan, V.G.; Aviara, N.A. Modeling the kinetics, energy consumption and shrinkage of avocado pear pulp during drying in a microwave assisted dryer. Chem. Prod. Process Model. 2024, 19, 879–889. [Google Scholar] [CrossRef]
- Sasikumar, R.; Mangang, I.B.; Vivek, K.; Jaiswal, A.K. Effect of ultrasound-assisted thin bed drying for retaining the quality of red bell pepper and compare the predictive ability of the mathematical model with artificial neural network. J. Food Process Eng. 2023, 46, e14468. [Google Scholar] [CrossRef]
- El-Mesery, H.S.; Ali, M.; Qenawy, M.; Adelusi, O.A. Application of artificial intelligence to predict energy consumption and thermal efficiency of hybrid convection-radiation dryer for garlic slices. Eng. Appl. Artif. Intell. 2024, 138, 109338. [Google Scholar] [CrossRef]
- Kaveh, M.; Zomorodi, S.; Szymanek, M.; Dziwulska-Hunek, A. Determination of drying characteristics and physicochemical properties of mint (Mentha spicata L.) leaves dried in refractance window. Foods 2024, 13, 2867. [Google Scholar] [CrossRef] [PubMed]
- Rashvand, M.; Nadimi, M.; Paliwal, J.; Zhang, H.; Feyissa, A.H. Effect of Pulsed Electric Field on the Drying Kinetics of Apple Slices during Vacuum-Assisted Microwave Drying: Experimental, Mathematical and Computational Intelligence Approaches. Appl. Sci. 2024, 14, 7861. [Google Scholar] [CrossRef]
- Huang, W.; Huang, D.; Chen, Y.; Gong, G.; Zhou, F.; Huang, S.; Auwal, M.; Li, L. Ultrasound-assisted medium-wave infrared drying performance of Phyllanthus emblica and artificial neural network modeling. Int. Commun. Heat Mass Transf. 2024, 159, 108028. [Google Scholar] [CrossRef]
- Tepe, T.K. Effect of pretreatments on drying characteristics, rehydration properties, and total energy consumption of carrot slices: Comparison between thin layer mathematical modelling and artificial neural network modelling. Biomass Convers. Biorefinery 2024, 14, 1373–1387. [Google Scholar] [CrossRef]
- AOAC. Official Methods of Analysis of AOAC International, 16th ed.; Association of Official Analytical Chemist International AOAC: Gaithersburg, MD, USA, 1997. [Google Scholar]
- Huang, D.; Deng, R.; Auwal, M.; Wang, W.; Gong, G.; Li, L.; Sunden, B. Drying kinetics and energy consumption of astragalus membranaceus under infrared drying. J. Therm. Sci. Eng. Appl. 2024, 16, 071013. [Google Scholar] [CrossRef]
- Lemus-Mondaca, R.; Zura-Bravo, L.; Ah-Hen, K.; Di Scala, K. Effect of drying methods on drying kinetics, energy features, thermophysical and microstructural properties of Stevia rebaudiana leaves. J. Sci. Food Agric. 2021, 101, 6484–6495. [Google Scholar] [CrossRef]
- Motevali, A.; Minaei, S.; Banakar, A.; Ghobadian, B.; Khoshtaghaza, M.H. Comparison of energy parameters in various dryers. Energy Convers. Manag. 2014, 87, 711–725. [Google Scholar] [CrossRef]
- Kaveh, M.; Abbaspour-Gilandeh, Y.; Nowacka, M. Comparison of different drying techniques and their carbon emissions in green peas. Chem. Eng. Process.-Process Intensif. 2021, 160, 108274. [Google Scholar] [CrossRef]
- Geng, Z.; Wang, H.; Torki, M.; Beigi, M.; Zhu, L.; Huang, X.; Yang, X.; Hu, B. Thermodynamically analysis and optimization of potato drying in a combined infrared/convective dryer. Case Stud. Therm. Eng. 2023, 42, 102671. [Google Scholar] [CrossRef]
- Leilayi, M.; Arabhosseini, A.; Samimi Akhijahani, H.; Kaveh, M.; Nezamlou, N.; Aghaei, M. Energy and exergy efficiencies of batch paddy rice drying with liquefied petroleum gas dehumidification: A comprehensiv e analysis using adaptive neuro -fuzzy inference system and artificial neural networks approaches. Energy Convers. Manag. X 2025, 25, 100826. [Google Scholar] [CrossRef]
- Meshkat, H.; Sharifian, F.; Hosainpour, A.; Nikbakht, A.M.; Kaveh, M. Analysis of energy and exergy of lavender extract powder in spray dryer. Heat Transf. 2024, 53, 4608–4624. [Google Scholar] [CrossRef]
- Icier, F.; Ozmen, D.; Cevik, M.; Cokgezme, O.F. Drying of licorice root by novel radiative methods. J. Food Process. Preserv. 2021, 45, e15214. [Google Scholar] [CrossRef]
- Dowlati, M.; Golpour, I.; Blanco-Marigorta, A.M.; Marcos, J.D.; de la Guardia, M.; Sheikhshoaei, H. A comprehensive assessment of energetic and exergetic performance for the dehumidification system of a processed pistachio production unit. J. Food Process Eng. 2023, 46, e14471. [Google Scholar] [CrossRef]
- Tezcan, D.; Sabancı, S.; Cevik, M.; Cokgezme, O.F.; Icier, F. Infrared drying of dill leaves: Drying characteristics, temperature distributions, performance analyses and colour changes. Food Sci. Technol. Int. 2021, 27, 32–45. [Google Scholar] [CrossRef]
- Cokgezme, O.F.; Gunes, N.C.; Bayana, D.; Icier, F. Life cycle assessment of a Photovoltaic-Assisted Daylight simulated dryer. Sustain. Energy Technol. Assess. 2024, 65, 103751. [Google Scholar] [CrossRef]
- Giang, N.T.N.; Tan, N.D.; Ha, H.T.N.; Van Thanh, D.; Van Khai, T.; Quyen, D.K. Artificial intelligence prediction the desirable moisture content of dried oyster mushroom (Pleurotus sajor-caju) for enhancing the cellulase-assisted extraction efficiency. J. Agric. Food Res. 2025, 19, 101561. [Google Scholar] [CrossRef]
- Camilo, M.O.; Carvalho, R.F.; Costa, A.B.; Junior, E.F.; Costa, A.O.; Sousa, R.C. Drying kinetic for moisture content prediction of peels Tahiti lemon (Citrus latifolia): Approach by machine learning and optimization-genetic algorithms and nonlinear programming. S. Afr. J. Chem. Eng. 2025, 51, 136–152. [Google Scholar] [CrossRef]
- Qenawy, M.; Ali, M.; El-Mesery, H.S.; Hu, Z. Analysis and control of hybrid convection-radiation drying systems toward energy saving strategy. J. Food Sci. 2024, 89, 9559–9576. [Google Scholar] [CrossRef]
- Abasi, S.; Minaei, S.; Khoshtaghaza, M.H. Effect of desiccant system on thin layer drying kinetics of corn. J. Food Sci. Technol. 2017, 54, 4397–4404. [Google Scholar] [CrossRef]
- Beigi, M.; Torki, M.; Khoshnam, F.; Tohidi, M. Thermodynamic and environmental analyses for paddy drying in a semi-industrial dryer. J. Therm. Anal. Calorim. 2021, 146, 393–401. [Google Scholar] [CrossRef]
- Zohrabi, S.; Seiiedlou, S.S.; Aghbashlo, M.; Scaar, H.; Mellmann, J. Enhancing the exergetic performance of a pilot-scale convective dryer by exhaust air recirculation. Drying Technol. 2020, 38, 518–533. [Google Scholar] [CrossRef]
- Ajetunmobi-Adeyeye, R.I.; Norazatul Hanim, M.R.; Maizura, M. Effects of superheated steam drying on the physical properties, functional characteristics, and antioxidant capacity of papaya powder. J. Food Meas. Charact. 2024, 18, 9086–9097. [Google Scholar] [CrossRef]
- El-Mesery, H.S.; Ashiagbor, K.; Hu, Z.; Alshaer, W.G. A novel infrared drying technique for processing of apple slices: Drying characteristics and quality attributes. Case Stud. Therm. Eng. 2023, 52, 103676. [Google Scholar] [CrossRef]
- Antal, T.; Páy, G.L.; Sikolya, L. Effect of Drying Methods on the Physical and Mechanical Properties of Dried Sweet Corn. In Proceedings of the International Multidisciplinary Conference, Nyíregyháza, Hungary, Baia Mare, Romania, 25–26 November 2021. [Google Scholar]
- Aradwad, P.P.; Thirumani Venkatesh, A.K.; Mani, I. Infrared drying of apple (Malus domestica) slices: Effect on drying and color kinetics, texture, rehydration, and microstructure. J. Food Process Eng. 2023, 46, e14218. [Google Scholar] [CrossRef]
- Jafarifar, M.; Chayjan, R.A.; Dibagar, N.; Alaei, B. Modelling some engineering properties of walnut kernel undergoing different drying methods with microwave pre-treatment. Qual. Assur. Saf. Crop. Foods 2017, 9, 463–478. [Google Scholar] [CrossRef]
- Liu, Z.L.; Bai, J.W.; Wang, S.X.; Meng, J.S.; Wang, H.; Yu, X.L.; Gao, Z.J.; Xiao, H.W. Prediction of energy and exergy of mushroom slices drying in hot air impingement dryer by artificial neural network. Drying Technol. 2020, 38, 1959–1970. [Google Scholar] [CrossRef]
- Tepe, T.K.; Tepe, F.B. Improvement of pear slices drying by pretreatments and microwave-assisted convective drying method: Drying characteristics, modeling of artificial neural network, principal component analysis of quality parameters. J. Therm. Anal. Calorim. 2024, 149, 7313–7328. [Google Scholar] [CrossRef]
- El-Mesery, H.S.; Qenawy, M.; Li, J.; El-Sharkawy, M.; Du, D. Predictive modeling of garlic quality in hybrid infrared-convective drying using artificial neural networks. Food Bioprod. Process. 2024, 145, 226–238. [Google Scholar] [CrossRef]
- Günaydın, S.; Ropelewska, E.; Sacilik, K.; Çetin, N. Exploration of machine learning models based on the image texture of dried carrot slices for classification. J. Food Compos. Anal. 2024, 129, 106063. [Google Scholar] [CrossRef]
- Parida, C.; Sahoo, P.K.; Nasir, R.; Waseem, L.A.; Tariq, A.; Aslam, M.; Hatamleh, W.A. Exergy assessment of infrared assisted air impingement dryer using response surface methodology, Back Propagation-Artificial Neural Network, and multi-objective genetic algorithm. Case Stud. Therm. Eng. 2024, 53, 103936. [Google Scholar] [CrossRef]
- Omari, A.; Behroozi-Khazaei, N.; Sharifian, F. Drying kinetic and artificial neural network modeling of mushroom drying process in microwave-hot air dryer. J. Food Process Eng. 2018, 41, e12849. [Google Scholar] [CrossRef]
- Aghbashlo, M.; Hosseinpour, S.; Mujumdar, A.S. Application of artificial neural networks (ANNs) in drying technology: A comprehensive review. Drying Technol. 2015, 33, 1397–1462. [Google Scholar] [CrossRef]


| Parameter | df | Drying Time | S.E.C | Energy Efficiency | Thermal Efficiency | Exergy Efficiency | |||||
|---|---|---|---|---|---|---|---|---|---|---|---|
| Mean Square | F Value | Mean Square | F Value | Mean Square | F Value | Mean Square | F Value | Mean Square | F Value | ||
| IR power | 2 | 165,862.67 | 1090.40 ** | 712.03 | 356.18 ** | 1028.30 | 979.95 ** | 896.63 | 488.98 ** | 1483.96 | 296.30 ** |
| T | 2 | 203,328.08 | 1336.70 ** | 827.16 | 413.77 ** | 1266.00 | 1206.47 ** | 1189.78 | 648.86 ** | 1848.15 | 369.01 ** |
| RD | 2 | 24,350.56 | 160.08 ** | 77.98 | 39.01 ** | 122.19 | 116.44 ** | 159.96 | 87.24 ** | 212.27 | 42.38 ** |
| IR * T | 4 | 1129.06 | 7.42 ** | 28.49 | 14.25 ** | 24.48 | 23.33 ** | 40.834 | 22.26 ** | 16.85 | 3.36 * |
| IR * RD | 4 | 277.10 | 1.82 ns | 1.89 | 0.94 ns | 0.75 | 0.71 ns | 3.017 | 1.64 ns | 1.81 | 0.36 |
| T * RD | 4 | 239.90 | 1.57 ns | 0.79 | 0.39 ns | 1.32 | 1.26 ns | 5.943 | 3.24 ns | 2.20 | 0.44 |
| IR * T * RD | 8 | 540.10 | 3.55 ns | 2.458 | 1.22 ns | 7.31 | 6.96 ns | 7.004 | 3.82 ns | 5.26 | 1.05 |
| Error | 54 | 152.111 | 1.999 | 1.049 | 1.834 | 5.008 | |||||
| Infrared Power (kW) | Drying Temperature (°C) | Rotary Rotation Speed (rpm) | S.E.C (MJ/kg) | Thermal Efficiency (%) | Energy Efficiency (%) |
|---|---|---|---|---|---|
| 0.25 | 45 | 4 | 28.15 ± 1.95 o | 5.50 ± 0.76 a | 3.24 ± 0.98 a |
| 0.25 | 45 | 8 | 25.96 ± 1.63 no | 6.13 ± 0.91 a | 4.66 ± 0.81 ab |
| 0.25 | 45 | 12 | 24.67 ± 1.77 mn | 7.04 ± 1.02 ab | 6.01 ± 1.03 bc |
| 0.25 | 55 | 4 | 22.56 ± 1.35 lm | 7.79 ± 1.67 abc | 6.89 ± 0.90 cd |
| 0.25 | 55 | 8 | 21.68 ± 1.66 kl | 9.14 ± 1.35 bcd | 8.03 ± 0.71 de |
| 0.25 | 55 | 12 | 19.47 ± 1.89 jk | 10.28 ± 1.69 cde | 8.99 ± 0.53 e |
| 0.25 | 65 | 4 | 15.76 ± 1.74 i | 10.23 ± 0.81 cde | 12.42 ± 0.69 f |
| 0.25 | 65 | 8 | 11.16 ± 1.03 fg | 16.37 ± 0.92 h | 17.80 ± 0.88 ij |
| 0.25 | 65 | 12 | 9.55 ± 1.35 def | 20.67 ± 1.53 ij | 22.03 ± 0.53 k |
| 0.5 | 45 | 4 | 21.38 ± 1.25 jkl | 9.20 ± 0.97 bcd | 8.11 ± 1.21 de |
| 0.5 | 45 | 8 | 19.04 ± 1.63 j | 10.56 ± 1.24 de | 9.35 ± 0.71 e |
| 0.5 | 45 | 12 | 16.50 ± 1.27 i | 12.11 ± 0.71 ef | 12.26 ± 1.46 f |
| 0.5 | 55 | 4 | 14.06 ± 1.63 hi | 13.14 ± 0.92 fg | 14.01 ± 0.72 fg |
| 0.5 | 55 | 8 | 12.50 ± 1.43 gh | 14.98 ± 1.51 gh | 16.06 ± 0.83 hi |
| 0.5 | 55 | 12 | 11.07 ± 1.10 fg | 16.97 ± 1.20 h | 18.17 ± 0.92 j |
| 0.5 | 65 | 4 | 9.24 ± 1.45 cdef | 22.04 ± 1.46 jk | 23.01 ± 1.02 kl |
| 0.5 | 65 | 8 | 8.22 ± 0.60 bcde | 24.26 ± 1.62 kl | 24.78 ± 1.08 mn |
| 0.5 | 65 | 12 | 7.09 ± 0.97 abcd | 26.63 ± 1.20 m | 26.50 ± 0.58 nop |
| 0.75 | 45 | 4 | 15.77 ± 1.54 i | 10.22 ± 1.01 cde | 12.42 ± 1.32 f |
| 0.75 | 45 | 8 | 14.76 ± 1.78 hi | 12.97 ± 0.97 fg | 14.54 ± 1.23 gh |
| 0.75 | 45 | 12 | 12.35 ± 1.13 gh | 16.22 ± 1.37 h | 17.64 ± 1.31 ij |
| 0.75 | 55 | 4 | 10.56 ± 1.54 efg | 19.20 ± 1.32 i | 21.28 ± 0.73 k |
| 0.75 | 55 | 8 | 8.79 ± 0.99 cdef | 23.00 ± 1.91 jk | 24.04 ± 1.68 lm |
| 0.75 | 55 | 12 | 7.86 ± 0.96 bcd | 26.30 ± 1.97 lm | 26.16 ± 1.39 no |
| 0.75 | 65 | 4 | 6.71 ± 1.24 abc | 27.41 ± 1.69 mn | 27.37 ± 1.31 op |
| 0.75 | 65 | 8 | 6.18 ± 1.20 ab | 29.10 ± 1.69 no | 28.10 ± 1.09 pq |
| 0.75 | 65 | 12 | 5.06 ± 0.89 a | 32.31 ± 1.74 o | 29.31 ± 0.73 q |
| Parameter | df | Wa | Shrinkage | RR | ΔE | ||||
|---|---|---|---|---|---|---|---|---|---|
| Mean Square | F Value | Mean Square | F Value | Mean Square | F Value | Mean Square | F Value | ||
| IR power | 2 | 0.03 | 81.62 ** | 71.55 | 101.99 ** | 1.24 | 73.43 ** | 133.34 | 113.67 ** |
| T | 2 | 0.03 | 96.64 ** | 604.30 | 861.40 ** | 6.76 | 398.57 ** | 598.94 | 510.60 ** |
| RD | 2 | 0.00 | 12.03 ** | 32.43 | 46.22 ** | 0.50 | 29.54 ** | 12.64 | 10.78 ** |
| IR * T | 4 | 0.00 | 0.73 ns | 0.79 | 1.12 ns | 0.04 | 2.44 ns | 1.90 | 1.62 |
| IR * RD | 4 | 0.00 | 0.36 ns | 0.24 | 0.34 ns | 0.00 | 0.39 ns | 0.07 | 0.06 |
| T * RD | 4 | 0.00 | 0.03 ns | 0.44 | 0.63 ns | 0.01 | 1.06 ns | 0.70 | 0.60 |
| IR * T * RD | 8 | 0.00 | 0.62 ns | 0.27 | 0.38 ns | 0.00 | 0.18 ns | 0.07 | 0.06 |
| Error | 54 | 0.00 | 0.70 | 0.01 | 1.17 | ||||
| Infrared Power (kW) | Drying Temperature (°C) | Rotary Rotation Speed (rpm) | L | a | b | ΔE | Wa |
|---|---|---|---|---|---|---|---|
| Fresh | 69.41 ± 1.62 k | 5.77 ± 0.36 a | 29.34 ± 0.92 n | - | 0.905 ± 0.02 m | ||
| 0.25 | 45 | 4 | 64.15 ± 2.19 j | 5.99 ± 0.76 a | 25.23 ± 0.97 m | 16.22 ± 1.00 hijk | 0.381 ± 0.01 l |
| 0.25 | 45 | 8 | 63.16 ± 1.25 j | 6.67 ± 0.30 ab | 24.86 ± 0.96 lm | 18.23 ± 0.66 kl | 0.366 ± 0.01 kl |
| 0.25 | 45 | 12 | 63.53 ± 2.22 j | 6.24 ± 0.36 a | 25.03 ± 0.83 lm | 17.03 ± 0.97 ijk | 0.359 ± 0.02 jkl |
| 0.25 | 55 | 4 | 57.98 ± 1.81 cdef | 9.00 ± 0.39 efg | 18.10 ± 0.80 def | 6.75 ± 1.02 a | 0.352 ± 0.02 jkl |
| 0.25 | 55 | 8 | 56.11 ± 1.25 abcdef | 9.46 ± 0.55 ghi | 17.27 ± 0.52 cde | 7.78 ± 0.98 ab | 0.343 ± 0.02 ijk |
| 0.25 | 55 | 12 | 57.02 ± 1.65 bcdef | 9.17 ± 0.41 fgh | 17.99 ± 1.25 def | 7.38 ± 1.04 a | 0.331 ± 0.01 ijk |
| 0.25 | 65 | 4 | 58.58 ± 2.00 defgh | 7.59 ± 0.29 cd | 22.19 ± 0.96 hijk | 13.06 ± 0.65 de | 0.326 ± 0.02 hij |
| 0.25 | 65 | 8 | 57.98 ± 1.52 cdef | 8.26 ± 0.45 def | 21.57 ± 0.72 hi | 13.98 ± 0.95 defg | 0.286 ± 0.01 efg |
| 0.25 | 65 | 12 | 58.37 ± 1.80 cdefg | 7.89 ± 0.67 cd | 21.87 ± 0.78 hi | 13.47 ± 1.36 def | 0.270 ± 0.02 bcdef |
| 0.5 | 45 | 4 | 59.60 ± 2.02 fghi | 7.20 ± 0.67 bc | 22.26 ± 0.87 hijk | 20.28 ± 1.35 m | 0.340 ± 0.02 ijk |
| 0.5 | 45 | 8 | 58.62 ± 1.36 defgh | 7.60 ± 0.54 cd | 21.89 ± 1.14 hi | 22.30 ± 0.77 n | 0.331 ± 0.02 hij |
| 0.5 | 45 | 12 | 59.03 ± 2.65 efghi | 7.31 ± 0.32 bc | 22.03 ± 0.89 hij | 21.36 ± 1.36 mn | 0.325 ± 0.02 hij |
| 0.5 | 55 | 4 | 55.10 ± 1.99 abcd | 10.90 ± 0.36 klm | 15.70 ± 1.24 abc | 12.19 ± 1.33 d | 0.308 ± 0.02 ghi |
| 0.5 | 55 | 8 | 53.12 ± 1.66 a | 11.26 ± 0.40 m | 14.93 ± 0.64 a | 13.22 ± 1.65 de | 0.291 ± 0.02 efgh |
| 0.5 | 55 | 12 | 53.99 ± 1.25 ab | 11.00 ± 0.42 lm | 15.28 ± 1.13 ab | 12.79 ± 0.58 de | 0.283 ± 0.02 defg |
| 0.5 | 65 | 4 | 56.65 ± 1.23 bcdef | 10.00 ± 0.69 hijk | 19.55 ± 1.08 fg | 16.48 ± 0.77 hijk | 0.262 ± 0.02 abcde |
| 0.5 | 65 | 8 | 55.57 ± 1.83 abcde | 10.46 ± 0.47 jklm | 18.78 ± 0.40 ef | 17.85 ± 1.22 kl | 0.255 ± 0.02 abcde |
| 0.5 | 65 | 12 | 55.90 ± 1.23 abcde | 10.24 ± 0.54 ijkl | 19.06 ± 1.23 f | 17.41 ± 0.95 jk | 0.249 ± 0.02 abcd |
| 0.75 | 45 | 4 | 62.12 ± 3.00 ij | 7.99 ± 0.71 cd | 23.85 ± 1.17 klm | 18.18 ± 0.58 kl | 0.324 ± 0.02 hij |
| 0.75 | 45 | 8 | 61.59 ± 1.90 ghij | 8.30 ± 0.34 def | 23.37 ± 1.22 ijkl | 20.14 ± 0.88 m | 0.306 ± 0.01 fghi |
| 0.75 | 45 | 12 | 61.89 ± 2.02 hij | 8.12 ± 0.60 cde | 23.69 ± 0.90 jklm | 19.68 ± 1.65 lm | 0.288 ± 0.02 efg |
| 0.75 | 55 | 4 | 56.54 ± 1.51 abcdef | 9.57 ± 0.54 ghij | 16.90 ± 0.99 bcd | 9.27 ± 1.00 bc | 0.280 ± 0.02 cdefg |
| 0.75 | 55 | 8 | 54.87 ± 2.07 abc | 10.26 ± 0.24 ijkl | 15.97 ± 1.01 abc | 10.03 ± 1.35 c | 0.257 ± 0.01 abcde |
| 0.75 | 55 | 12 | 55.11 ± 1.25 abcd | 10.01 ± 0.64 hijk | 16.35 ± 1.03 abcd | 9.59 ± 1.25 bc | 0.244 ± 0.01 abc |
| 0.75 | 65 | 4 | 57.36 ± 1.22 bcdef | 9.06 ± 0.68 fgh | 21.66 ± 1.28 hi | 14.58 ± 0.63 efgh | 0.239 ± 0.01 ab |
| 0.75 | 65 | 8 | 56.63 ± 1.98 bcdef | 9.74 ± 0.43 ghij | 20.75 ± 0.63 gh | 15.75 ± 1.36 ghij | 0.231 ± 0.01 a |
| 0.75 | 65 | 12 | 56.93 ± 1.66 bcdef | 9.47 ± 0.35 ghi | 21.06 ± 0.83 gh | 15.33 ± 0.70 fghi | 0.226 ± 0.02 a |
| Parameter | df | L* | a* | b* | |||
|---|---|---|---|---|---|---|---|
| Mean Square | F Value | Mean Square | F Value | Mean Square | F Value | ||
| IR power | 2 | 71.59 | 21.67 ** | 24.92 | 94.97 ** | 50.88 | 53.76 ** |
| T | 2 | 259.93 | 78.70 ** | 58.76 | 223.97 ** | 342.66 | 362.02 ** |
| RD | 2 | 9.21 | 2.78 ns | 1.52 | 5.82 ** | 3.03 | 3.20 * |
| IR * T | 4 | 3.45 | 1.04 ns | 2.59 | 9.87 ** | 0.63 | 0.66 ns |
| IR * RD | 4 | 0.10 | 0.03 ns | 0.02 | 0.09 ns | 0.03 | 0.04 ns |
| T * RD | 4 | 0.82 | 0.25 ns | 0.04 | 0.18 ns | 0.13 | 0.14 ns |
| IR * T * RD | 8 | 0.06 | 0.02 ns | 0.01 | 0.04 ns | 0.01 | 0.02 ns |
| Error | 54 | 3.30 | 0.26 | 0.94 | |||
| Infrared Power (kW) | Drying Temperature (°C) | Rotary Rotation Speed (rpm) | Shrinkage (%) | RR |
|---|---|---|---|---|
| 0.25 | 45 | 4 | 18.56 ± 1.22 o | 1.87 ± 0.12 a |
| 0.25 | 45 | 8 | 16.99 ± 0.81 n | 2.05 ± 0.22 abc |
| 0.25 | 45 | 12 | 17.63 ± 0.73 no | 1.94 ± 0.11 ab |
| 0.25 | 55 | 4 | 9.69 ± 0.68 efg | 2.69 ± 0.12 ij |
| 0.25 | 55 | 8 | 6.59 ± 0.45 bc | 2.95 ± 0.15 kl |
| 0.25 | 55 | 12 | 8.45 ± 0.93 de | 2.81 ± 0.13 jk |
| 0.25 | 65 | 4 | 14.26 ± 1.41 kl | 2.24 ± 0.14 cdef |
| 0.25 | 65 | 8 | 12.57 ± 0.75 ij | 2.44 ± 0.18 fgh |
| 0.25 | 65 | 12 | 13.55 ± 1.02 jk | 2.32 ± 0.06 defg |
| 0.5 | 45 | 4 | 15.43 ± 0.79 lm | 2.08 ± 0.09 abc |
| 0.5 | 45 | 8 | 13.69 ± 1.21 jk | 2.38 ± 0.18 efg |
| 0.5 | 45 | 12 | 15.03 ± 1.04 klm | 2.22 ± 0.11 cdef |
| 0.5 | 55 | 4 | 6.63 ± 0.42 bc | 3.14 ± 0.13 lm |
| 0.5 | 55 | 8 | 4.51 ± 0.67 a | 3.55 ± 0.12 o |
| 0.5 | 55 | 12 | 5.12 ± 0.99 ab | 3.29 ± 0.15 mn |
| 0.5 | 65 | 4 | 10.45 ± 0.60 gh | 2.72 ± 0.16 ijk |
| 0.5 | 65 | 8 | 8.59 ± 0.69 def | 2.96 ± 0.08 kl |
| 0.5 | 65 | 12 | 9.63 ± 0.57 efg | 2.81 ± 0.13 jk |
| 0.75 | 45 | 4 | 17.11 ± 0.68 no | 2.01 ± 0.13 abc |
| 0.75 | 45 | 8 | 14.77 ± 0.38 kl | 2.18 ± 0.10 bcde |
| 0.75 | 45 | 12 | 16.30 ± 0.97 mn | 2.12 ± 0.09 bcd |
| 0.75 | 55 | 4 | 7.89 ± 0.89 cd | 2.94 ± 0.0.06 kl |
| 0.75 | 55 | 8 | 5.25 ± 0.78 ab | 3.38 ± 0.09 no |
| 0.75 | 55 | 12 | 6.23 ± 0.79 b | 3.11 ± 0.11 lm |
| 0.75 | 65 | 4 | 12.66 ± 0.70 ij | 2.51 ± 0.13 ghi |
| 0.75 | 65 | 8 | 10.01 ± 0.91 fgh | 2.73 ± 0.08 ijk |
| 0.75 | 65 | 12 | 11.33 ± 0.45 hi | 2.62 ± 0.17 hij |
| Parameter | Number of Hidden Layer (s) | Threshold Function | Topology | MSE | R (Training) | R (Testing) | Training Epoch |
|---|---|---|---|---|---|---|---|
| Time | 1 | Tan-Tan | 3-15-1 | 0.00031 | 0.9938 | 0.9868 | 11 |
| 1 | Log-Tan | 3-10-1 | 0.00036 | 0.9910 | 0.9586 | 9 | |
| 1 | Log-Tan | 3-18-1 | 0.00039 | 0.9856 | 0.9505 | 9 | |
| 1 | Tan-Pur | 3-13-1 | 0.00032 | 0.9877 | 0.9836 | 8 | |
| 2 | Tan-Log-Tan | 3-15-13-1 | 0.00037 | 0.9895 | 0.9752 | 23 | |
| 2 | Tan-Pur-Tan | 3-18-16-1 | 0.00032 | 0.9935 | 0.9756 | 12 | |
| 2 | Log-Tan-Tan | 3-12-12-1 | 0.00043 | 0.9849 | 0.9408 | 10 | |
| 2 | Log-Tan-Pur | 3-9-9-1 | 0.00042 | 0.9891 | 0.9488 | 7 | |
| S.E.C | 1 | Tan-Tan | 3-13-1 | 0.00090 | 0.9845 | 0.9468 | 8 |
| 1 | Log-Tan | 3-16-1 | 0.00093 | 0.9836 | 0.9521 | 9 | |
| 1 | Log-Pur | 3-8-1 | 0.00096 | 0.9901 | 0.9447 | 11 | |
| 1 | Tan-Tan | 3-20-1 | 0.00098 | 0.9795 | 0.9865 | 15 | |
| 2 | Tan-Tan-Pur | 3-10-10-1 | 0.00086 | 0.9846 | 0.9766 | 7 | |
| 2 | Tan-Log-Pur | 3-7-6-1 | 0.00089 | 0.9715 | 0.9792 | 13 | |
| 2 | Pur-Tan-Tan | 3-15-14-1 | 0.00083 | 0.9906 | 0.9847 | 10 | |
| 2 | Tan-Tan-Tan | 3-9-9-1 | 0.00094 | 0.9456 | 0.9854 | 10 | |
| Energy efficiency | 1 | Tan-Tan | 3-8-1 | 0.00059 | 0.9890 | 0.9801 | 11 |
| 1 | Log-Tan | 3-12-1 | 0.00057 | 0.9957 | 0.9798 | 8 | |
| 1 | Log-Pur | 3-16-1 | 0.00056 | 0.9965 | 0.9815 | 6 | |
| 1 | Tan-Pur | 3-15-1 | 0.00064 | 0.9840 | 0.9488 | 7 | |
| 2 | Tan-Tan-Tan | 3-15-10-1 | 0.00057 | 0.9963 | 0.9808 | 11 | |
| 2 | Tan-Tan-Log | 3-6-5-1 | 0.00062 | 0.9868 | 0.9624 | 17 | |
| 2 | Log-Tan-Tan | 3-10-10-1 | 0.00060 | 0.9905 | 0.9756 | 15 | |
| 2 | Tan-Log-Tan | 3-20-20-1 | 0.00063 | 0.9891 | 0.9763 | 9 | |
| Thermal efficiency | 1 | Tan-Tan | 3-13-1 | 0.00079 | 0.9874 | 0.9890 | 17 |
| 1 | Log-Tan | 3-11-1 | 0.00082 | 0.9859 | 0.9860 | 8 | |
| 1 | Tan-Tan | 3-17-1 | 0.00089 | 0.9721 | 0.9678 | 9 | |
| 1 | Tan-Log | 3-8-1 | 0.00090 | 0.9702 | 0.9756 | 13 | |
| 2 | Tan-Log-Tan | 3-18-15-1 | 0.00081 | 0.9864 | 0.9840 | 8 | |
| 2 | Log-Tan-Pur | 3-10-9-1 | 0.00080 | 0.9858 | 0.9510 | 8 | |
| 2 | Log-Tan-Tan | 3-15-15-1 | 0.00084 | 0.9848 | 0.9838 | 10 | |
| 2 | Tan-Tan-Tan | 3-12-12-1 | 0.00091 | 0.9611 | 0.9723 | 14 | |
| Exergy efficiency | 1 | Tan-Tan | 3-20-1 | 0.00085 | 0.9893 | 0.9869 | 11 |
| 1 | Log-Tan | 3-11-1 | 0.00086 | 0.9866 | 0.9852 | 8 | |
| 1 | Log-Pur | 3-7-1 | 0.00089 | 0.9653 | 0.9811 | 13 | |
| 1 | Tan-Tan | 3-14-1 | 0.00092 | 0.9711 | 0.9536 | 9 | |
| 2 | Tan-Log-Tan | 3-18-14-1 | 0.00086 | 0.9832 | 0.9799 | 8 | |
| 2 | Log-Tan-Pur | 3-20-18-1 | 0.00092 | 0.9563 | 0.9611 | 5 | |
| 2 | Tan-Tan-Pur | 3-8-8-1 | 0.00091 | 0.9696 | 0.9468 | 11 | |
| 2 | Tan-Tan-Tan | 3-6-5-1 | 0.00088 | 0.9769 | 0.9699 | 13 |
Disclaimer/Publisher’s Note: The statements, opinions and data contained in all publications are solely those of the individual author(s) and contributor(s) and not of MDPI and/or the editor(s). MDPI and/or the editor(s) disclaim responsibility for any injury to people or property resulting from any ideas, methods, instructions or products referred to in the content. |
© 2025 by the authors. Licensee MDPI, Basel, Switzerland. This article is an open access article distributed under the terms and conditions of the Creative Commons Attribution (CC BY) license (https://creativecommons.org/licenses/by/4.0/).
Share and Cite
Abbaspour-Gilandeh, Y.; Zadhossein, S.; Kaveh, M.; Szymanek, M.; Hassannejad, S.; Wojciechowska, K. Drying Time, Energy and Exergy Efficiency Prediction of Corn (Zea mays L.) at a Convective-Infrared-Rotary Dryer: Approach by an Artificial Neural Network. Energies 2025, 18, 696. https://doi.org/10.3390/en18030696
Abbaspour-Gilandeh Y, Zadhossein S, Kaveh M, Szymanek M, Hassannejad S, Wojciechowska K. Drying Time, Energy and Exergy Efficiency Prediction of Corn (Zea mays L.) at a Convective-Infrared-Rotary Dryer: Approach by an Artificial Neural Network. Energies. 2025; 18(3):696. https://doi.org/10.3390/en18030696
Chicago/Turabian StyleAbbaspour-Gilandeh, Yousef, Safoura Zadhossein, Mohammad Kaveh, Mariusz Szymanek, Sahar Hassannejad, and Krystyna Wojciechowska. 2025. "Drying Time, Energy and Exergy Efficiency Prediction of Corn (Zea mays L.) at a Convective-Infrared-Rotary Dryer: Approach by an Artificial Neural Network" Energies 18, no. 3: 696. https://doi.org/10.3390/en18030696
APA StyleAbbaspour-Gilandeh, Y., Zadhossein, S., Kaveh, M., Szymanek, M., Hassannejad, S., & Wojciechowska, K. (2025). Drying Time, Energy and Exergy Efficiency Prediction of Corn (Zea mays L.) at a Convective-Infrared-Rotary Dryer: Approach by an Artificial Neural Network. Energies, 18(3), 696. https://doi.org/10.3390/en18030696