Article

The Influence of Electrode Shape on the Electric and Temperature Fields in an Immersed High-Voltage Electrode Boiler

1
Shanxi Key Laboratory of Mining Electrical Equipment and Intelligent Control, Taiyuan University of Technology, Taiyuan 030024, China
2
Shanxi Provincial Key Laboratory of High-Efficiency Heat Storage and Low-Carbon Heating, Taiyuan Boiler Group Co., Ltd., Taiyuan 030008, China
3
State Grid Tianjin Baodi Power Supply Company, Tianjin 301800, China
*
Authors to whom correspondence should be addressed.
Energies 2025, 18(4), 825; https://doi.org/10.3390/en18040825
Submission received: 10 January 2025 / Revised: 1 February 2025 / Accepted: 9 February 2025 / Published: 11 February 2025
(This article belongs to the Section F3: Power Electronics)

Abstract

:
The electric and temperature fields formed in the furnace water system by electrodes of different shapes differ to some extent when the immersed high-voltage electrode boiler is in operation. To obtain the distribution of electric and temperature fields in the furnace water when different shapes of electrodes are used in a high-voltage electrode boiler, simulation models of spherical electrodes, planar electrodes, and tangential electrodes are established, respectively. The effects of the electrode structure on the electric and temperature fields in the furnace water were investigated. The simulation results show that the electric field distribution and temperature field distribution of the spherical electrode in the furnace water are the best among the three electrode structures. Meanwhile, in order to verify the accuracy of the adopted simulation method, simulation and temperature rise tests were carried out on a small spherical electrode model under 400 V AC, and the simulation calculation results and the temperature rise test results at special points were compared. The difference between the simulation and test results is less than 3%, which proves the reasonableness of the method. The method can be used as a reference for the design of electrodes for immersed high-voltage electrode boilers, as well as the analysis of electric and temperature fields around the electrodes.

1. Introduction

In recent years, with the rapid development of renewable energy generation, such as wind and light, its installed capacity has been increasing [1,2]. The phenomenon of excess electricity has appeared in some provinces and regions of China [3,4,5]. According to the data of the National Energy Administration, in the first half of 2022, the average utilization rate of national wind power was 95.8%, the abandoned wind rate reached 4.2%, the utilization rate of national photovoltaic power generation was 97.7%, and the abandoned light rate reached 2.3% [6]. To solve the problem of excess electric energy consumption, the electricity-to-heat system represented by a high-voltage electrode heat storage boiler has been used for a wide range of applications in various industries [7,8,9]. A high-voltage electrode boiler (HVEB) is an effective means of realizing the full utilization of electric power, wind power consumption, and environmental pollution control because of its high efficiency, no noise, environmental protection and non-pollution, small footprint, and fast start-up speed [10]. HVEB application can not only improve the utilization rate of energy but also meet the needs of energy conservation and emission reduction, which will help China to realize the two goals of “carbon peak, carbon neutral” as soon as possible.
HVEBs can be categorized into jet-type HVEBs and immersed-type HVEBs according to their different structures and working principles [11]. Compared with jet HVEBs, the circulating water requirements of immersed HVEBs are lower, and there are no special requirements for three-phase power supply; operation and maintenance are also relatively simple [11,12,13,14]. Jet HVEBs in Europe have encountered deflagration accidents, so they have been banned in Europe, and only in some parts of North America are they used. Currently, most of the HVEBs used in China are also immersed HVEBs.
The electrode is the core component of an immersed HVEB. However, the current research for immersed HVEBs mainly focuses on energy consumption and application, and there are fewer studies on electrode shape design. The work in [15] investigated the change in electric field around the electrode subjected to loss and the electrode not subjected to loss through simulation and proposed improvement measures for the reduction in thermal efficiency caused by the electrode subjected to loss, but it lacked research into the design aspect of the shape of the electrodes. The work in [16] explained the reason why the electrode stick is designed in the shape of a field hockey stick and concluded that the hockey stick-shaped electrode could make the furnace water in the inner cylinder move up and down in a spiral motion during operation, which is conducive to improving the heating efficiency, but it was found that the electrode shape designed in this paper can also realize this function. The work in [17,18] studied the corrosion process of different electrode materials in electrolyte solution and concluded that the titanium electrode had a good corrosion resistance. It has been shown that the electrode structure is closely related to the performance of immersed HVEBs. The work in [19,20] investigated the effect of different voltage parameter variations on the electric field distribution and found a law of unbalanced three-phase voltage distribution on the electric field distribution. However, there is still a lack of systematic research on the electric fields and temperature fields in the furnace water under different electrode shapes, so it is necessary to carry out related research.
To address the above problems, this paper investigates the electric field and temperature field distribution of furnace water when the bottom end of the electrode is spherical, planar, and sectional, respectively; compares the electric field inhomogeneity coefficients, current densities, and temperature variations in the furnace water under the three electrode structures; and determines the form of the electrode structure that has a uniform distribution of the electric field and a high heating efficiency. The effectiveness and accuracy of the finite element simulation method are verified by comparing the simulation of the equal scale-reduced spherical electrode with the temperature rise experiment, which provides a reference for the electrode shape design of the immersed HVEB.

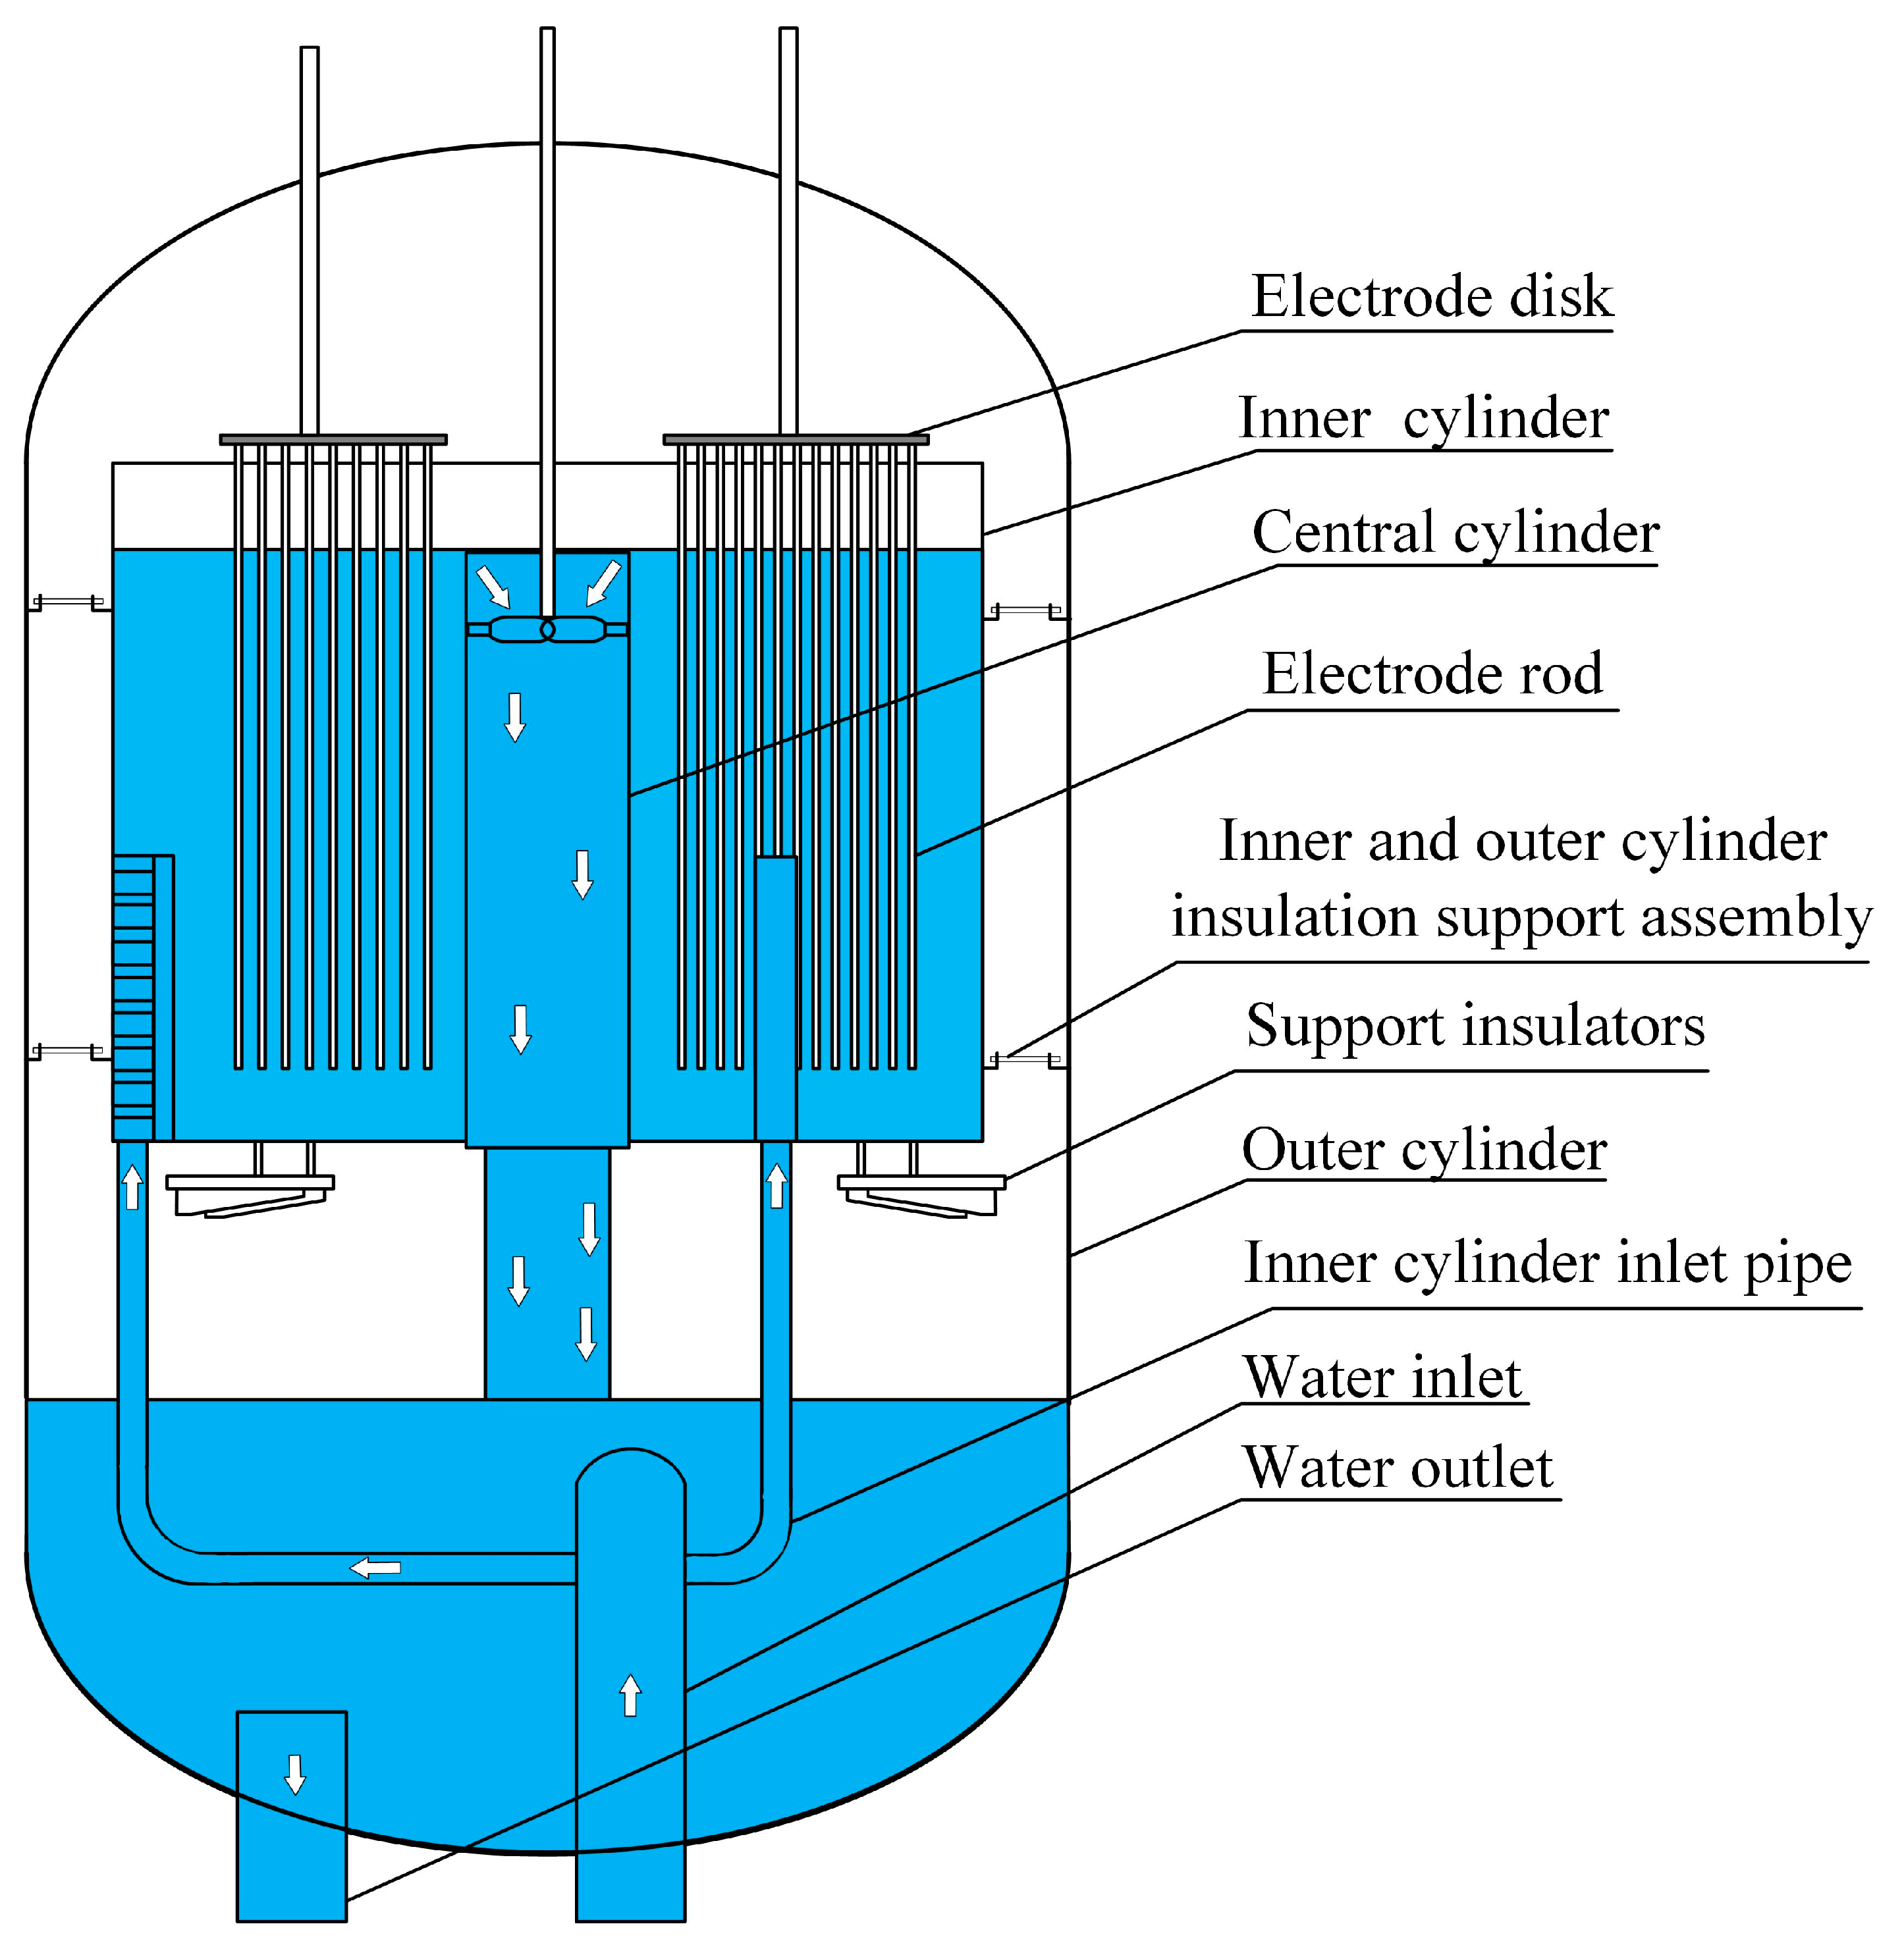
2. Principle of Immersed HVEB

Figure 1 shows the structural principle of the immersed HVEB, which mainly consists of the inner cylinder, outer cylinder, center cylinder, high-voltage electrodes, insulating components, circulating circuits of inner and outer cylinders, and pipelines [20,21,22,23]. Nitrogen is used as an insulating gas between the inner and outer cylinders to regulate the boiler’s internal pressure. The furnace water is a conductive solution to which trisodium phosphate is added and adjusted to a certain conductivity [20].
The basic working principle of the immersed HVEB is that the furnace water is rapidly heated by the current flowing through the electrodes under the action of 10 kV AC voltage. At the same time, the height of the center cylinder can be adjusted according to the load demand, i.e., the depth of the three-phase electrodes immersed in the furnace water can be changed to realize the heating of furnace water of different capacities.
The 3D model was created using Solidworks 2022 software, and the simulation was performed using the current module of COMSOL Multiphysics 6.0 simulation software, and the solid and fluid heat transfer modules.
The high-voltage electrodes in the inner cylinder were of three-phase hexapole type. Each phase of the three electrode models consists of an electrode disk, 2 high-voltage electrodes, and 29 electrode rods. The different phases are distributed at 120° from each other. The electrode rods are uniformly and symmetrically distributed on the electrode disk. The three constructed three-phase electrode structures are shown in Figure 2. The three three-phase electrode structures have different shapes of the bottom ends of the electrode rods, which are spherical, planar, and 45° sections, respectively. The spherical electrode allows the bottom end of the electrode rod not to form a tip region and reduces the curvature of the bottom end of the electrode. The planar shape served as a control group. The sectional electrode reduces scale buildup, improves heat transfer efficiency, and can make the output power of the immersed high-voltage electrode boiler easier to control.
The radius of the high-voltage electrode is 0.05 m, and the length is 0.8 m. The radius of the electrode rods of the three electrode structures is 0.025 m, and the length of the electrode rods of the spherical electrode and the planar electrode is 1.3 m, as shown in Figure 2a,b; the sectional electrode is cut by a 45° section, and the outer electrode is long, and the inner electrode is short, as shown in Figure 2c. The inner radius of the electrode disk is 0.35 m, the outer radius is 0.8 m, and the thickness is 0.01 m. The inner cylinder has a radius of 0.9 m, a height of 1.5 m, and a wall thickness of 0.01 m. The center cylinder has a radius of 0.25 m, a wall thickness of 0.005 m, and a height of 1.4 m. The furnace water has an inner radius of 0.25 m, an outer radius of 0.9 m, and a height of 1.39 m.

2.1. Boundary Condition Setting

After importing the 3D model into COMSOL, the parameters of each part of the model are set according to the material properties shown in Table 1. A 10 kV three-phase AC voltage with a frequency of 50 Hz is introduced into the boiler operation, and its expression is shown in Table 2. The solver is set as a transient solver, and the simulation step size is set to 0.001 s; the electric field simulation results are selected as the state at 0.02 s, and the temperature field simulation results are selected as the state at 2 s. The simulation results of the electric field are selected as the state at 0.02 s, and the temperature field simulation results are selected as the state at 2 s.

2.2. Simulation Equations for Electric and Temperature Fields

The electric field simulation satisfies the charge conservation Equations (1)–(3):
J = ρ t
J = σ E + J e
E = φ
In the formula, ∇ is the vector differential operator; J is the current density, A/m2; ρ is the charge density, C/m3; σ is the conductivity, S/m; E is the electric field strength, V/m; Je is the externally injected current density, A/m2; φ is the applied voltage, V.
The temperature field simulation satisfies the heat transfer Equations (4) and (5):
ρ C p T t + ρ C p u T + q = Q
q = k T
In the formula, ρ is the density, kg/m3; Cp is the constant pressure heat capacity, J/K; u is the velocity field parameter, m/s; k is the thermal conductivity; Q is the heat source, W; and q is the conduction heat flux vector, W/m2.

2.3. Division of the Grid

When meshing the model consisting of the inner cylinder, electrodes, and furnace water, different mesh qualities need to be used for different regions to make the simulation results more accurate, so local mesh qualities are encrypted for the portion of the three electrodes submerged in the furnace water. The remaining part of the model is meshed with a regular-size grid to reduce the number of meshes and improve the computational speed. The minimum cell mass of the grid divided by the 3D model is 0.005006, the average cell mass is 0.6573, the cell volume ratio is 7.921 × 10⁻⁷, and the grid volume is 3.46 m3.

3. Analysis and Discussion of Electric Field Simulation Results

3.1. Electric Field Distribution for Different Electrode Structures

The transverse and longitudinal cross-sections are selected to be analyzed in the simulation results, respectively. The location of the transverse cross-section is shown in Figure 3a, with the xy plane as the reference, the starting point is z = −0.25 m, and four electric field cross-sections are gradually taken in the opposite direction of the z-axis at a certain distance. The longitudinal section is based on the xz plane, with the starting point at y = −0.80 m, and four electric field sections are gradually taken in the positive direction of the y-axis at certain intervals, as shown in Figure 3b.

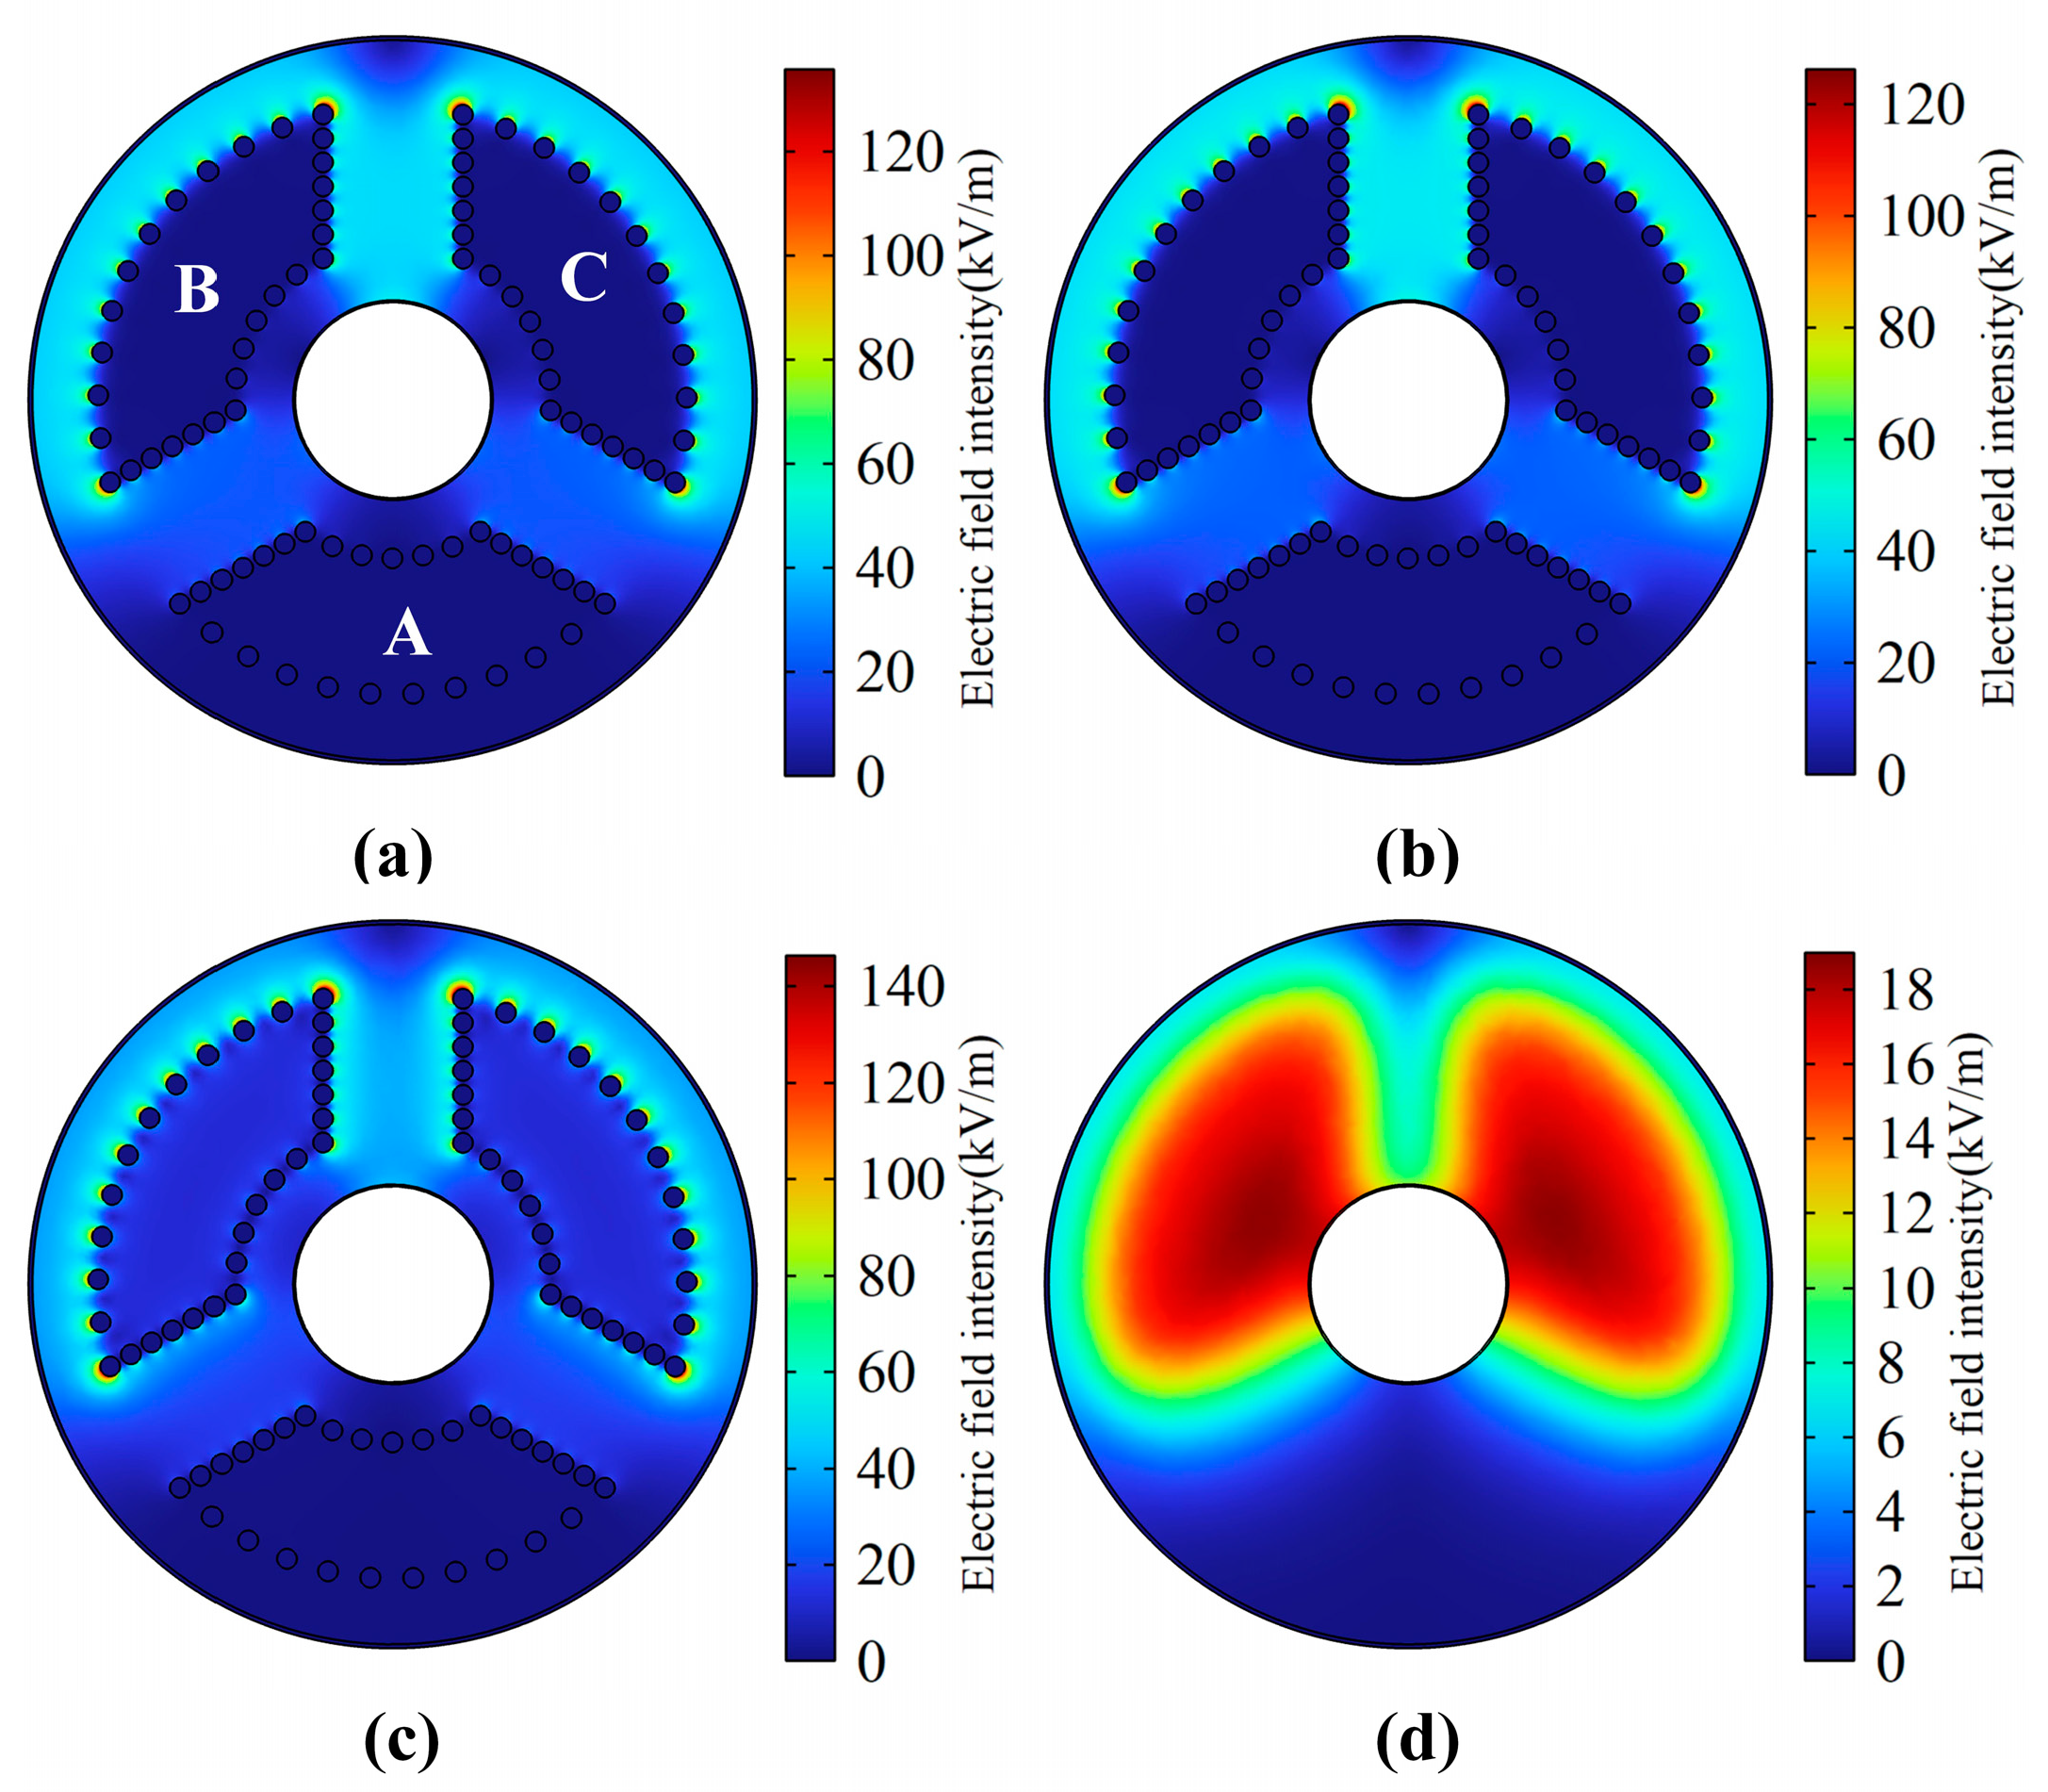
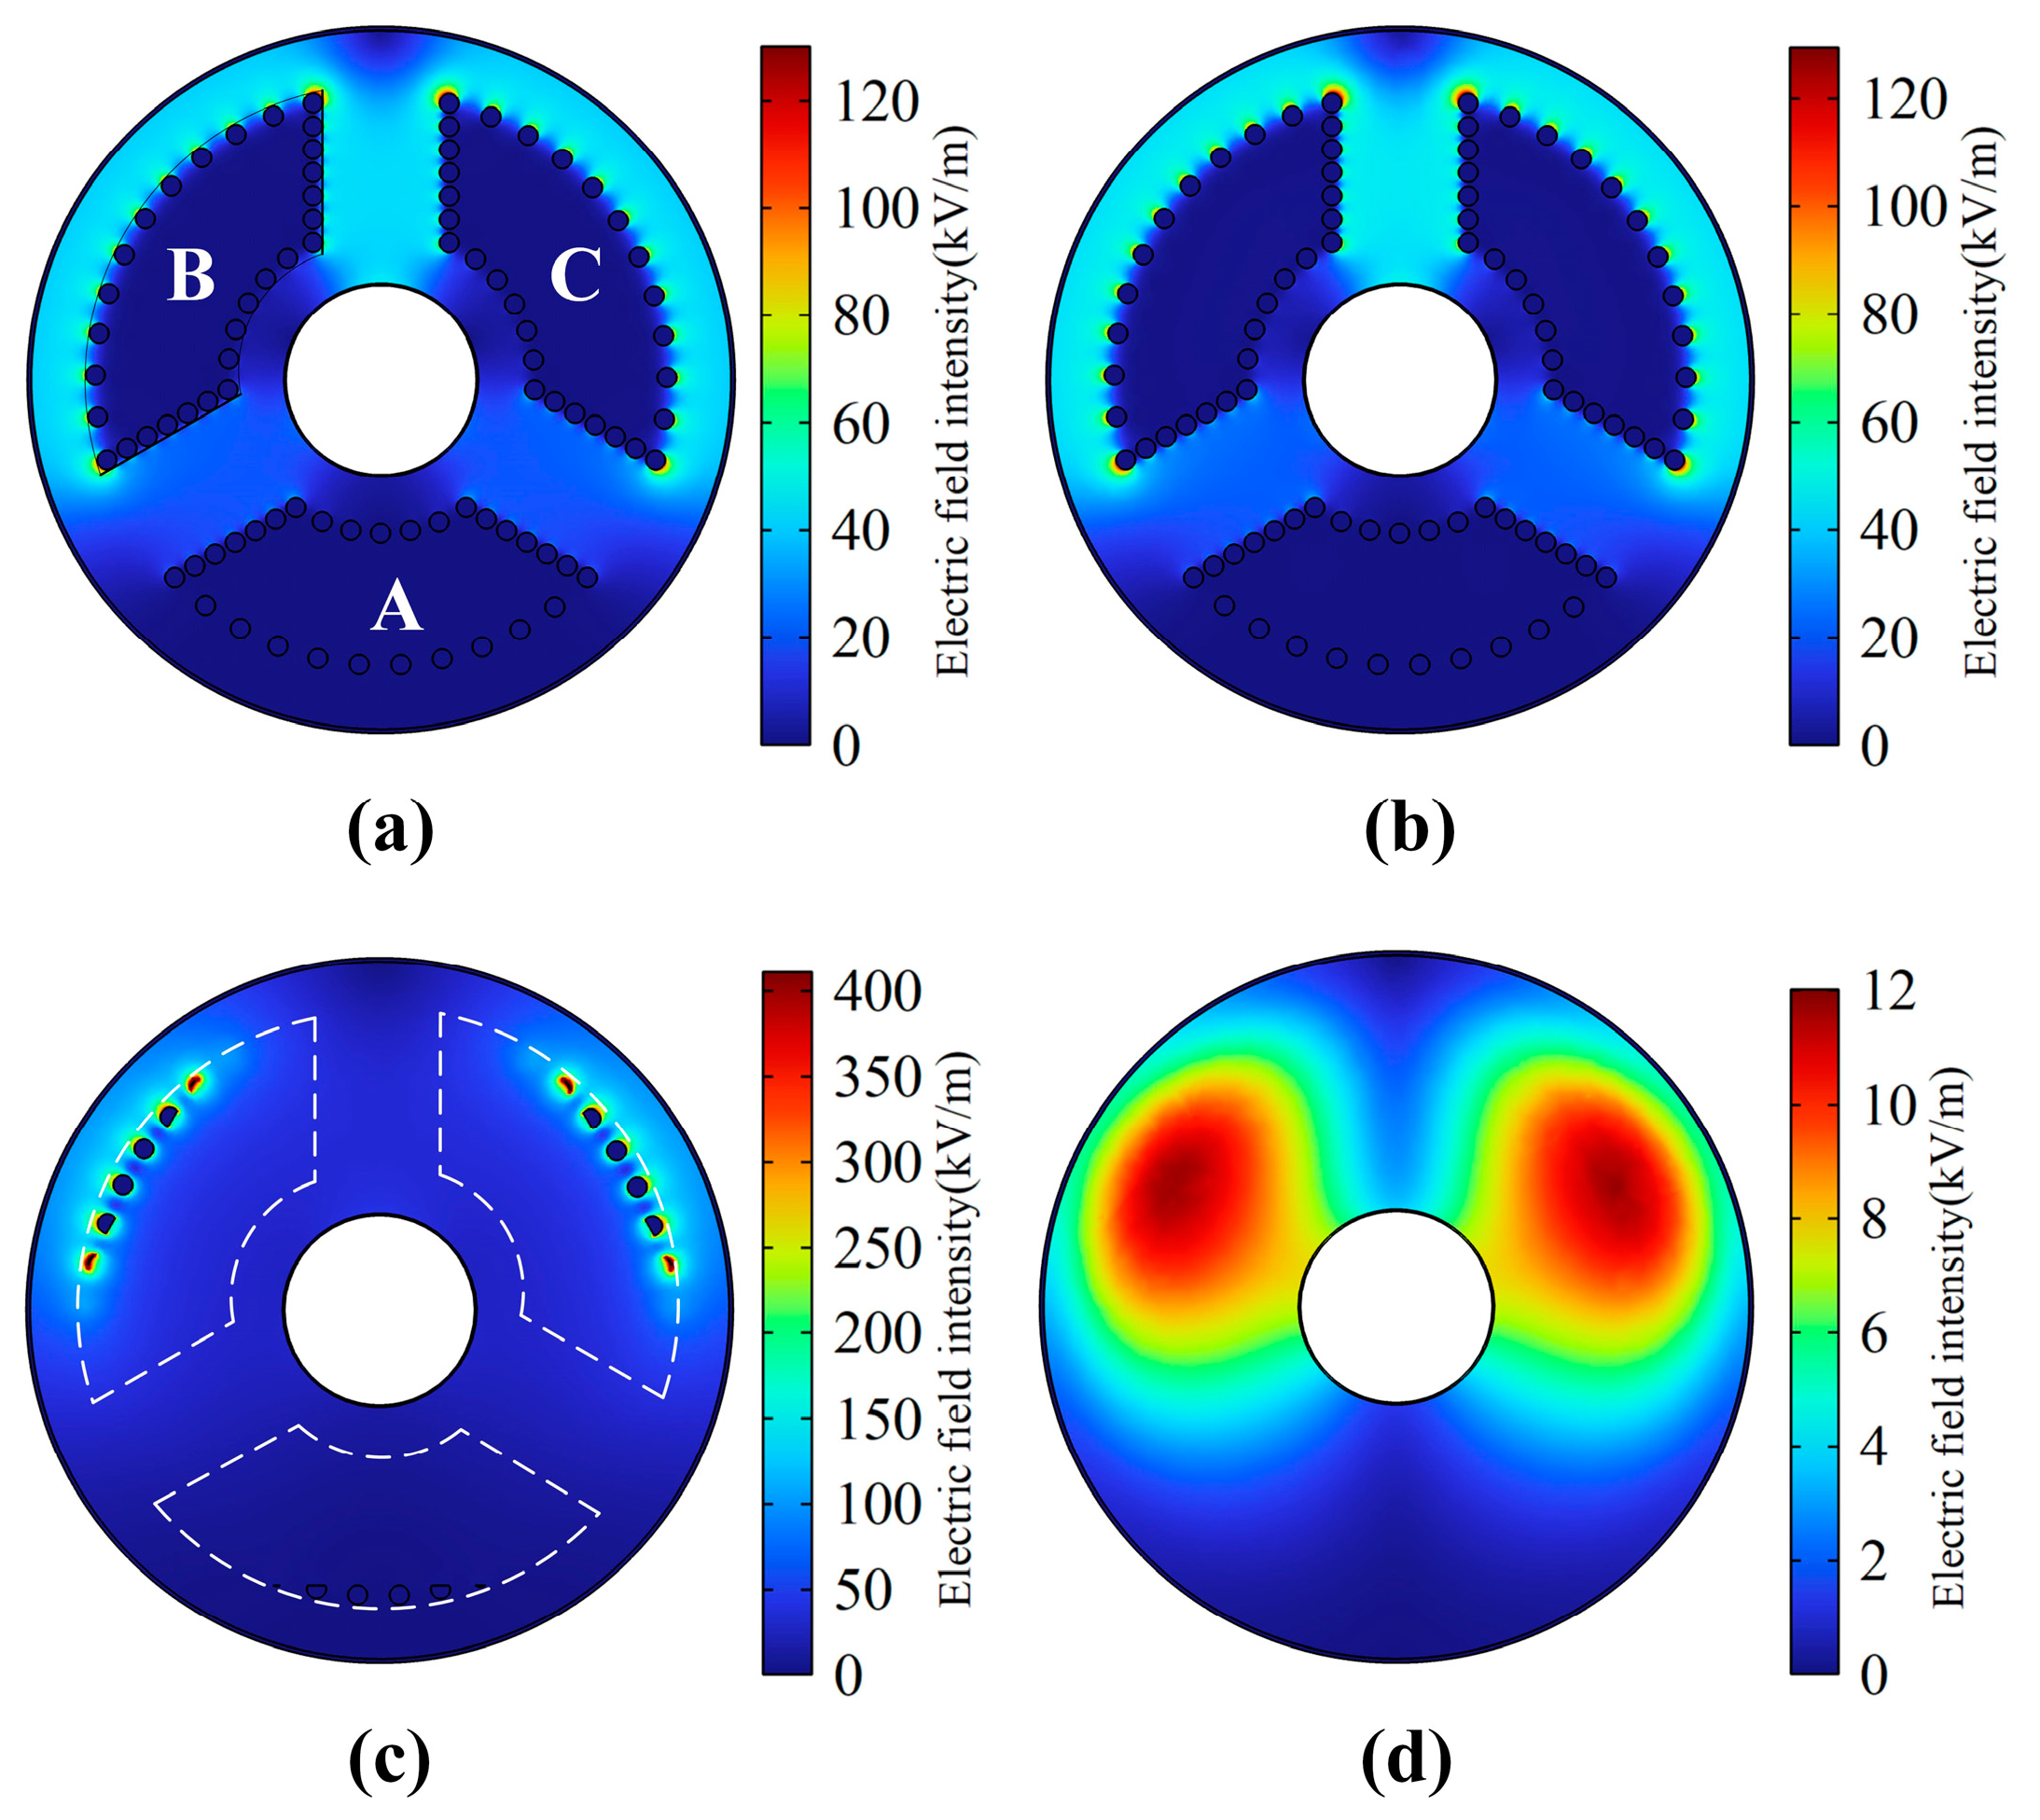
3.1.1. Cross-Sectional Electric Field Distribution

Figure 4, Figure 5 and Figure 6 shows the electric field distributions of the three electrode structures in the transverse cross-section at different positions at 0.02 s, respectively. Stronger electric field distribution regions were formed between the three-phase electrode rods, and between the electrode rods and the inner cylinder (including the sidewall and bottom of the inner cylinder). As shown in Figure 4a–c, when the spherical electrode structure electrode rods are all present, the maximum E-field strengths of the three cross-sections are 135.7 kV/m, 126.2 kV/m, and 146.3 kV/m, respectively. With the change in the cross-section position, the maximum E-field strengths of the cross-sections fluctuate within a certain range to a lesser extent. When the cross-section position is taken to the position shown in Figure 4d, the coordinates of the cross-section are z = −1.50 m, the length of the electrode rod of the spherical electrode is 1.3 m, the cross-section is taken to a position 0.2 m away from the bottom end of the electrode rod, and the maximum electric field strength of the cross-section is 18.97 kV/m, which decreases by large amplitude, and the area in which the cross-section is located is a weak-field strong area. The electric field distribution of the planar electrode at each cross-section is shown in Figure 5a–d. The length of the electrode rod of the planar electrode structure and the spherical electrode structure are equal, and the maximum field strengths of the four cross-sections are 127.8 kV/m, 126.1 kV/m, 141.5 kV/m, and 19.67 kV/m, respectively, so that the distribution of electric field at each cross-section is also similar to that of the spherical electrode at the same cross-sectional position, and the difference in the values of maximum electric field strengths of the same cross-section at the same location is also smaller. As shown in Figure 6a,b, when the electrode rods in the cross-section of the sectional electrode structure are all present, the maximum field strengths in the cross-section are 130.0 kV/m and 129.4 kV/m, respectively, and their electric field distributions and the magnitude of the electric field strengths are similar to those of the planar electrode model and the spherical electrode model at the same cross-section at the same position. However, in the sectional electrode structure, the electric field distribution near the bottom of the electrode rod will change significantly because of the different lengths of the electrode rods. Figure 6c,d show the transverse cross-sections of the sectional electrode structure at the cross-section positions of z = −1.25 m and z = −1.50 m, respectively, and the area framed by the white dashed line in Figure 6c are the three-phase electrode projections of the sectional electrode in this cross-section, and the maximum field strengths of the cross-section are 410.9 kV/m and 12.01 kV/m, respectively. The length of the shortest electrode rod in the sectional electrode structure is 0.65 m, and the length of the longest electrode rod is 1.30 m. Therefore, as the position of the cross-section varies from −0.65 m to −1.30 m, the field strengths of the electrodes in the cross-section increase with the change in the electrode position in the cross-section. The maximum value of the cross-section E-field strength gradually becomes smaller as the number of electrode rods in the cross-section decreases, and the E-field strength is high at the position where only electrode rods are present. Although the overall distribution of the electric field for all three shapes of electrode structures after the cross-section position below −1.30 m shows a butterfly-wing distribution, the maximum value of the electric field strength for the cut-section electrode structure is smaller than that of the other two electrode structures, and the corresponding area of the high-field-strength distribution region is also smaller.

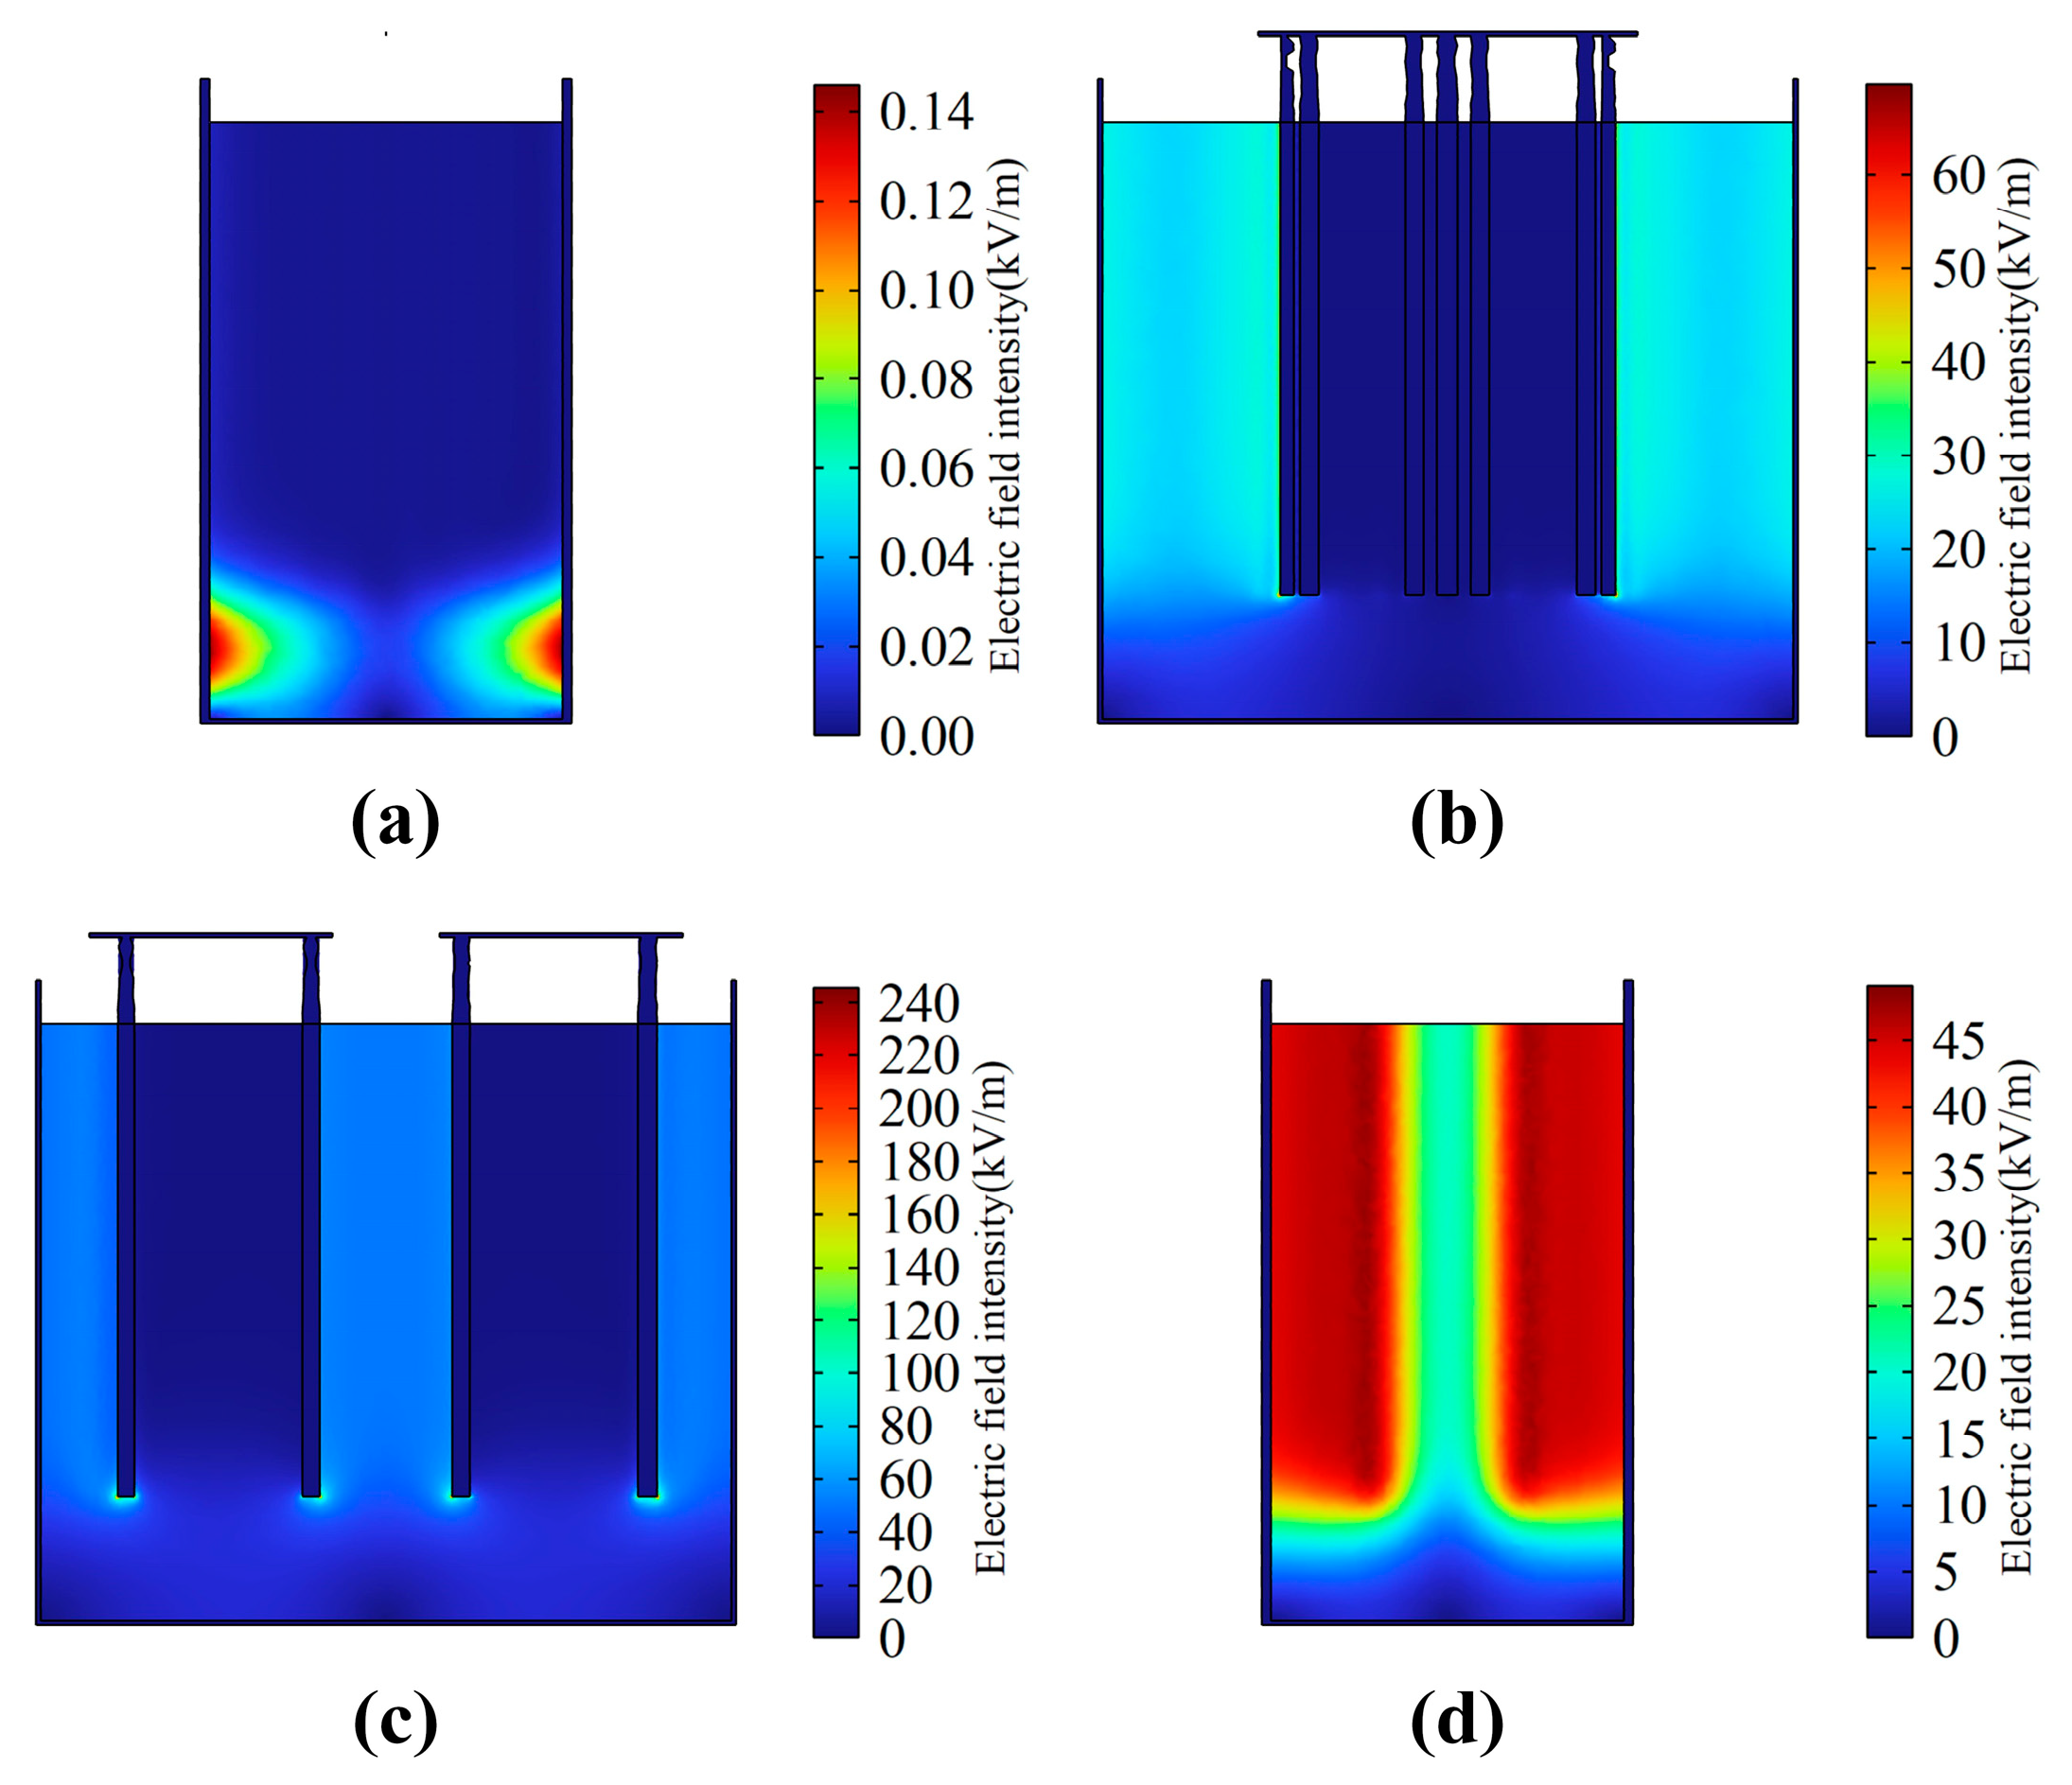
3.1.2. Longitudinal Cross-Section Electric Field Distribution

Figure 7, Figure 8 and Figure 9 show the electric field distribution in different longitudinal sections of the three electrode structures at 0.02 s, respectively. Figure 7a,b show the electric field distribution between the A-phase electrode of the spherical electrode structure and the inner cylinder, and it can be seen that the electric field intensity at a point on the bottom end of the electrode rod is larger than that in the other regions; the maximum electric field intensity of the cross-section is 0.1495 kV/m and 37.27 kV/m, respectively; and the stronger electric field region is between the electrode rod and the inner cylinder wall. Figure 7c,d show the electric field distribution between the phase B and C electrodes of the spherical electrode structure and the inner cylinder; the maximum electric field strength is still at a point at the bottom end of the electrode rod; the cross-sectional maximum electric field strengths are 155.7 kV/m and 47.80 kV/m, respectively; and a stronger electric field region is formed between the phase B and C electrodes and the inner cylinder wall. The electric field distribution of the planar electrode structure in four longitudinal sections is shown in Figure 8a–d. Since the length of the electrode rods of the planar electrode structure and the spherical electrode structure are equal, the electric field distribution region of each section at the same position is similar, but the maximum electric field strength of each section is different. The maximum electric field strengths in the four longitudinal sections are 0.1459 kV/m, 69.56 kV/m, 245.5 kV/m, and 49.08 kV/m, respectively. The electric field distribution between the phase A electrode of the planar electrode structure and the inner cylinder is shown in Figure 9a,b. As shown in Figure 9a, when the cross-section position is y = −0.80 m, the electric field intensity near the bottom end of the electrode rod is larger than that of the spherical electrode structure, and the planar electrode structure in the cross-sectional electrode structure, and the maximum electric field intensity is 0.4290 kV/m in this cross-section, which creates a strong electric field region larger than that of the other two electrode structures. As shown in Figure 9b, at the cross-section position of y = −0.40 m, the length of the electrode rod of the sectional electrode structure is smaller than that of the electrode rod of the spherical electrode structure, and the planar electrode structure in the cross-section at the same position; the maximum E-field intensity also appears at the bottom end of the electrode rod; the maximum E-field intensity of the cross-section is 66.57 kV/m; and the formed region of strong E-field intensity is smaller than that of the remaining two shapes of electrode structure. As shown in Figure 9c,d, the maximum electric field strengths of the two cross-sections are 238.4 kV/m and 47.90 kV/m, respectively, and the strong field strength region formed between the electrodes of the two phases B and C in the cross-section is smaller than the remaining two shapes of electrode structures because of the short length of the electrode rod.

3.2. Electric Field Inhomogeneity Coefficient

To grasp the overall electric field uniformity of the three electrode models at different moments, the maximum and average values of the electric field strengths were extracted from the three electrode models by setting a step size of 0.001 s during the simulation time of 0~0.02 s. The overall electric field inhomogeneity coefficients of the furnace water under the three electrode structures were calculated, as shown in Figure 10.
It can be seen that the uneven coefficients of the electric field of furnace water of the three electrode structures undergo periodic changes. The value of the electric field inhomogeneity coefficient of the furnace water of the sectional electrode structure is the largest at any moment, and the range of fluctuation within a cycle is also the largest, while the electric field inhomogeneity coefficient of the furnace water of the spherical electrode structure is smaller and fluctuates within a small range. The electric field inhomogeneity will lead to different regions of the furnace water at different locations being subject to different electric field strength effects, resulting in different heating effects. If the electric field inhomogeneity coefficient is very high, the uniformity of the heating of the furnace water will deteriorate, i.e., some areas may be overheated, while other areas may be underheated. It can be seen that, compared with the other two electrode structures, the electric field around the spherical electrode structure is more uniform, i.e., it causes a low degree of electric field distortion, which is conducive to the uniform heating of the furnace water.

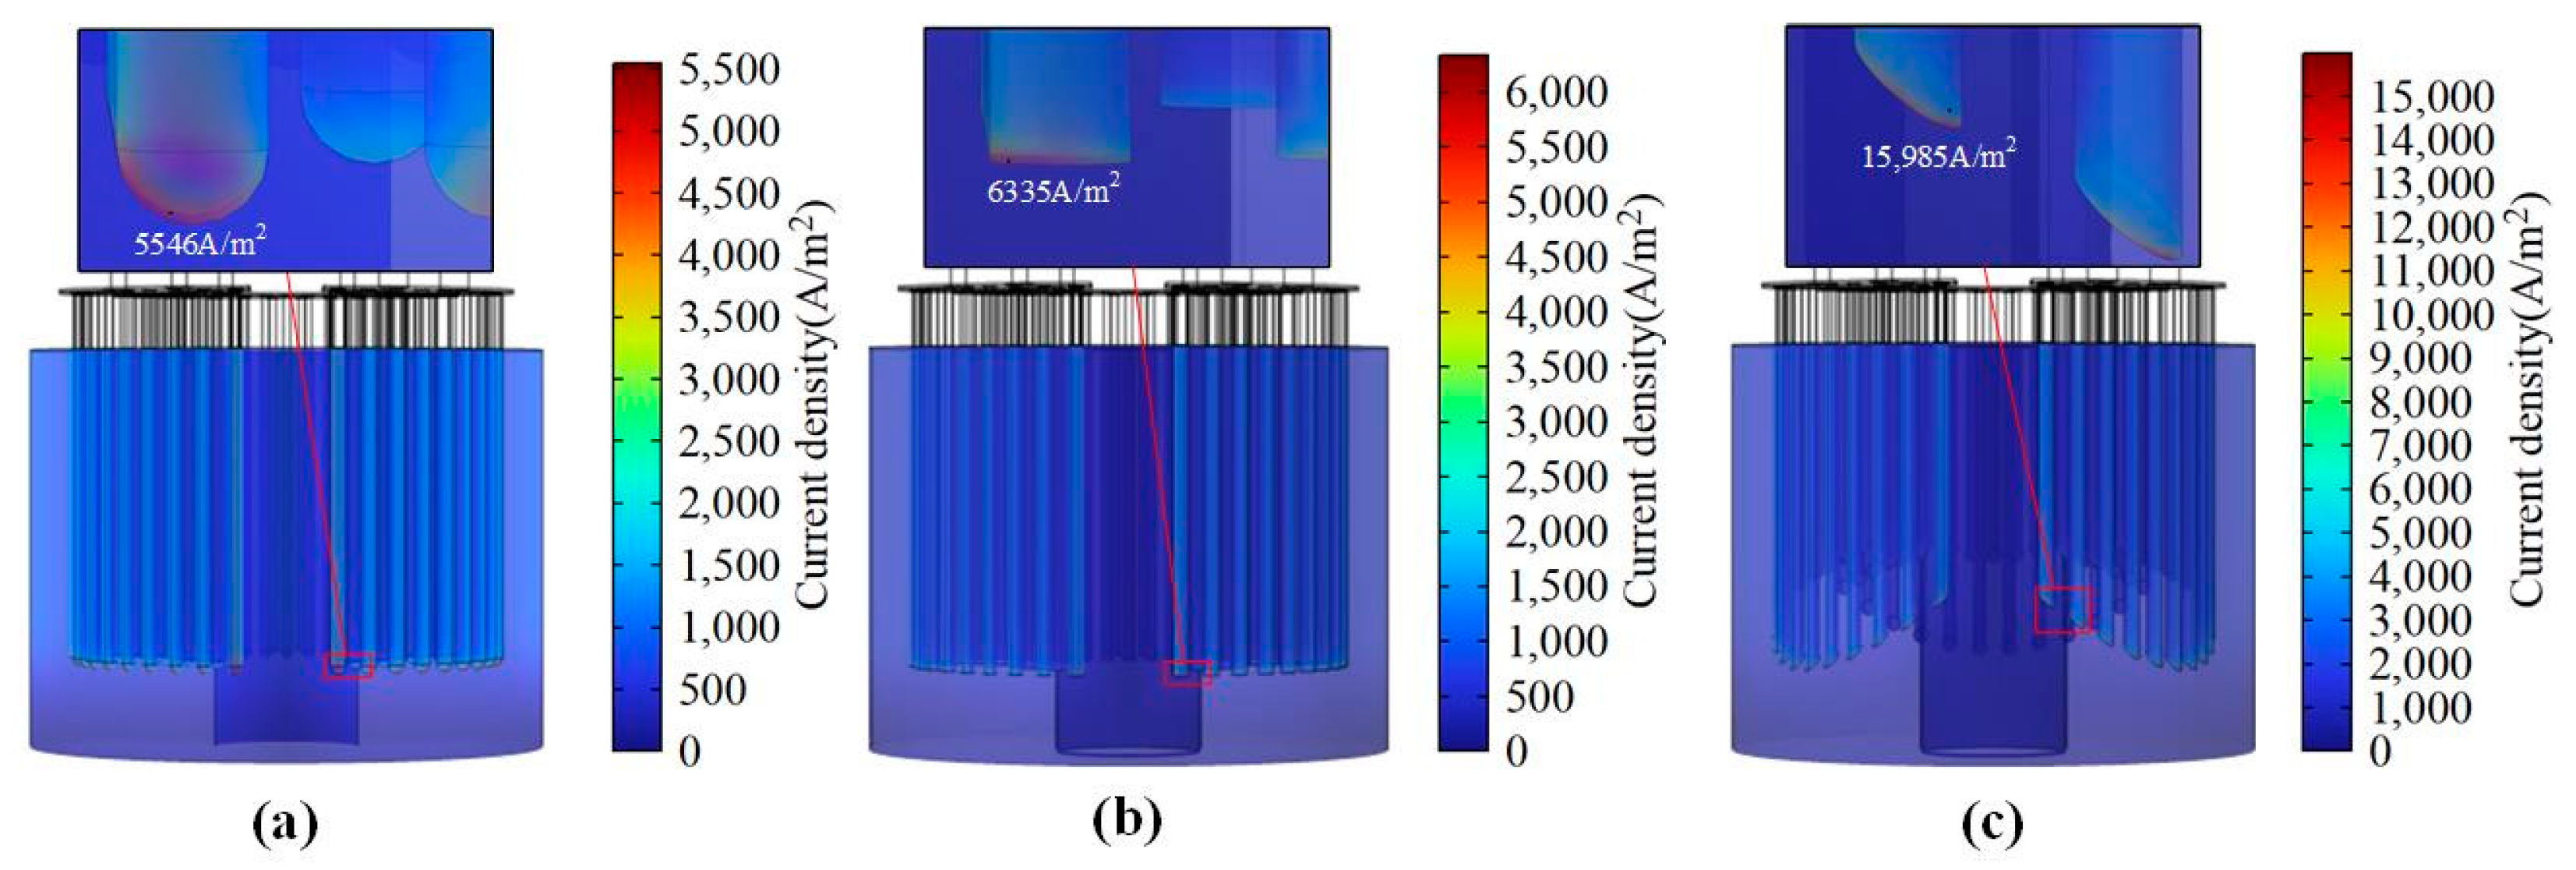
3.3. Current Density

From Equation (2), it can be seen that the current density is proportional to the electric field strength, and the higher the electric field strength, the higher the current density will be. Figure 11 shows the simulation results of the current density in the furnace water at 0.02 s for the three electrode structures. As can be seen from Figure 11, the maximum values of current density all appear at the bottom end of the electrode rod, and the maximum current density of the spherical electrode structure is shown in Figure 11a is 5546 A/m2, which is smaller than the 6335 A/m2 of the planar electrode structure shown in Figure 11b and the 15,985 A/m2 of the sectional electrode structure in Figure 11c. This is because the bottom end of the electrode rod for the spherical electrode structure has been chamfered. The end of the structure is rounded and does not form a sharp area, while the side and bottom surfaces of the electrode rod of the sectional electrode structure and the planar electrode structure both form a sharp area at the intersection. The sharper the electrode rod, the greater the curvature and the higher the current density. During normal operation of the boiler, the high current density value will cause the electrode rod to have a resistive effect and consume power in the form of heat. The bottom end of the electrode rod is also prone to overheating, melting, and deformation to form a tip, causing further distortion of the electric field, changing the uniformity of the electric field distribution in the furnace water, i.e., the heating area is not uniform and the thermal efficiency is reduced. In addition, excessive current density can also lead to electrolytic reactions in furnace water. In the process of electrolysis of furnace water, water molecules are decomposed into hydrogen ions and oxygen ions, and then electron transfer occurs through the reduction and oxidation reactions on the electrodes, ultimately generating hydrogen and oxygen, resulting in an imbalance of air pressure in the boiler. The presence of oxygen will also cause discharge phenomena in the gas between the high-voltage electrodes or even gas breakdown, seriously affecting the operational safety of the boiler.

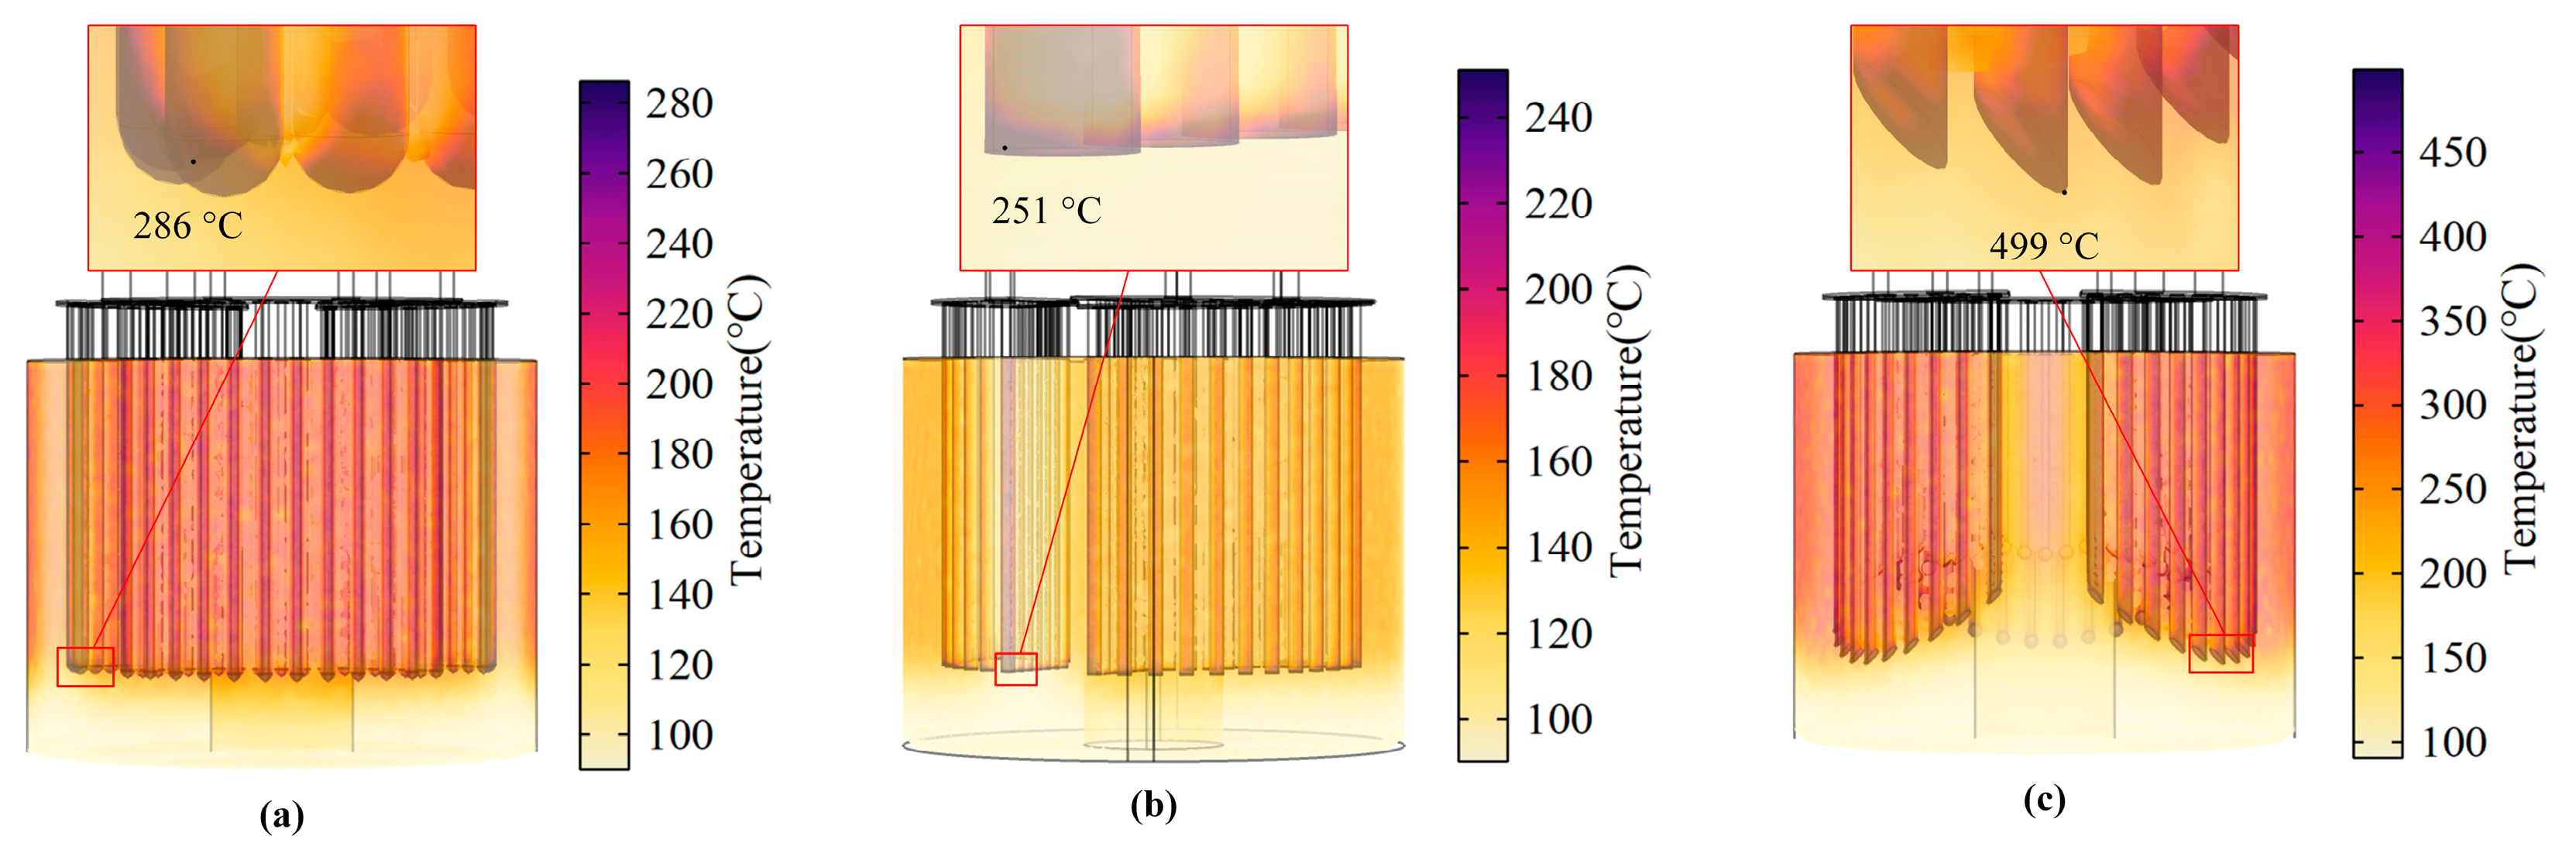
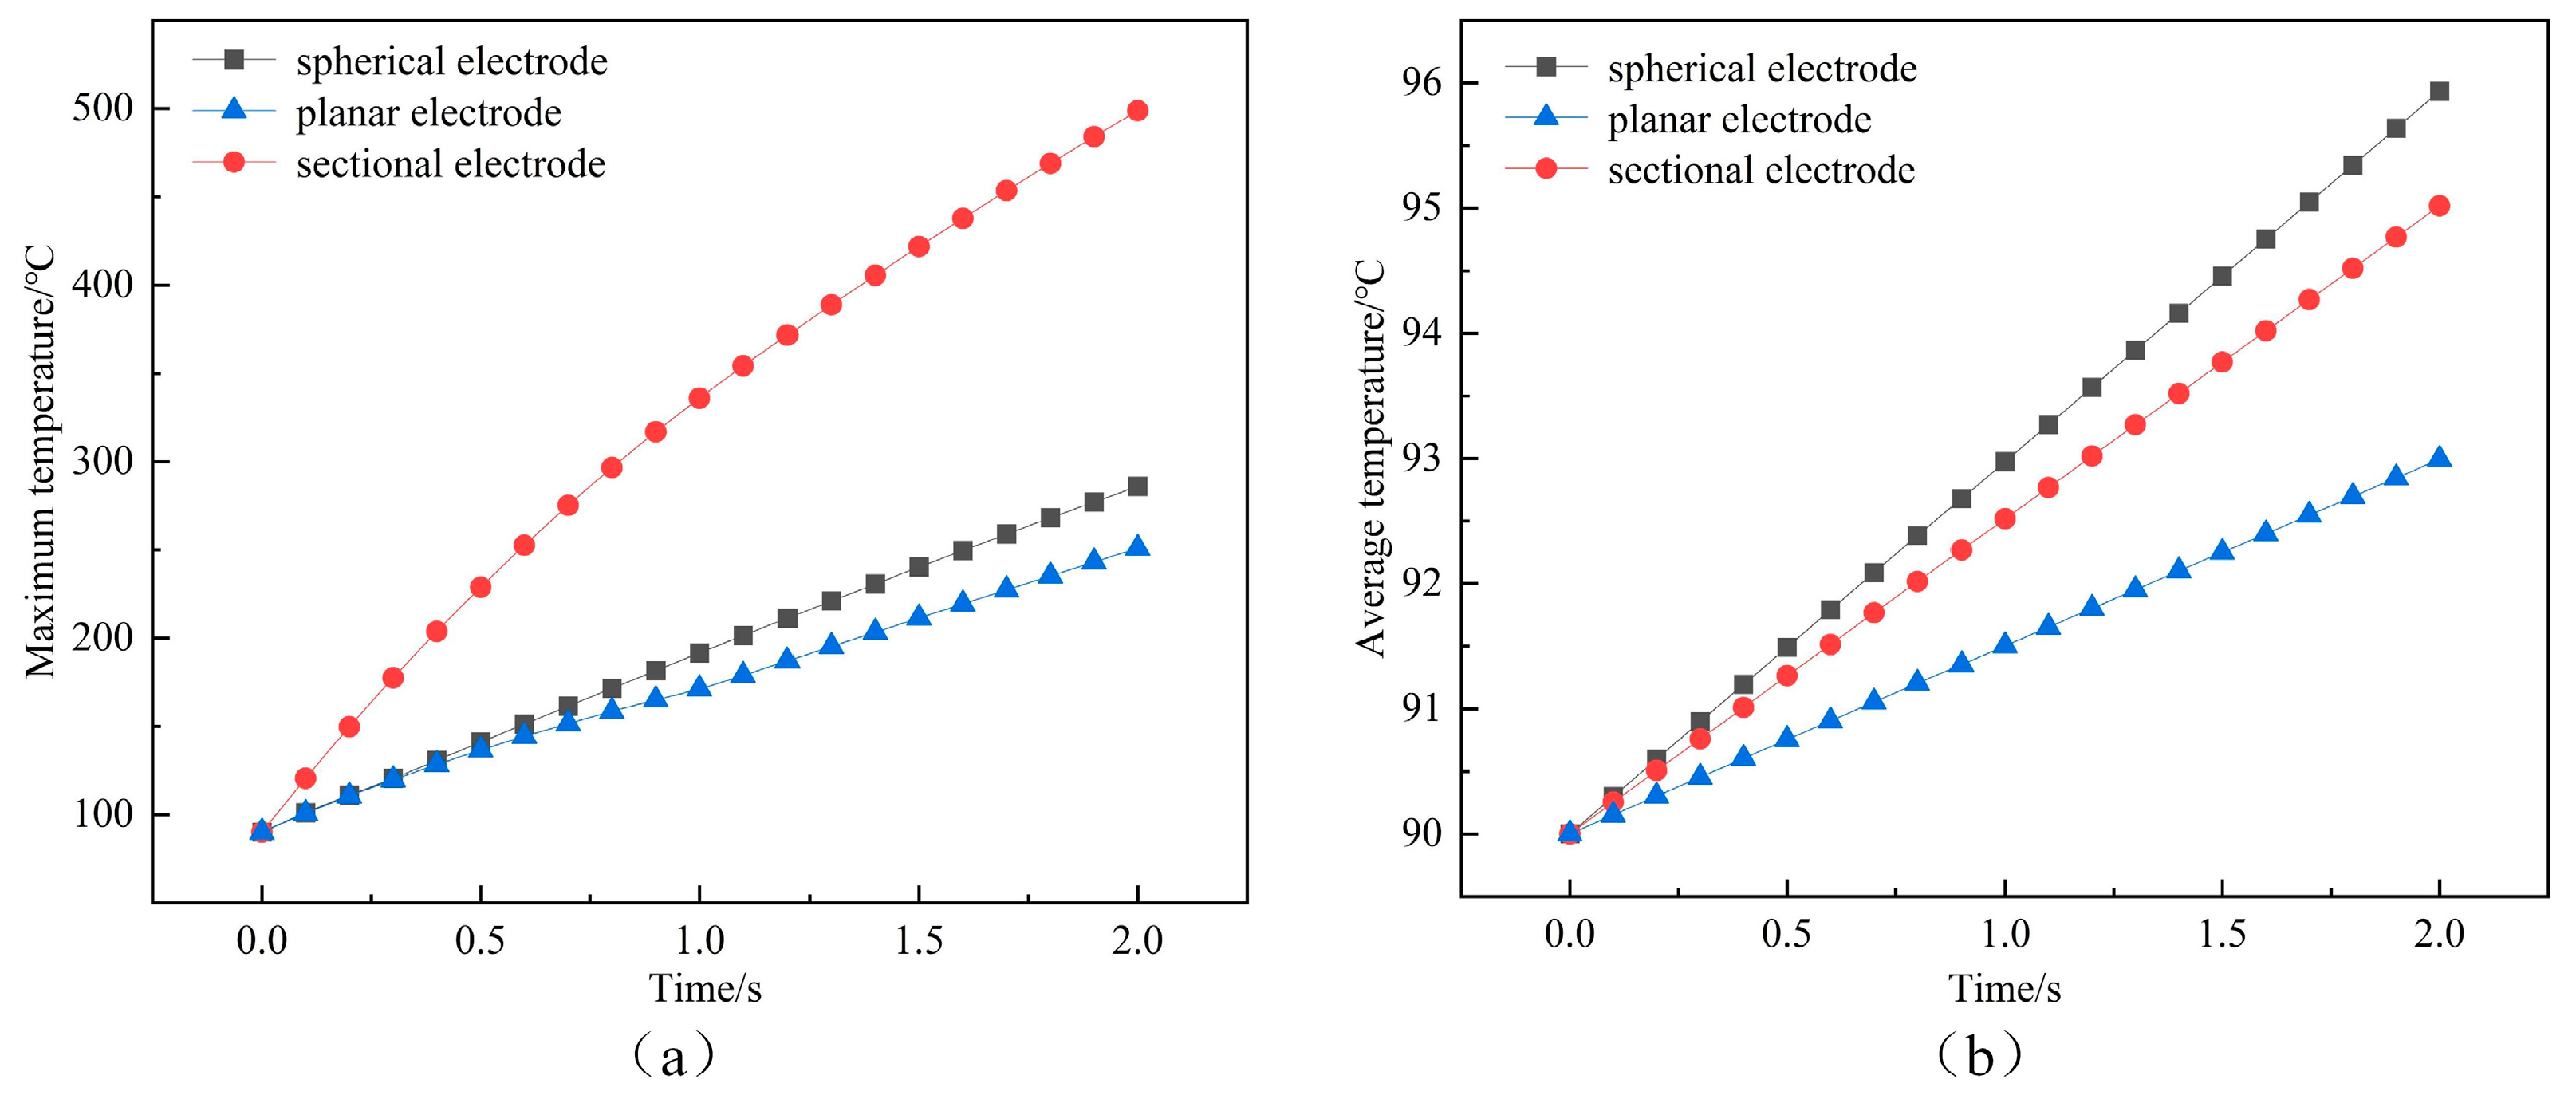
4. Temperature Field Simulation Results Analysis and Discussion

Figure 12 shows the temperature distribution of the furnace water at the end of 2 s for the three electrode structures. The higher temperature region of the furnace water under the three electrode structures is distributed between the three-phase electrodes, between the electrodes and the wall of the inner cylinder, and the temperature in the region of the furnace water at the bottom of the electrode rods and the bottom of the inner cylinder is lower. The heating area of the furnace water under the spherical electrode structure and the planar electrode structure is larger than that of the sectional electrode structure. The maximum temperature change and average temperature change in the furnace water under the three electrode structures are shown in Figure 13a,b, respectively. The maximum temperature of the furnace water under the spherical electrode structure increases to 286 °C, the maximum temperature of the furnace water under the planar electrode structure increases to 251 °C, and the maximum temperature of the furnace water under the sectional electrode structure increases to 499 °C within 2 s simulation time. The average temperature of the furnace water under the spherical electrode structure increased from 90 °C to 96 °C, that of the furnace water under the planar electrode structure increased from 90 °C to 93 °C, and that of the furnace water under the sectional electrode structure increased from 90 °C to 95 °C. The bottom end of the sectional electrode rod is sharper, where the electric field strength and current density are the highest, and the surrounding temperature will be higher, so the maximum temperature of the furnace water is the highest among the three electrodes. The average temperature of the furnace water under the spherical electrode structure is the highest among the three electrodes, indicating that the heating efficiency of the furnace water is the highest among the three electrode structures.
To more intuitively analyze the heating efficiency and heating area of different shapes of electrode structure, respectively, in the heating area between the electrodes of the two phases B and C, along the center cylinder to the inner cylinder to select a horizontal intercept line, along the liquid side of the furnace water to the bottom of the inner cylinder (i.e., the bottom of the furnace water) to take a longitudinal intercept line (the two intercept lines through the mid-point of the nearest distance of the two phases B and C), and to analyze the change in the temperature of the furnace water on the two intercept lines.
Figure 14a shows the temperatures of furnace water at 2 s at each intercept point on the transverse line taken from the three electrodes, where the coordinates of the transverse line are 0.25 m for the position of the center cylinder wall and 0.9 m for the position of the inner cylinder wall. It can be seen that the temperature of the furnace water under the three electrode structures shows a gradual decrease from the center cylinder to the inner cylinder wall, and the maximum decrease is at about 0.7 m, i.e., near the outer edge of the electrode. In addition, the temperature of the furnace water under the spherical electrode is larger than that of the other two electrodes at the same position, indicating that the heating efficiency of the spherical electrode in the transverse direction is higher than that of the other two electrodes. Figure 14b shows the temperature of furnace water at 2 s at each intercept point on the longitudinal line taken from the three electrodes, where the coordinates of the longitudinal line are 0.2 m for the position of the liquid surface of the furnace water and 1.6 m for the position of the bottom of the inner cylinder. It can be seen that the temperature of the furnace water under the three electrode structures shows a stepwise change, i.e., the temperature decreases from the liquid surface of the furnace water to the bottom of the inner cylinder in a stepwise manner. The temperature drop point of the furnace water occurs at the end of the electrode. At a depth of no more than 1 m from the liquid surface of the furnace water, the temperature of the furnace water under the planar electrode is significantly lower than that of the other two electrode structures. From the liquid surface of the furnace water to about 0.75 m from the liquid surface, the temperatures of the furnace water under the spherical and sectional electrodes were the same, indicating that the furnace water was uniformly heated in this region. However, the temperature of the furnace water under the sectional electrode started to decrease after the depth from the liquid surface of the furnace water was greater than 0.75 m. Similarly, the temperatures of the furnace water under the spherical and planar electrodes started to decrease after a depth of about 1.1 m from the liquid surface. It can be found that the temperature of the furnace water under the spherical and plane electrodes is more uniform, and the spherical electrode has a better heating effect in the longitudinal direction than the remaining two electrodes. Taken together, the spherical electrode in the middle region of the two-phase electrode has a higher heating temperature and a larger heating area, which is more conducive to improving the heating efficiency of the boiler.

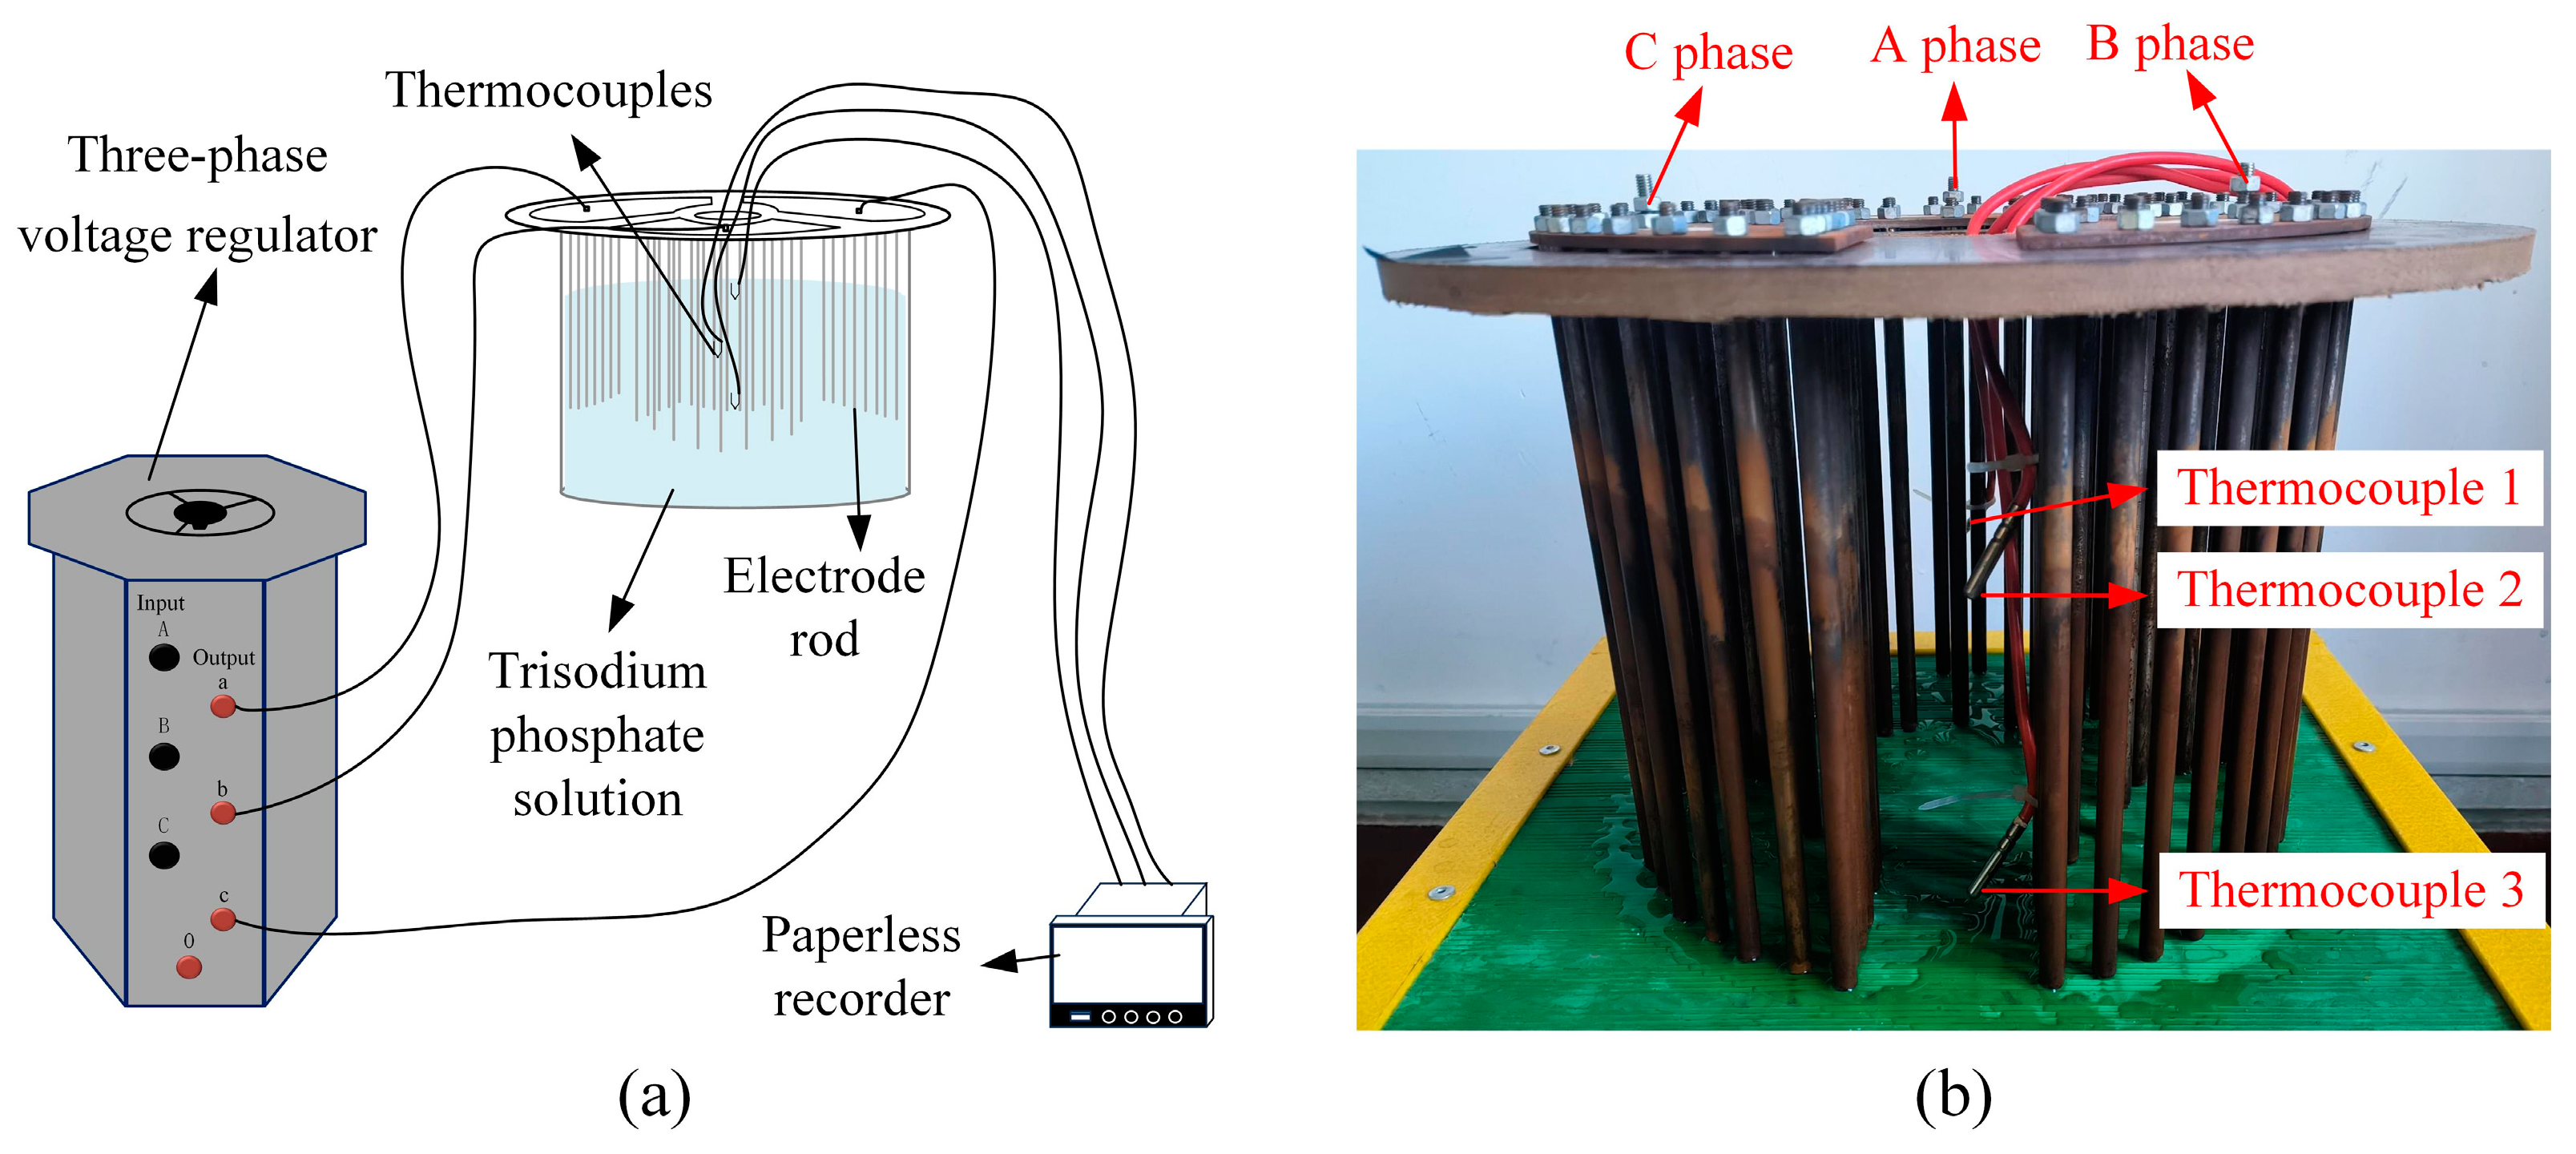
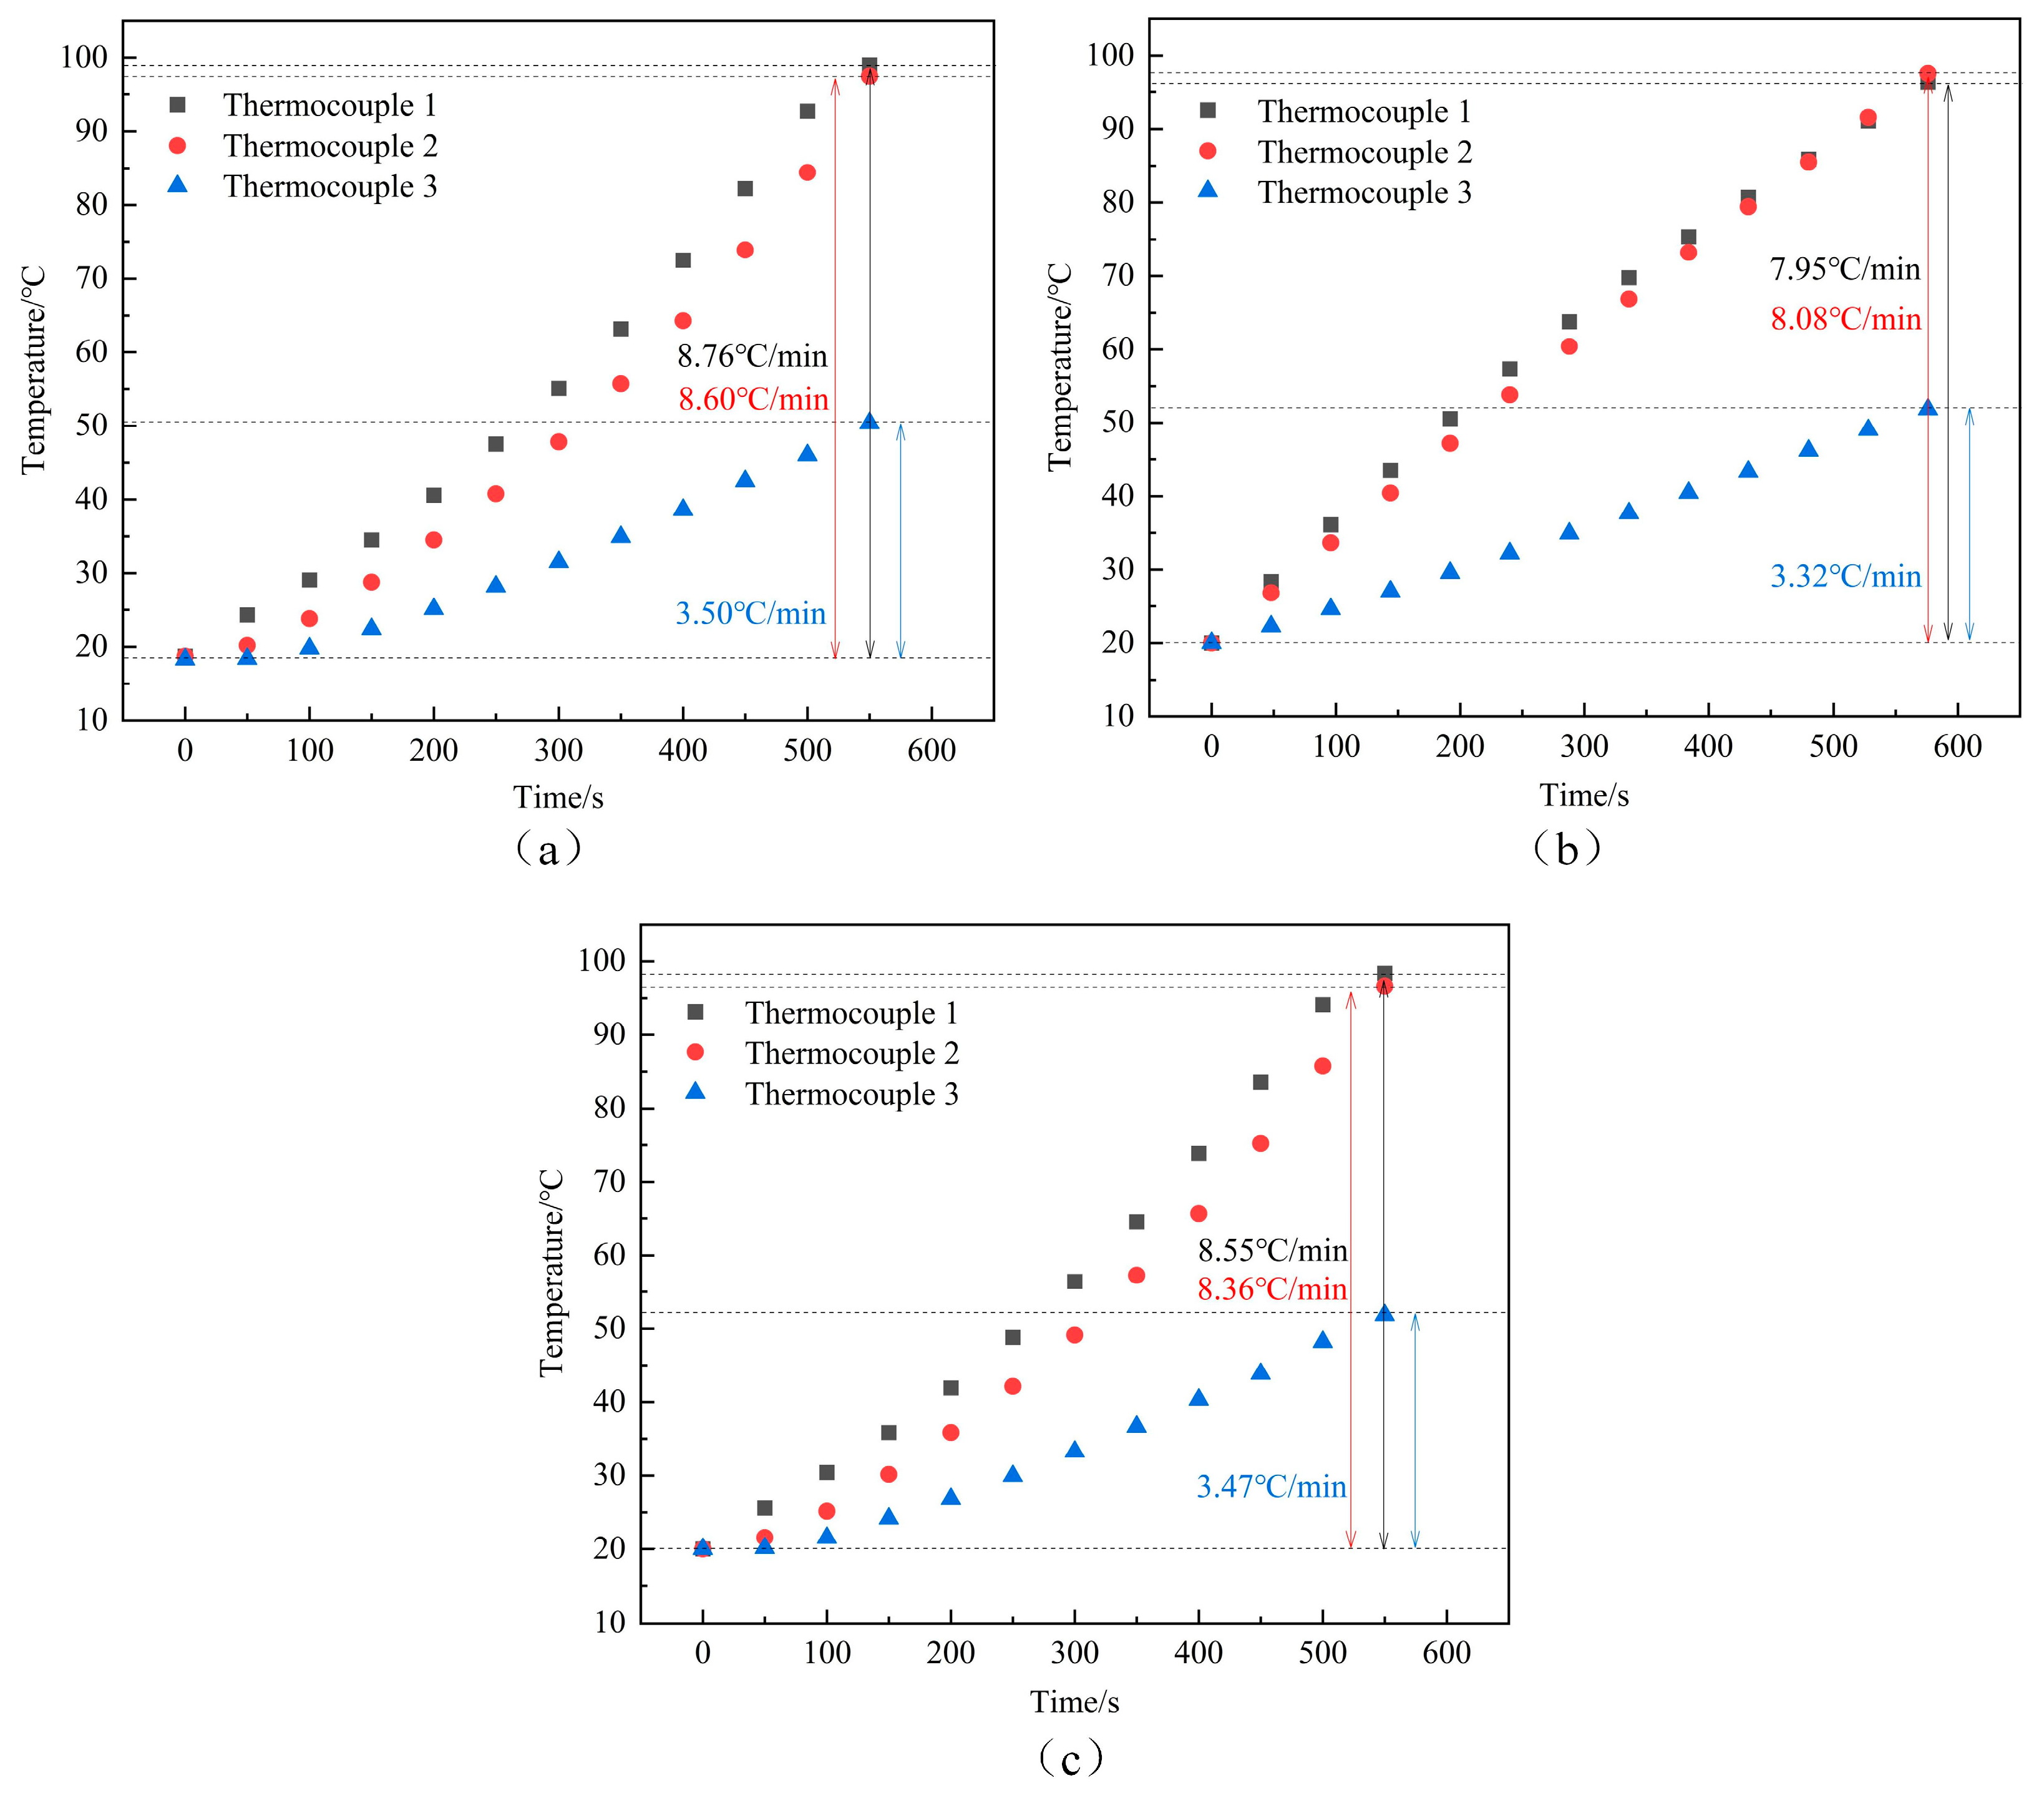
5. Experimental Verification

To verify the validity of the simulation method, an equally scaled-down spherical electrode object was designed, and furnace water heating experiments were carried out to measure and analyze the change in water temperature at different locations. Figure 15 shows the experimental circuit and the 1:6 scaled-down spherical electrode. In the experiment, a 400 V AC voltage was applied to the three-phase electrodes to heat the furnace water. Thermocouples were installed at three typical locations between phase A and the inner cylinder wall (thermocouple 1), 10 mm below the liquid level between phases B and C (thermocouple 2), and at the bottom of the electrode rod between phases B and C (thermocouple 3). The initial conductivity of the furnace water was 76 μS/cm.
Figure 16 shows the experimental and simulation results of the furnace water temperature at different positions under the equally scaled-down spherical electrode structure. From Figure 16a, the measured values of the average heating rate of the furnace water at the three typical positions are 7.95 °C/min, 8.08 °C/min, and 3.32 °C/min, respectively, while the simulated values for the corresponding positions are shown in Figure 16b as 8.76 °C/min, 8.60 °C/min, and 3.50 °C/min. The difference between the simulated and measured values of the average heating rate of the furnace water at the three typical positions is 9.3%, 6.0%, and −5.4%. Further analysis reveals that the temperature of the furnace water in the simulation shows a linear increase with time, while the measured temperature of the furnace water shows a non-linear increase with time, which is due to the change in the conductivity of the furnace water with temperature. Measurements show that the conductivity of the furnace water σ and the temperature T satisfies Equation (6):
σ = 0.417 T + 67.81
According to Equation (6), the conductivity of the furnace water during the simulation is corrected in real time, and the temperature changes in the furnace water at three typical positions are shown in Figure 16c. It can be seen that the average heating rate of the furnace water at the three typical locations is 8.55 °C/min, 8.36 °C/min, and 3.47 °C/min, respectively, and the comparison with the measured values in Figure 16a shows that the simulated values of the furnace water conductivity corrected relative to the measured values are reduced to the errors of 2.4%, 2.8%, and 0.9%. Therefore, the furnace water heating of the high-voltage electrode boiler can be better derived from the simulation in this paper, and the error between the simulated and measured values is not higher than 2.8%.

6. Conclusions

To address the problem of electrode shape design for an immersed HVEB, this paper analyzes the finite element simulation of a spherical electrode, a plane electrode, and the effect of a cut surface electrode on the electric field and temperature field of the furnace water, carrying out the simulation as well as a temperature rise test of the spherical electrode of the small model, and the following conclusions are obtained:
  • Under the spherical electrode, the electric field distribution in the furnace water is more uniform; the maximum field strength change value, the uneven coefficient, and the fluctuation value of the body electric field are all the smallest; and the electric field distortion degree is the lowest, which is more conducive to the uniform heating of the furnace water.
  • The maximum value of the current density of the furnace water under the spherical electrode is lower than that of the planar electrode and the sectional electrode. The maximum value of the current density of the furnace water under the three electrodes is located at the bottom end of the electrode, i.e., the sharper the bottom end of the electrode, the greater the curvature, the higher the current density of the furnace water, and the probability of over-temperature phenomenon of the furnace water at the bottom end of the electrode will be sharply increased, which can easily lead to the electrolysis of the furnace water.
  • Temperature field simulations show that the spherical electrode structure has the largest heating area, the highest average temperature rise of the furnace water, and the highest heating efficiency.
  • Through the temperature rise test of the small model spherical electrode, the simulation data of the small model spherical electrode and the temperature rise test were compared and analyzed in terms of the average temperature rise rate at special points, and the results showed that the maximum error percentage was within 10%; and after correcting the conductivity of the simulation model, the maximum error ratio was reduced to 3%, which proved the accuracy of the simulation method.
  • The spherical electrode structure has the best overall performance among the three electrode structures, which can effectively improve the safety of the high-voltage electrode boiler in actual operation. In the following research, the electrode materials should be researched to obtain low-cost, conductive, and corrosion-resistant materials to improve the life and safety of the high-voltage electrode boilers.

Author Contributions

This paper is a result of the collaboration of all co-authors. Formal analysis, M.W.; investigation, J.W.; methodology, Z.L. and L.L.; software, M.W. and W.Z.; validation, M.W., Z.L. and L.L.; resources, Z.L. and J.W.; data curation, M.W.; writing—original draft preparation, M.W.; writing—review and editing, Z.L. and L.L.; visualization, W.Z. and Y.Z.; funding acquisition, J.W. All authors have read and agreed to the published version of the manuscript.

Funding

This research was financially supported by the Shanxi Province Natural Science Foundation (Grant No. 202403021222055), the Shanxi Province Science and Technology Innovation Project of Higher Education Institutions (Grant No. 2023L023) and the Open Fund of Shanxi Provincial Key Laboratory of High-Efficiency Thermal Storage and Low-Carbon Heat Supply.

Data Availability Statement

Data are contained within the article.

Acknowledgments

The authors gratefully acknowledge Taiyuan Boiler Group Co., Ltd.

Conflicts of Interest

The author Jianfei Wang was employed by the Taiyuan Boiler Group Co., Ltd. The author Yiling Zhang was employed by the State Grid Tianjin Baodi Power Supply Company. The remaining authors declare that the research was conducted in the absence of any commercial or financial relationships that could be construed as a potential conflict of interest.

Abbreviations

ACAlternating Current
HVEBHigh-Voltage Electrode Boiler
N2Nitrogen
Symbols and their units
SymbolUnit
φkV
EkV/m
fHz
rm
lm
hm
σS/m
ρC/m3
JA/m2
T
Times
Tag℃/min
qW/m2

References

  1. Dong, Y.; Yu, S.; He, C.; Yu, Q.; Fang, F. Optimal Multi-Mode Flexibility Operation of CHP Units with Electrode Type Electric Boilers: A Case Study. Energies 2022, 15, 9337. [Google Scholar] [CrossRef]
  2. Manni, M.; Nicolini, A.; Cotana, F. Performance assessment of an electrode boiler for power-to-heat conversion in sustainable energy districts. Energy Build. 2022, 277, 112569. [Google Scholar] [CrossRef]
  3. Yuan, R.; Yan, H.; Chen, W.; Liu, M. Design and performance evaluation of a shared energy storage system integrated within combined heat and power plants in an energy network. J. Energy Storage 2024, 103, 114324. [Google Scholar] [CrossRef]
  4. Shi, T.; Chen, Z.; Guo, S.; Li, D. Fast-Frequency-Response Control Method for Electrode Boilers Supporting New Energy Accommodation. Processes 2023, 11, 3098. [Google Scholar] [CrossRef]
  5. Ding, T.; Mou, C.; He, Y.; Sun, Y.; Liu, R.; He, F.; Ren, C. Analyzing current development and typical cases of clean heating supply in Northwest China (II): Typical cases and techno-economic analysis. Proc. CSEE 2020, 40, 5126–5136. [Google Scholar]
  6. National Energy Administration. Transcript of the National Energy Board’s Online Press Conference for the Third Quarter of 2022[EB/OL]. (2022-08-02). Available online: http://www.nea.gov.cn/2022-08/02/c_1310648934.htm (accessed on 1 July 2024).
  7. Wang, Z.; Yang, L.; Tian, C.; Li, G. Energy Optimization for the combined system of wind-electric energy storage-regenerative electric boiler considering wind consumption. Proc. CSEE 2017, 37, 137–143. [Google Scholar]
  8. Wang, K.; Xie, L.; Qiao, Y.; Wang, C.; Fan, X.; Liang, W. Optimization and economic analysis of multi-boiler coupled coordination heating considering abandoned wind power. Acta Energ. Sol. Sin. 2021, 42, 104–109. [Google Scholar]
  9. Yang, Q.; Zhi, C.; Yuan, D.; Yang, H. Wind power accommodation low-carbon economic dispatch based on coordination between automatic start-stop electric boiler and heat accumulator. Acta Energiae Solaris Sin. 2020, 41, 21–28. [Google Scholar]
  10. Dai, B.; Xie, L.; Gao, Y.; Li, J.; Qiao, C.; Zhang, Y. Research on multi-boiler heating scheme considering wind abandonment and difference of users response behaviors. Acta Energiae Solaris Sin. 2023, 44, 437–443. [Google Scholar]
  11. Wang, H.; Dong, H.; Du, Q.; Wei, G. Current situation and prospect of electrode boiler in China. Therm. Energy Power Eng. 2023, 38, 1–12. [Google Scholar]
  12. Gicevskis, K.; Linkevics, O. The Role of Decentralized Electrode Boiler in Ancillary Services and District Heating: A Feasibility Assessment. Latv. J. Phys. Tech. Sci. 2023, 60, 32–42. [Google Scholar] [CrossRef]
  13. Nielsen, R.J.; Pedersen, T.E. Electrode boiler model for ancillary service simulation. In Proceedings of the 15th International Modelica Conference 2023, Aachen, Germany, 9–11 October 2023; pp. 589–598. [Google Scholar]
  14. Guo, F.; Xia, Q.; Liu, Y. Application of immersion electrode boilers in nuclear power plants. Therm. Power Gener. 2012, 41, 88. [Google Scholar]
  15. Jiang, S.; Zhou, Y. Research on electric field Distribution Characteristics of Immersed electrode Boiler. Comput. Simul. 2022, 39, 248–252. [Google Scholar]
  16. Wu, B.; Wu, H. Reverse power control method of steam water parameters for nuclear power electrode Immersion Boiler. Electr. Power China 2017, 50, 107–112+123. [Google Scholar]
  17. Zheng, Z.; Zhou, Y.; Li, Y. AC corrosion behavior of several metallic materials as a candidate for boiler electrode. J. Chin. Soc. Corros. Prot. 2023, 43, 202–208. [Google Scholar]
  18. Zheng, Z. Study on Corrosion Characteristics of Boiler High Pressure Electrode. Master’s Thesis, Xinjiang University, Urumqi, China, 2021. [Google Scholar]
  19. He, X.; Ruan, Y.; Wang, W. Three-Dimensional Transient Electric Field Characteristics of High Pressure Electrode Boilers. Electronics 2024, 13, 1615. [Google Scholar] [CrossRef]
  20. Ruan, Y. Study on New Electrode System and Electric Field Characteristics of High Voltage Electrode Boiler. Master’s Thesis, North China University of Water Resources and Electric Power, Zhengzhou, China, 2021. [Google Scholar]
  21. Liu, H.; Song, H.; Pan, H.; Ying, Q.; Ge, W.; Jiang, J.; Liu, Y. Numerical simulation of power variation characteristics of an immersion electrode boiler. Ind. Boil. 2023, 2, 1–6. [Google Scholar]
  22. Ma, J.; Qiang, S.; Yuan, X. Research on Mathematical Modeling of Electrode Boiler Based on Dynamic Neural Network. Comput. Simul. 2019, 36, 126–130. [Google Scholar]
  23. Yuan, X. Study on Mechanism Modeling and Dynamic Characteristics of the Submerged Electrode Boiler System. Master’s Thesis, North China Electric Power University, Baoding, China, 2019. [Google Scholar]
Figure 1. Principle diagram of the immersion high-voltage electrode boiler.
Energies 18 00825 g001
Figure 2. Electrode model diagram. (a) Spherical electrodes. (b) Planar electrodes. (c) Sectional electrodes. (d) Overall structure.
Energies 18 00825 g002
Figure 3. Diagram of section. (a) Cross-section schematic. (b) Longitudinal section schematic.
Energies 18 00825 g003
Figure 4. Transversal electrical field distribution of spherical surface electrodes. (a) z = −0.25 m. (b) z = −0.75 m. (c) z = −1.25 m. (d) z = −1.50 m.
Energies 18 00825 g004
Figure 5. Transversal electrical field distribution of planar electrodes. (a) z = −0.25 m. (b) z = −0.75 m. (c) z = −1.25 m. (d) z = −1.50 m.
Energies 18 00825 g005
Figure 6. Transversal electrical field distribution of the sectional electrodes. (a) z = −0.25 m. (b) z = −0.75 m. (c) z = −1.25 m. (d) z = −1.50 m.
Energies 18 00825 g006
Figure 7. Longitudinal electric field distribution of spherical electrodes. (a) y = −0.80 m. (b) y = −0.40 m. (c) y = 0.40 m. (d) y = 0.80 m.
Energies 18 00825 g007
Figure 8. Longitudinal electric field distribution in planar electrodes. (a) y = −0.80 m. (b) y = −0.40 m. (c) y = 0.40 m. (d) y = 0.80 m.
Energies 18 00825 g008
Figure 9. Longitudinal electric field distribution at sectional electrodes. (a) y = −0.80 m. (b) y = −0.40 m. (c) y = 0.40 m. (d) y = 0.80 m.
Energies 18 00825 g009
Figure 10. Furnace water electric field inhomogeneity coefficient.
Energies 18 00825 g010
Figure 11. Current density distribution. (a) Spherical electrodes. (b) Planar electrodes. (c) Sectional electrodes.
Energies 18 00825 g011
Figure 12. Temperature field distribution. (a) Spherical electrodes. (b) Planar electrodes. (c) Sectional electrodes.
Energies 18 00825 g012
Figure 13. Furnace water temperature change. (a) Maximum temperature change. (b) Average temperature change.
Energies 18 00825 g013
Figure 14. Temperature change on the truncated line. (a) Transverse line. (b) Longitudinal line.
Energies 18 00825 g014
Figure 15. Furnace water heating experiment circuit and spherical electrode physical drawing. (a) Experimental circuit. (b) Spherical electrode model.
Energies 18 00825 g015
Figure 16. Variation in furnace water temperature with time in different cases. (a) Measured value of furnace water temperature. (b) Simulated value of furnace water temperature. (c) Simulated value of furnace water temperature after correction of furnace water conductivity.
Energies 18 00825 g016
Table 1. Properties of model materials.
ModelMaterialRelative PermittivityElectrical Conductivity/S∙m−1
High-voltage electrode20#steel11.12 × 107
Electrode disk20#steel11.12 × 107
Electrode rod20#steel11.12 × 107
Inner cylinder20#steel11.12 × 107
Furnace waterTrisodium phosphate solution2.9200 × 10−4
Center cylinderPolytetrafluoroethylene2.110 × 10−14
Table 2. Three-phase voltage expression.
Phase SequenceExpression
A phase 10 2 / 3 × sin 100 π t
B phase 10 2 / 3 × sin 100 π t + 2 π / 3
C phase 10 2 / 3 × sin 100 π t + 4 π / 3
Disclaimer/Publisher’s Note: The statements, opinions and data contained in all publications are solely those of the individual author(s) and contributor(s) and not of MDPI and/or the editor(s). MDPI and/or the editor(s) disclaim responsibility for any injury to people or property resulting from any ideas, methods, instructions or products referred to in the content.

