
Annual Simulation of Phase Change Materials for Enhanced Energy Efficiency and Thermal Performance of Buildings in Southern California


Abstract
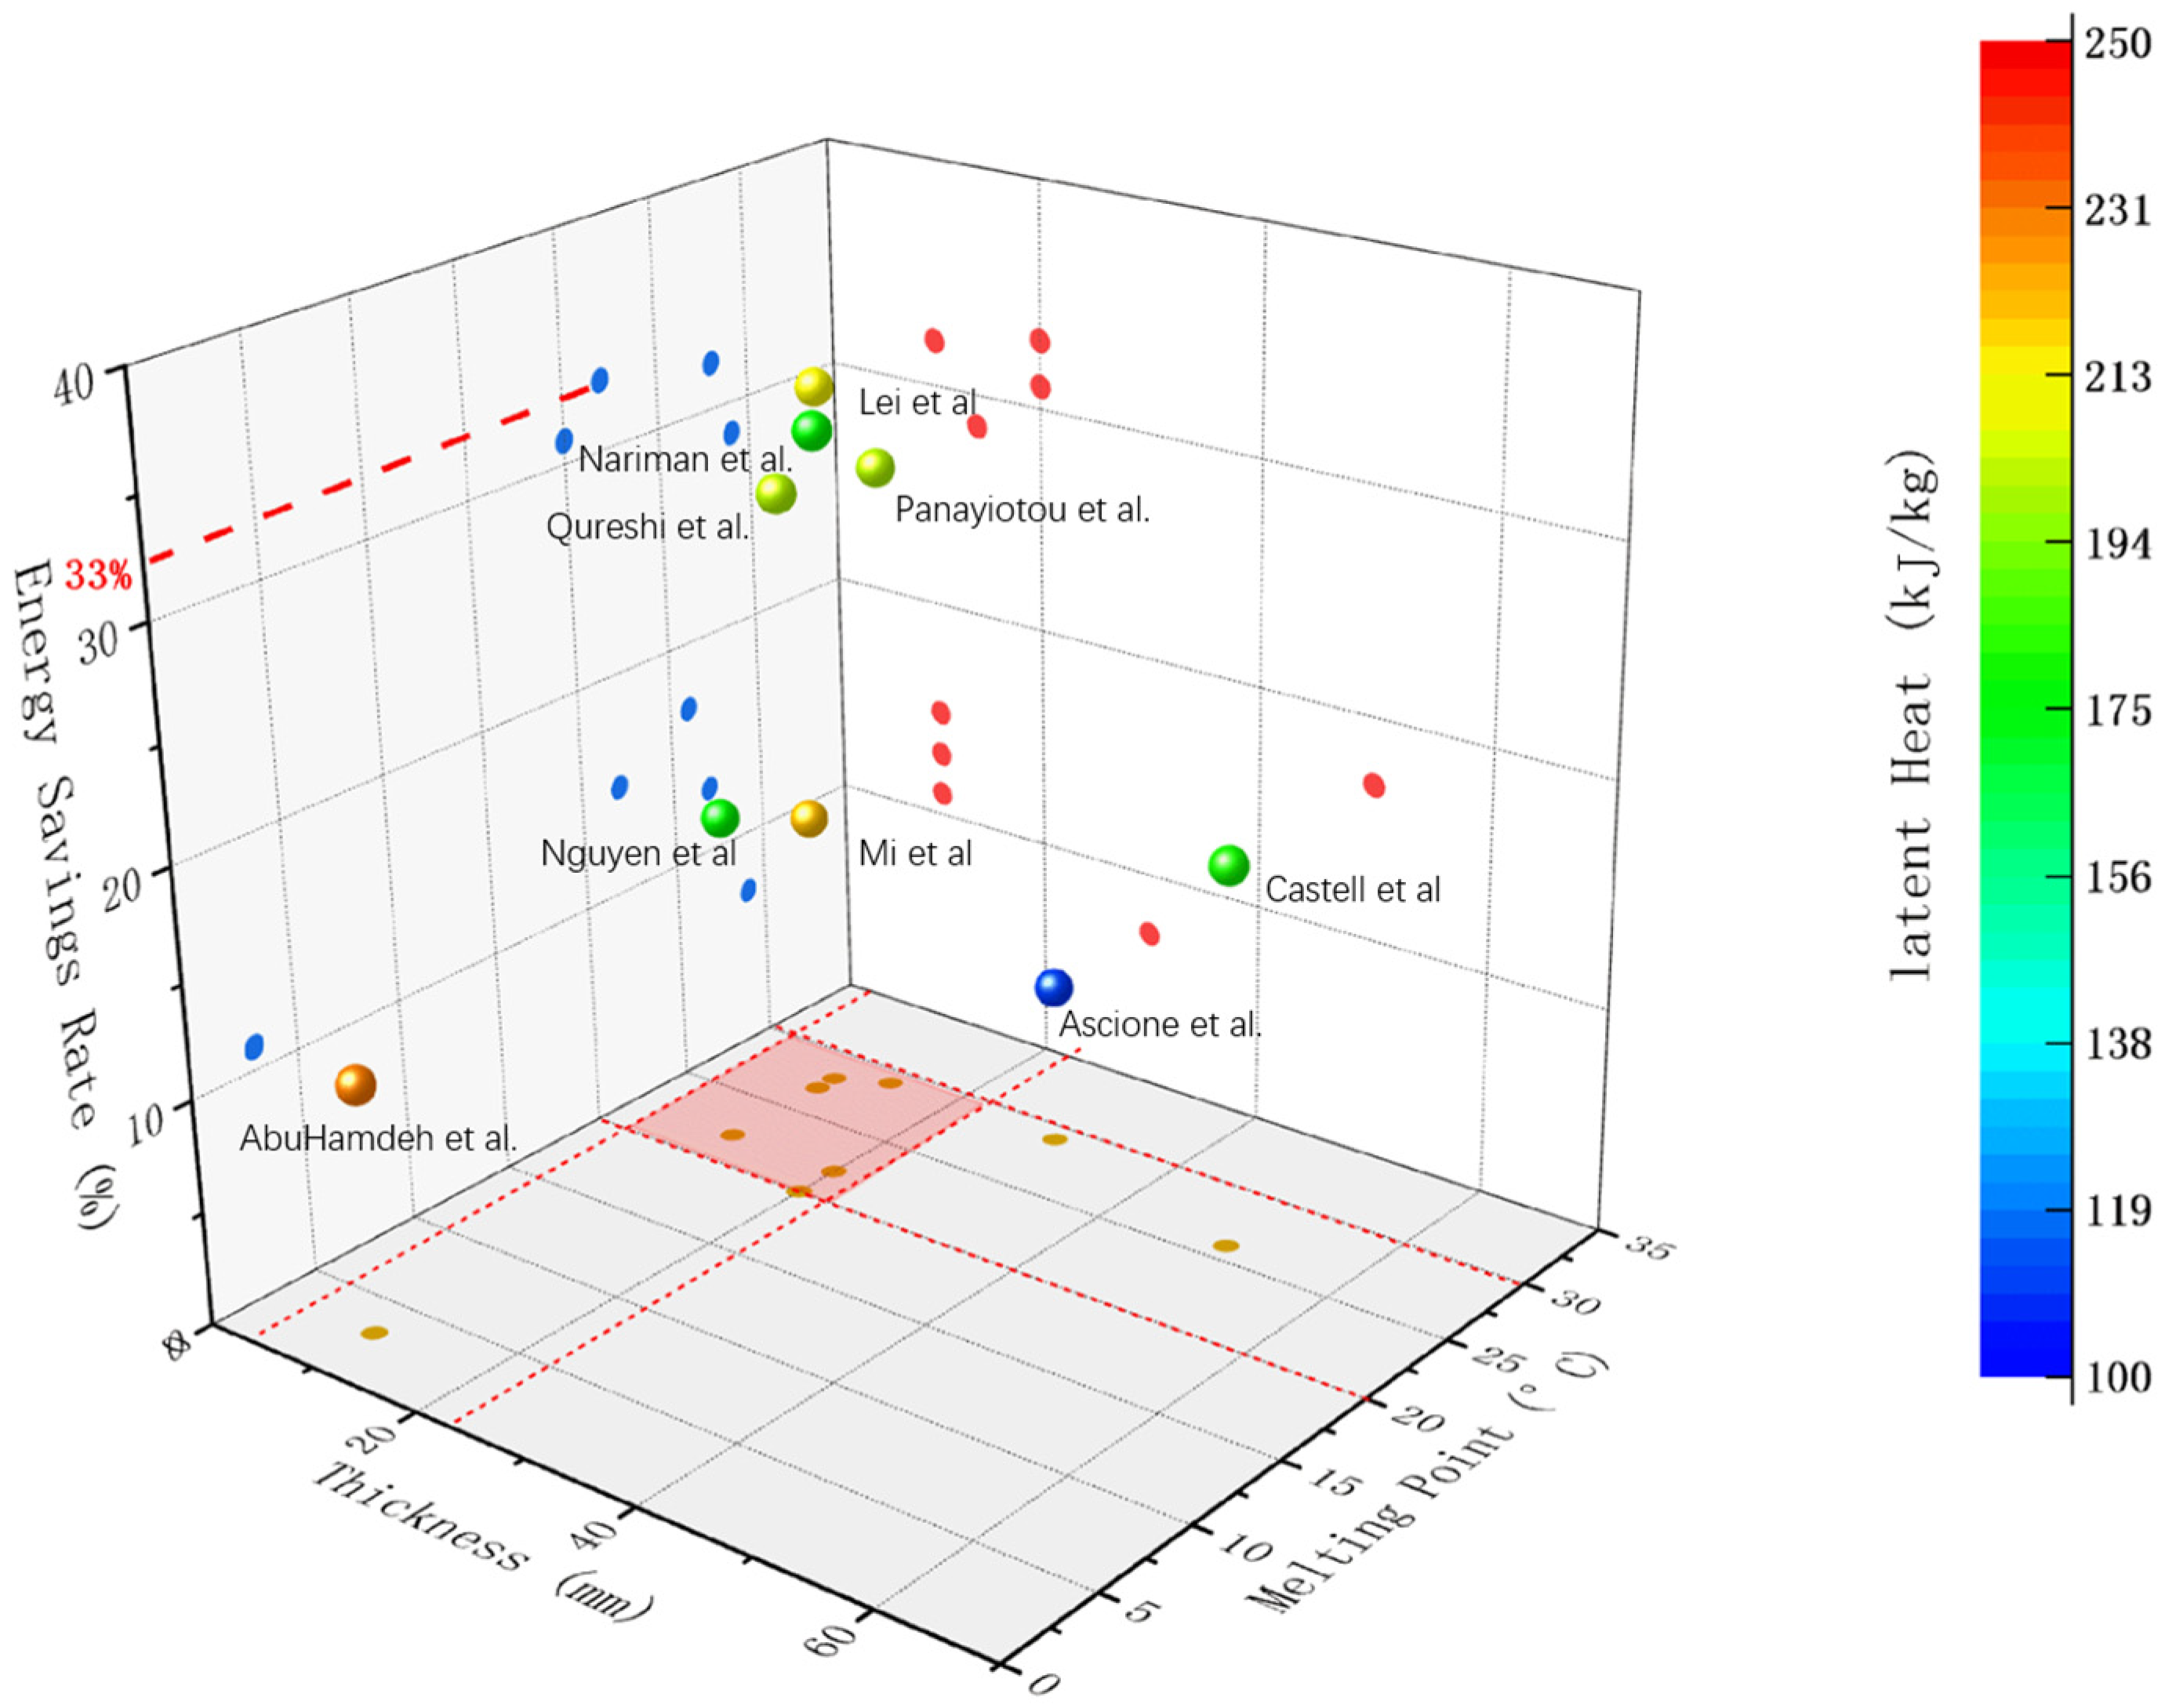
:1. Introduction
2. Materials and Methods
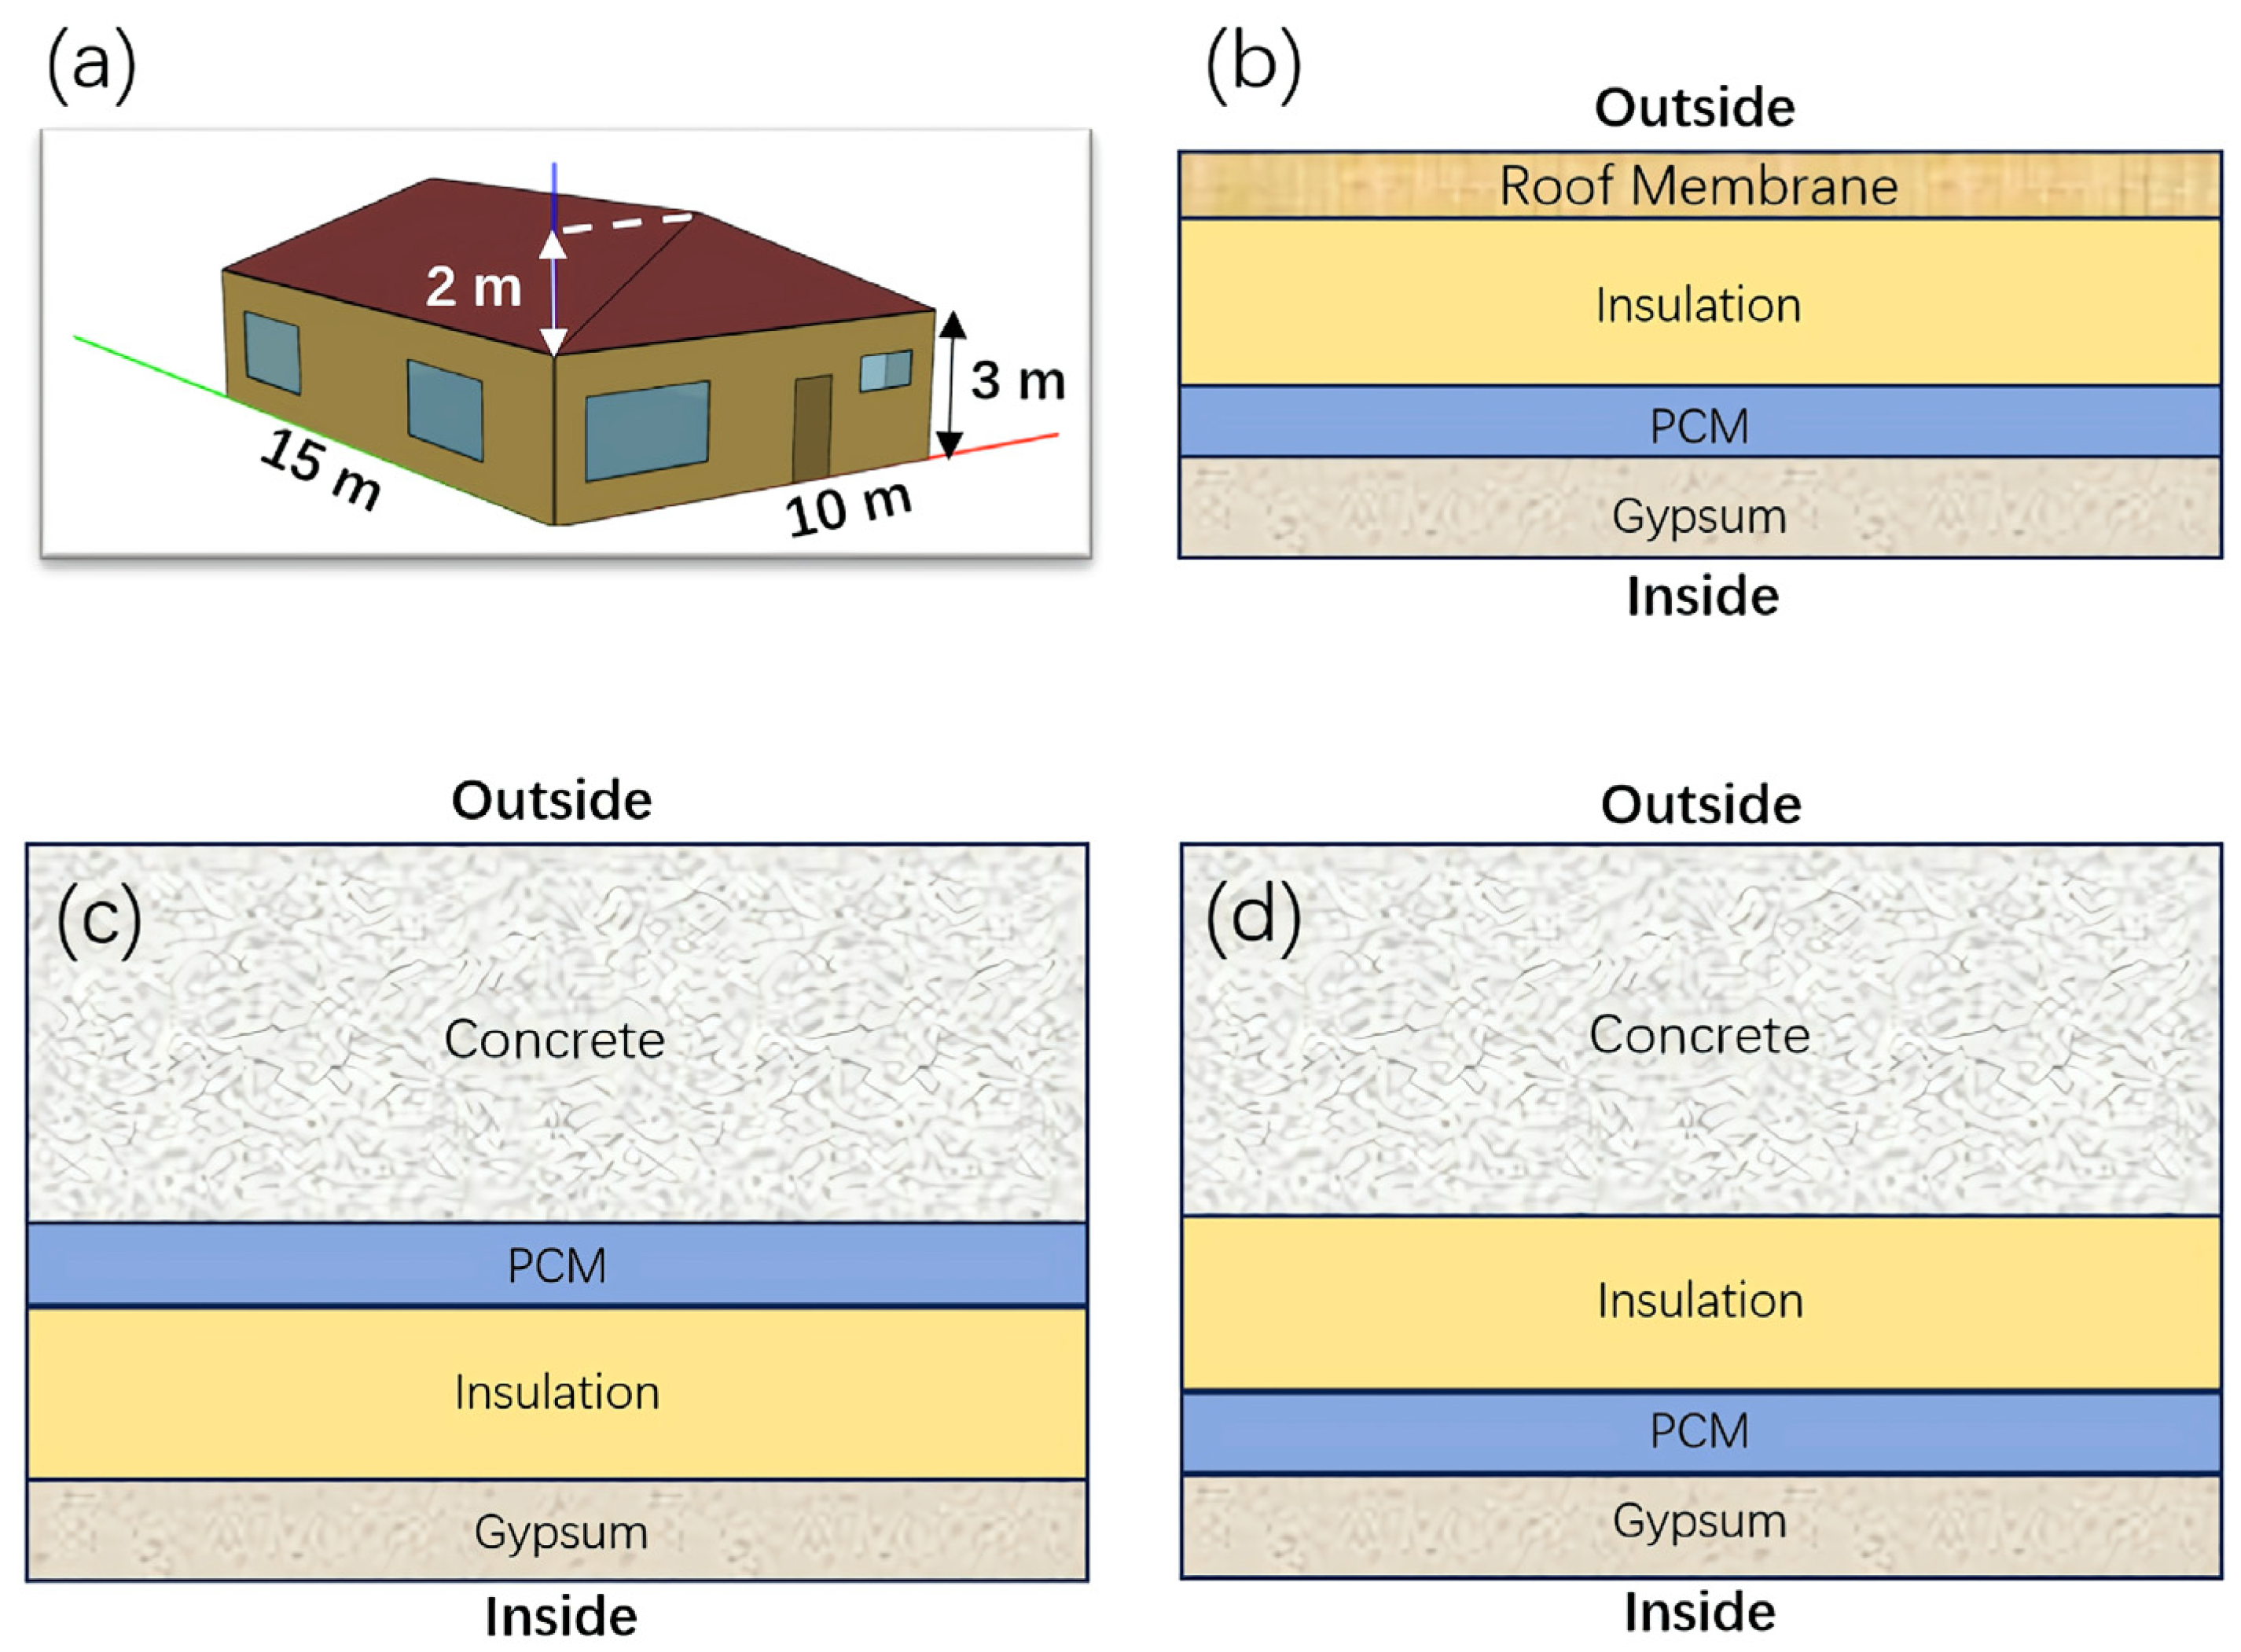
2.1. Building Model
2.2. Material Properties
2.3. PCM Modeling Using EnergyPlus
2.3.1. The Finite Difference Solution Algorithm
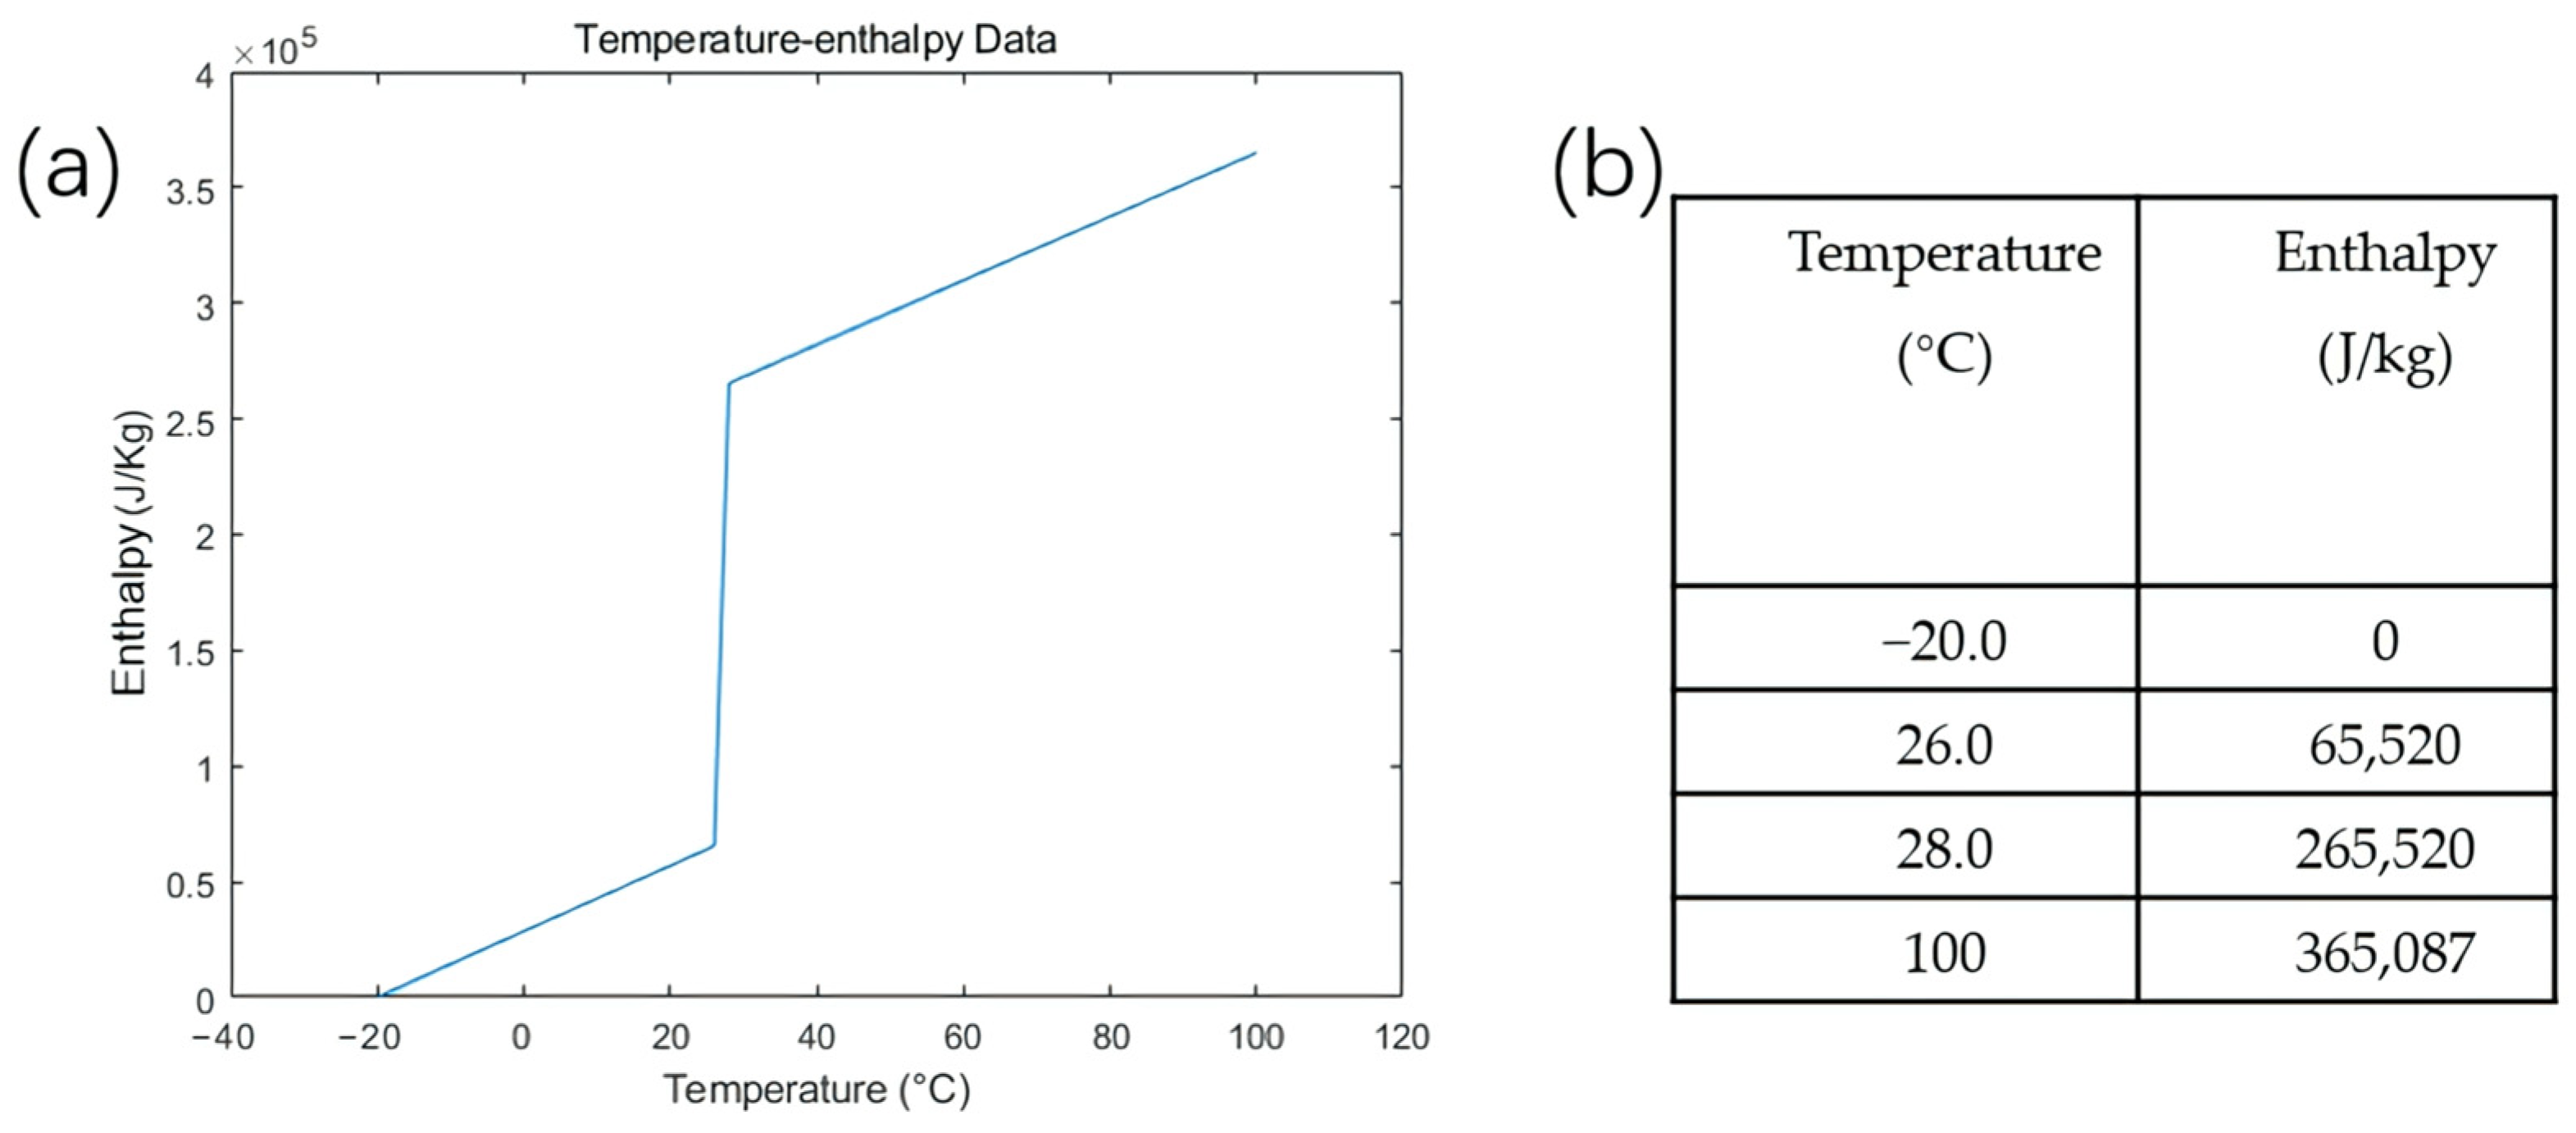
2.3.2. Basic Method and Hysteresis Method
- The Hysteresis Method: this method uses non-isothermal enthalpy curves during melting and solidification, requiring more accurate PCM thermal properties such as thermal conductivity, specific heat capacity, and densities of both solid and liquid phases. It also requires input of the peak melting temperature and temperature ranges for melting and solidification [41].
3. Results and Discussion
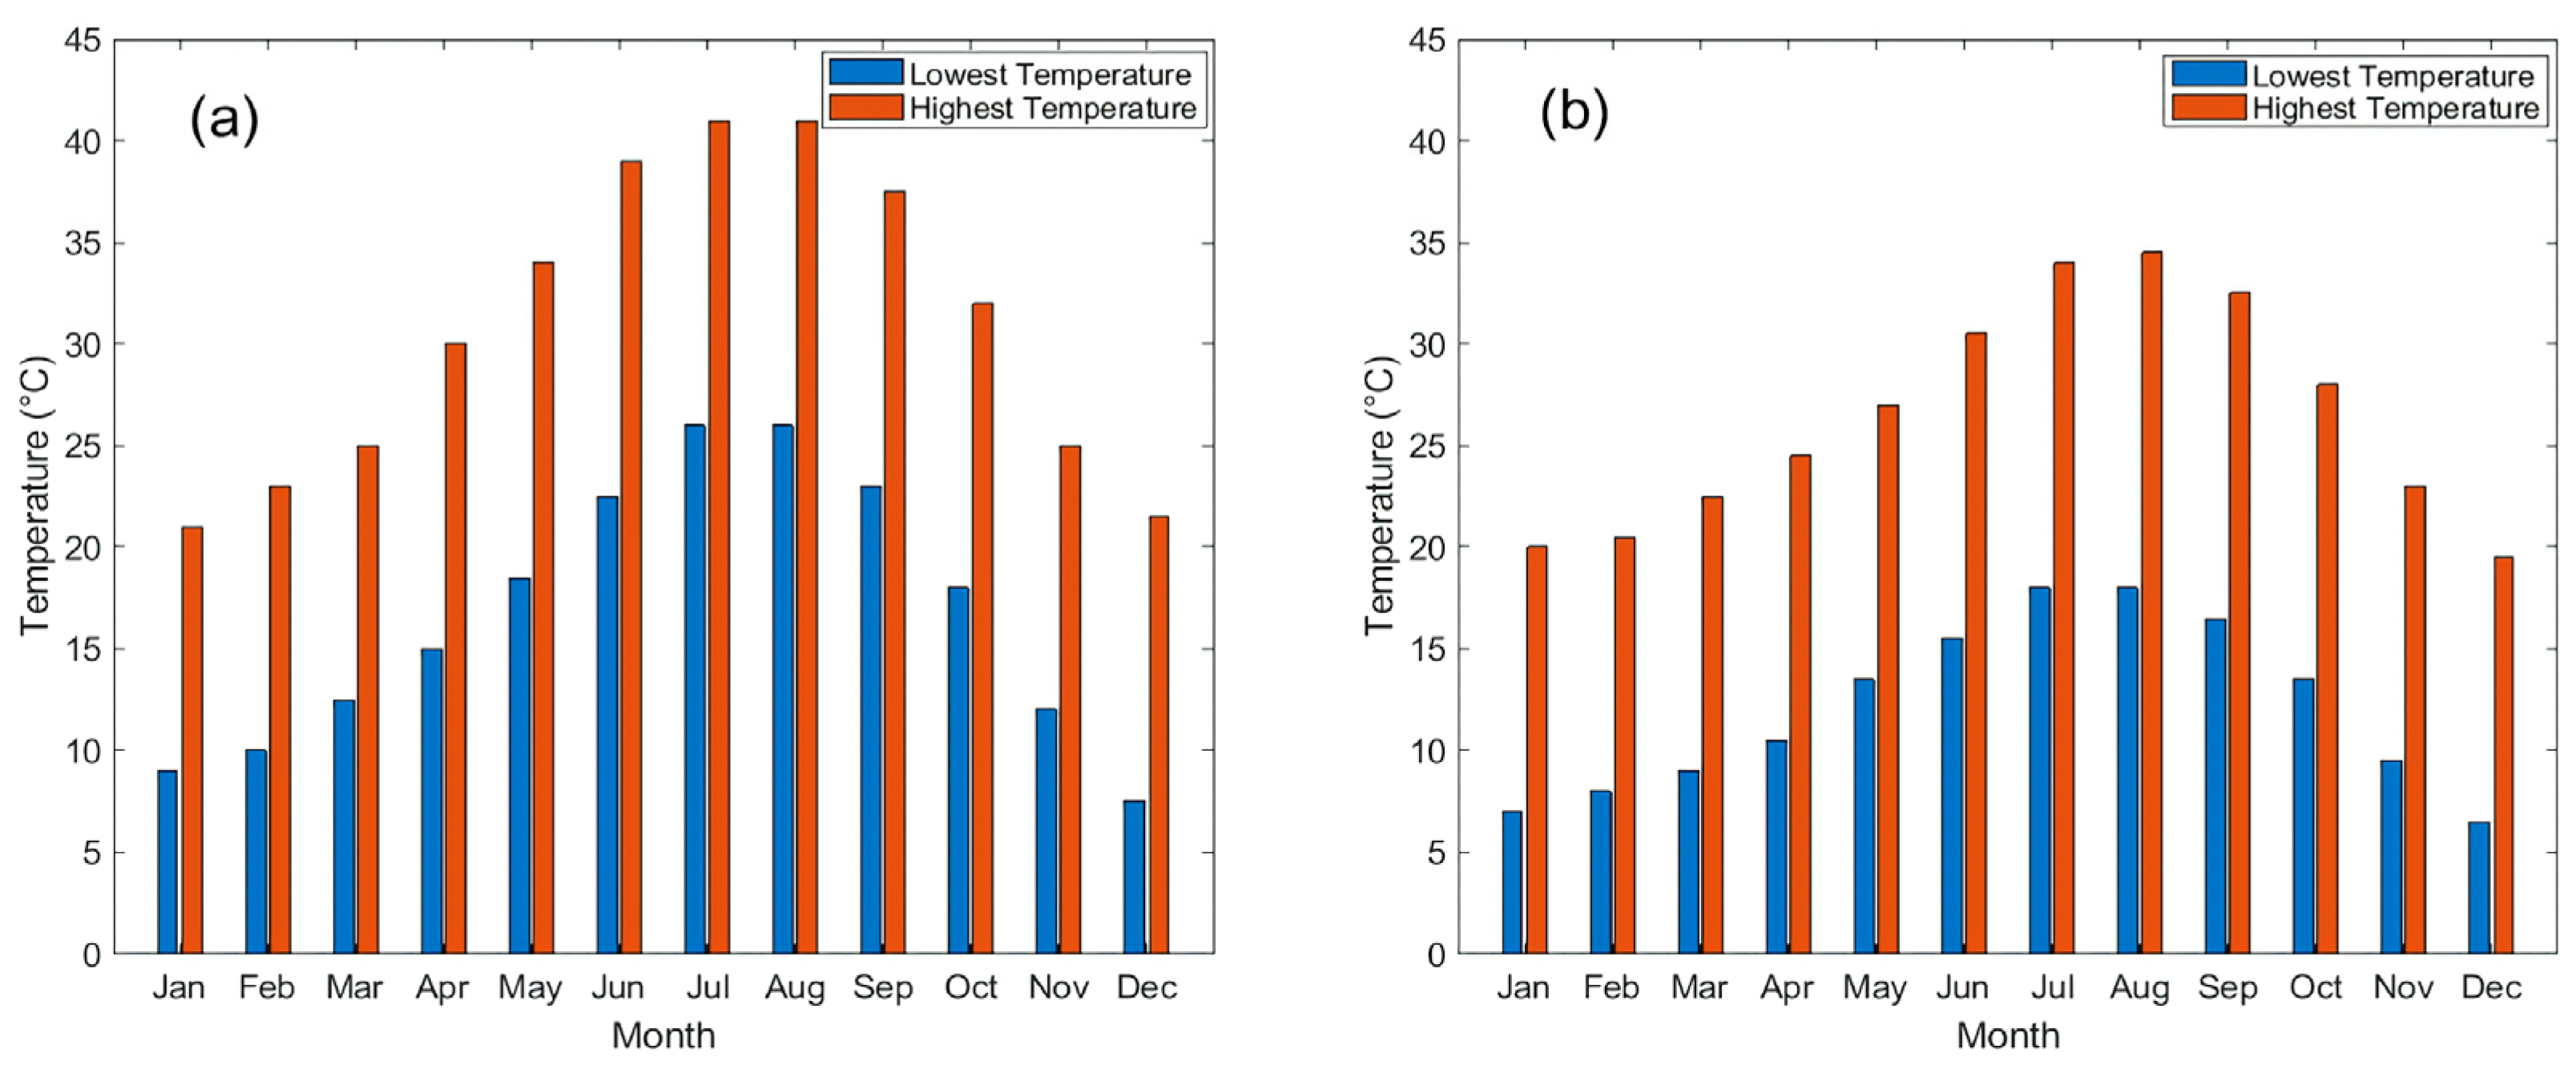
3.1. Annual Temperature of Testing Locations
3.2. Basic Method Results
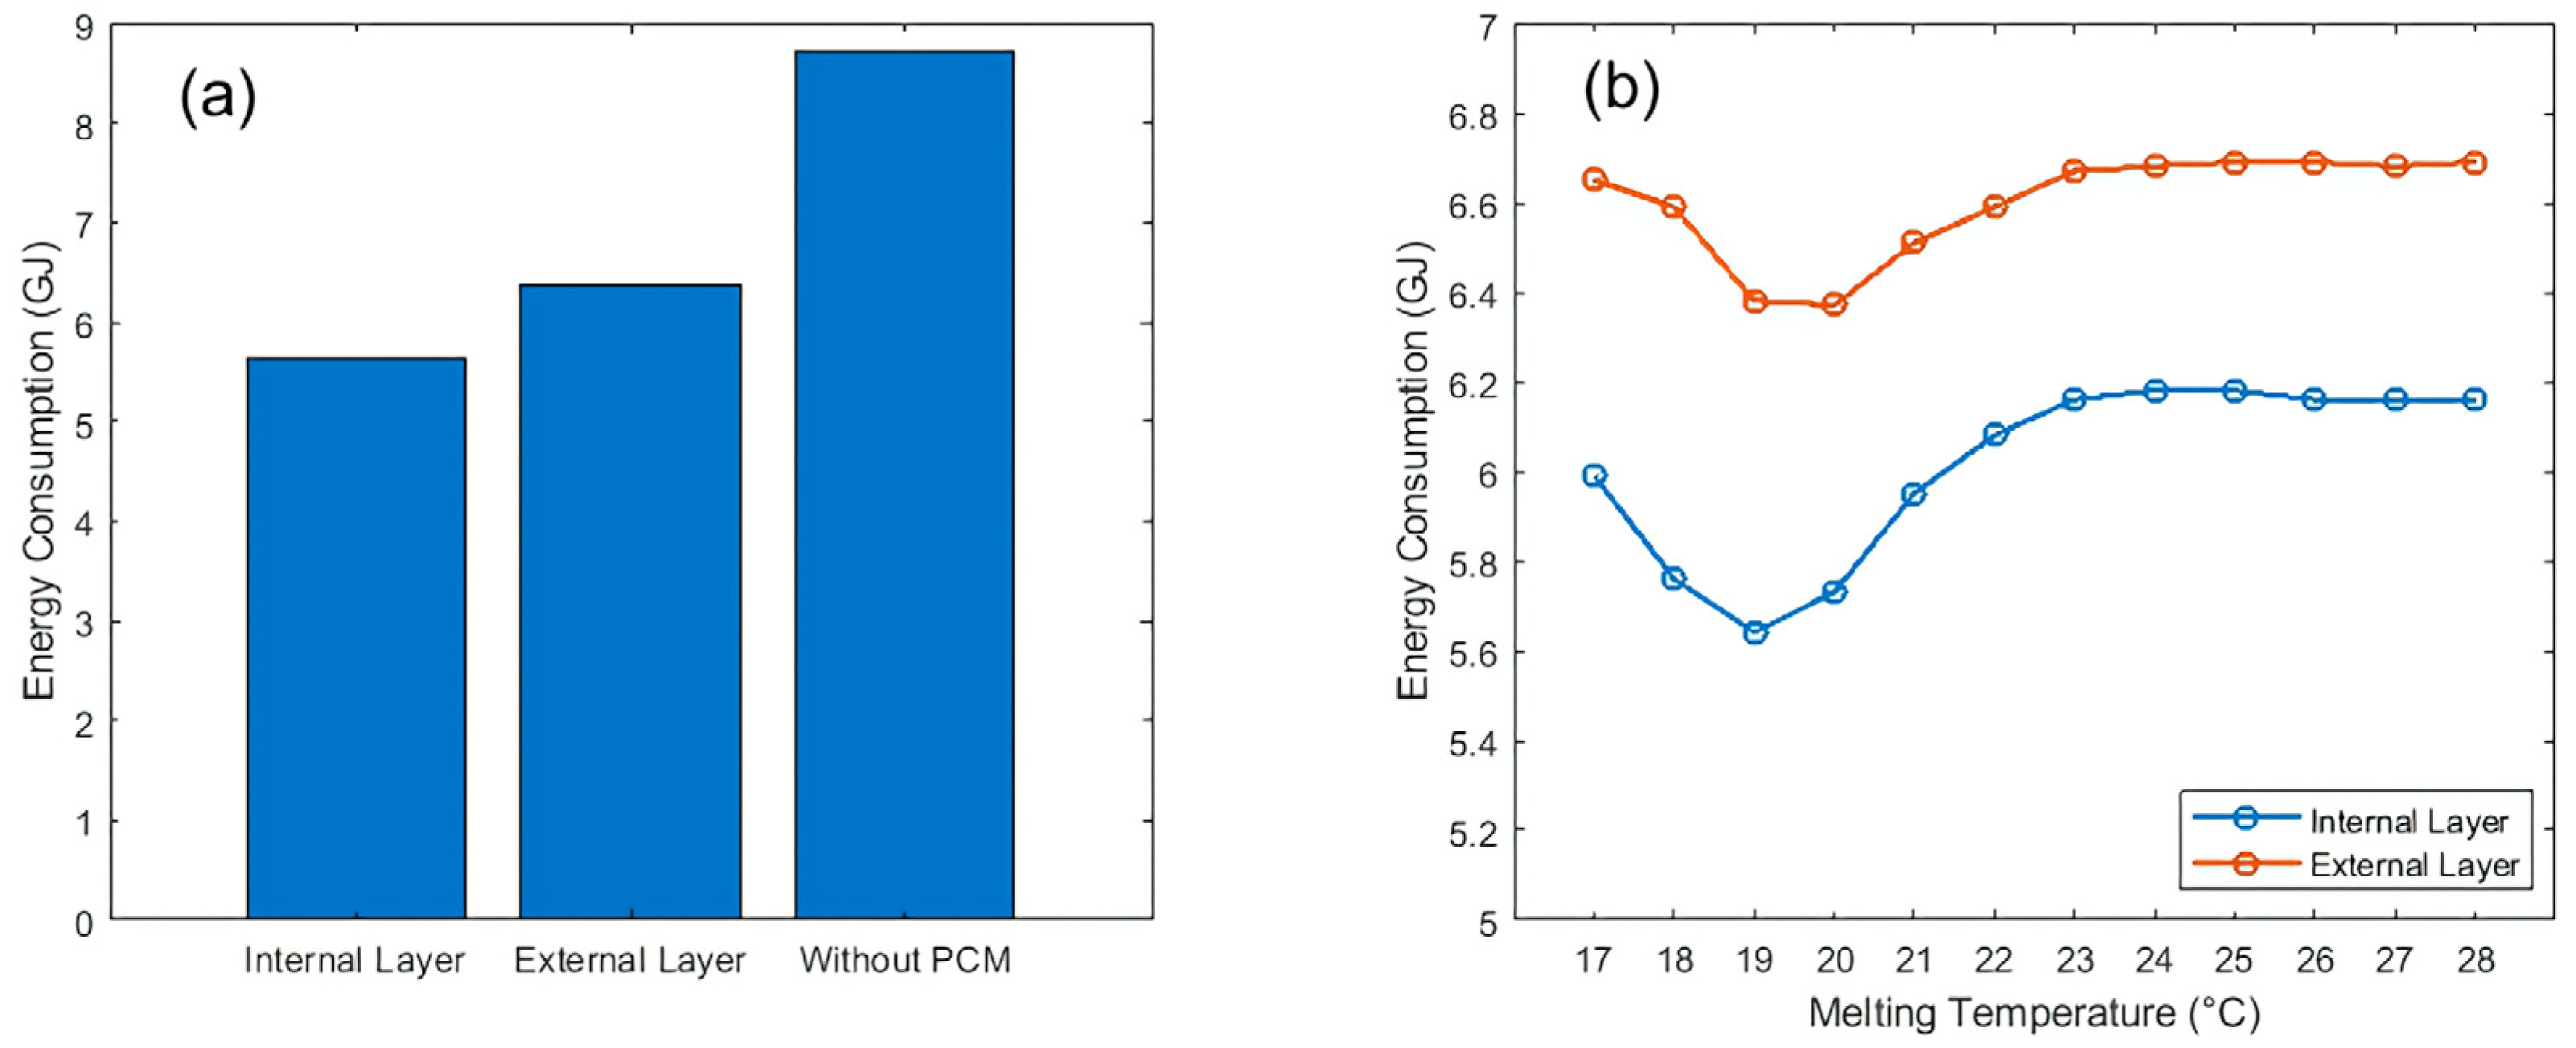
3.2.1. Position of PCMs
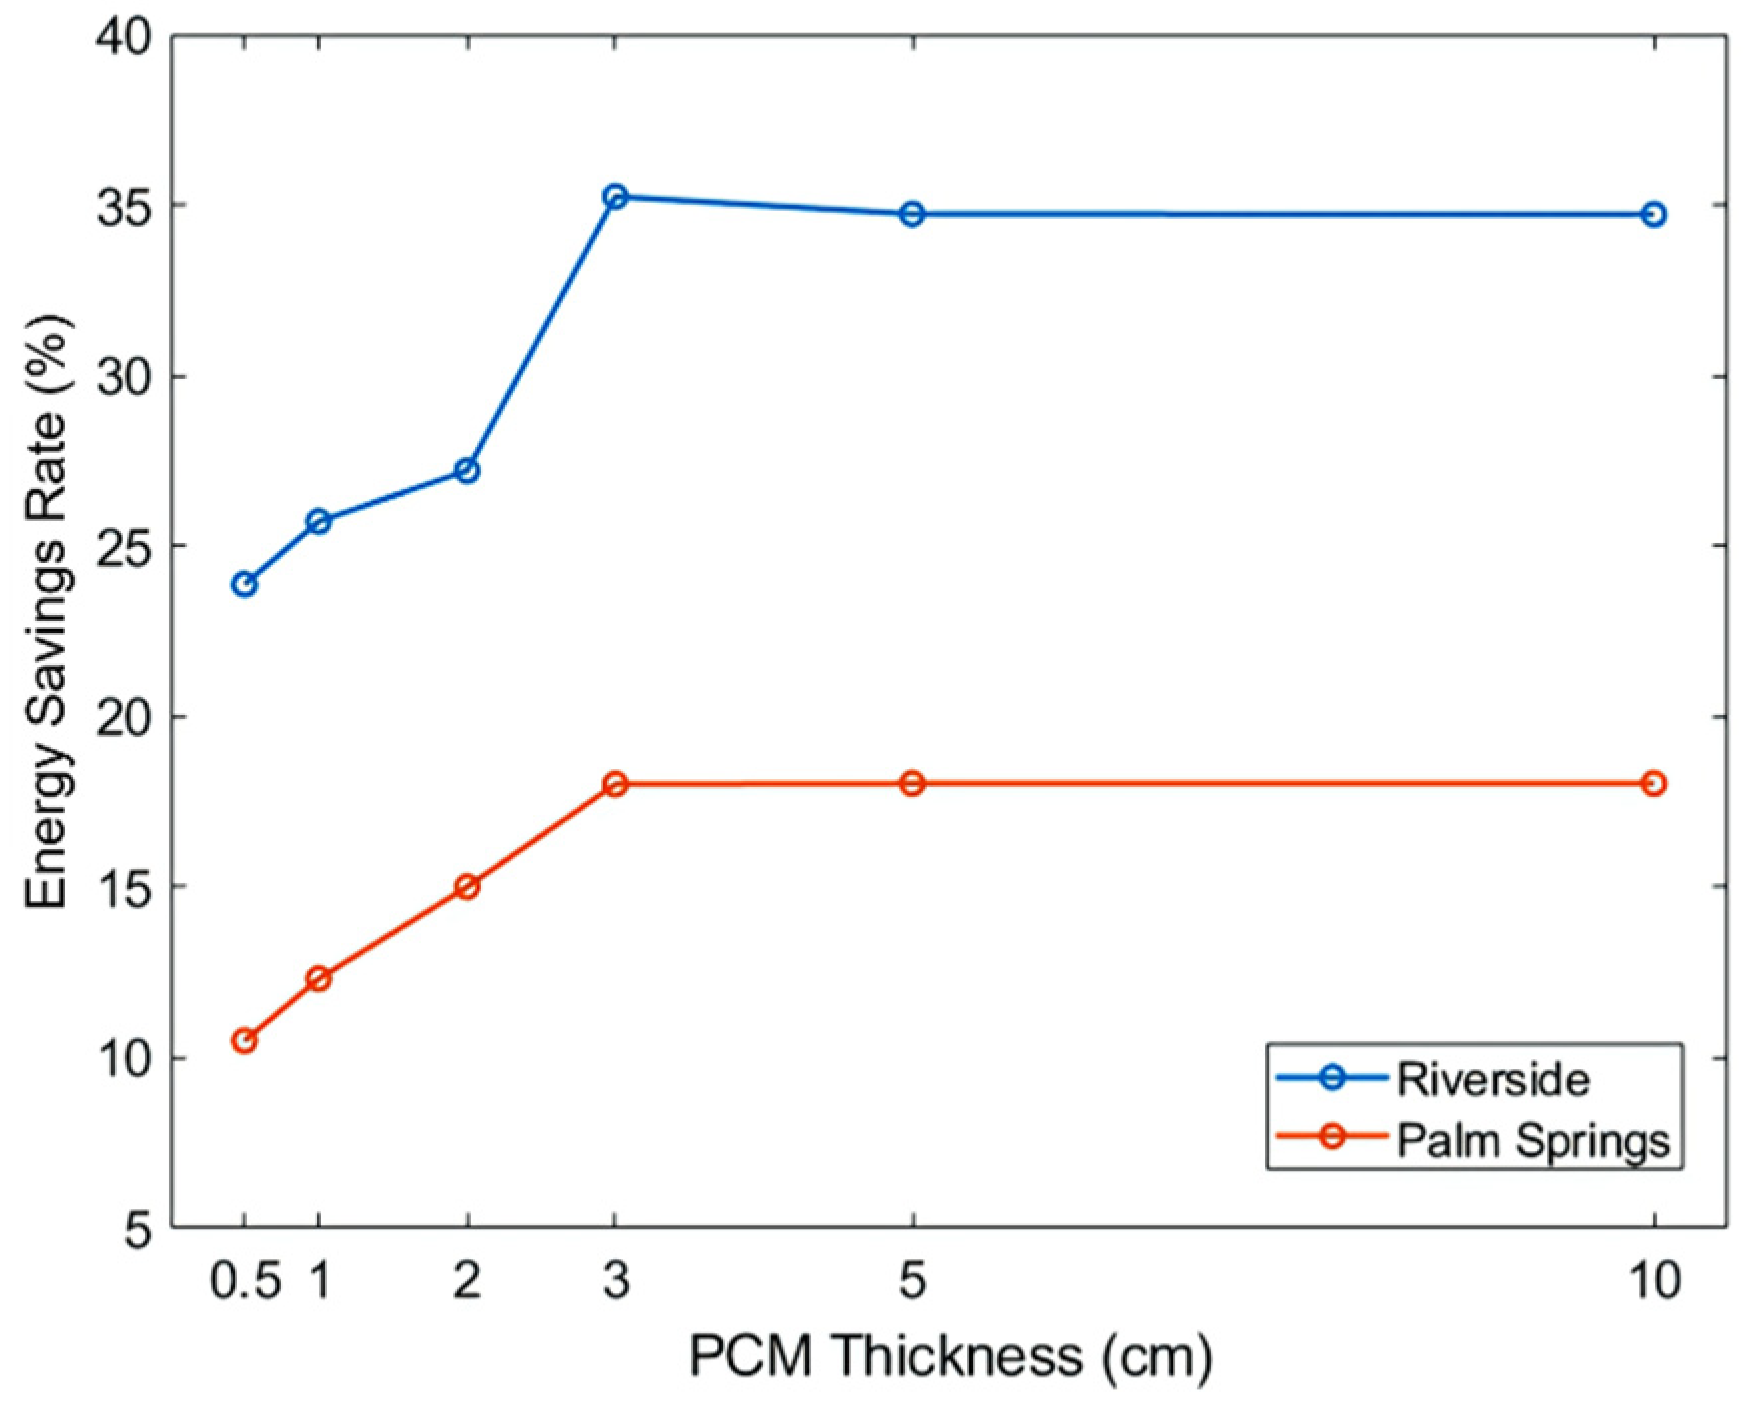
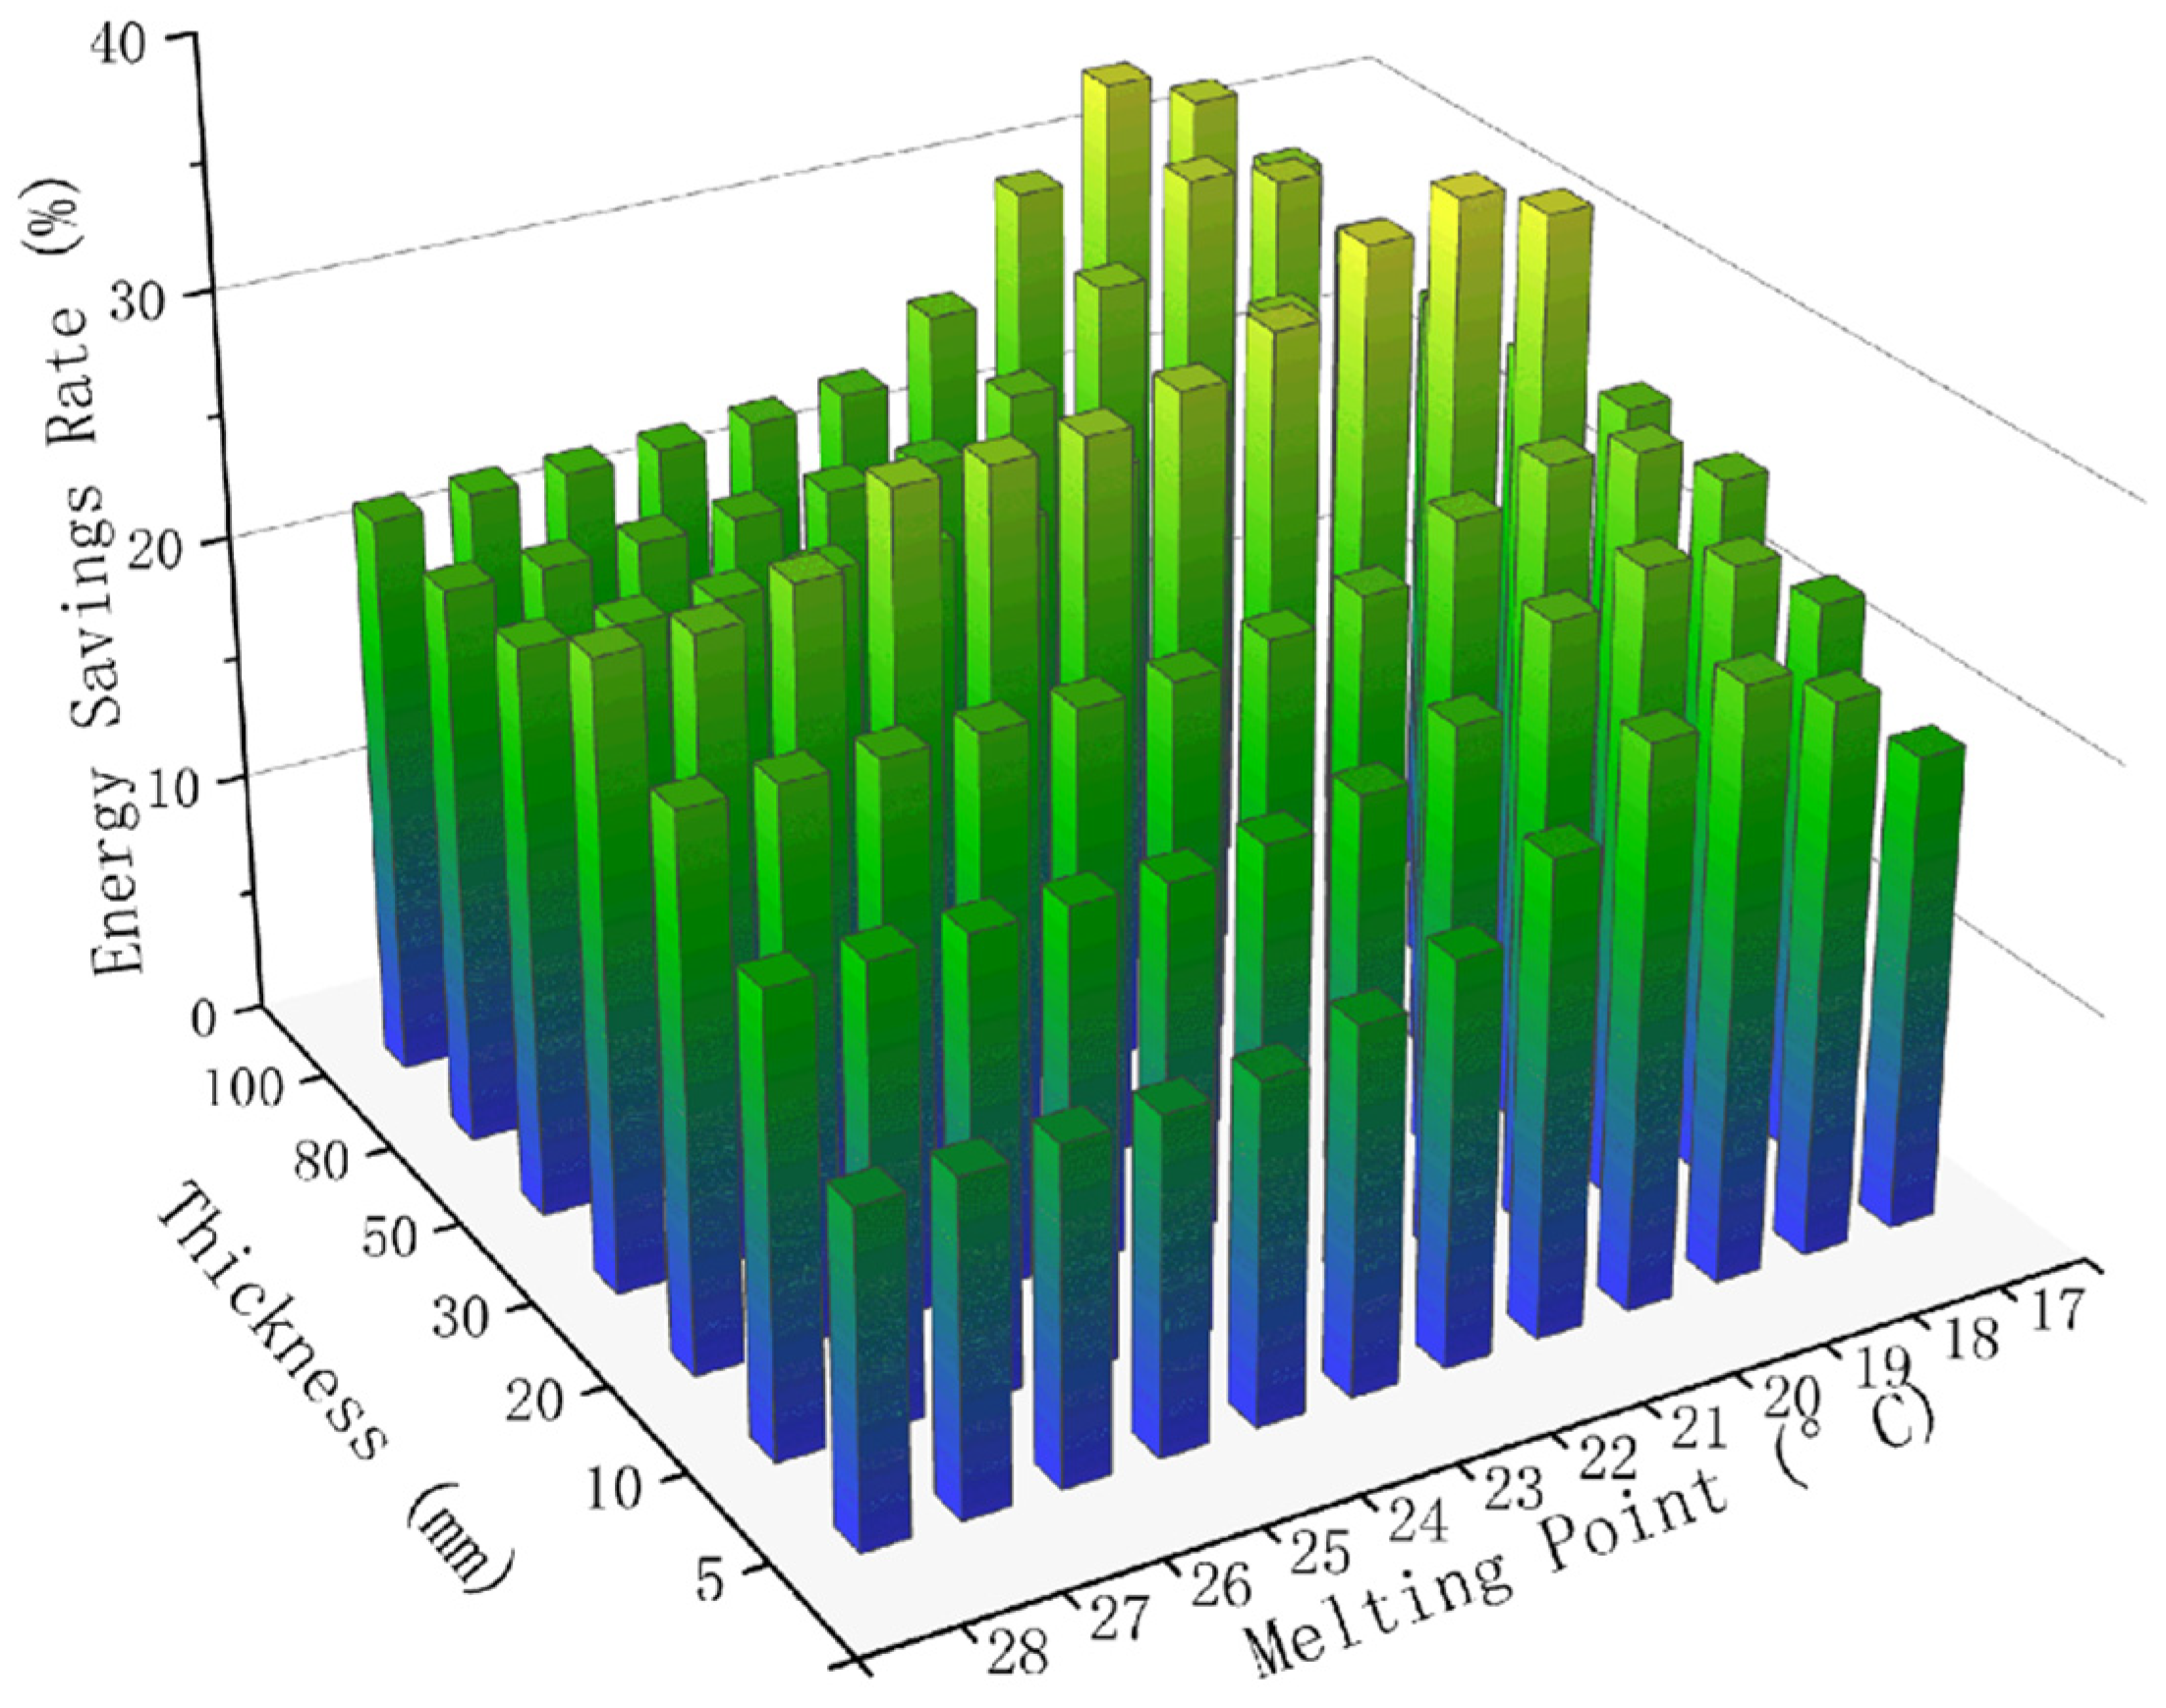
3.2.2. Thickness for Basic Method
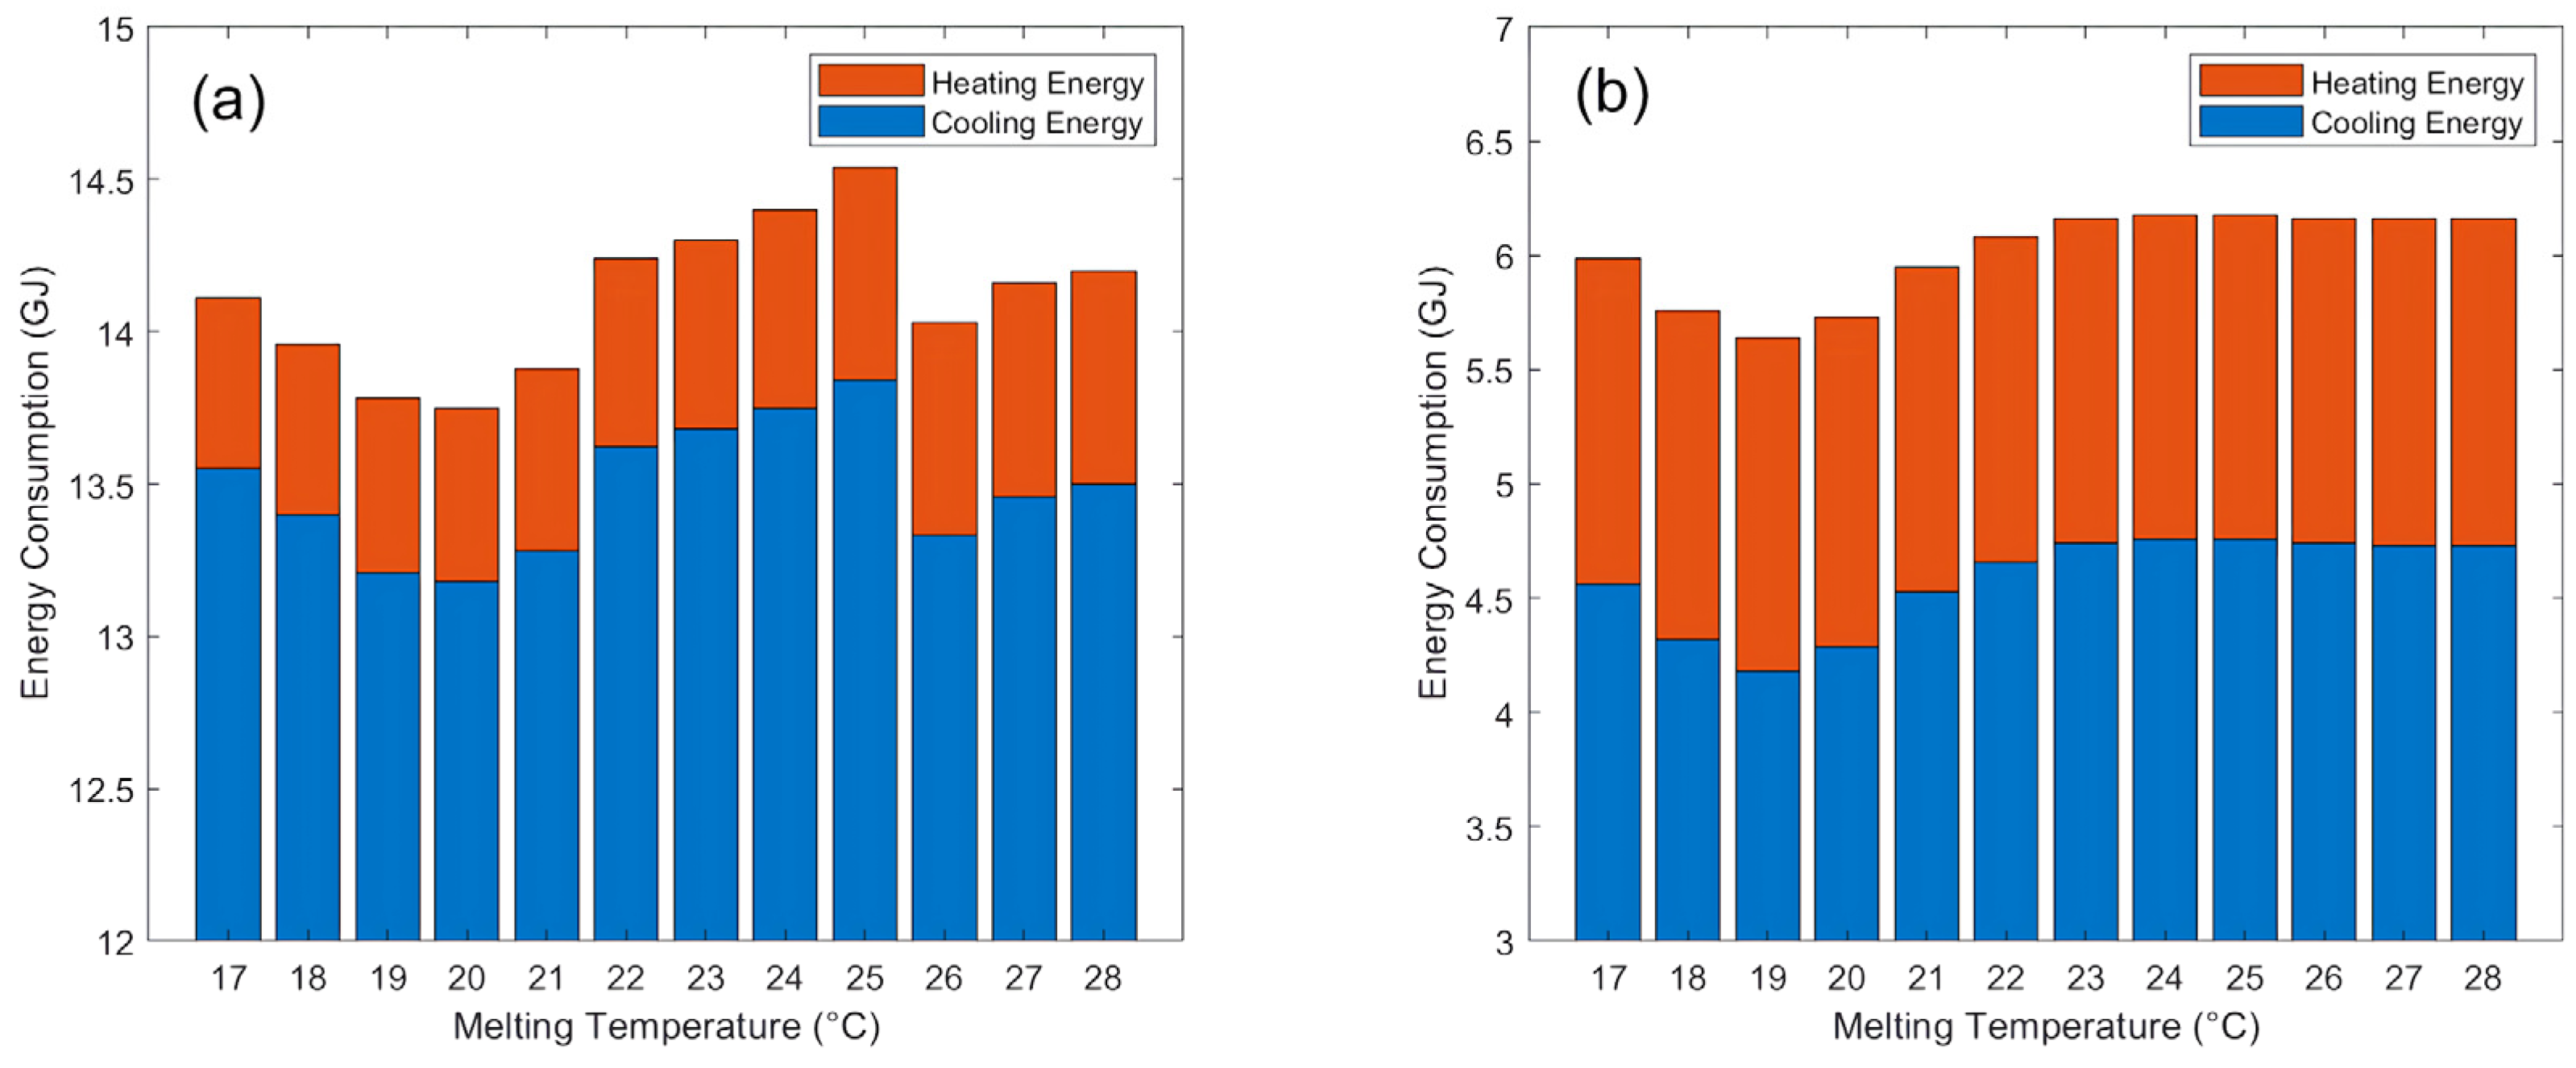
3.2.3. Melting Point for Basic Method
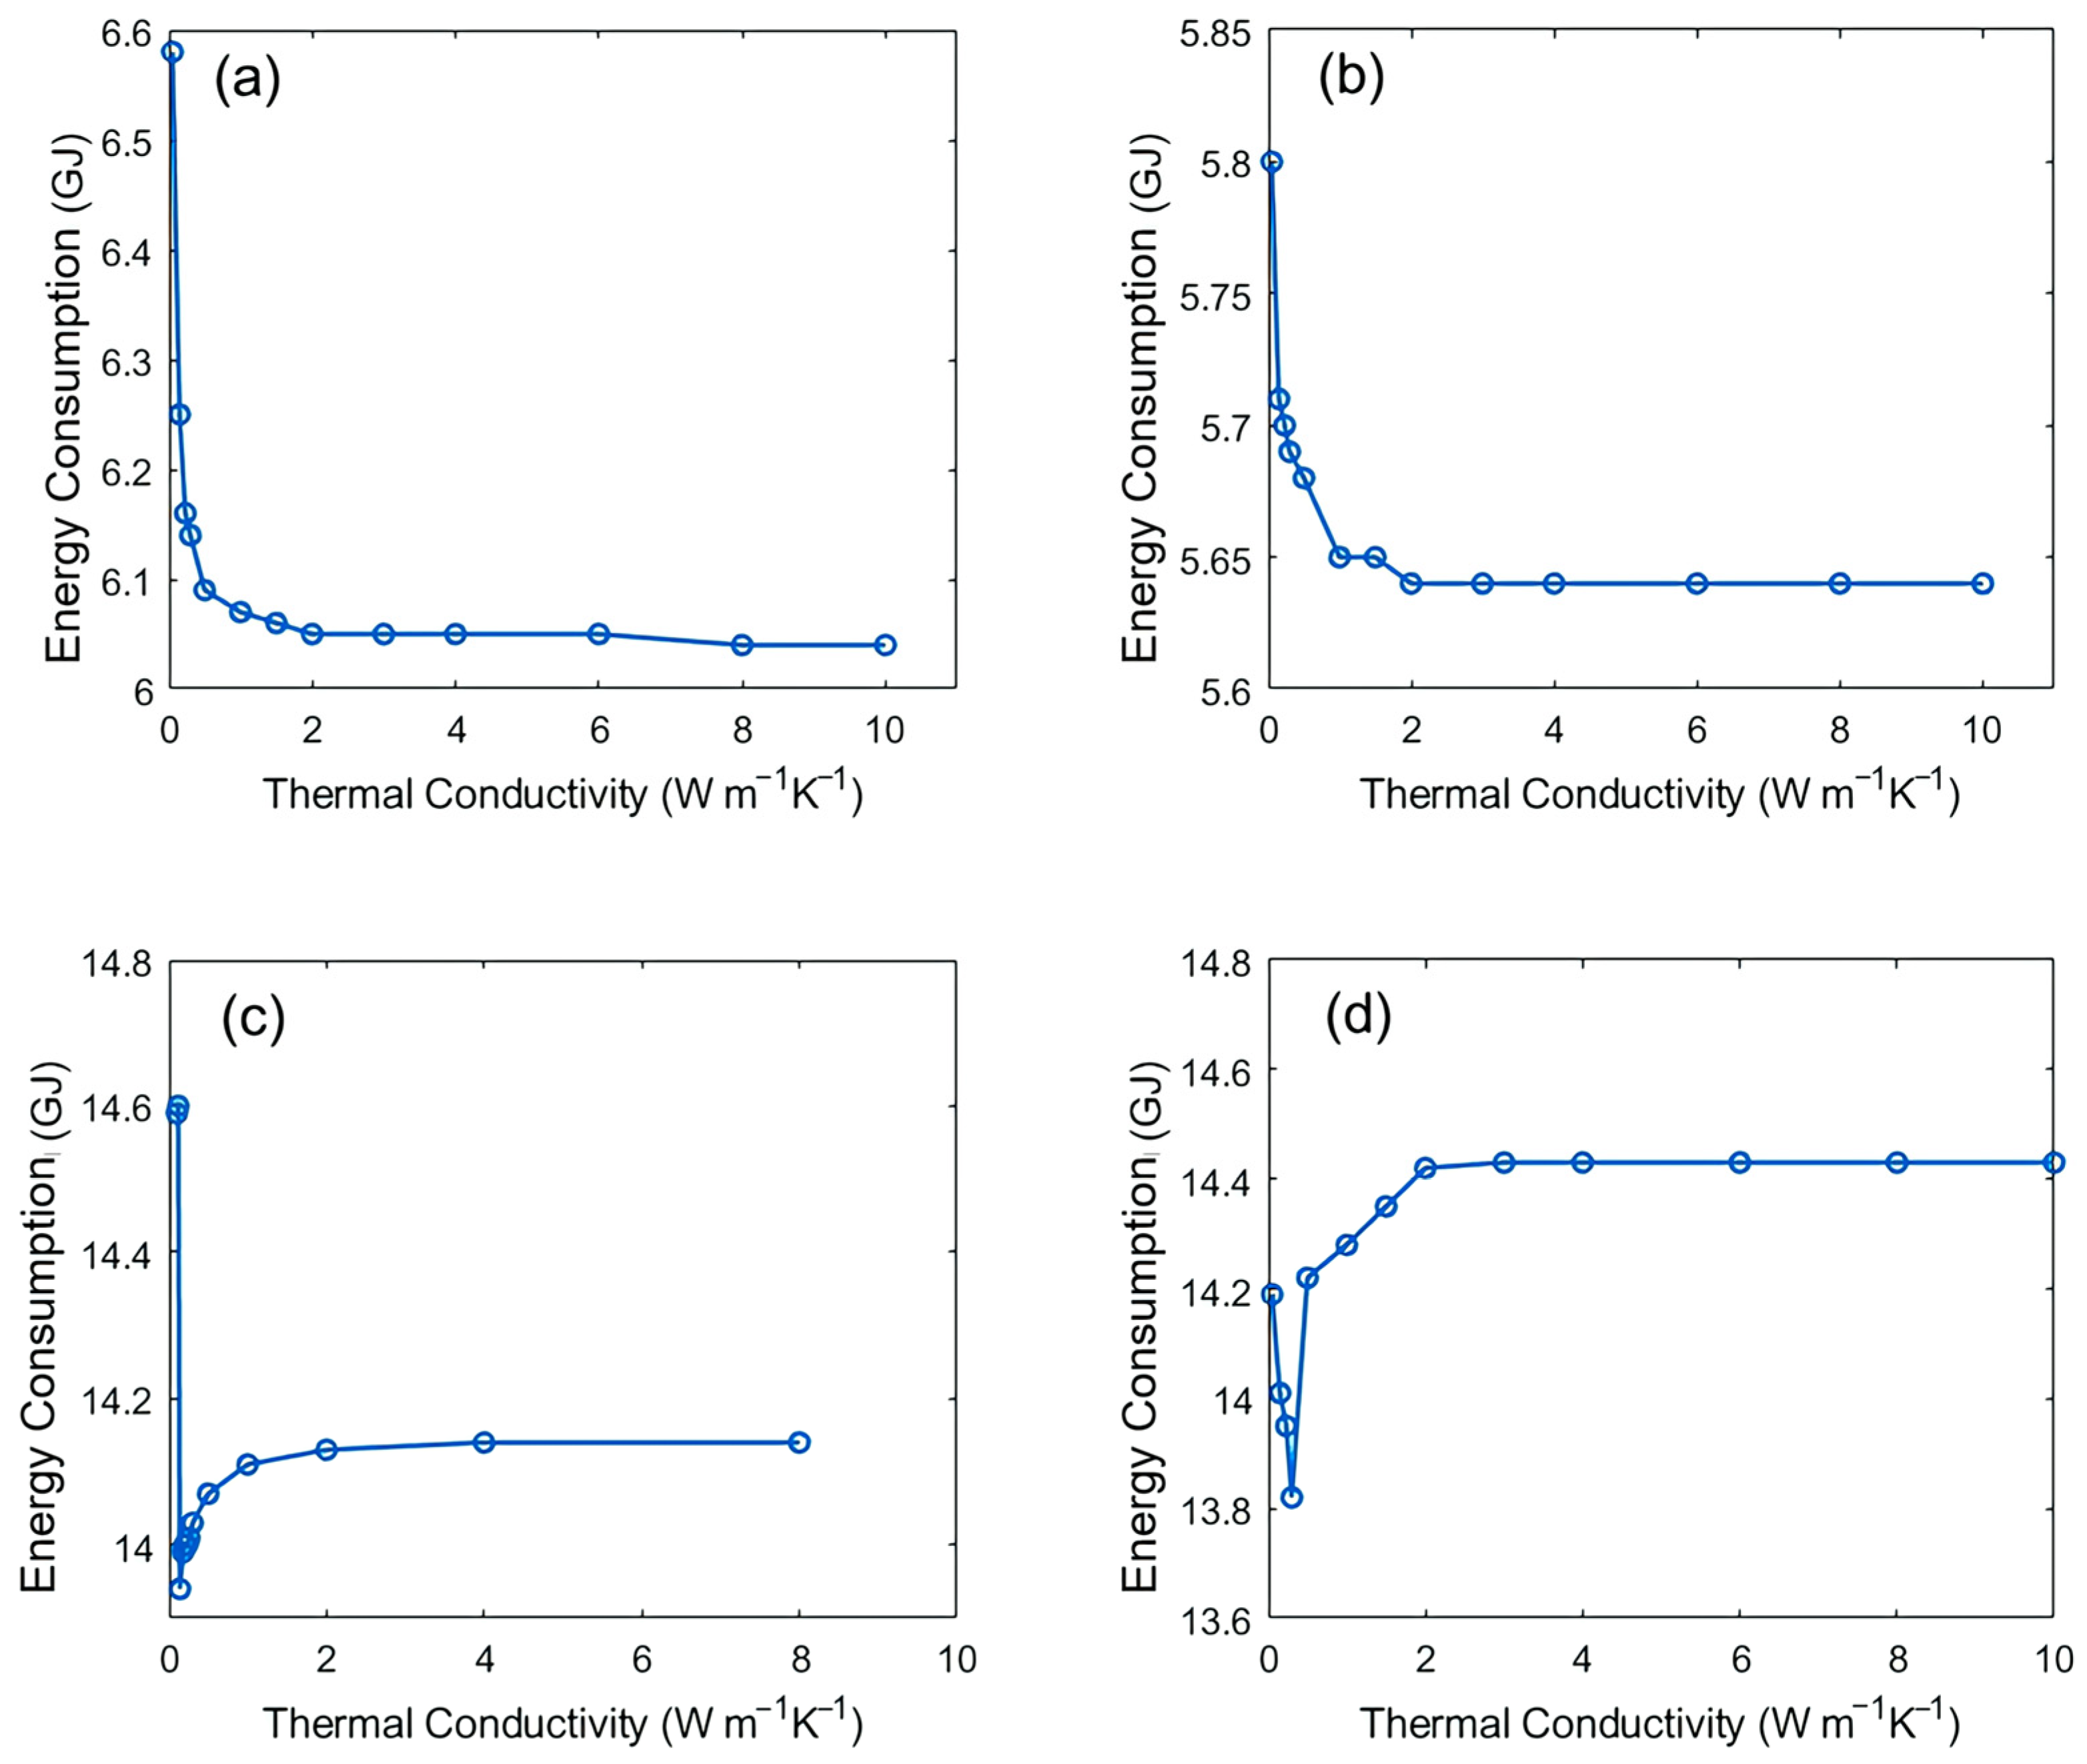
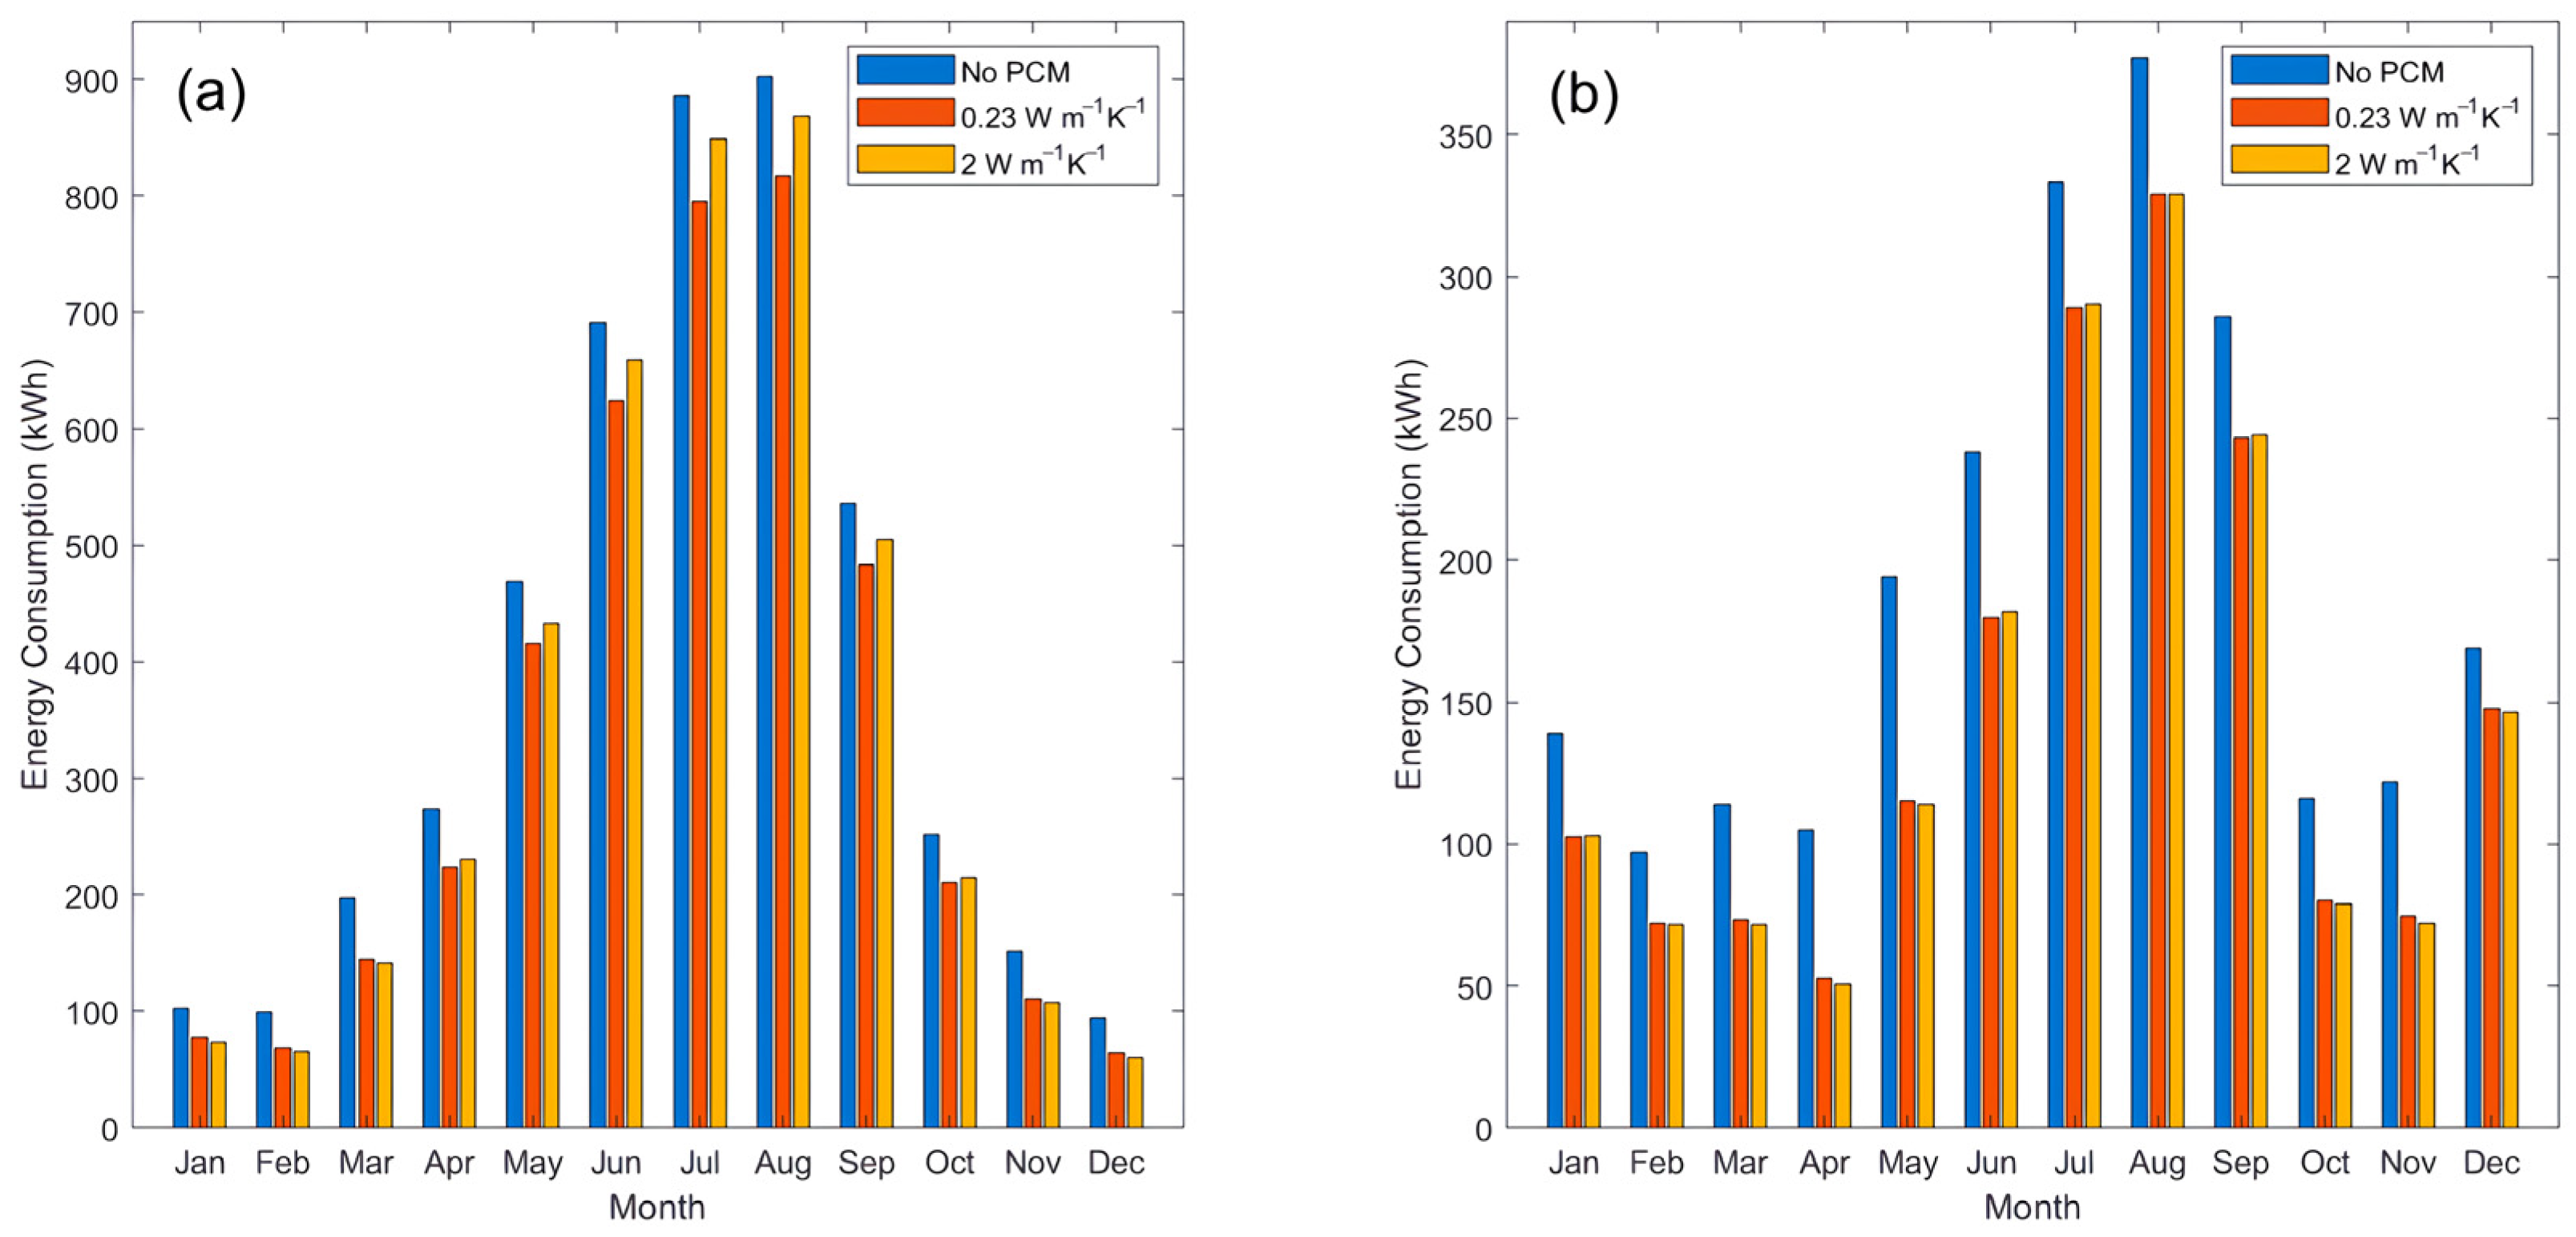
3.2.4. Thermal Conductivity for Basic Method
3.2.5. Basic Method Summary
3.3. Hysteresis Method Results
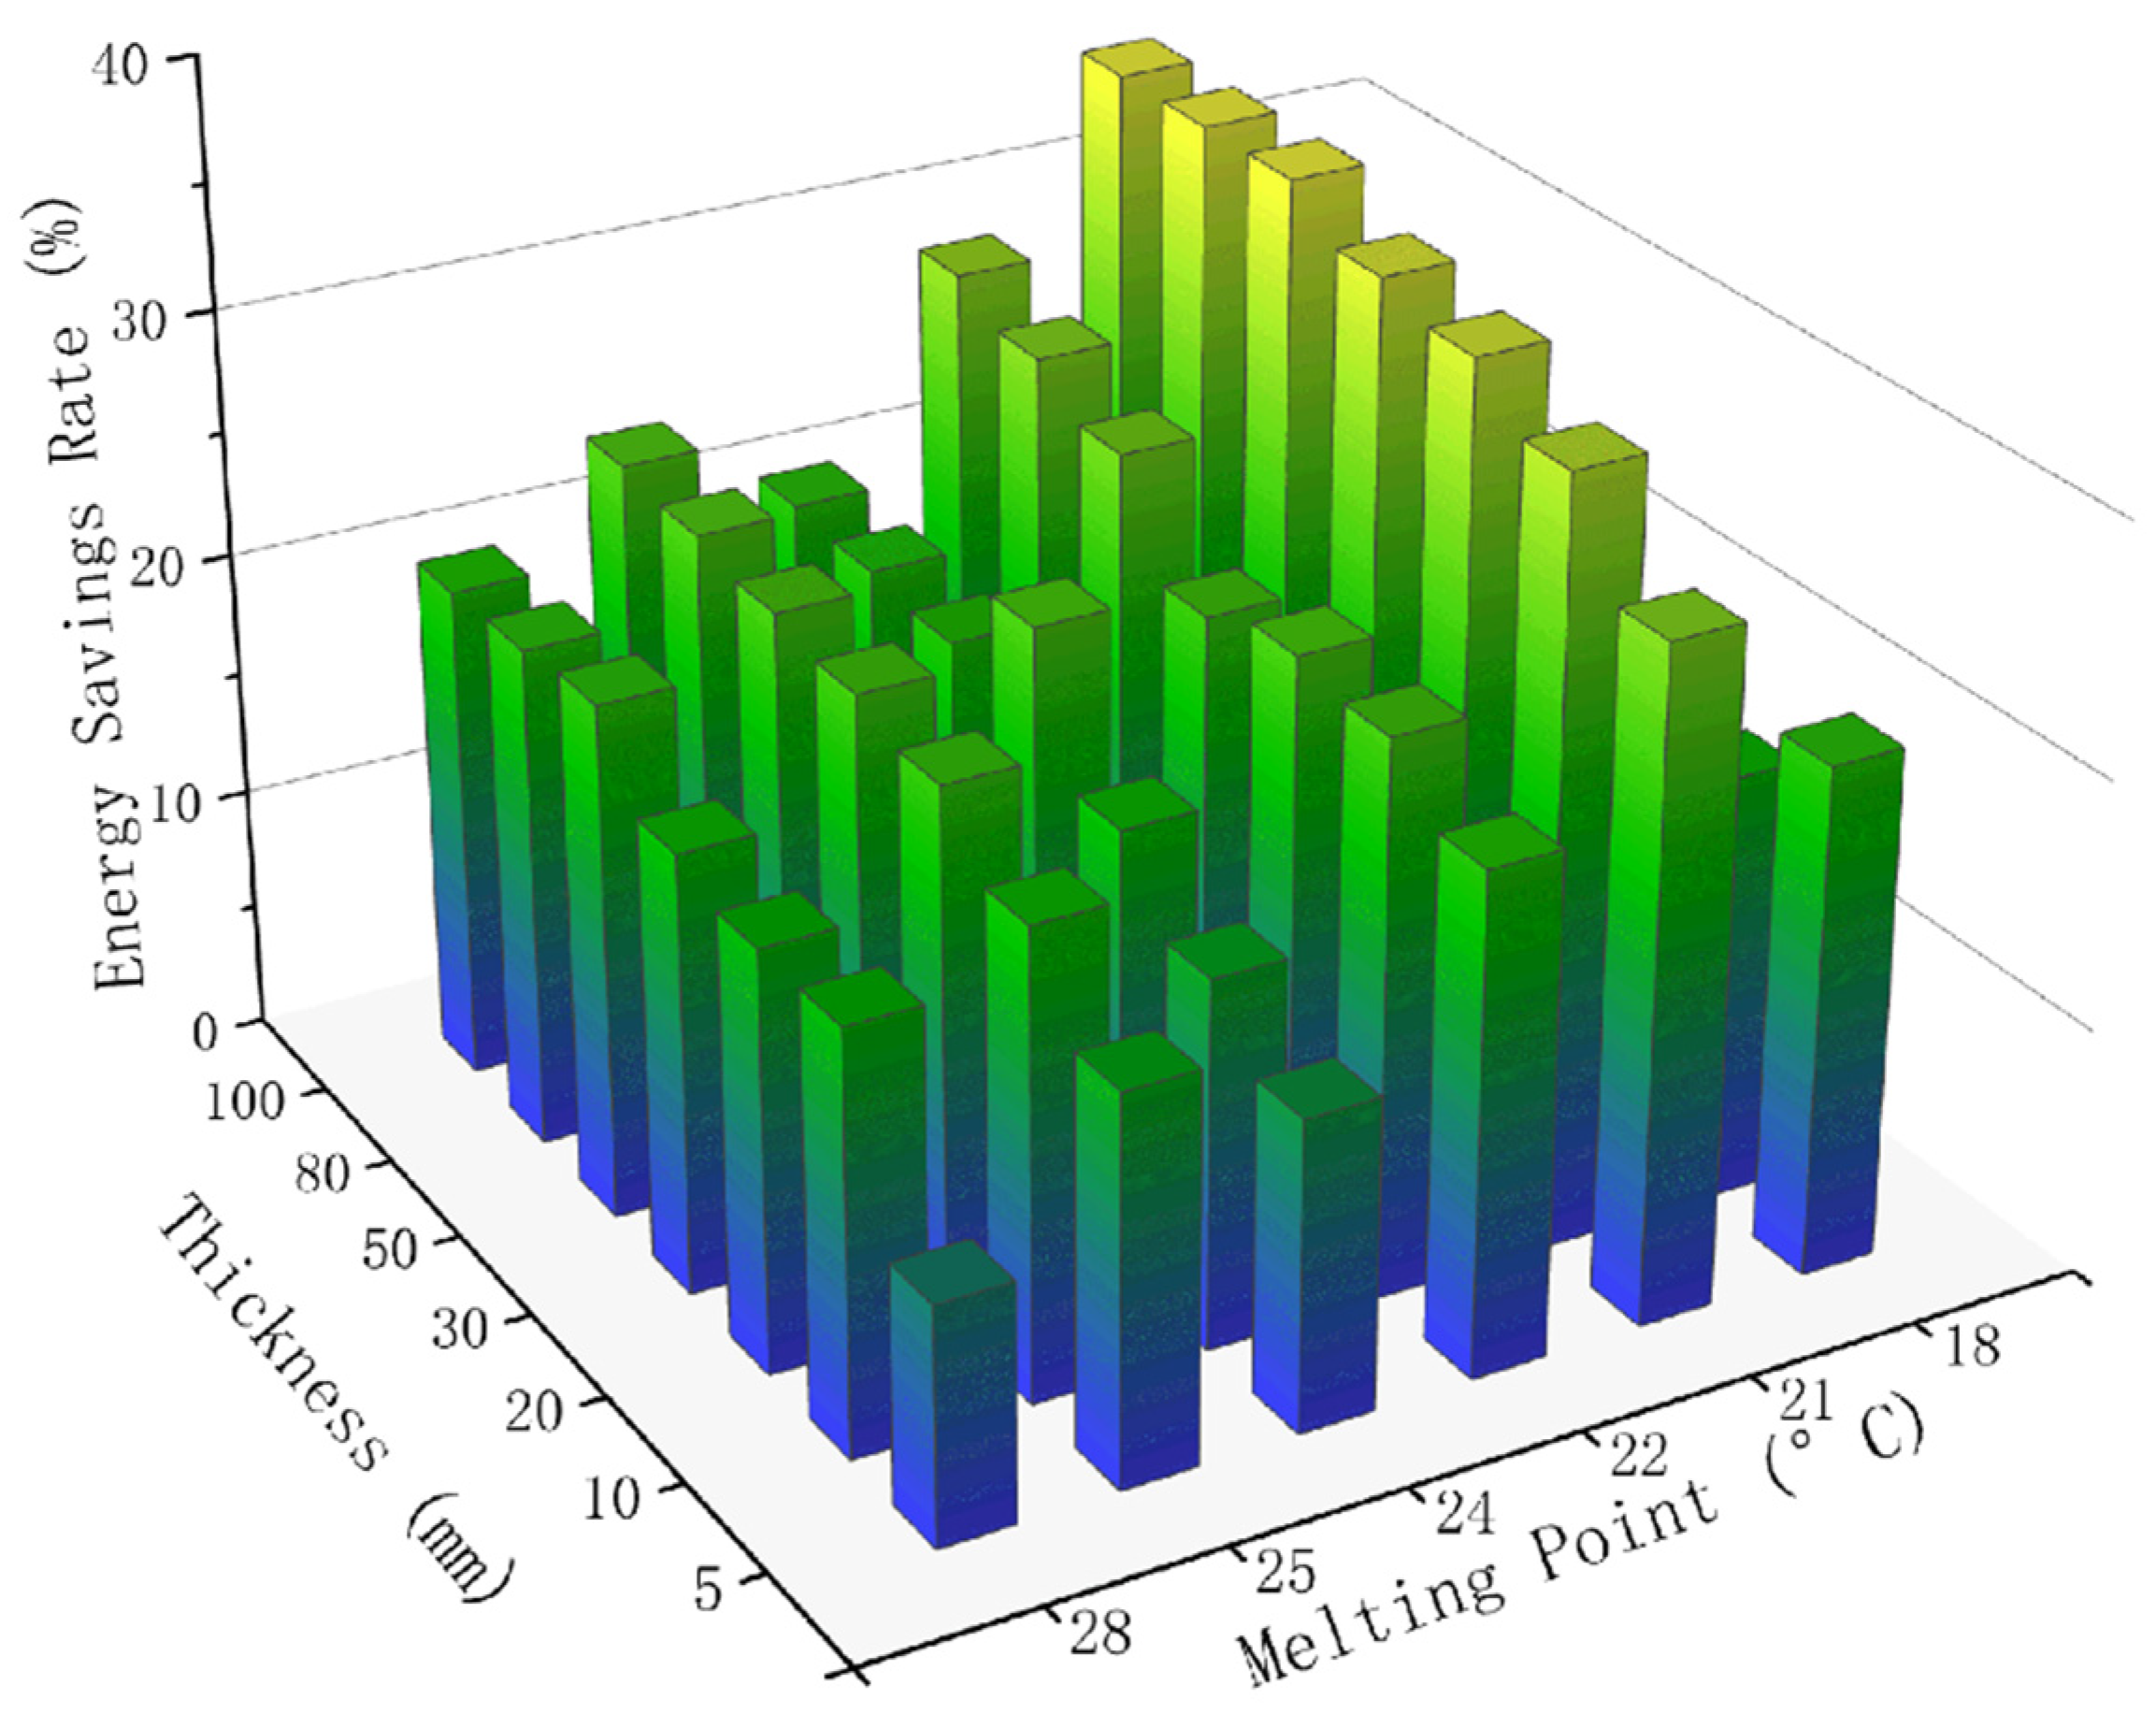
3.3.1. Thickness for Hysteresis Method
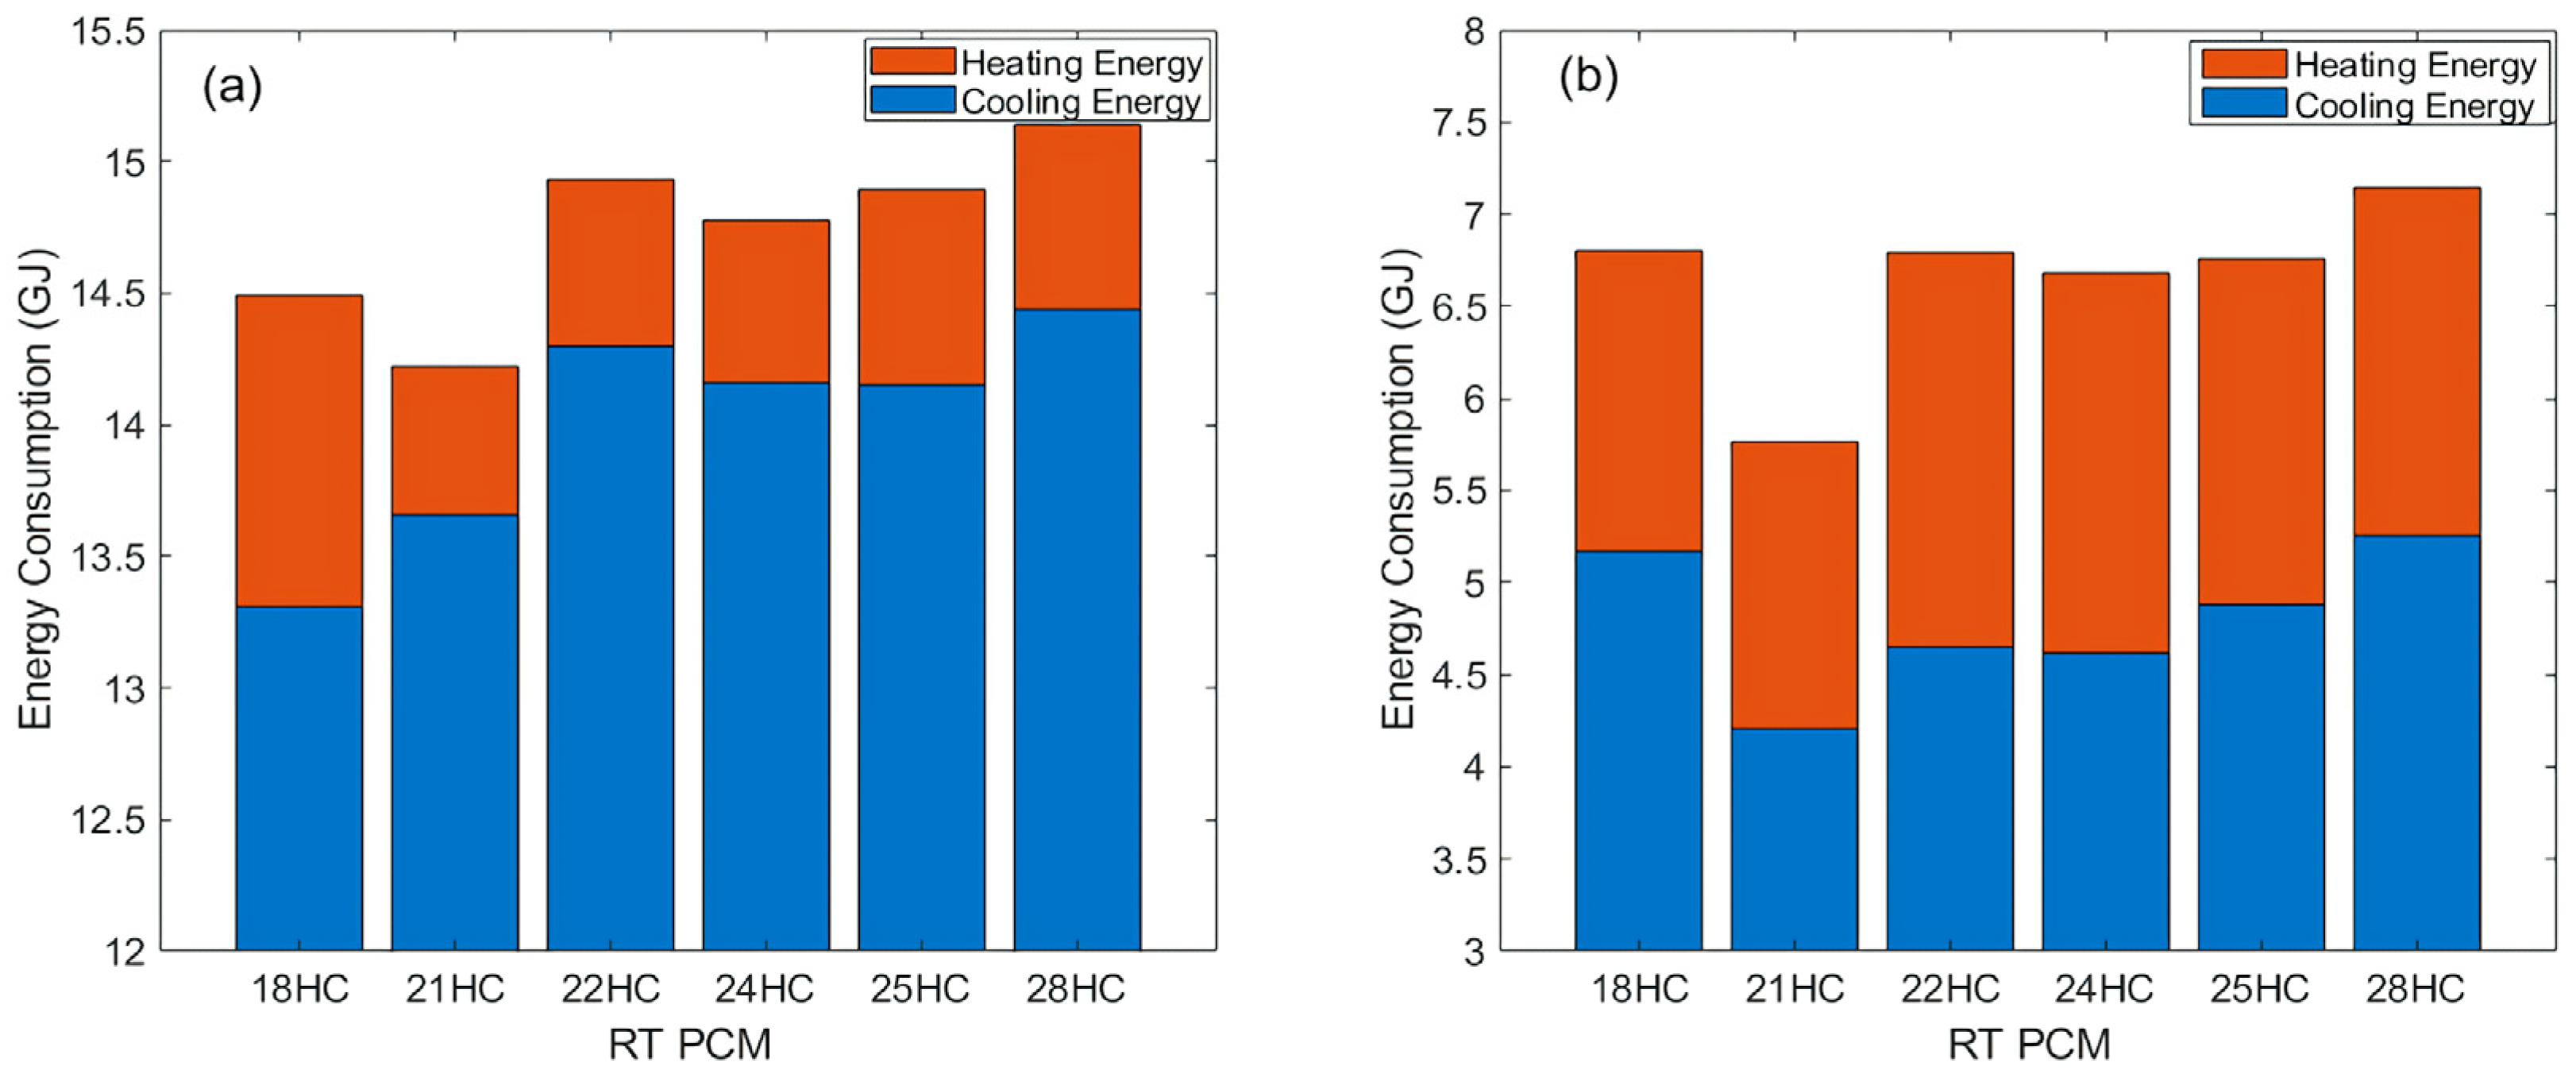
3.3.2. Melting Point for Hysteresis Method
3.3.3. Thermal Conductivity for Hysteresis Method
3.3.4. Hysteresis Method Summary
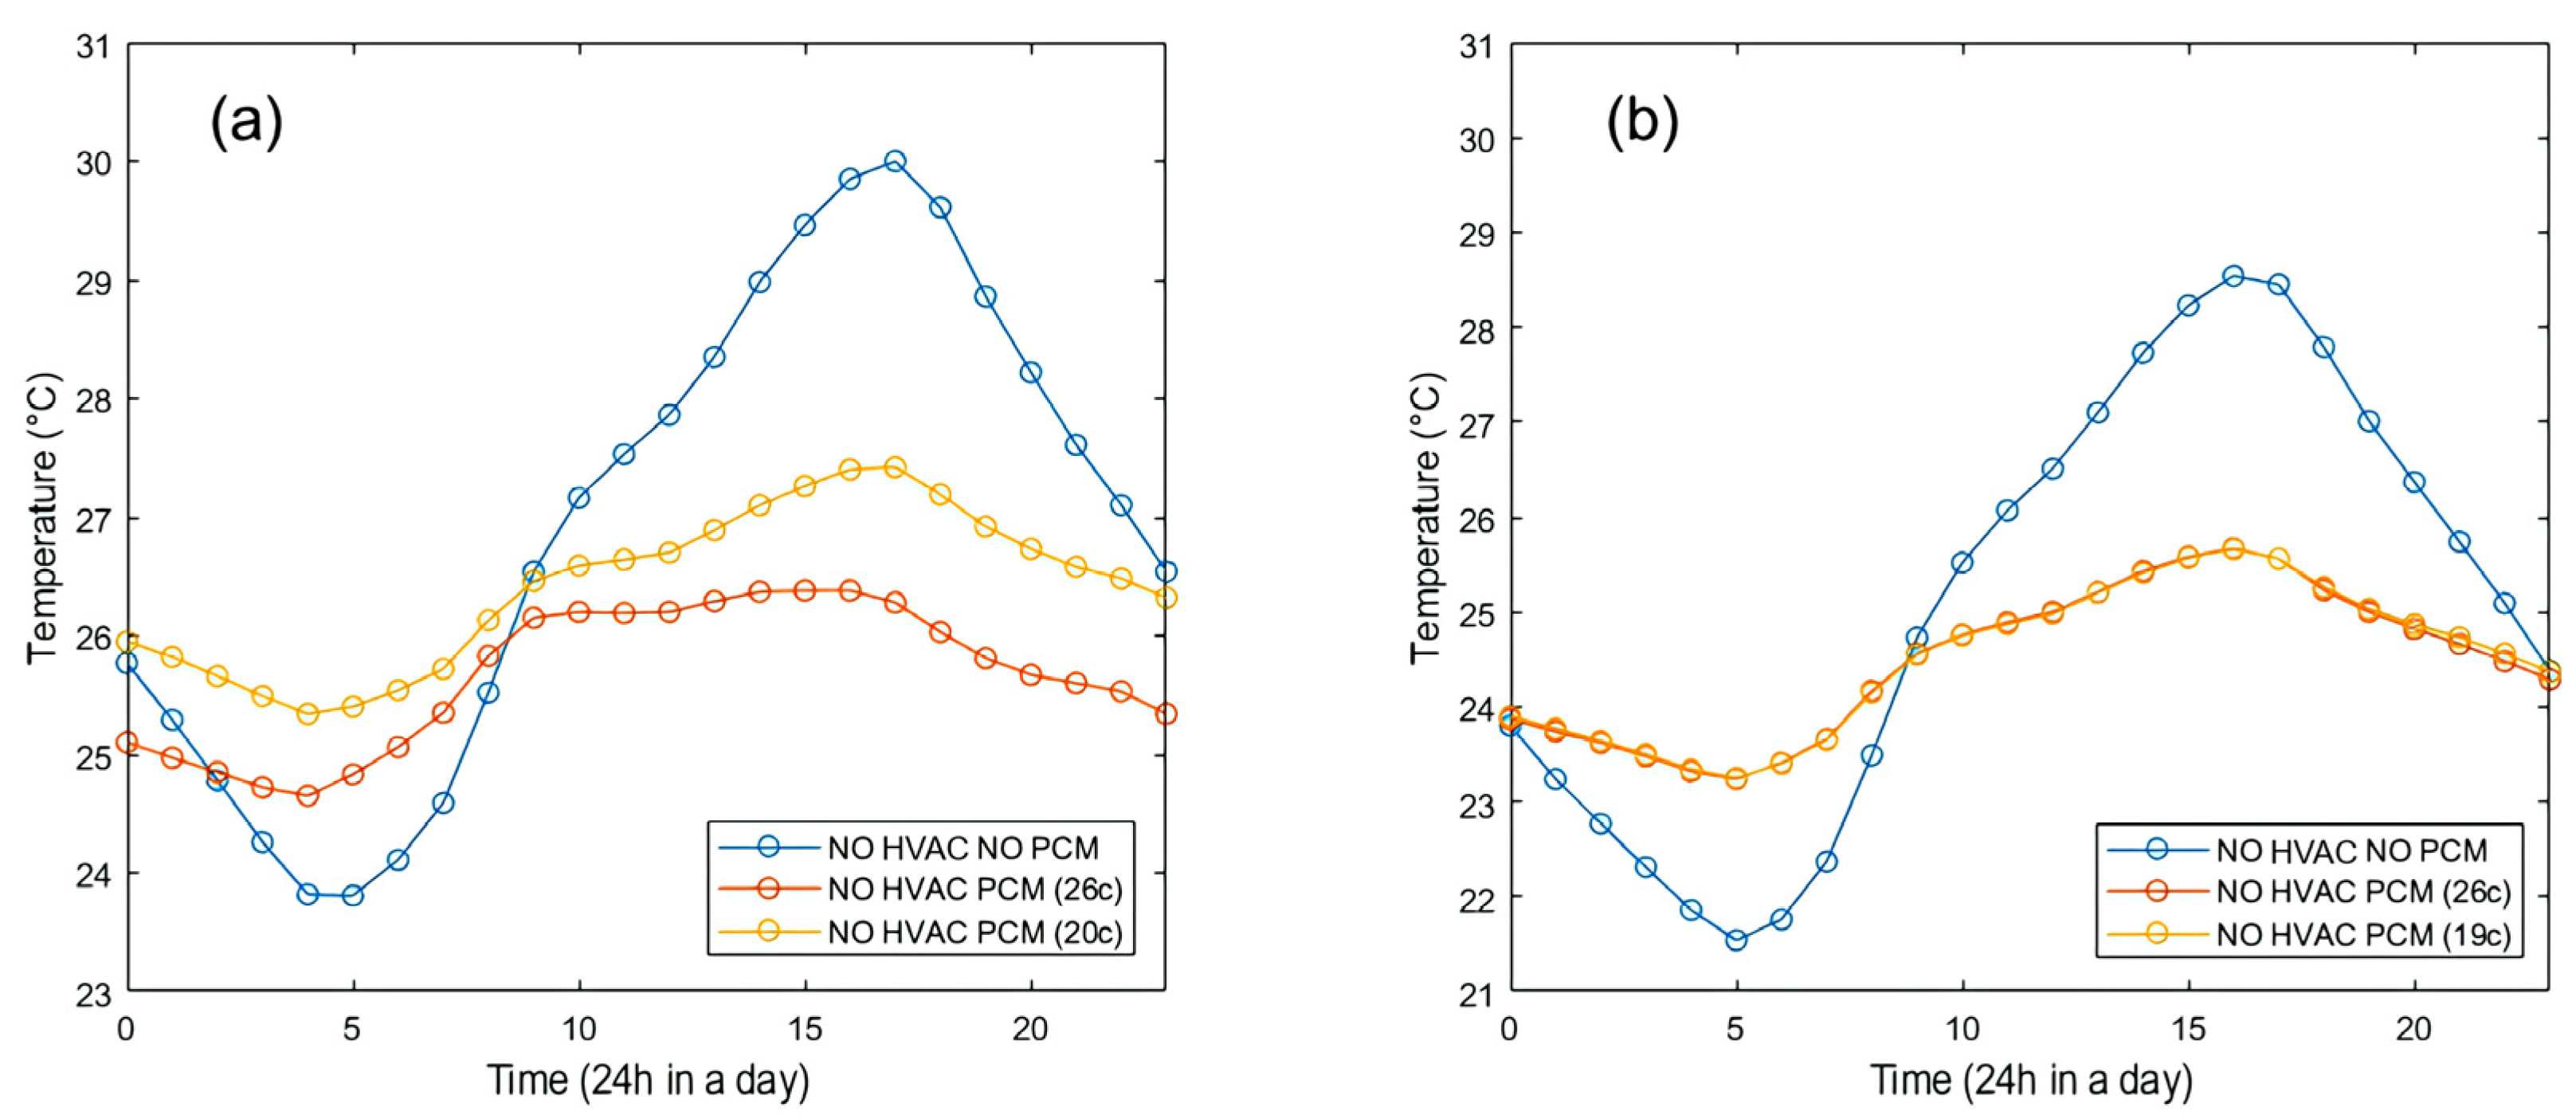
3.4. Daily In/Outside Naturally Ventilated Temperature
3.4.1. Basic Method
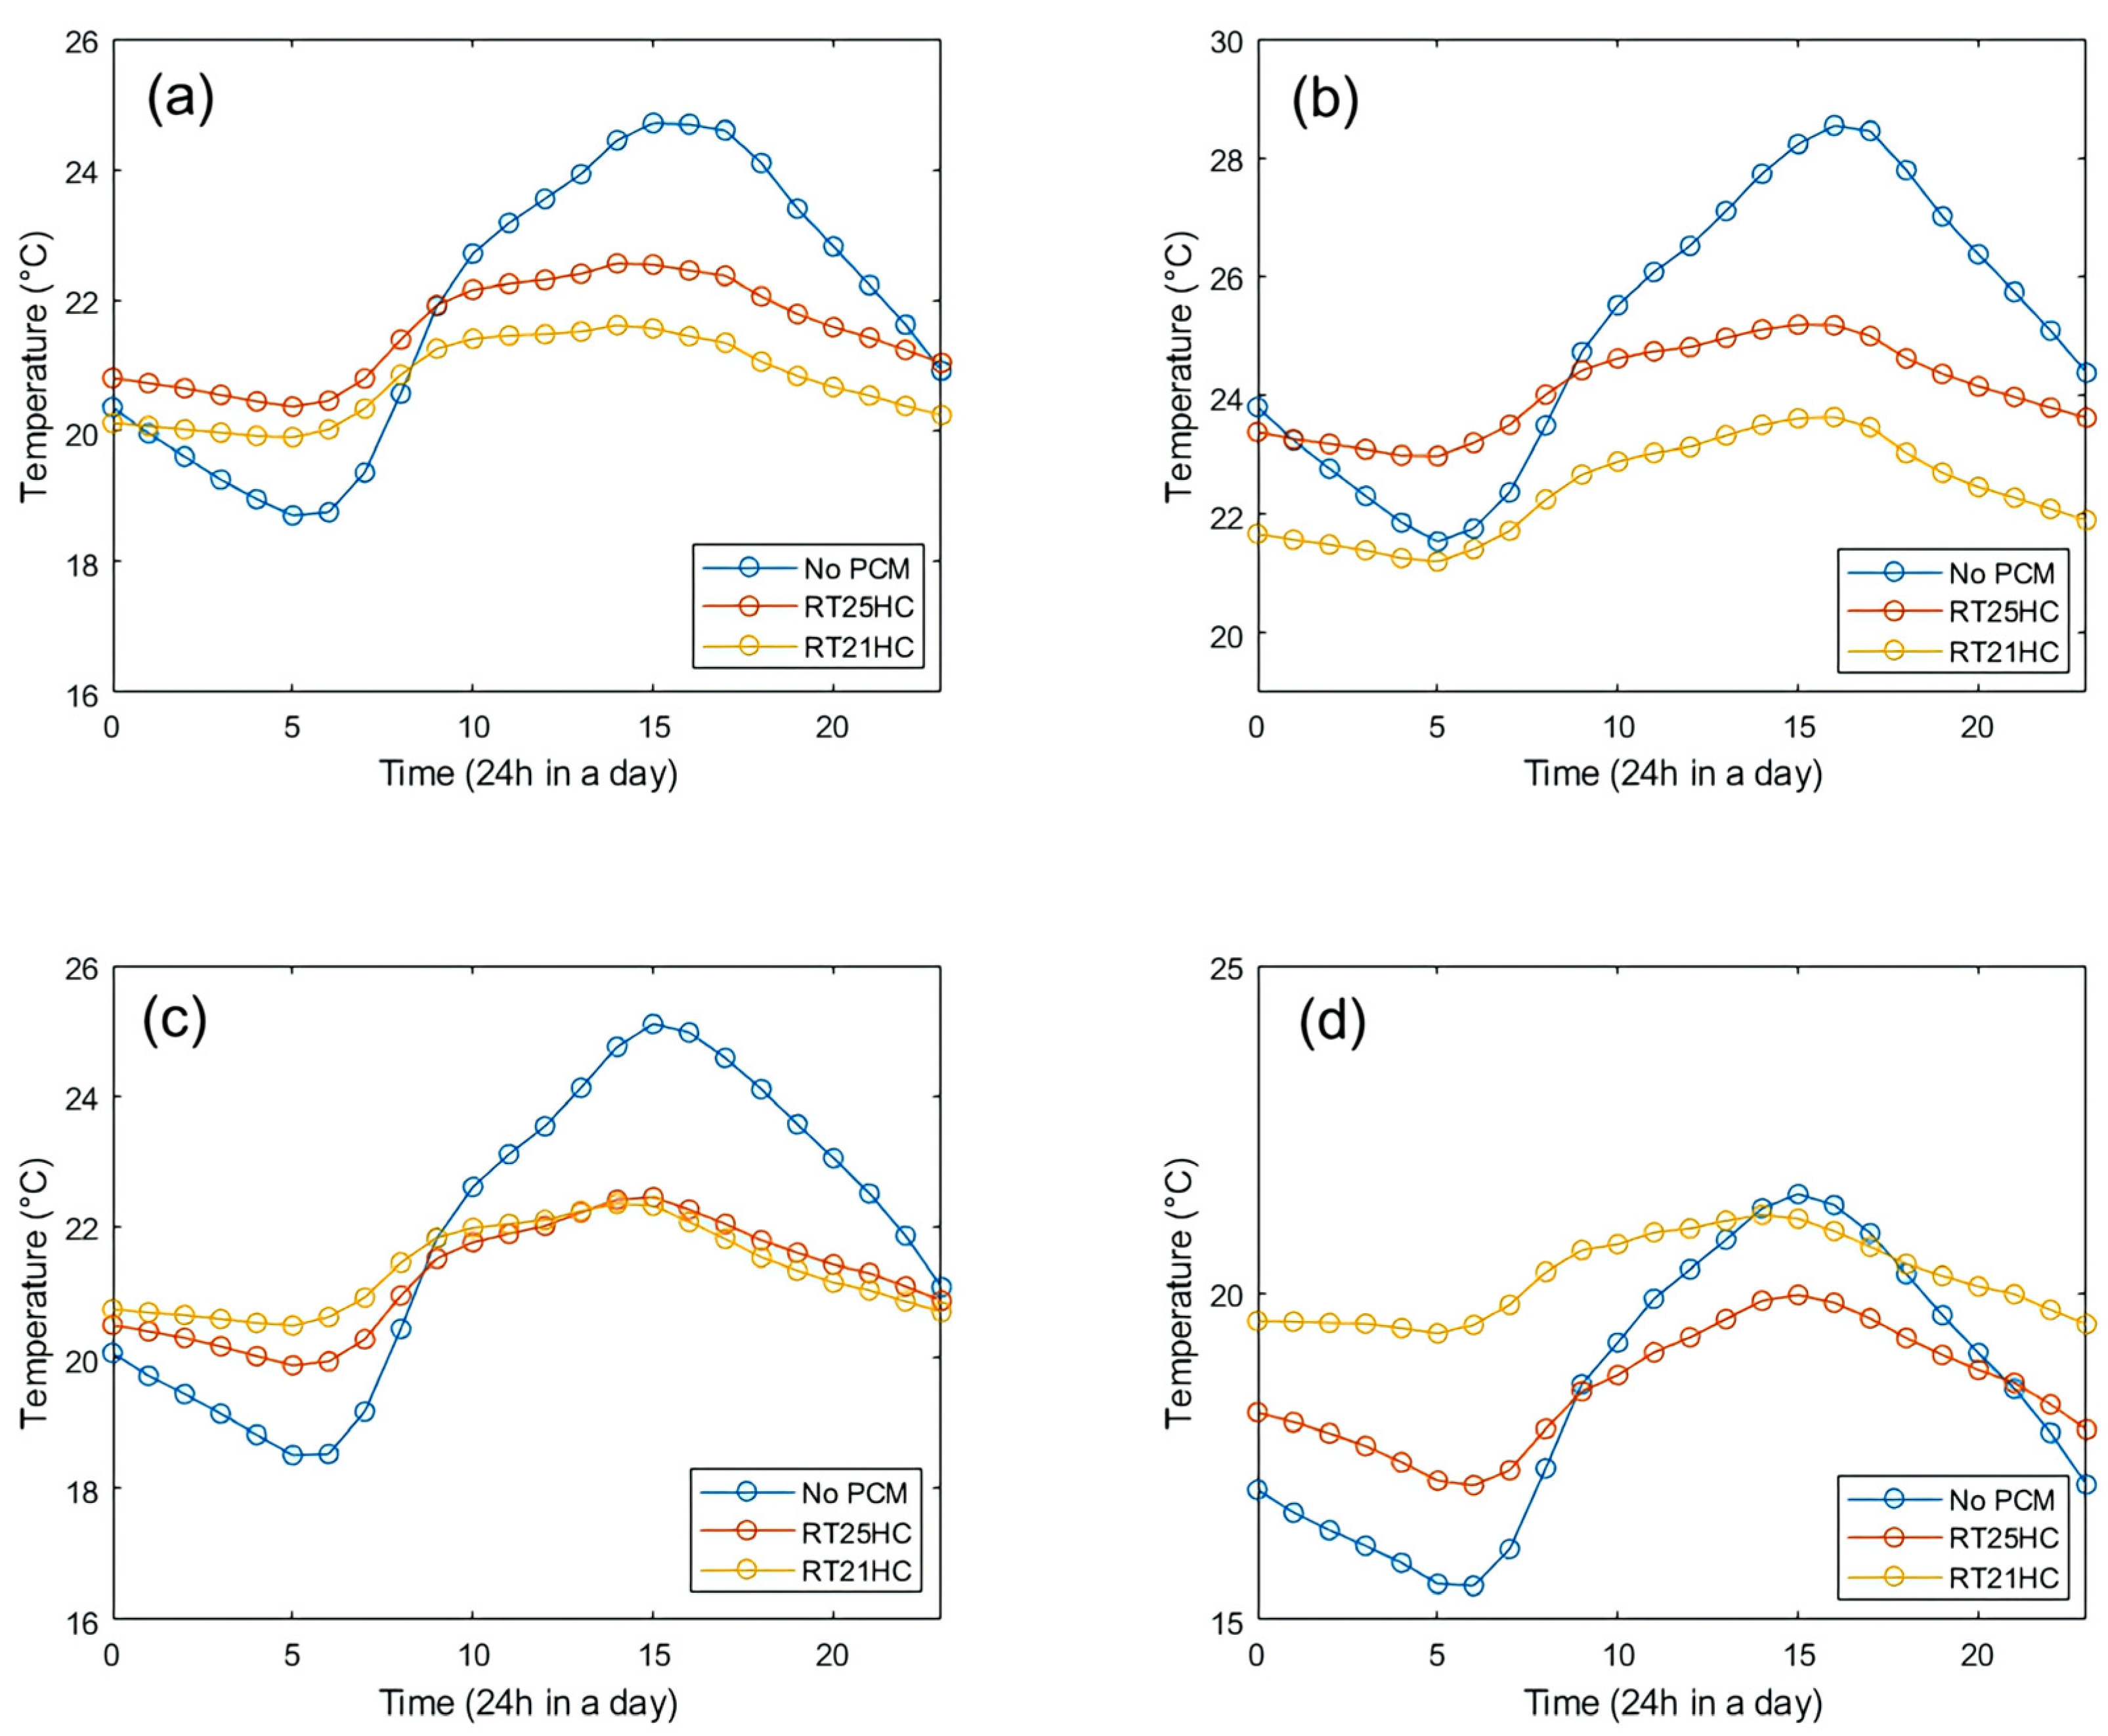
3.4.2. Hysteresis Method
3.5. Comparison Between Basic Method and Hysteresis Method
4. Conclusions
- The energy savings rate is higher when the PCM layer is installed on the interior side of the insulation layer.
- Continuously increasing the thickness of PCM does not improve energy efficiency and it reaches a critical point at a thickness of around 30 mm in Riverside.
- The results indicated that the optimal PCM melting point for the basic method is 19 °C in Riverside and 20 °C in Palm Springs. For the hysteresis method, the optimal PCM melting point is 21 °C for both Riverside and Palm Springs.
- Using a PCM with a melting point close to the indoor cooling and heating set temperature can lead to a higher energy savings rate, though this effect depends on the regional climate. Cities with lower temperatures and greater heating needs require PCMs with lower melting points.
- Increasing the thermal conductivity of PCMs can effectively reduce building energy consumption in Riverside by approximately 5%. However, further improvements in energy efficiency diminish beyond a certain threshold. In this study, the optimal thermal conductivity is determined to be around 2–3 W m−1 K−1.
- In extremely hot regions, such as Palm Springs, the energy savings rate of PCMs is significantly reduced. Conversely, in cooler areas, such as Riverside, using low-melting-point PCMs can more effectively regulate indoor temperatures during the heating season.
- The optimal parameters yielded a total annual energy savings rate of 35.24% in Riverside and 18.52% in Palm Springs using the basic method and 35.47% in Riverside and 22.13% in Palm Springs using the hysteresis method.
Author Contributions
Funding
Institutional Review Board Statement
Informed Consent Statement
Data Availability Statement
Conflicts of Interest
References
- Total End-Use Sector Energy Consumption Estimates. Available online: https://www.eia.gov/state/seds/seds-data-complete.php?sid=US#Consumption (accessed on 28 June 2024).
- U.S. Energy Information Administration State Energy Data System. Available online: http://www.eia.gov/state/seds (accessed on 27 June 2024).
- Garg, H.P.; Mullick, S.C.; Bhargava, A.K. Sensible Heat Storage. In Solar Thermal Energy Storage; Springer: Dordrecht, The Netherlands, 1985; pp. 82–153. [Google Scholar] [CrossRef]
- Airò Farulla, G.; Cellura, M.; Guarino, F.; Ferraro, M. A Review of Thermochemical Energy Storage Systems for Power Grid Support. Appl. Sci. 2020, 10, 3142. [Google Scholar] [CrossRef]
- Mehrizi, A.A.; Karimi-Maleh, H.; Naddafi, M.; Karimi, F. Application of bio-based phase change materials for effective heat management. J. Energy Storage 2023, 61, 106859. [Google Scholar] [CrossRef]
- John, A.N.; Samer, K.; Louis, D.; Dominic, G.; Mary, A.W. Phase Change Materials. Storing Energy 2016, 13, 249–272. [Google Scholar] [CrossRef]
- Rakshamuthu, S.; Jegan, S.; Joel, B.J.; Selvakumar, V.; Anandeeswaran, K.; Iyahraja, S. Experimental analysis of small size solar dryer with phase change materials for food preservation. Energy Storage 2021, 33, 102095. [Google Scholar] [CrossRef]
- Hoang, H.M.; Leducq, D.; Perez-Masia, R.; Lagaron, J.M.; Gogou, E.; Taoukis, P.; Alvarez, G. Heat transfer study of submicro-encapsulated PCM plate for food packaging application. Int. J. Refrig. 2015, 52, 151–160. [Google Scholar] [CrossRef]
- Rostami, S.; Afrand, M.; Shahsavar, A.; Sheikholeslami, M.; Kalbasi, R.; Aghakhani, S.; Shadloo, M.S.; Oztop, H.F. A review of melting and freezing processes of PCM/Nano-PCM and their application in energy storage. Energy 2020, 211, 118698. [Google Scholar] [CrossRef]
- Yao, J.; Xu, H.; Dai, Y.; Huang, M. Performance analysis of solar assisted heat pump coupled with build-in PCM heat storage based on PV/T panel. Sol. Energy 2020, 197, 279–291. [Google Scholar] [CrossRef]
- Afaynou, I.; Faraji, H.; Choukairy, K.; Arıcı, M.; Khallaki, K. Heat transfer improvement of phase change materials by metal foams and nanoparticles for efficient electronic thermal management: A comprehensive study. Int. J. Heat Mass Transf. 2024, 227, 125534. [Google Scholar] [CrossRef]
- Abdullah, A.A.A.; Abdulwahab, A.A.; Jalal, A. Usefulness of loading PCM into envelopes in arid climate based on Köppen–Geiger classification—Annual assessment of energy saving and GHG emission reduction. J. Energy Storage 2021, 43, 103152. [Google Scholar] [CrossRef]
- Alexander, M.T.; Astrid, J.; Gaurav, S.; Laurent, P. Annual energy analysis of concrete containing phase change materials for building envelopes. Energy Convers. Manage. 2015, 103, 374–386. [Google Scholar] [CrossRef]
- Ascione, F.; Bianco, N.; De Masi, R.F.; de’ Rossi, F.; Vanoli, G.P. Energy refurbishment of existing buildings through the use of phase change materials: Energy savings and indoor comfort in the cooling season. Appl. Energy 2014, 113, 990–1007. [Google Scholar] [CrossRef]
- Mohammad, H.J.; Reza, A. A comparative evaluation on energy consumption of a building using bio-based and paraffin-based phase change materials integrated to external building envelope. Energy Rep. 2024, 11, 3914–3930. [Google Scholar] [CrossRef]
- Lei, J.; Yang, J.; Yang, E.H. Energy performance of building envelopes integrated with phase change materials for cooling load reduction in tropical Singapore. Appl. Energy 2016, 162, 207–217. [Google Scholar] [CrossRef]
- Mi, X.; Liu, R.; Cui, H.; Memon, S.A.; Xing, F.; Lo, Y. Energy and economic analysis of building integrated with PCM in different cities of China. Appl. Energy 2016, 175, 324–336. [Google Scholar] [CrossRef]
- Castell, A.; Martorell, I.; Medrano, M.; Perez, G.; Cabeza, L.F. Experimental study of using PCM in brick constructive solutions for passive cooling. Energy Build. 2010, 42, 534–540. [Google Scholar] [CrossRef]
- Oliver, A. Thermal characterization of gypsum boards with PCM included: Thermal energy storage in buildings through latent heat. Energy Build. 2012, 48, 1–7. [Google Scholar] [CrossRef]
- Cabeza, L.F.; Castellón, C.; Nogués, M.; Medrano, M.; Leppers, R.; Zubillag, O. Use of microencapsulated PCM in concrete walls for energy savings. Energy Build. 2007, 39, 113–119. [Google Scholar] [CrossRef]
- Arce, P.; Castellón, C.; Castell, A.; Cabeza, L.F. Use of microencapsulated PCM in buildings and the effect of adding awnings. Energy Build. 2012, 44, 88–93. [Google Scholar] [CrossRef]
- Stetiu, C.; Feustel, H.E.; Berkeley, L. Phase change wallboard as an alternative to compressor cooling in Californian residences. In Proceedings of the 1966 ACEEE Summer Study on Energy Efficiency in Buildings; American Council for an Energy Efficient Economy: Washington, DC, USA, 1996; pp. 157–170. [Google Scholar]
- Panayiotou, G.P.; Kalogirou, S.A.; Tassou, S.A. Evaluation of the application of Phase Change Materials (PCM) on the envelope of a typical dwelling in the Mediterranean region. Renew. Energy 2016, 97, 24–32. [Google Scholar] [CrossRef]
- Kosny, J.; Kossecka, E.; Brzezinski, A.; Tleoubaev, A.; Yarbrough, D. Dynamic thermal performance analysis of fiber insulations containing bio-based phase change materials (PCMs). Energy Build. 2012, 52, 122–131. [Google Scholar] [CrossRef]
- Chen, M.; Jiang, L.; Mi, S.; Shen, X. Energy saving simulation of phase change materials in the enclosure structure of archives warehouse in Lhasa. Energy Rep. 2022, 8, 532–538. [Google Scholar] [CrossRef]
- Qureshi, W.; Nair Nirmal-Kumar, C.; Farid Mohammad, M. Impact of energy storage in buildings on electricity demand side management. Energy Convers. Manag. 2011, 52, 2110–2120. [Google Scholar] [CrossRef]
- Nariman, A.; Kalbasi, R.; Rostami, S. Sensitivity of AHU power consumption to PCM implementation in the wall-considering the solar radiation. J. Therm. Anal. Calorim. 2020, 143, 2789–2800. [Google Scholar] [CrossRef]
- Nguyen, Q.; Naghieh, A.; Kalbasi, R.; Akbari, M.; Karimipour, A.; Tlili, I. Efficacy of incorporating PCMs into the commercial wall on the energy-saving annual thermal analysis. J. Therm. Anal. Calorim. 2020, 143, 2179–2187. [Google Scholar] [CrossRef]
- Abuhamdeh, N.H.; Melaibari, A.A.; Alquthami, T.S.; Khoshaim, A.; Oztop, H.F.; Karimipour, A. Efficacy of incorporating PCM into the building envelope on the energy saving and AHU power usage in winter. Sustain. Energy Technol. Assess. 2021, 43, 100969. [Google Scholar] [CrossRef]
- Rob, G.; Dan, M.; Nicholas, L. OpenStudio: An Open-Source Integrated Analysis Platform. In Proceedings of the Building Simulation, Sydney, Australia, 14–16 November 2011. [Google Scholar]
- Ascione, F.; Bianco, N.; de’ Rossi, F.; Turni, G.; Vanoli, G.P. Green roofs in European climates. Are effective solutions for the energy savings in air-conditioning. Appl. Energy 2013, 104, 845–859. [Google Scholar] [CrossRef]
- Bojic, M.; Nikolic, N.; Nikolic, D.; Skerlic, J.; Miletic, I. Toward a positive-net-energy residential building in Serbian conditions. Appl. Energy 2011, 88, 2407–2419. [Google Scholar] [CrossRef]
- Zhu, N.; Wang, S.; Ma, Z.; Sun, Y. Energy performance and optimal control of air-conditioned buildings with envelopes enhanced by phase change materials. Energy Convers. Manag. 2011, 52, 3197–3205. [Google Scholar] [CrossRef]
- Tian, W.; Choudhary, R. A probabilistic energy model for non-domestic building sectors applied to analysis of school buildings in greater London. Energy Build. 2012, 54, 1–11. [Google Scholar] [CrossRef]
- US Department of Energy, EnergyPlus simulation software, Version 24.1.0. 2024. Available online: https://energyplus.net/ (accessed on 28 March 2024).
- Boyano, A.; Hernandez, P.; Wolf, O. Energy demands and potential savings in European office buildings: Case studies based on EnergyPlus simulations. Energy Build. 2013, 65, 19–28. [Google Scholar] [CrossRef]
- Zhang, R.; Khee, P.L.; Yao, S.; Zhang, Y. Coupled EnergyPlus and computational fluid dynamics simulation for natural ventilation. Build. Environ. 2013, 68, 100–113. [Google Scholar] [CrossRef]
- Jahangir, A.; Mohammad, A.I.; Biplob, K.B. Energy simulation to estimate building energy consumption using EnergyPlus. In Proceedings of the International Conference on Mechanical, Industrial and Energy Engineering 2014, Khulna, Bangladesh, 25–26 December 2014. [Google Scholar]
- Dahanayake, K.W.D.K.C.D.; Chow, C.L. Studying the potential of energy saving through vertical greenery systems: Using EnergyPlus simulation program. Energy Build. 2017, 138, 47–59. [Google Scholar] [CrossRef]
- Tabares-Velasco, P.C.; Christensen, C.; Bianchi, M. Verification and validation of EnergyPlus phase change material model for opaque wall assemblies. Build. Environ. 2012, 54, 186–196. [Google Scholar] [CrossRef]
- Fabrizio, A.; Martina, B.; Rosa, F.D.M.; Filippo, D.R.; Giuseppe, P.V. A framework for NZEB design in Mediterranean climate: Design, building and set-up monitoring of a lab-small villa. A framework for NZEB design in Mediterranean climate: Design, building and set-up monitoring of a lab-small villa. Sol. Energy 2019, 184, 11–29. [Google Scholar] [CrossRef]
- Rubitherm Technologies GmbH, Products, PCM-RT LINE. Available online: https://www.rubitherm.eu/en/productcategory/organische-pcm-rt (accessed on 15 May 2024).
- Climate and Average Weather Year-Round, Riverside and Palm Springs. Available online: https://weatherspark.com/ (accessed on 5 September 2024).
- Xiao, X.; Zhang, P.; Li, M. Preparation and thermal characterization of paraffin/metal foam composite phase change material. Appl. Energy 2013, 112, 1357–1366. [Google Scholar] [CrossRef]
- Yang, X.; Li, C.; Ma, Y.; Chi, H.; Hu, Z.; Xie, J. High thermal conductivity of porous graphite/paraffin composite phase change material with 3D porous graphite foam. Chem. Eng. J. 2023, 473, 145364. [Google Scholar] [CrossRef]
- He, Y.; Li, H.; Luo, F.; Jin, Y.; Huang, B.; Qian, Q. Bio-based flexible phase change composite film with high thermal conductivity for thermal energy storage. Compos. Part A Appl. Sci. Manuf. 2021, 151, 106638. [Google Scholar] [CrossRef]
- Fang, G.H.; Yu, M.H.; Meng, K.K.; Shang, F.; Tan, X. High-Performance Phase-Change Materials Based on Paraffin and Expanded Graphite for Solar Thermal Energy Storage. Energy Fuels 2020, 34, 10109–10119. [Google Scholar] [CrossRef]


| Performance | Location | PCM | Melting Point (°C) | Latent Heat (kJ kg−1) | Reference |
|---|---|---|---|---|---|
| The maximum energy reduction is 32% | Singapore | N/A * | 28 | 223 | [16] |
| The maximum energy reduction is 12.9% | China | RT-27 | 28 | 179 | [17] |
| The maximum energy reduction is 15% | Spain | RT-27 SP-25 | 28; 26 | 179; 180 | [18] |
| The gypsum plaster with 45% PCMs can store 5 times more energy per unit mass than a thermal brick | Periodic variations of the temperature | Micronal DS 5001X | 26 | 110 | [19] |
| The maximum temperature in the wall with PCM has a time delay around 2 h | Spain | Micronal PCM (BASF) | 26 | 110 | [20] |
| With awnings, temperature peaks are lowered by 3–4 °C (6%) | Spain | Micronal PCM (BASF) | 26 | 110 | [21] |
| The temperature of the room was decreased 3 °C | USA (California) | N/A | 25 | N/A | [22] |
| The energy reduction is up to 28.6% | Cyprus | M91 (BioPCM™) | 29 | 165–200 | [23] |
| The peak-hour heat gains are reduced by 23–27% for Marseille and 21–25% for Cairo | Warsaw, Poland Marseille, France Cairo, Egypt | Bio-based PCM: properties determined by HFMA | 23 | 115 | [24] |
| The energy consumption of the warehouse is reduced by 26.05% | Lhasa | N/A | 8 | 221 | [25] |
| The energy requirement decreases around 31% | New Zealand | RT-20 | 18–22 | 150 | [26] |
| Material | Thickness (m) | Density (kg m−3) | Specific Heat (J kg−1 K−1) | Thermal Conductivity (W m−1 K−1) |
|---|---|---|---|---|
| Concrete | 0.2 | 2243 | 837 | 1.73 |
| Wall Insulation | 0.05 | 91 | 840 | 0.04 |
| Roof Insulation | 0.21 | 265 | 836 | 0.05 |
| Roof Membrane | 0.0095 | 1121 | 1460 | 0.16 |
| Gypsum (Plaster Board) | 0.012 | 785 | 830 | 0.16 |
| Name * | Peak (°C) | () | () | () | () |
|---|---|---|---|---|---|
| RT18HC | 18/17 | 260 | 2 | 880/770 | 0.2 |
| RT21HC | 21/21 | 190 | 2 | 880/700 | 0.2 |
| RT22HC | 22/22 | 190 | 2 | 760/700 | 0.2 |
| RT24HC | 24/24 | 200 | 2 | 800/700 | 0.2 |
| RT25HC | 25/25 | 230 | 2 | 880/770 | 0.2 |
| RT28HC | 28/27 | 250 | 2 | 880/770 | 0.2 |
| Parameters | Riverside (Basic Method) | Palm Springs (Basic Method) | Riverside (Hysteresis Method) | Palm Springs (Hysteresis Method) |
|---|---|---|---|---|
| Position | Interior | Interior | Interior | Interior |
| Thickness (mm) | 30 | 30 | 30–50 | >50 |
| Melting Point (°C) | 19 | 20 | 21 | 21 |
| Thermal Conductivity () | 2–3 | 0.2 | 2-3 | 0.2 |
Disclaimer/Publisher’s Note: The statements, opinions and data contained in all publications are solely those of the individual author(s) and contributor(s) and not of MDPI and/or the editor(s). MDPI and/or the editor(s) disclaim responsibility for any injury to people or property resulting from any ideas, methods, instructions or products referred to in the content. |
© 2025 by the authors. Licensee MDPI, Basel, Switzerland. This article is an open access article distributed under the terms and conditions of the Creative Commons Attribution (CC BY) license (https://creativecommons.org/licenses/by/4.0/).
Share and Cite
Chan, Y.; Hoke, T.; Meredith, K.; Chen, X. Annual Simulation of Phase Change Materials for Enhanced Energy Efficiency and Thermal Performance of Buildings in Southern California. Energies 2025, 18, 847. https://doi.org/10.3390/en18040847
Chan Y, Hoke T, Meredith K, Chen X. Annual Simulation of Phase Change Materials for Enhanced Energy Efficiency and Thermal Performance of Buildings in Southern California. Energies. 2025; 18(4):847. https://doi.org/10.3390/en18040847
Chicago/Turabian StyleChan, Yiu, Thomas Hoke, Kevin Meredith, and Xi Chen. 2025. "Annual Simulation of Phase Change Materials for Enhanced Energy Efficiency and Thermal Performance of Buildings in Southern California" Energies 18, no. 4: 847. https://doi.org/10.3390/en18040847
APA StyleChan, Y., Hoke, T., Meredith, K., & Chen, X. (2025). Annual Simulation of Phase Change Materials for Enhanced Energy Efficiency and Thermal Performance of Buildings in Southern California. Energies, 18(4), 847. https://doi.org/10.3390/en18040847