Article

Renewable Portfolio Standards, Carbon Emissions Trading and China Certified Emission Reduction: The Role of Market Mechanisms in Optimizing China’s Power Generation Structure

School of Economics and Management, Beijing Forestry University, Beijing 100083, China
*
Author to whom correspondence should be addressed.
Energies 2025, 18(4), 894; https://doi.org/10.3390/en18040894
Submission received: 14 December 2024 / Revised: 13 January 2025 / Accepted: 24 January 2025 / Published: 13 February 2025
(This article belongs to the Section B: Energy and Environment)

Abstract

:
To promote the low-carbon energy transition, China is implementing renewable energy (RE) development policies such as renewable portfolio standards (RPSs), carbon emissions trading (CET) and China certified emission reduction (CCER) trading. However, using China’s current CET price to accurately reflect market information is difficult, which is not conducive to guiding low-carbon investment. Additionally, as RE power enters the era of grid parity, more revenues are needed to maintain generator operations. Therefore, in this study, we construct a system dynamics model to explore whether and how market mechanisms can optimize the power generation structure, and sensitivity analyses of CCER policy parameters are carried out to identify the impact and scope for improvement. The results show that (1) the market mechanism, especially the RPS mechanism, adjusts the profits of power generators, eliciting a surge in RE generation and optimizing the power generation structure; (2) CET and CCER prices change in the opposite direction of tradable green certificates (TGCs) and show a significant improvement effect on the on-grid electricity price; (3) successful implementation of the CCER mechanism can effectively energize the CET market. A lower CCER benchmark price, higher CCER offset ratio and CET fines can accelerate the growth of CCER and CET prices. Therefore, the government should promote TGC separation from power trading and rationally design CCER policies by lowering the CCER credit ratio, increasing CET fines, and expanding CCER market capacity to ensure that the guiding role of the market mechanism is better utilized.

1. Introduction

The development of renewable energy is an important strategy for achieving a global low-carbon energy transition and promoting carbon emission reductions. Since 2005, China has enacted its own renewable energy support policies to promote renewable energy (RE) substitution for traditional energy (TE) through feed-in tariffs (FITs) and renewable portfolio standards (RPSs) [1]. At the same time, in order to achieve China’s dual-carbon target, a series of guidelines and regulations on carbon emissions trading (CET) has been issued in recent years. In early 2024, China restarted the China certified emission reduction (CCER) mechanism with RE projects as the main source [2]. This reflects China’s determination to adopt a market-based carbon emission reduction mechanism and brings a new idea to push RE forward through carbon–electricity–certificate market synergy.
RPSs make the RE electricity market share mandatory in law [3] and effectively promote RE consumption through its accompanying tradable green certificate (TGC) mechanism. As of the end of October 2023, China’s total green power trading volume reached 87.8 billion kWh, 148 million TGCs have been issued, and the scale of green electricity and TGC trading has steadily expanded [4]. As the basic certificate for the recognition of RE power consumption, TGCs are the only expression of green power’s environmental value. However, after the restart of CCER trading, since CCER is also a reflection of the environmental attributes of RE projects, RE power generators, as the main suppliers of TGC and CCER products, need to choose between different monetization markets; otherwise, there will be a problem of duplicate benefits. Therefore, it is necessary to design a coordinated trading pattern in order to effectively guide the trading of RE power environmental attributes [5].
CET is a core policy instrument for controlling and reducing carbon emissions through the market mechanism [6]. It has unique advantages in terms of cost savings in policy implementation and sustained improvements in emission reduction benefits. However, the current CET market in China presents characteristics of small daily trading volume and concentrated trading hours, making it difficult to form accurate price signals [7]. Carbon emission reduction is not realized through market mechanisms but mainly as a result of government interference [8], which has seriously hindered the development of a national carbon market. CCER, as a complementary mechanism to CET, reduces the emission reduction costs of enterprises with lower carbon compensation prices [9] and is increasingly favored by emission reduction entities, with a growing status in China [10]. Consequently, there is a need to promote the systematic building of mandatory and voluntary carbon market policies and stimulate TE power generators to actively participate in CET and CCER transactions.
On the one hand, different market mechanisms serve different policy objectives and work in different ways. The RPS mechanism directly regulates the market demand for RE electricity by setting quotas, while the CET and CCER mechanisms increase the cost of the carbon emissions of TE electricity production. On the other hand, these mechanisms are interconnected, and the electricity market becomes the main venue for their policy effects. Based on the above discussion, this study focuses on exploring the impact of the joint implementation of the RPS, CET and CCER mechanisms on renewable and conventional energy generation after the restart of CCER and making accurate predictions about the future electricity market structure. Additionally, the unique role of the CCER mechanism in this process also needs to be highlighted. A system dynamics model is constructed to simulate the electricity market with the RPS, CET and CCER market mechanisms, and we discuss and analyze the impact on the carbon–electricity–certificates market, especially market prices, generator profits and power generation. In addition, because the CCER mechanism affects multiple market states simultaneously, this study provides a sensitivity analysis of the CCER policy parameter, uncovering the unique role of CCER in facilitating this process. Thus, the main scholarly points and marginal contributions of this study are as follows:
(1) An RPS–CET–CCER policy effect model is constructed, simulating the carbon–electricity–certificate market’s equilibrium state and interaction effects through the system dynamics approach and, thus, allowing for exploration of the market trading behavior and electricity production process of RE and TE power generators. This model provides referable structures and equations for further studies by other scholars.
(2) We analyze the price linkage relationship and the price trend in various periods in the carbon–electricity–certificate market and compare the discrepancy between the revenues and costs of RE and TE generators in the market, thus revealing the heterogeneous roles of different market mechanisms in adjusting the power generation structure. This research analyzes the policy effects of the RPS–CET–CCER coupling mechanisms, bridging the gap of related studies in the field.
(3) Select key policy parameters such as offset ratio, benchmark price and participation proportion of CCER mechanism, setting different CCER policy scenarios, and discussing the impacts of CCER parameter uncertainty on the market equilibrium, profit performance and electricity production of power generators. This finding analyzes the optimization direction of CCER policy from the perspective of carbon–electricity–certificate market linkage and provides a theoretical basis for policy makers.
Based on a previous study, this study proposes targeted policy suggestions to better utilize RPS, CET and CCER mechanisms and promote the linkage of the carbon and electricity markets, thereby providing guidance for boosting the RE industry and optimizing the electricity structure.
The rest of this paper’s structure is as follows: Section 2 summarizes the research of domestic and foreign scholars on RPSs, CET and CCER from the perspectives of RPS, CET and CCER mechanisms as well as RPS–CET coupling mechanisms. Section 3 provides the theoretical framework for constructing the RPS–CET–CCER policy effects model, then constructs the SD model and explains the formulas and data involved. Section 4 discusses and analyzes the simulation model’s results and makes a sensitivity analysis for the implementation of the CCER mechanism. Finally, Section 5 presents the conclusions and policy implications.

2. Literature Review

The RPS mechanism can promote the development of RE, thereby improving the energy structure. It has been found that the implementation of RPSs increases the proportion of renewable resources and motivates the diversity of renewable resources [11]. While quota systems have not been an effective mechanism for stimulating the deployment capacity of renewable energy generation in the United States and European Union countries [12], they are proving to be critical to the green energy transition in the Asia–Pacific region [13]. By setting an RPS target for the minimum consumption of RE in China, the use of RE in China’s power sector can be further promoted [14]. RPS policies include supply-side RPSs and demand-side RPSs. By comparing the different effects of the two types of RPSs, it can be found that the SRPS policy can alleviate the price volatility of renewable electricity, while the DRPS policy can more effectively stimulate the power market and the RE development of the electricity market and RE industry [15]. The parameter design of RPSs affects the motivation of power generators to participate in TGC trading. As the RPS quota targets and penalties for non-attainment increase, TE generators are more willing to enter the TGC market for trading [16], and the incentive effect varies when the penalties for non-attainment are set at different multiples of the benchmark tariff [17]. With the current power market-oriented reform, the on-grid electricity price can be more effective in stimulating coal-fired power plants to purchase TGCs than the previous power price formation model [18].
The CET policy can increase the proportion of RE power generation and achieve energy transformation [19]. However, such a change can only be realized if a large portion of CET revenues are used for the development of renewable energy [20]. Meanwhile, Sun et al. [21] argued that CET promotes the green transformation of the power sector mainly by facilitating the technological upgrading of units in the thermal power sector rather than promoting the replacement of the thermal power sector by the renewable energy sector. In addition, CET can significantly reduce carbon emissions, but the emission reduction effect is not optimal. The successful implementation of the CET mechanism depends on the effectiveness of the carbon trading market [7]; however, at present, China’s carbon trading market is still in an inefficient state. The policy effect of CET in curbing carbon emissions is not realized through the market mechanism but mainly as a result of government intervention [8]. Lin et al. [22] and Shobande et al. [23] argue that CET should be implemented in conjunction with other policies (e.g., renewable energy incentives) and that policy synergies can guarantee the coherence of climate action and promote China’s early achievement of peak carbon emissions.
Due to the similarity between CET and RPSs in terms of their effects and modes of action, many scholars have carried out studies related to the coupling mechanism of CET-RPS. Under the CET–RPS policy, the prices of TGC, CET and electricity markets influence each other. Electricity prices and carbon market prices are complementary to green certificate market prices [24]. Rising carbon prices will lead to rising on-grid electricity prices and falling green certificate electricity prices [25]. The SD simulation results reveal that the introduction of the carbon market policies will make the electricity market, green certificate market and carbon market unstable, increase the equilibrium price of the electricity market, and reduce the equilibrium price of the green certificate market [26], which once again confirms the conclusion that equilibrium prices will influence each other in the context of multi-market coupling [27].
If well combined and applied, climate change and energy policy tools such as RPSs and CET will promote the low-carbon transition of the power sector [28]. Under the coupled market mechanism of CET and RPS, the power supply structure in the electricity market will be cleaner, and the proportion of green electricity will be significantly increased, further optimizing the power supply structure [29] and effectively controlling CO2 emissions in the power industry. In addition to this, the total CO2 emissions from the power sector under the coupled market mechanism are significantly lower than the total CO2 emissions under the single CET mechanism [30], which has a stronger emission reduction capacity and social welfare level [25]. However, researchers also pointed out that there may be policy redundancy between TGC and CET [29], and an unreasonable policy combination may lead to higher social costs [30].
As an important complement to the CET mechanism, the CCER mechanism is not only an important part of China’s carbon market but also trades the environmental rights of green electricity like green certificates. Throughout the studies on CCER by domestic and foreign scholars, most focus on a single policy, such as the impact on the regional economy [31], enterprise financing [32], climate governance [33], poverty reduction [34] and other aspects. With the restart of CCER in China, more scholars have begun to incorporate CCER into a unified carbon market framework, exploring how to formulate policy parameters, such as price and offset ratio, and the policy effects of the linkage between CCER and other energy and environmental policies. For example, Wang et al. [35] established a coupling mechanism of the green hydrogen market–national carbon trading market–electricity market through SD. Zhang et al. [36] explored the enhanced benefits of the coupling of CET and CCER mechanisms through the CGE model, but no research links the CCER market with the CET market, the electricity market and the green certificate market to explore its impact on the development of the renewable energy industry and low-carbon transformation of the electricity market.
With the requirements of dual-carbon targets and grid parity, there is an urgent need to find ways to efficiently address the energy transition through market mechanisms. Through a literature review, it can be seen that RPS and CET mechanisms can boost the RE industry and contribute to carbon mitigation, and the successful implementation of RPS–CET can accelerate the realization of the above goals. However, there is little research that has incorporated the CCER mechanism to explore the impact of generators’ trading in these markets on power generation. In addition, since the restart of CCER, the frequent release of relevant policies highlights the urgency of its policy design. As the only mechanism that can affect the carbon–electricity–certificates market simultaneously, there are few studies on the influence of the CCER policy on market functioning. Accordingly, this study examines the impact of these three market mechanisms on the power generation structure, as well as how to design CCER policy to maximize its utility, thereby providing a reasonable basis for decision makers.

3. Methodology

3.1. System Dynamics Model

SD is a simulation technology for studying complex systems. By identifying the feedback and cyclic relationships between the objects of study, simulation models of a time-series nature can be constructed to assess the impact of policies, methods and environments on complex systems [37]. It shows strong predictive power in resource management [38], policy formulation [39], industrial development [40], environmental governance [41] and other issues.
The objective of this study is to explore the role of RPS, CET and CCER mechanisms in optimizing the electricity production structure, and it focuses on the following scientific questions: What is the future trend of the electricity market structure in the context of the three parallel policies of RPS, CET and CCER? Will the implementation of different market-based mechanisms have the same effect on the optimization of the electricity structure? How will the addition of the CCER mechanism affect the implementation of the other two mechanisms and the electricity market?
Since the electricity production process and the carbon–electricity–certificate market trading process of renewable energy generators and traditional energy generators involve multiple factors, such as supply, demand, price, revenue, cost, etc., it is a system dynamics problem with obvious SD characteristics. Compared with other research methods, the SD model is suitable for complex time-varying systems with high-order, multivariate, multiloop nonlinear and feedback structures and is able to quantitatively analyze the long-term impacts of each element on the whole system. Not only can it statically analyze the complex relationships between various variables and parameters and multiple markets but it can also dynamically assess the impacts of RPS–CER–CCER policy changes and simulate the internal operation of the market, thus solving complex and long-term system problems.
Therefore, this study adopts a system dynamics approach to construct an RPS–CET–CCER policy effect model, simulates the equilibrium state and interaction of the carbon–electricity–certificate market, explores the market trading and power production processes of renewable energy generators and traditional energy generators, and discusses the linkage effects of CCER parameter uncertainty. It not only expands research in the field of the RPS–CET–CCER coupling mechanism but also provides referable model building ideas and methods for subsequent research.

3.2. System Boundary Analysis

The generators’ power production process involves various factors, such as economic development, power consumption, energy structure, etc. It has to satisfy the demand for power consumption and industry carbon mitigation outside the system, as well as the demand for trading environmental equity products inside the system. Considering the availability and operability of data, four subsystems are set up, namely, TGC market, CET market, CCER market and electricity market, which are represented by green, red, orange and blue colors, respectively. The subsystems are interconnected with each other, which influences the trading behavior decisions of RE and TE power producers through the market price. TE power generators are subject to the double constraints of RE consumption and carbon mitigation and participate as buyers in the TGC, CCER and CET markets, and they incur TGC, CCER and CET purchasing costs. RE generators participate in the TGC and CCER markets as sellers through the green power they produce and incur TGC and CCER sales revenues. Generators’ supply and demand in the TGC, CET and CCER markets determine market prices and have an indirect impact on electricity prices and generators’ revenues from electricity sales. By considering the business performance, the generator decides the future investment and construction plan and generation capacity, thus affecting the electricity market structure. The system boundary and the relationship between the subsystem roles are shown in Figure 1.

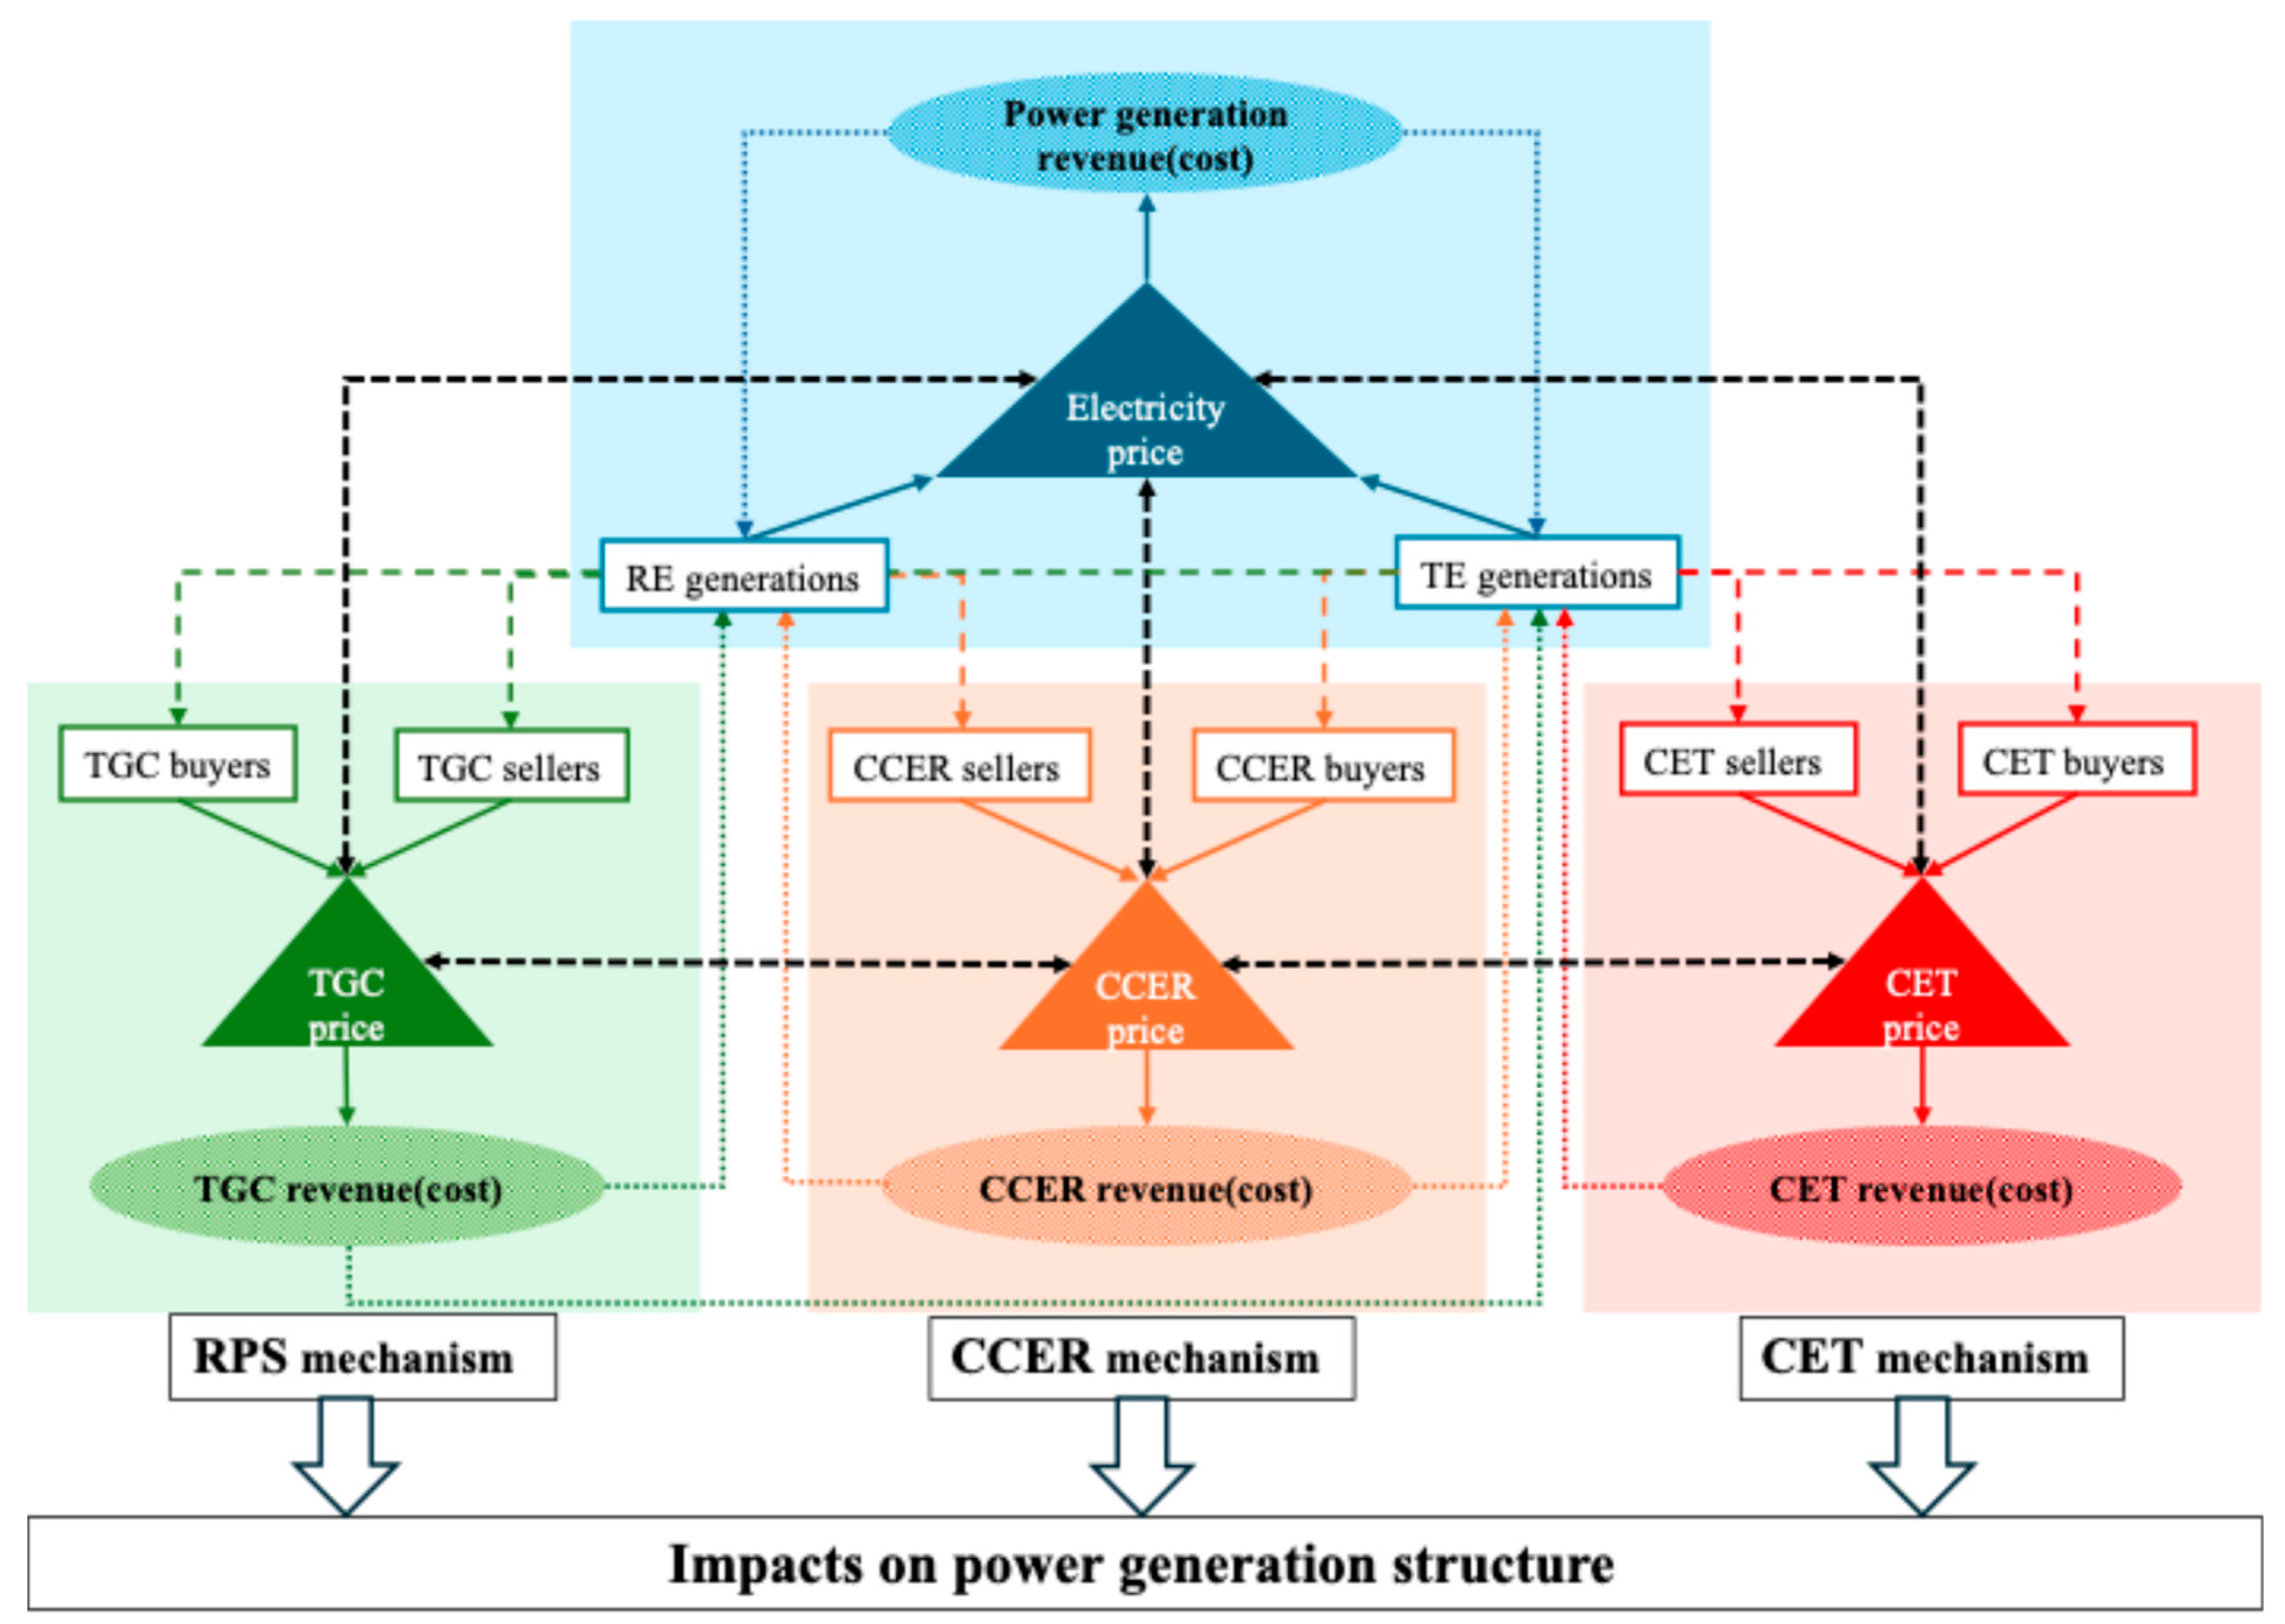
3.3. System Causality Analysis

Based on the system boundary analysis, the further breakdown of the variables in the subsystems and the identification of the causal relationships between the variables form a causal loop diagram (Figure 2). The model develops the following seven main causal relationships. The diagram distinguishes the subsystems with different colors as Figure 1. Positive feedback loops reflect the feedback mechanism between TGCs, CET, and CCER prices; generator holdings; expected trading volumes; and actual trading volumes.
① TGC price → desired sales (purchase) volume of TGCs → trading volume of TGCs → TGC holding of sellers (buyers) → desired sales (purchases) volume of TGCs → TGC price.
② CET price → desired sales (purchase) volume of CET → trading volume of CET → CET holding of sellers (buyers) → desired purchases (sales) volume of CET → CET price.
③ CCER price → desired purchases (sales) volume of CCER → trading volume of CCER → CCER holding of sellers (buyers) → desired sales (purchase) volume of CCER → CCER price.
Negative feedback loops reflect the feedback mechanisms of TGC, CET, CCER and electricity prices; generators’ cost or revenues; installed capacity; and power generation.
④ TGC price → TGC revenue (cost) → RE (TE) construction plan → RE (TE) installed capacity → RE (TE) power generation → TGC holding of sellers (buyers) → desired sales (purchases) volume of TGCs → TGC price.
⑤ CET price → CET cost → TE construction plan → TE installed capacity → TE power generation → CET holding of buyers → desired purchases (sales) volume of CET → CET price.
⑥ CCER price → CCER revenue (cost) → RE (TE) construction plan → RE (TE) installed capacity → RE (TE) power generation → CCER holding of sellers (buyers) → desired sales (purchase) volume of CCER → CCER price.
⑦ On-grid price → RE (TE) power sales revenue (generation cost) → RE (TE) construction plan → RE (TE) installed capacity → RE (TE) power generation → the power supply → on-grid price.

3.4. System Structure Analysis

Based on the system causality analysis, the variables in the system are classified as state variables, rate variables, auxiliary variables and constants. By setting up equations to depict the quantitative relationships between the variables, the structure of the system is further analyzed.

3.4.1. Assumptions

(1)
TGC, CET and CCER trading is limited to the electricity sector.
(2)
RE power generators only generate electricity, and there are no feed-in tariff subsidies.
(3)
TGCs are homogeneous and separate from electricity transactions.
(4)
Electricity consumption and carbon emissions vary with GDP at a constant rate [30]. All carbon allowances in the electricity market are allocated free of charge [29].
(5)
All RE power generation projects can apply for CCER, and the project emission reduction is equal to the project baseline emissions.
(6)
The environmental value of each unit of RE electricity cannot be traded in the TGC market and CCER market.
(7)
CET, CCER and TGCs cannot be stored, have no secondary market, and cannot be converted or offset against each other.

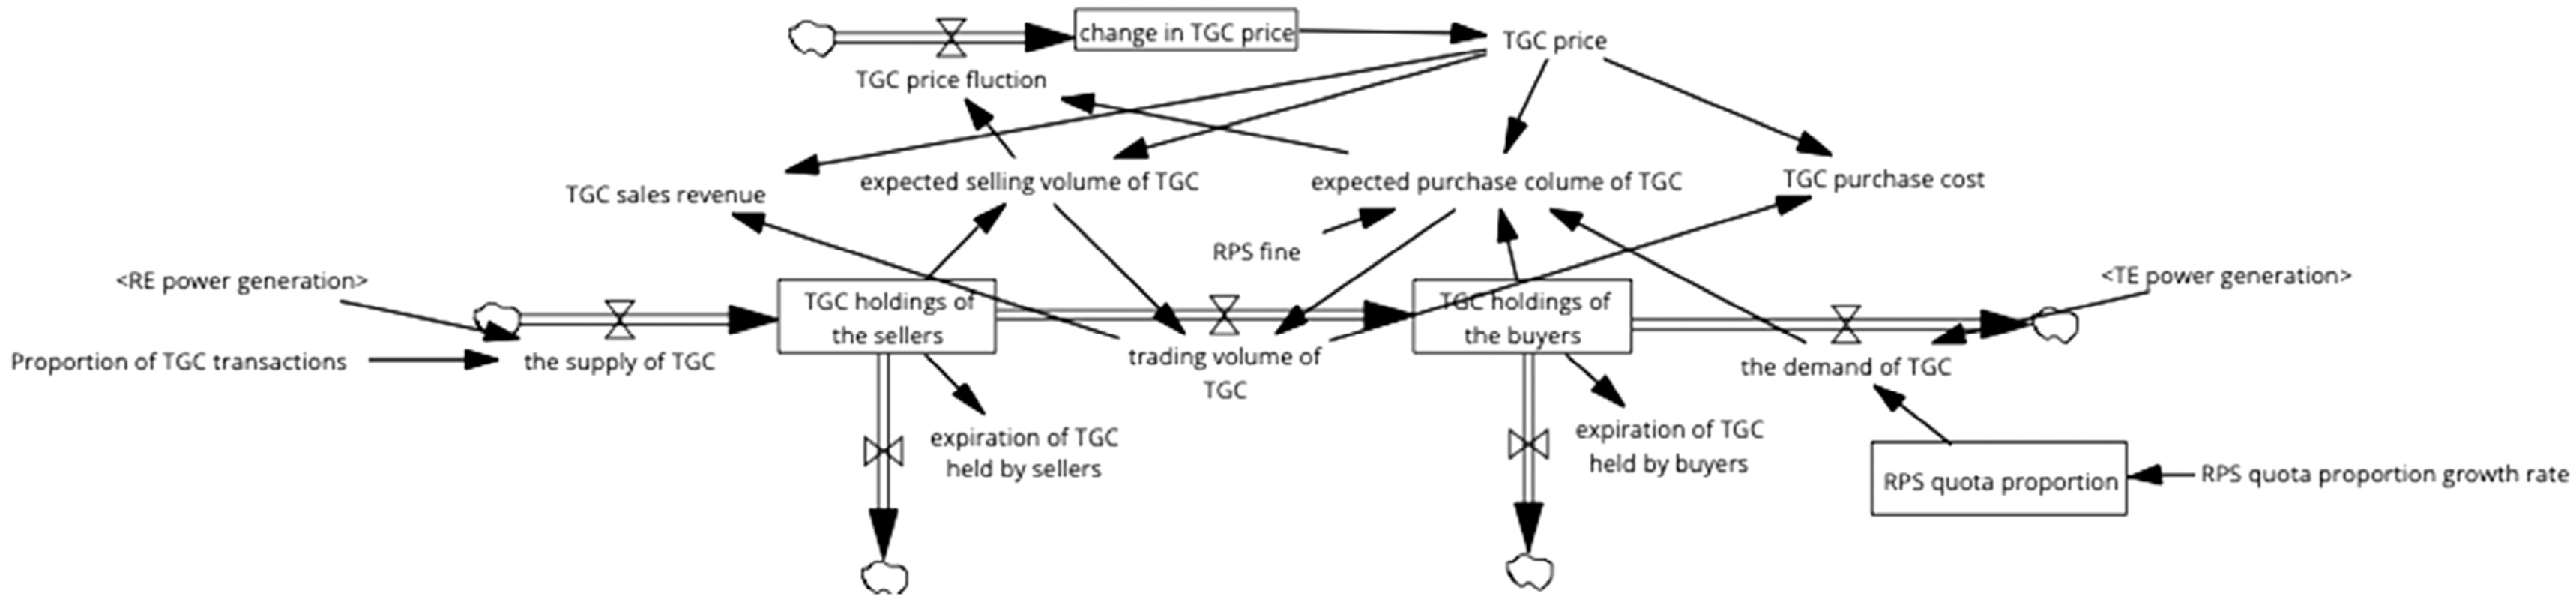
3.4.2. TGC Market Subsystem

In the TGC market, RE power generators sell TGCs based on their power generation and TE power generators face mandatory quota requirements and must purchase TGCs based on their power generation. To avoid repeated transactions of RE power environmental value in TGCs and CCER, the decision variable is introduced to represent the proportion of green power environmental value that RE power generators are willing to realize in the TGC market. Therefore, supply and demand in the TGC market are:
T G C s u p p l y = ω 1 × Q r
T G C d e m a n d = Q t × p r o p R P S
TGCs prices are affected by supply and demand, while the actual trading volume depends on the trading willingness of power generators. On the one hand, the purchasing decisions of TE generators not only depend on market prices and holdings but are also mandated by the RPS policy. Therefore, a fine coefficient is brought in to represent the impact of an RPS fine on TE power generators’ expected purchases. Fluctuations in the expected purchases and sales volumes in the TGC market result in constant changes in market supply and demand, which bring about fluctuations in TGC prices and ultimately form the market price under the upper- and lower-bound constraints. And the actual volume traded during the same period is determined by the lowest expected purchases and sales in the market. The price and actual trading volume of TGCs bring additional revenues or costs, thereby affecting the profit of RE and TE power generators. The formulas involved and stock flow diagram (Figure 3) are as follows:
P T G C , t = P T G C , 0 + T G C p u r c h a s e T G C s a l e s T G C s a l e s d t
T G C t r a d i n g = M a x 0 , min T G C s a l e s , T G C p u r c h a s e
T G C s a l e s = P T G C P T G C , 0 × T G C s e l l e r s
T G C p u r c h a s e = M a x 0 , f R P S / P T G C , m a x P T G C , 0 P T G C × T G C d e m a n d T G C b u y e r s
R T G C = C T G C = P T G C × T G C t r a d i n g

3.4.3. CET Market Subsystem

In the CET market, TE generators decide on their buying and selling decisions based on the relationship between allocated carbon allowances and actual carbon emissions. TE generators whose actual carbon emissions exceed their allocated carbon allowances are required to purchase carbon allowances from TE generators whose actual carbon emissions are less than their allocated carbon allowances The supply and demand for CET are:
C E T s u p p l y = G D P × C E G D P × α
C E T d e m a n d = Q t × ϵ × 1
Supply and demand determine the CET price, and changes in the CET price, in turn, affect the expected purchases and sales volume of TE power generators, thereby deciding the actual trading volume. Similar to the TGC market, on the one hand, the amount of CET expected to be sold by TE generators with surplus carbon allowances depends on the market price and current holdings. On the other hand, the purchase decisions of TE generators with insufficient carbon allowances are not only influenced by market prices and holdings but also mandated by the CET policy. Therefore, a fine coefficient is introduced to represent the role of CET policy on the expected purchase volume of TE power generators. Fluctuations in the expected purchases and sales volumes in the CET market result in constant changes in market supply and demand, which bring about fluctuations in CET prices and ultimately form the market price under the upper- and lower-bound constraints. And the actual volume traded during the same period is determined by the lowest expected purchases and sales in the market. TGC prices and actual trading volume bring additional costs, which directly affect TE power generator profit. The formulas involved and stock flow diagram (Figure 4) are as follows:
P C E T , t = P C E T , 0 + C E T p u r c h a s e C E T s a l e s C E T s a l e s d t
C E T t r a d i n g = M a x 0 , min C E T s a l e s , C E T p u r c h a s e
C E T s a l e s = P C E T P C E T , 0 × C E T s e l l e r s
C E T p u r c h a s e = M a x 0 , f C E T / P C E T , m a x P C E T , 0 P C E T × C E T d e m a n d C E T b u y e r s
C C E T = P C E T × T G C C E T

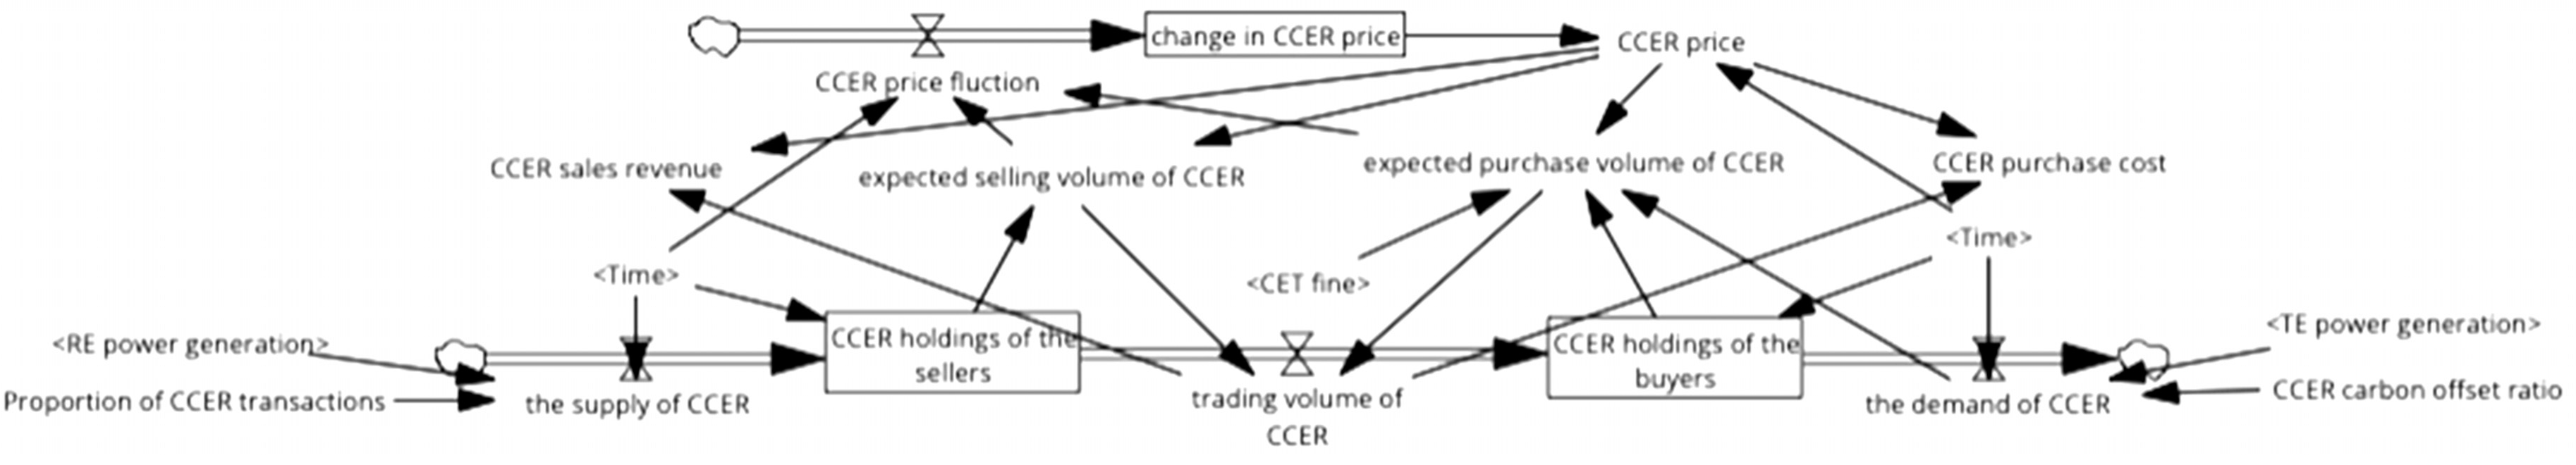
3.4.4. CCER Market Subsystem

In the CCER market, RE power generators can exchange CCER based on their power generation. Similar to the TGC market, the decision variable is introduced to represent the proportion of green power environmental value that RE power generators are willing to realize in the CCER market. Therefore, the tradable CCER in the market is:
C C E R s u p p l y = ω 2 × Q r × ϵ
TE power generators are subject to policy constraints on carbon emissions and must trade CCER with RE power generators based on their power generation. Since CCER prices are relatively low, according to the principle of profit maximization, TE power generators would preferentially purchase CCER to offset their excess carbon emissions. Therefore, the demand of CCER in the market is:
C C E R d e m a n d = Q t × ϵ ×
Similar to the CET market, the CCER price is subject to market supply and demand, and the actual trading volume is affected by price fluctuations and fines. When the CCER supply exceeds demand, the CCER price will fall. On the contrary, when the CCER market demand exceeds supply, the CCER price will rise. The CCER price and actual trading volume bring additional revenue or cost, thereby affecting the profit of RE and TE power generators. The formulas involved and stock flow diagram (Figure 5) are as follows:
P C C E R , t = P C C E R , 0 + C C E R t r a d i n g C C E R s a l e s T G C s a l e s t i m e C C E R d t
C C E R t r a d i n g = M a x 0 , min C C E R s a l e s , C C E R p u r c h a s e
C C E R s a l e s = P C C E R P C C E R , 0 × C C E R s e l l e r s
C C E R p u r c h a s e = M a x 0 , f C E T / P C C E R , m a x P C C E R , 0 P C C E R × C C E R d e m a n d C C E R b u y e r s
R C C E R = C   C C E R = P C C E R × C C E R t r a d i n g

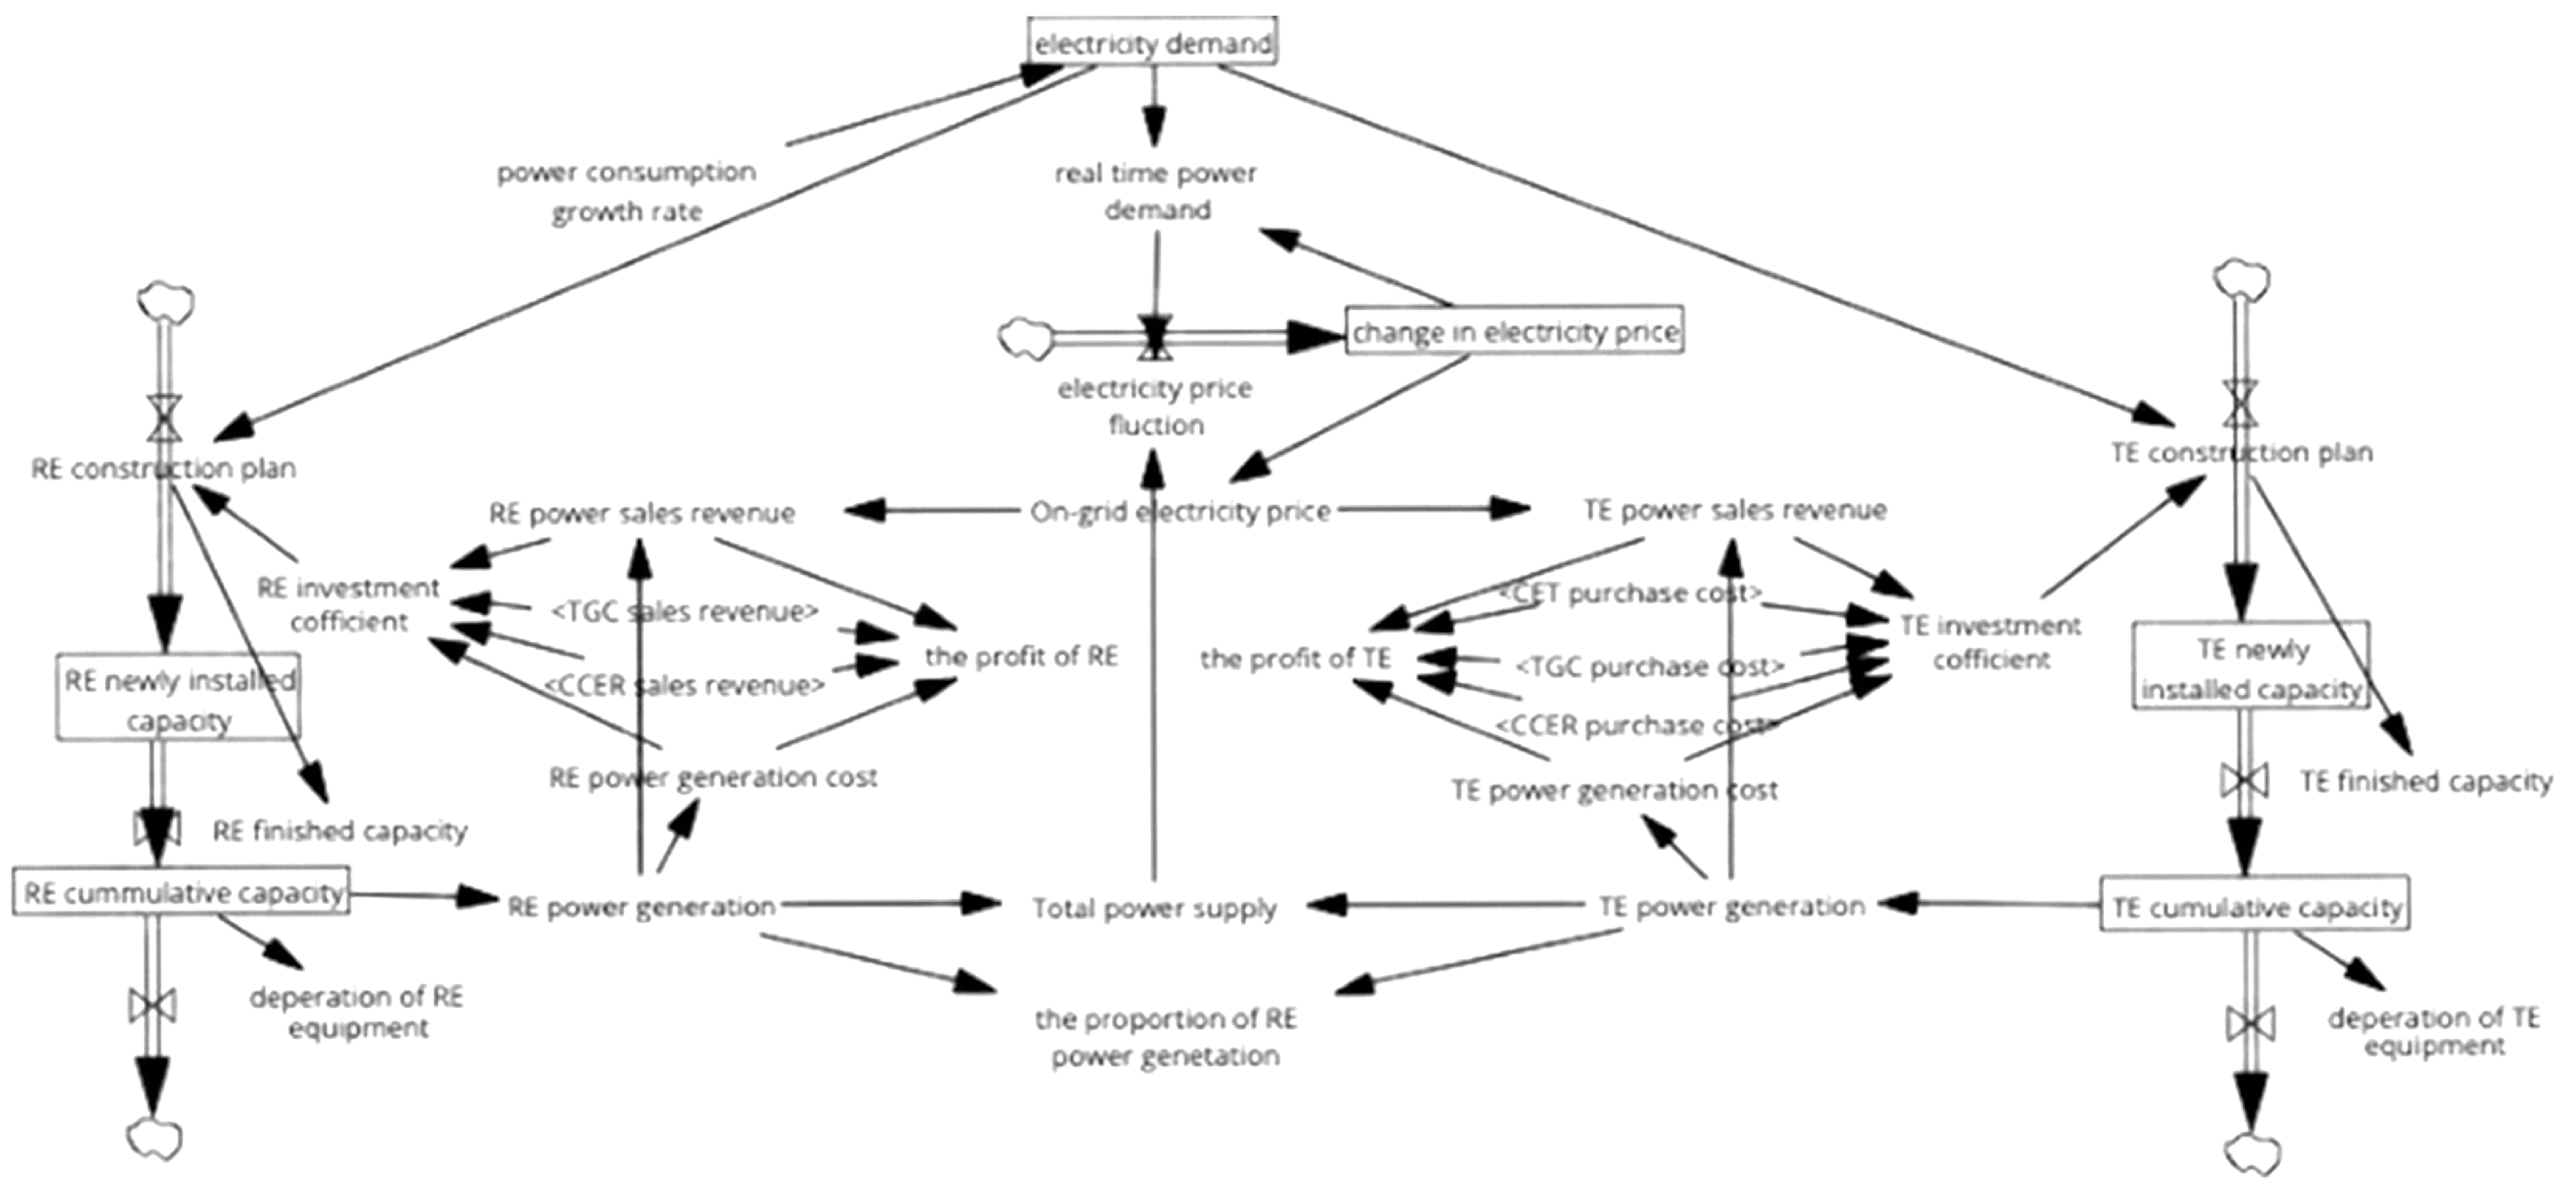
3.4.5. Electricity Market Subsystem

In the electricity market, the demand for electricity grows at a certain rate annually and is met by both RE power generators and TE power generators. Changes in power supply and demand contribute to fluctuations in electricity prices, which, in turn, generate real-time power demand and real-time electricity prices.
D e = D e , 0 + D e × β   d t
D e , t = D e × P e , t P e , 0 e d
P e , t = P e , 0 + D e ( Q r + Q t ) Q r + Q t d t
Under the market mechanism, the revenues and costs of RE and TE generators in TGC, CET, CCER and electricity markets will affect their investment enthusiasm. RE power generators derive their revenues from the sale of electricity, TGCs and CCER, while their costs come from the power generation only. TE power generators’ revenues come only from electricity sales, but the costs come from power generation and the purchase of TGCs, CCER and CET. The introduction of an investment coefficient indicates the influence of generators’ revenues and costs on future construction plans.
R e , r / t = P e × Q r / t
C e , r / t = M C r / t × Q r / t
c o e r = R e , r + R C C E R + R T G C C e , r × γ
c o e t = R e , t C e , t + C C E A + C C C E R + C T G C × λ
C P r / t = I C r / t × D e × 1 2 h o u r s r / t
Generators will decide on the newly installed capacity based on the total electricity demand and investment coefficient. The current construction plans will increase the power generator’s generating capacity after a 12-month construction period. Through the continuous operation of the above systems, the proportion of RE power generation is changed, thereby adjusting the power generation structure. The formulas involved and stock flow diagram (Figure 6) are as follows:
I C f i n i s h e d , r / t = d e l a y   f i x e d C P r / t , 12 , 0
Q r / t = I C c u m , r / t × h o u r s r / t
R E p r o = Q r Q r + Q t

3.5. Data and Model Validation

Variable values are important for model prediction accuracy. The model is simulated on a monthly cycle from 2021 to 2030, and the actual values for 2020 are chosen as the initial values of the state variables. Regarding RPS parameters, based on the data released in the “China Renewable Energy Development Report of 2023”, the ratio of renewable energy consumption to total energy consumption was 17.5% in 2022; according to the “Action Plan for Carbon Dioxide Peaking Before 2030”, the proportion of non-fossil energy in primary energy consumption will reach approximately 25% in 2030. Therefore, we set the RPS quota’s initial value to 0.159 and the monthly quota growth value to 0.0038. In order to ensure stable and orderly trading in the market and avoid significant fluctuations in TGC and CET prices, this study stipulates that the TGC benchmark price is 400 CNY/MWH, with an upper limit of twice the benchmark price and a lower limit of half the benchmark price. In terms of carbon market parameters, the carbon emission quota of the power market is allocated free of charge based on the total national carbon emissions and the proportion of the power market in national carbon emissions (40%). Based on the carbon prices of seven pilot regions nationwide, the initial price of CET is 50 CNY/ton and the initial price of CCER is 40 CNY/ton. The price range of CET and CCER is 10–300 CNY/ton. In terms of electricity market parameters, by the end of 2020, China’s new and cumulative installed capacities of RE and TE power generation were 139,000 MW, 51,870 MW, 934,000 MW and 1,263,647 MW, respectively. The values of the important parameters are given in Table 1.
To ensure the truthfulness and accuracy of the forecasts, three variables, RE generation, TE generation and electricity demand, are selected for model testing to compare the gap between the real and simulated values during the simulation period. Table 2 shows that the average errors of the three variables are 1.14%, 3.26% and 6.06%, which are all within the allowable error range [44], indicating that the policy effect models of RPSs, CET and CCER in the electricity market are effective simulations of the real situation. The model was simulated by Vensim PLE (10.2.2) software, and the monthly data for model simulations are available in the Supplementary Material.

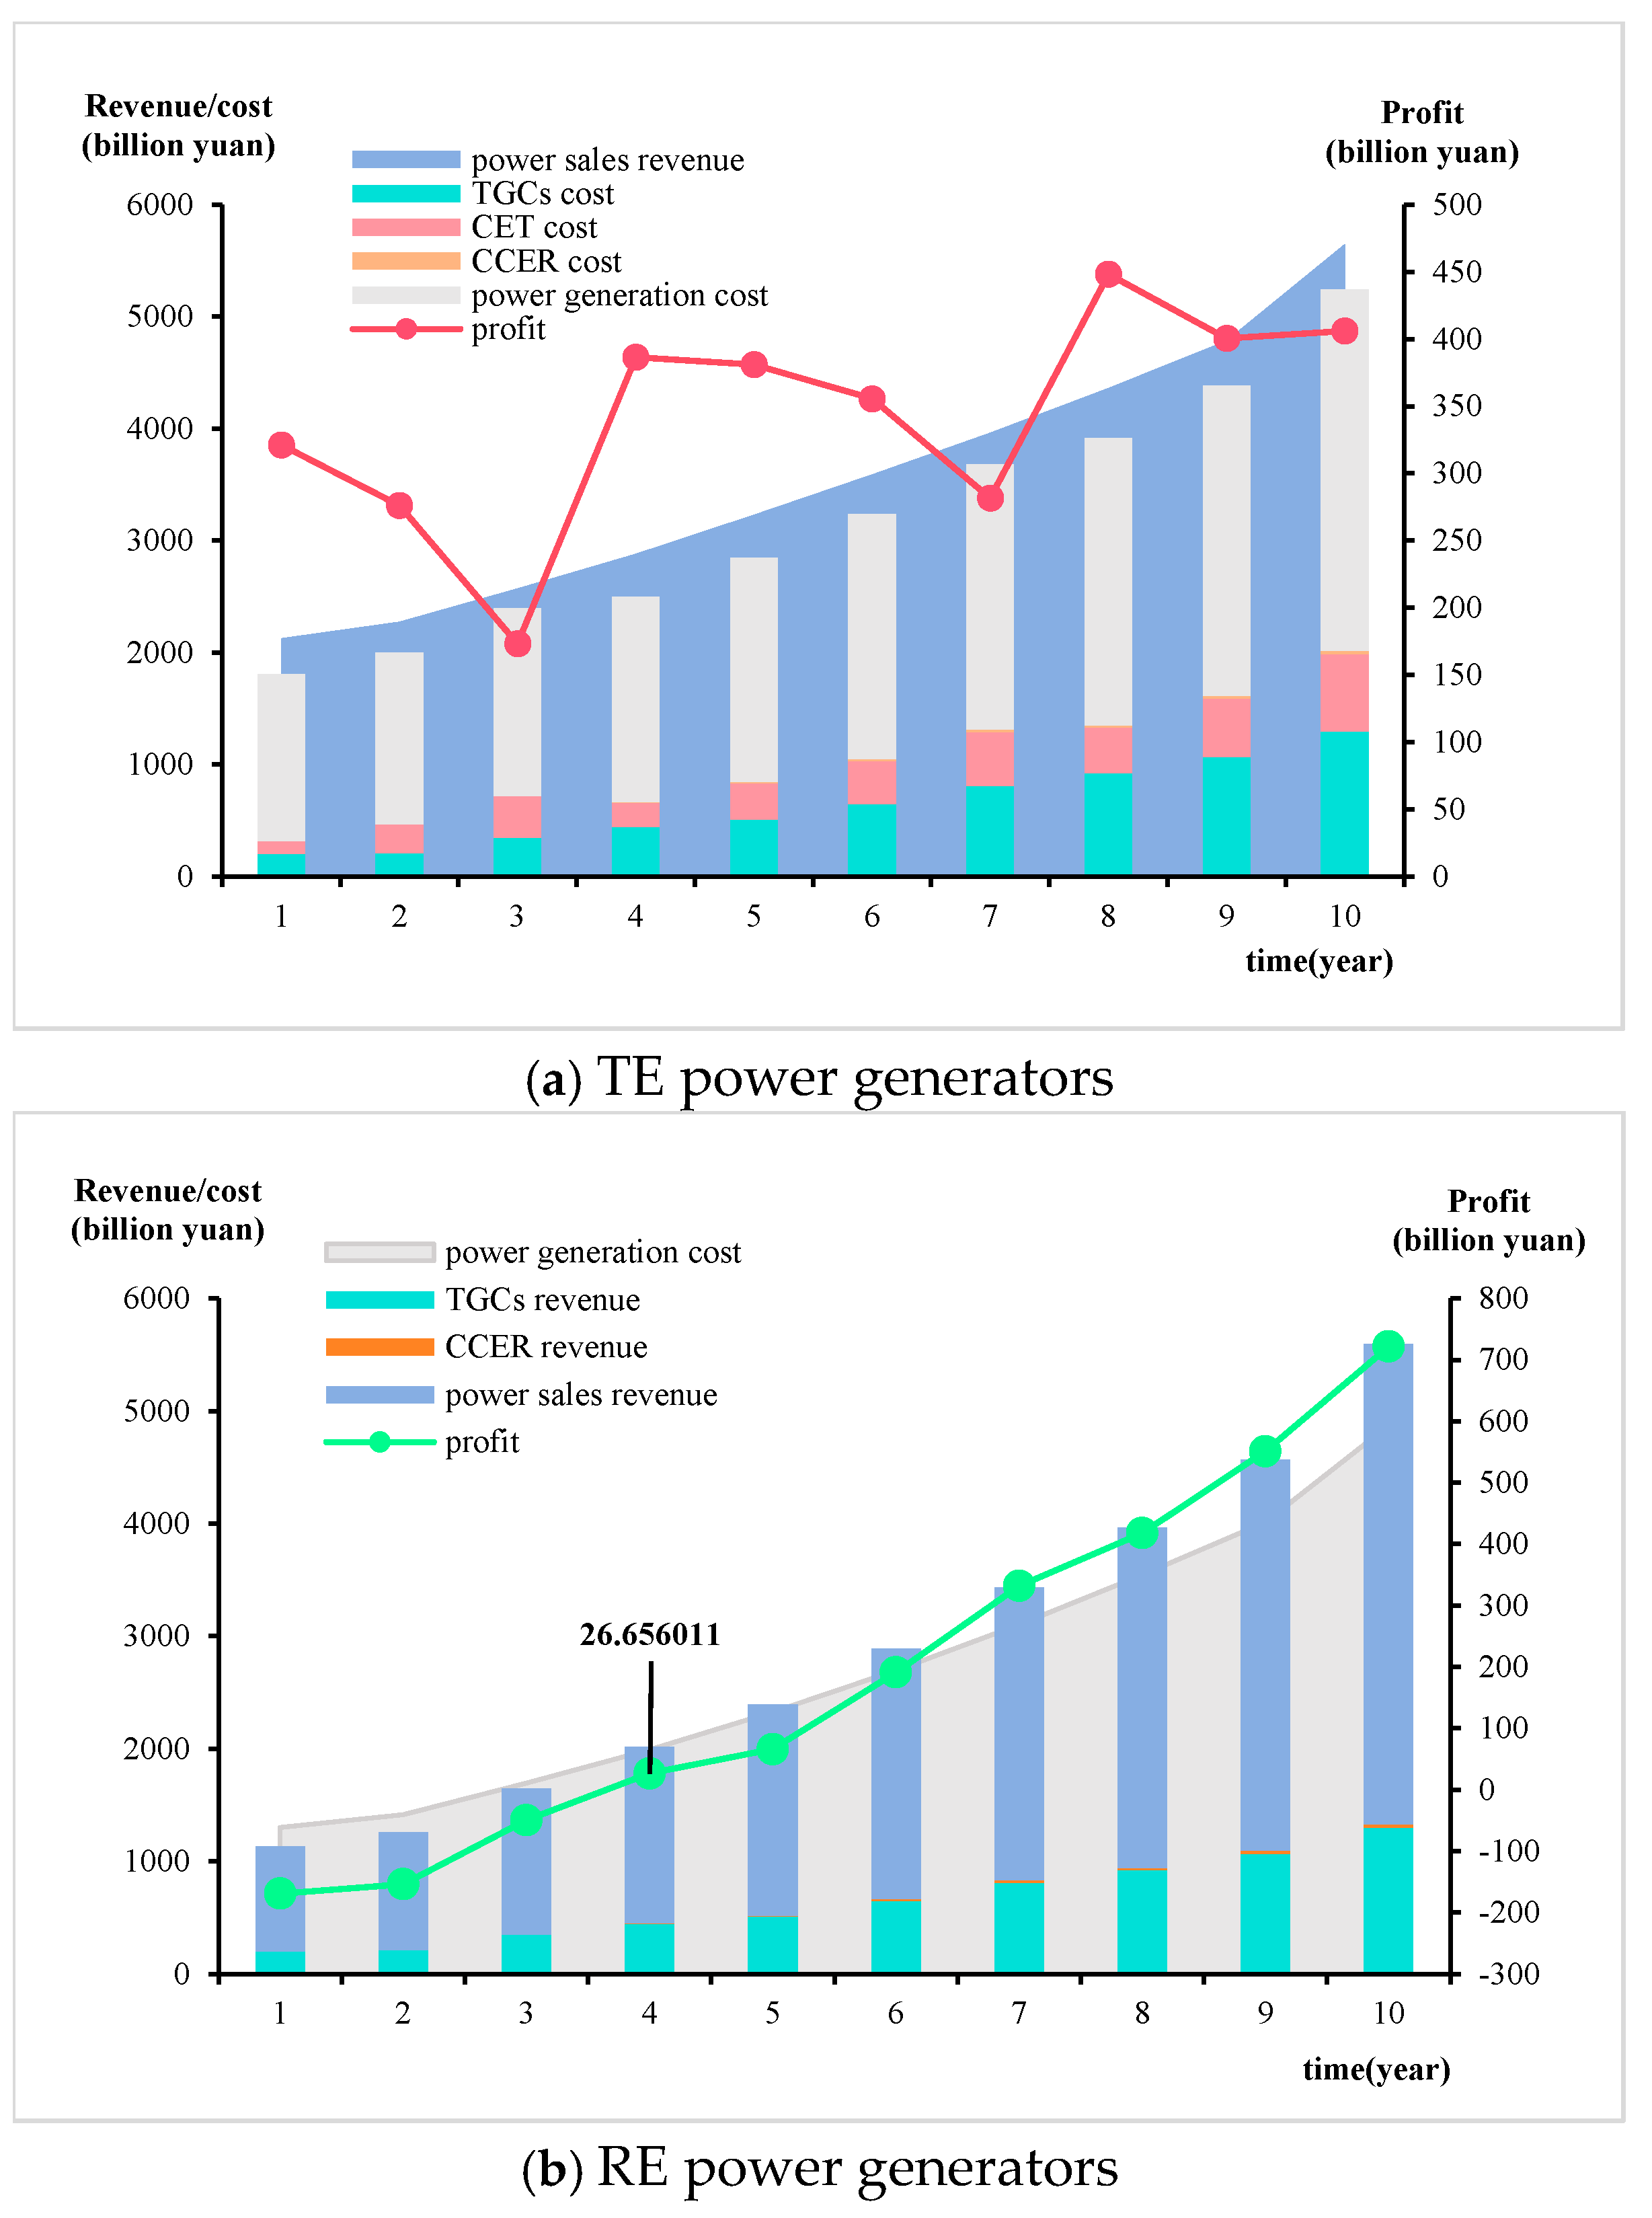
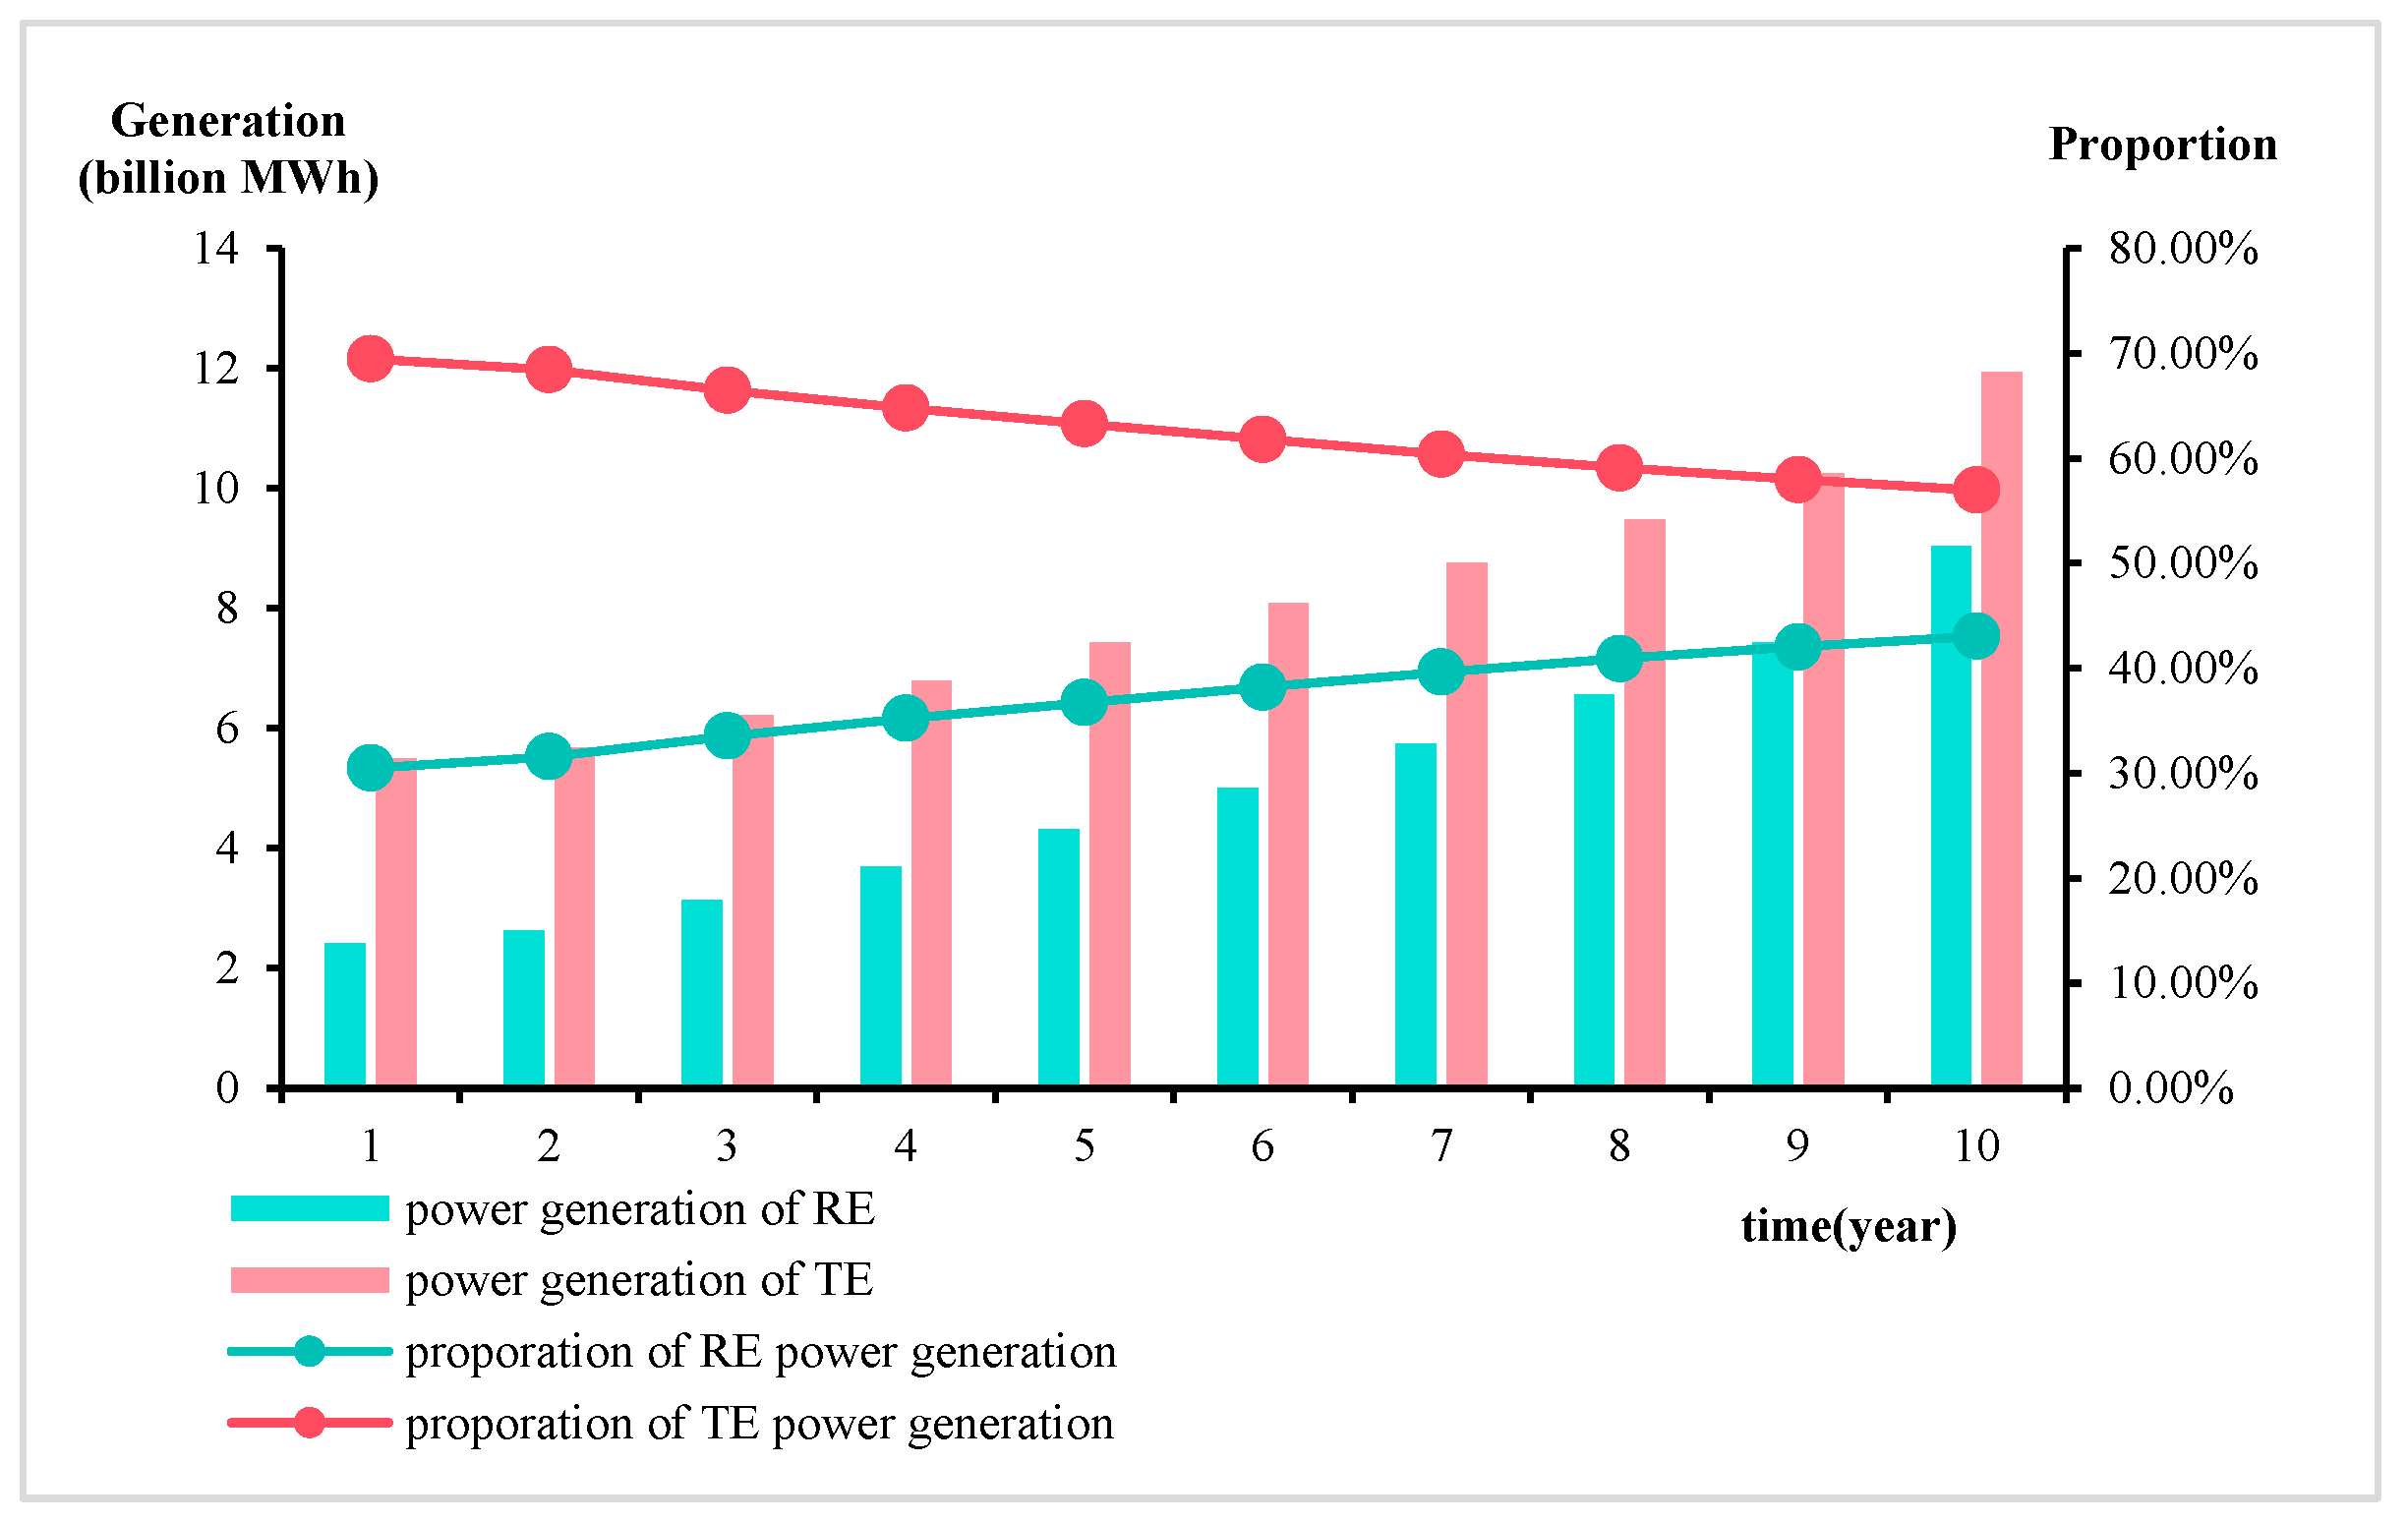
4. Results and Discussion

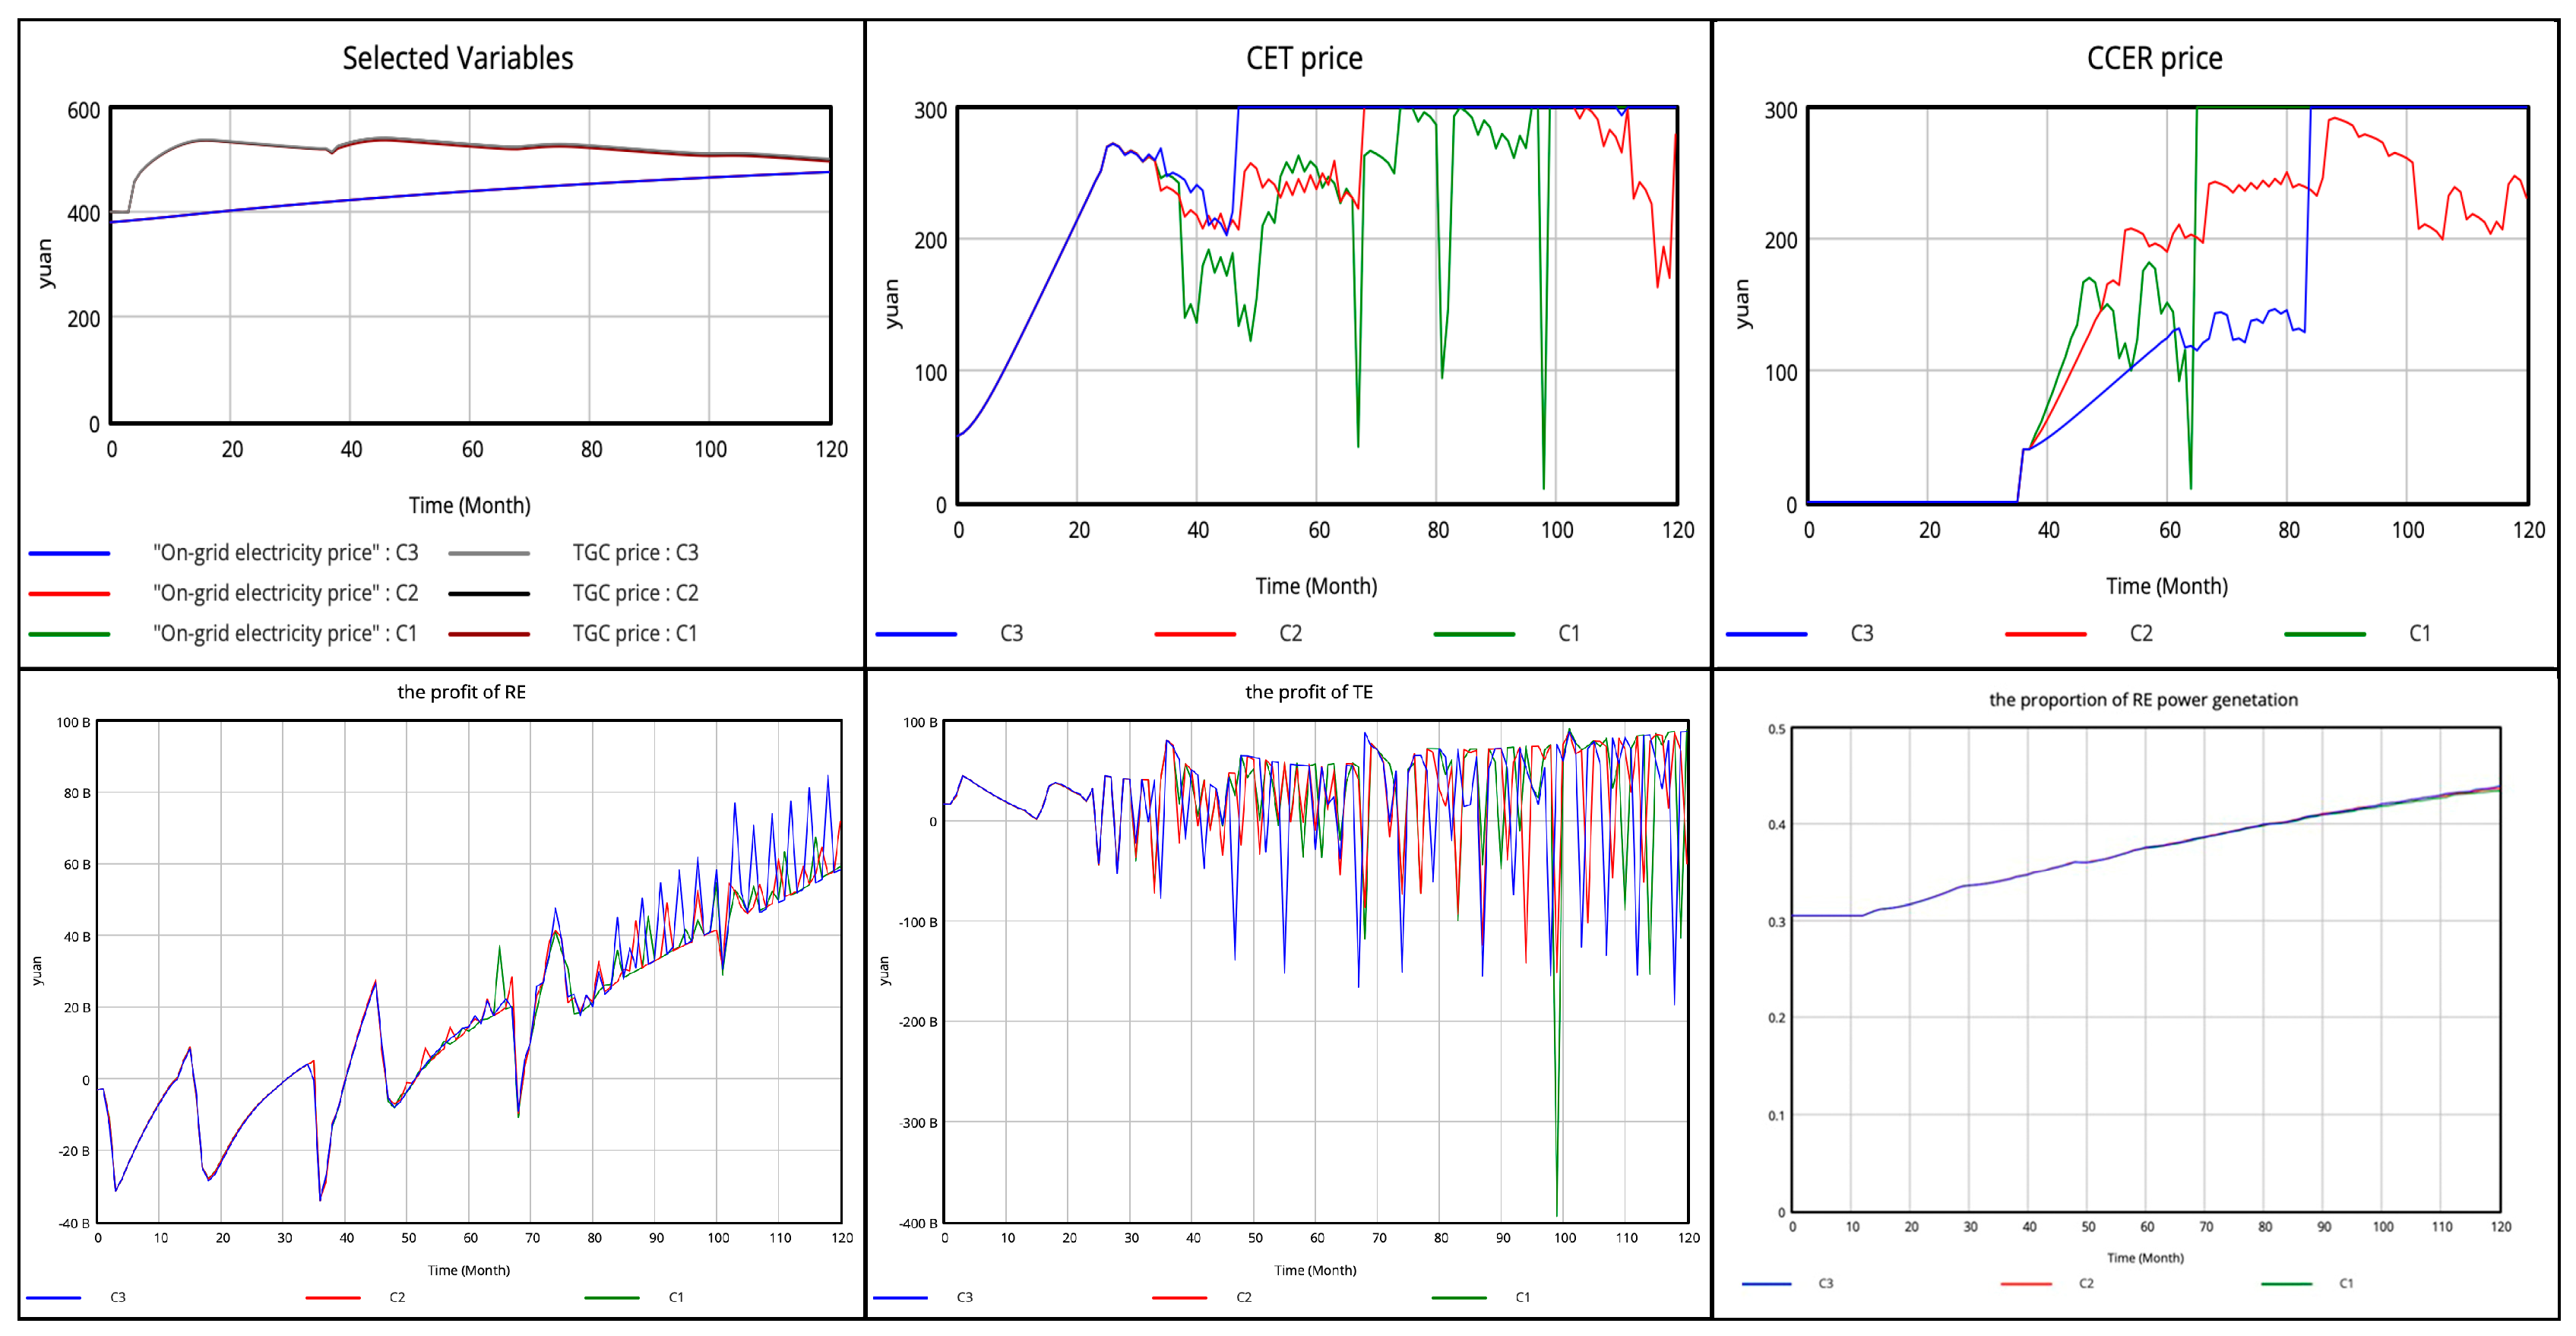
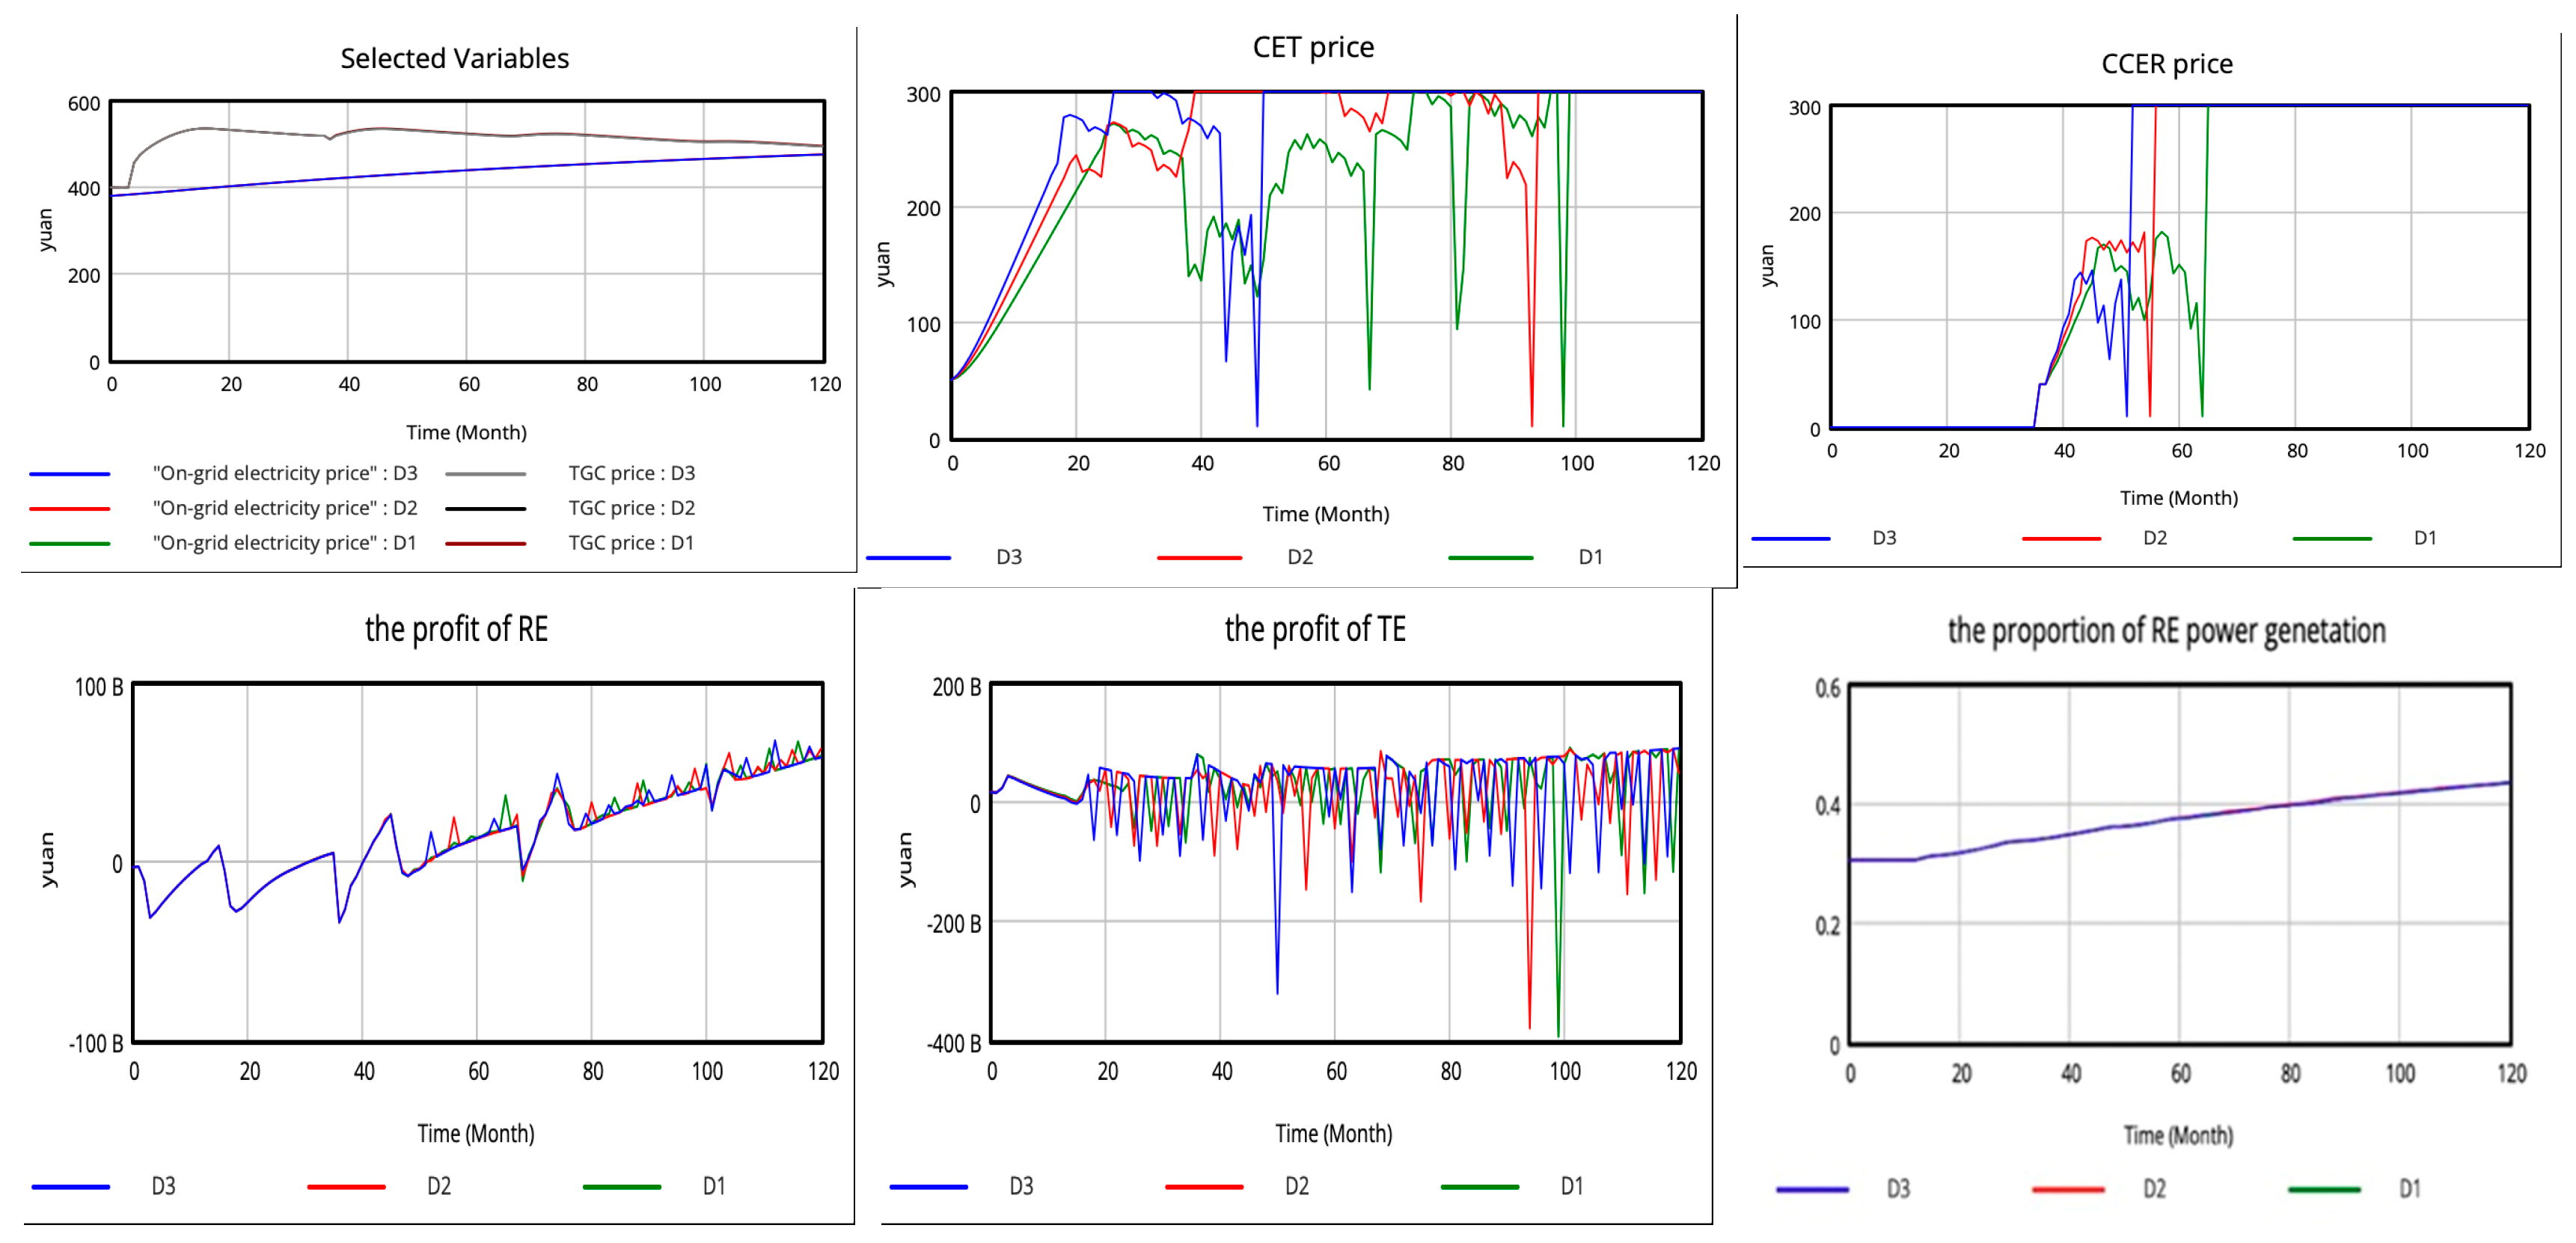
4.1. Simulation Results

The standard scenarios of the SD model are set up based on the data in Section 3.5 to simulate the operation of the carbon–electricity–certificate market under the RPS, CET and CCER mechanisms. The results are shown below.
(1)
Market prices
As shown in Figure 7, Under the RPS, CET and CCER mechanisms, the on-grid electricity price continues to rise in response to changes in TGC and CET prices. In the TGC market, the price increases rapidly and then gradually decreases to 500 CNY. Although the restart of CCER caused a short-term rebound in TGC prices, the downward trend has not been altered. In the carbon market, CET prices rose rapidly in the early years, rising from 50 CNY/ton to 300 CNY/ton over a two-year period and fluctuating slightly at this price level. After the CCER restart, the demand for CET declined and the price fell drastically to 150–200 CNY/ton, while the price of CCERs rose rapidly to become equal to the price of CETs within a year. As the CCER market developed, both CET prices and CCER prices stabilized, rising to a price ceiling after a period of volatility. During this period, the CET price is always higher than the CCER price, and the degree and duration of volatility are greater than that of CCER. The results show that higher CET and CCER prices bring about a continuous increase in the on-grid electricity price while also being subject to small fluctuations as a result of the TGC mechanism.
(2)
Power generators’ profits
In Figure 8, under the joint trading of the TGC, CET and CCER markets, although both RE and TE power generator profits are on an upward trend during the modelling period, the profit curve of TE is more volatile and has a smaller value of increase, increasing by only 26% over 10 years. On the contrary, RE’s profit curve fluctuates less but has a greater added value, turning losses into profits since 2024, increasing by 545% in 10 years. In the cost component of TE power generators, the power generation cost is the highest, followed by TGC cost and CET cost. The revenue component of RE power generators is highest in power sales, followed by TGC revenues. However, it is worth noting that CCER does not play a big role in it, which may be because the current CCER market has not been fully developed or the participation of market players is insufficient.
(3)
Power generation structure
According to Figure 9, with the implementation of RPS, CET and CCER market mechanisms, RE generation will reach 4.3 trillion kWh in 2025, far exceeding the target of 3.3 trillion kWh set out in 14th Five-Year Plan for renewable energy development. In 2030, TE and RE generation will reach 11.94 trillion kWh and 9.03 trillion kWh, respectively. Within 10 years, the share of TE power generation decreases annually, from 69.49% to 56.95%, while the proportion of RE power generation increases annually, from 30.51% to 43.05%. According to this trend, in 2035, China’s RE power generation will be equal to TE power generation, and RE energy will replace TE as the primary source of power supply, optimizing the power generation structure and promoting low-carbon transformation of the electricity sector.

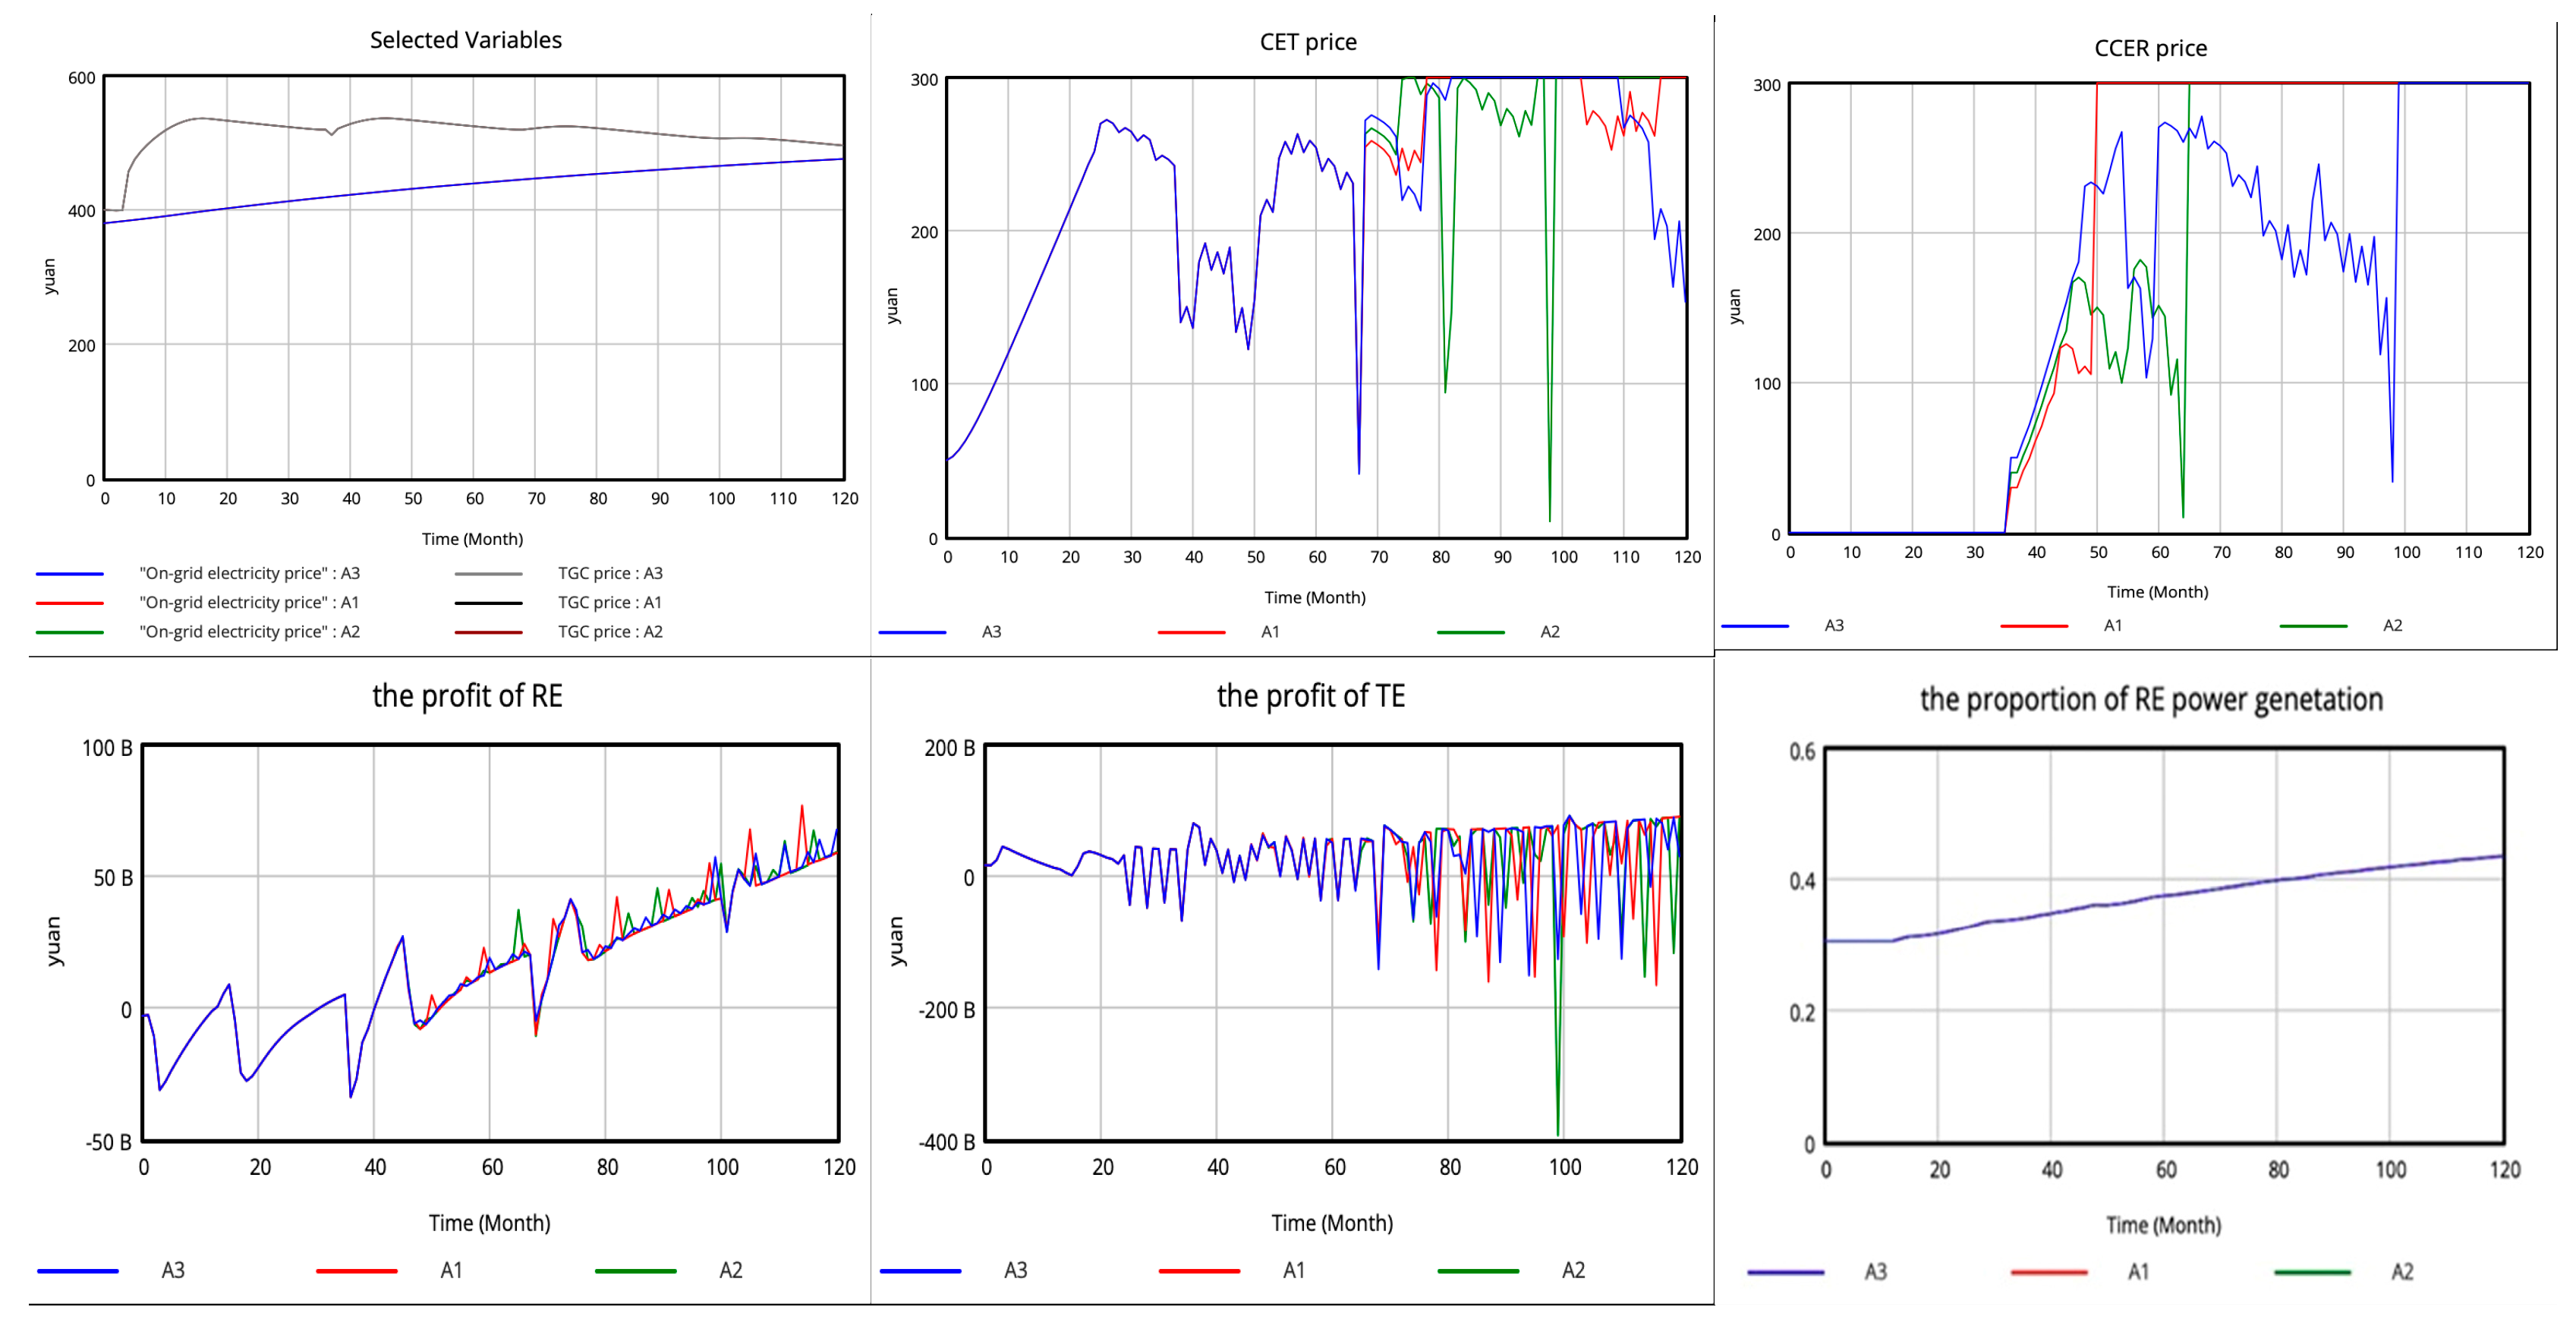
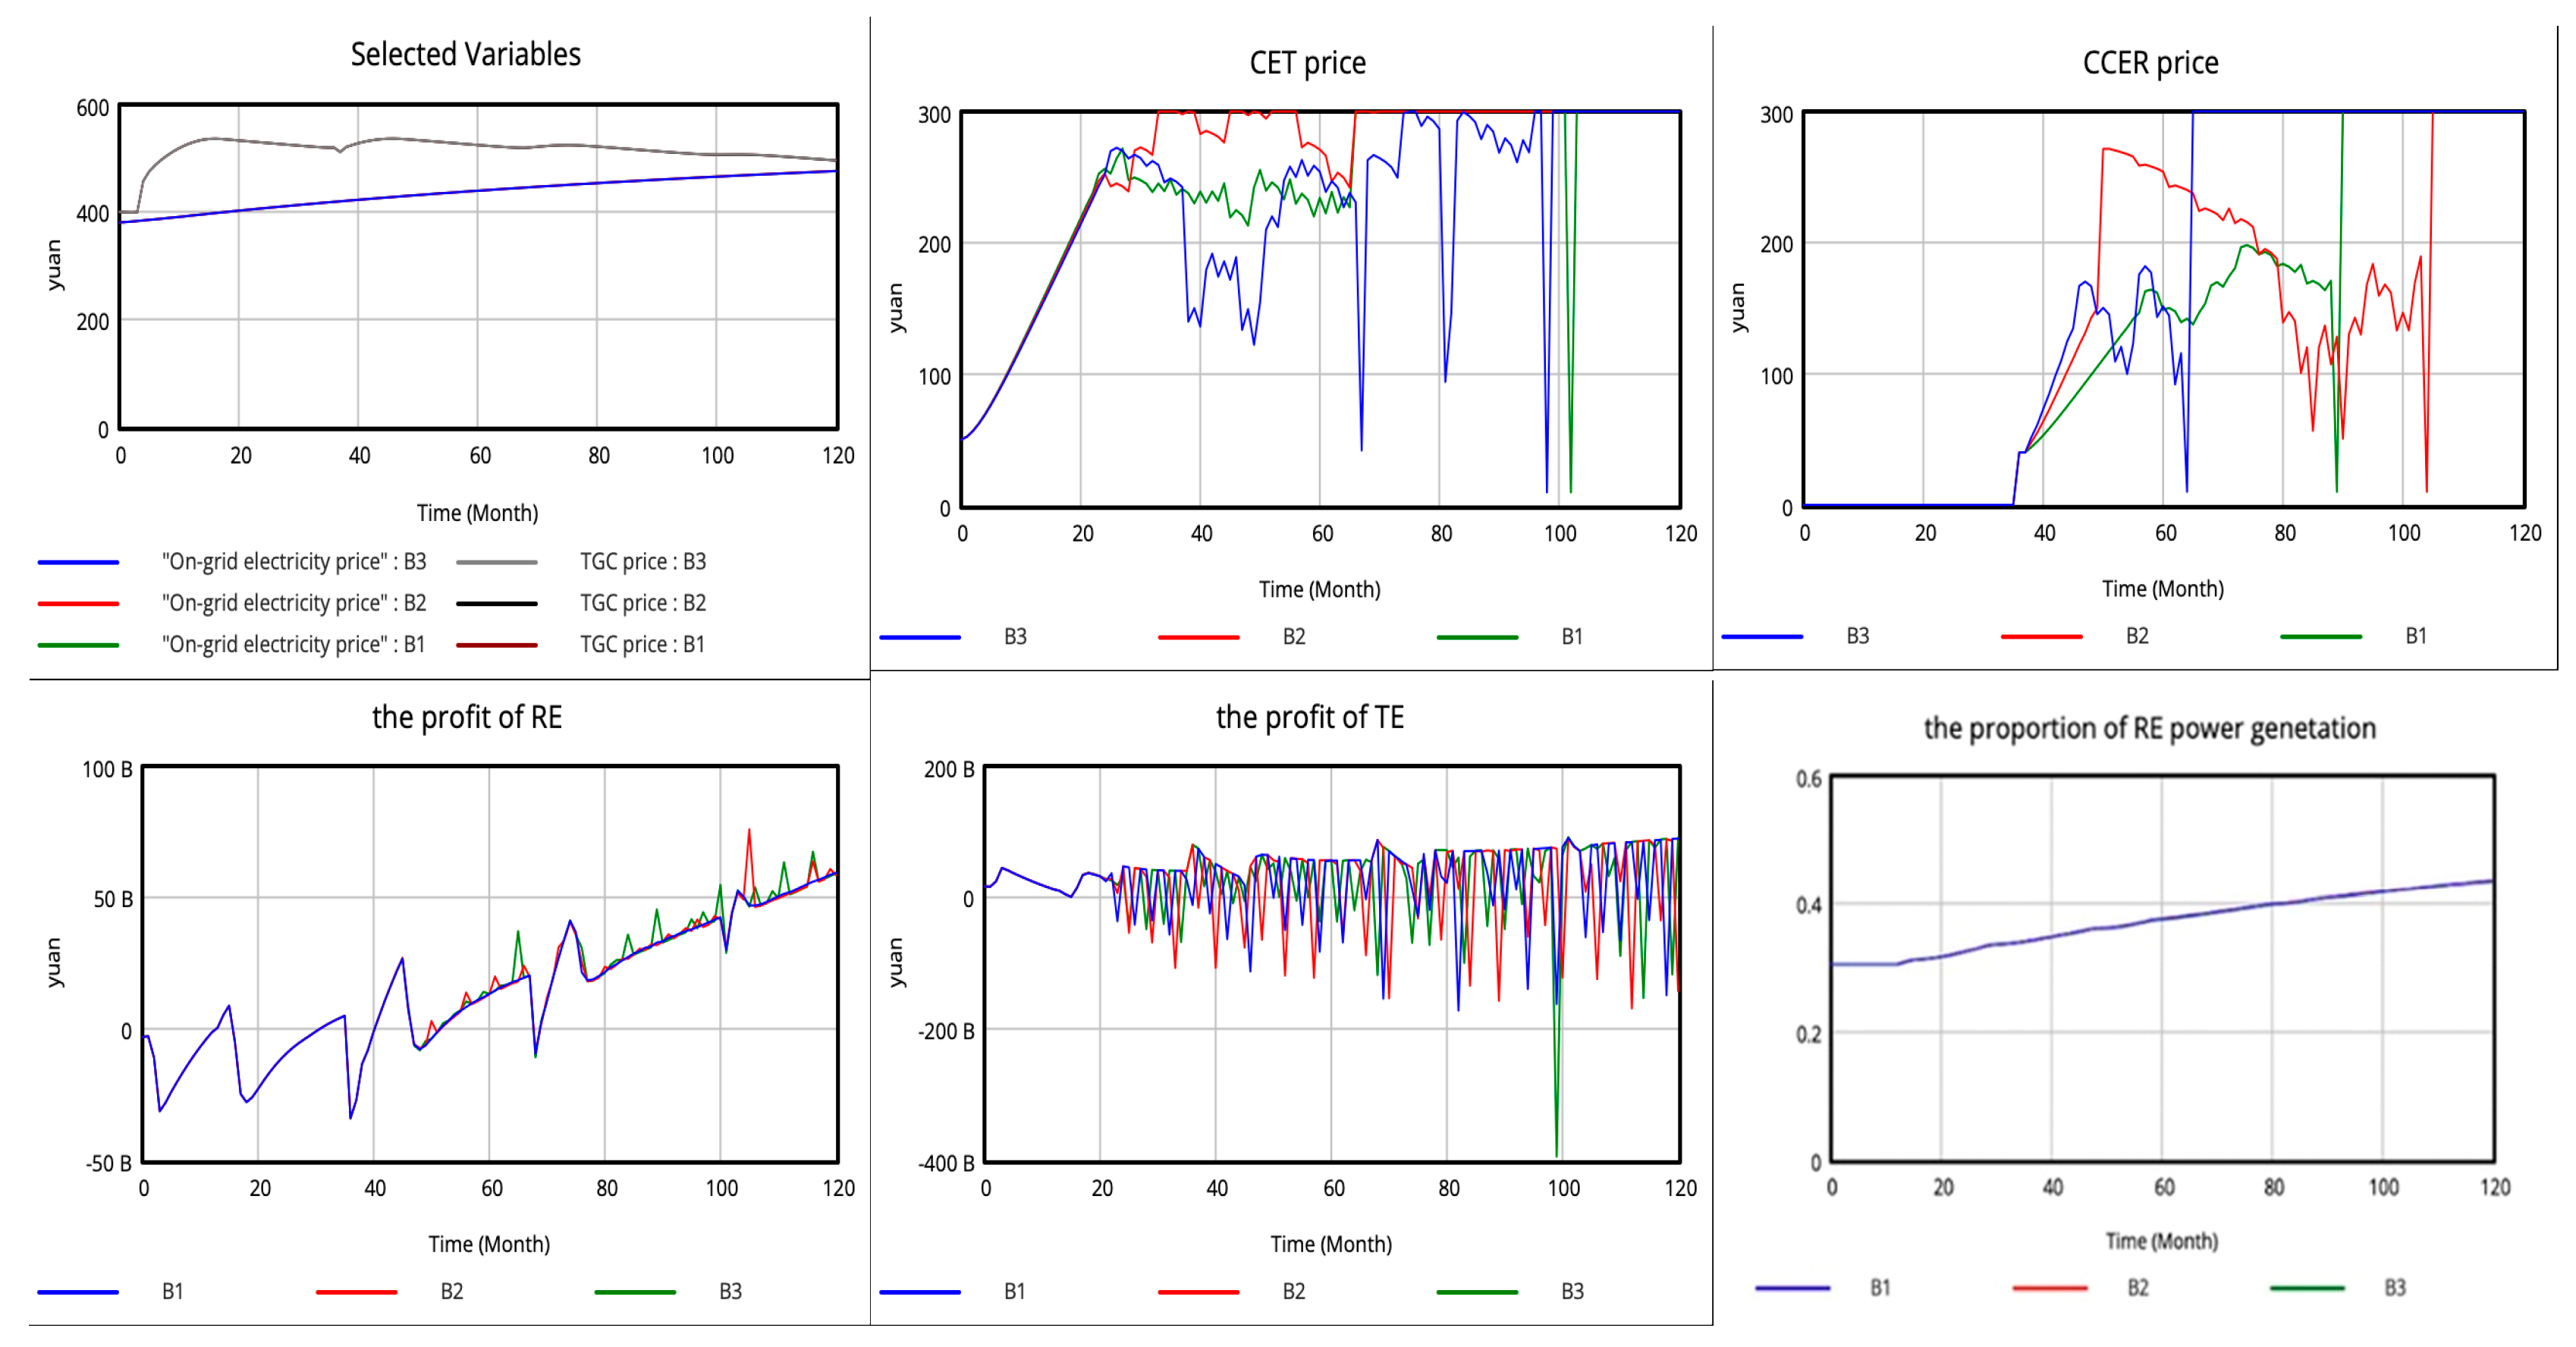
4.2. Sensitivity Analysis

According to Section 4.1, it is observed that the CCER price significantly affects the TGC, CET and on-grid electricity price, but the CCER revenues or costs make a very limited contribution to generator profits. Different from the RPS and CET policies, a change in CCER policy would not only affect the equilibrium in its own market but would also change the supply in the RPS market and demand in the CET market, affecting the effectiveness of three market mechanisms at the same time. Therefore, four variables, CCER benchmark price, CCER offset ratio, CCER participation proportion and CET fine, are selected for sensitivity analysis to explore the impact on the TGC, CET, CCER and electricity markets under the CCER policy changes.

4.2.1. CCER Benchmark Price

Changes in the benchmark price may cause large changes in the overall level of prices. In this section, sensitivity analyses are conducted on the CCER benchmark price, and three scenarios are set to make the CCER benchmark price equal to or less than the CET benchmark price, as follows:
Scenario A1: CCER benchmark price = 30 CNY.
Scenario A2: CCER benchmark price = 40 CNY.
Scenario A3: CCER benchmark price = 50 CNY.
As shown in Figure 10, with the CCER benchmark price rising, the CCER price fluctuates for a longer time to reach the price ceiling while having little impact on CET, TGCs and electricity prices. The longer fluctuation time of CCER indicates that the increase in the CCER benchmark price reduces TE power generators’ willingness to purchase CCER, relatively reduces CCER market demand, and causes the price to fluctuate at a low level for a period. This reduces the performance costs of TE power generators and increases profits. However, since the proportion of carbon emissions that CCER can offset is very limited and the market capacity is small, it will not have a significant impact on the power generation structure.

4.2.2. CCER Offset Ratio

The CCER offset ratio directly affects demand in the CCER market. According to the “Management Measures for Voluntary Greenhouse Gas Emission Reduction Trading (Trial)”, the offset ratio should be less than 5% of verified emissions. This section conducts a sensitivity analysis of the CCER offset ratio, and three scenarios are set as follows:
Scenario B1: CCER offset ratio = 2%.
Scenario B2: CCER offset ratio = 3.5%.
Scenario B3: CCER offset ratio = 5%.
As shown in Figure 11, when the CCER offset rate rises, the CET price will fall relatively, and the CCER price volatility period will be shortened, while the impact on TGCs and electricity prices will be small. This is because the CCER offset ratio will directly affect the demand in the CCER and CET market, so it will have a greater impact on the CCER and CET price but will have a smaller impact on the TGC market. When the government-mandated deduction ratio increases, the demand in the CCER market will increase, causing the price to increase faster. At the same time, as more carbon allowance demands are met by CCER, the demand in the CET market will decrease, causing the CET price to drop, resulting in a reduction in TE power generators’ compliance costs and an increase in profits, but the change in the power generation structure is still not obvious.

4.2.3. CCER Participation Proportion

The CCER participation proportion directly affects supply in the CCER market. In this section, sensitivity analyses of the CCER participation proportion are conducted, and the following three scenarios are set to increase the CCER participation proportion from the standard scenario, as follows:
Scenario C1: CCER participation proportion = 1%.
Scenario C2: CCER participation proportion = 1.5%.
Scenario C3: CCER participation proportion = 3.5%.
As shown in Figure 12, when the CCER participation proportion decreases, the CCER price increases, the CET price fluctuates more obviously, and it has no effect on TGC and electricity market prices. The reason is that the smaller the proportion of RE generators choosing to participate in the CCER market, the more supply will be provided in the TGC market, and the less supply will be provided in the CCER market, causing prices to rise. The change in price drives TE generators to favor CET purchases, thus making CET price volatility more noticeable. For the TGC market, due to the large market capacity, small changes in the participation ratio will not have a great impact on market supply and demand, so the price curve has not changed, and there is little impact on the profits of power generators and the power structure.

4.2.4. CET Fine

According to the “Interim Regulations on Carbon Emission Trading Management 4.3. Discussion” issued in 2024, a fine of 5- to 10-times the amount of the contract will be imposed on companies that fail to fulfill their obligations. In this section, three scenarios are set for the CET fine, making it 6-times, 8-times and 10-times the CET benchmark price, as follows:
Scenario D1: CET fine = 300 CNY.
Scenario D2: CET fine = 400 CNY.
Scenario D3: CET fine = 500 CNY.
As shown in Figure 13, as the CET fine increases, the prices of the CET and CCER both increase. This is because the CET fine level affects the demand for the CET and CCER markets. The higher the fine, the more actively companies participate in CCER and CET market transactions, increasing market demand and, thus, rapidly increasing the prices of CET and CCER. In addition, because the CET fine will not affect the TGC market, the price of TGCs will not change significantly. From the perspective of the profits of generators, due to the small share of RE power generators in CCER market, and due to the fact that the carbon market does not affect transactions in the TGC market, the profits of RE power generators have not changed, but the profits of TE power generators will decline as a result, resulting in more losses. However, this still has little impact on the proportion of power generation.

4.3. Discussion

(1) Relationship between market prices. In Section 4.1, this study simulates the equilibrium price of the carbon–electricity–certificate market under the standard scenario to explore the relationship between market prices. Firstly, it can be seen that the prices of CET and TGCs move inversely. This is consistent with the conclusions of Li et al. [24] and Ma et al. [25]. Secondly, as for CCER and TGCs, since the supply of both by RE power generators is mutually exclusive, the CCER price is complementary to the TGC price. Again, although both CCER and CET prices are rising, the CET price will always be higher than the CCER price before reaching the ceiling. This is consistent with historical price data from carbon market trading pilot regions. Finally, as for electricity prices, the decline in TGC prices cannot offset the effect of rising CET and CCER prices on the electricity price. Therefore, carbon prices have a greater impact on on-grid electricity prices.
(2) Impact of market mechanisms on generators’ power production. In Section 4.1, this study also simulates the profits and power generation of TE and RE power generators under the standard scenario to evaluate the future development trend of China’s power generation structure. For TE power generators, the rise in CET and CCER market prices causes the performance costs of TE power generators to fluctuate and rise, thereby reducing the profit growth rate, which is unhelpful to their long-term development. As for RE power generators, the continued growth in CET and TGC revenues leads to a surge in generator profits. Under market mechanisms, the installed capacity and generation of RE power generators increase year by year, boosting the RE industry and optimizing the power generation structure, which is in line with the conclusions of Kilinc-Ata et al. [28] and Feng et al. [29].
(3) Impact of different CCER policies on TGC and CET markets. In Section 4.2, this study selects four policy parameters of CCER for sensitivity analysis to reveal the impact of different CCER policies on the TGC and CET markets. Different CCER parameters will directly affect the supply and demand of TGC, CET and CCER markets, thus influencing the equilibrium prices. As the CCER market has just been restarted, the participation proportion of RE power generators is low, and the market capacity is small, so it is unable to have a decisive impact on the power generation structure. However, an excessively high CCER offset ratio may reduce CET market demand, resulting in a sluggish CET price and weakening the effect of carbon emission reduction. It can be seen that the smooth promotion of CCER depends on the scientific design of the system mechanism, which is consistent with the conclusion of Hu et al. [44].
It should be noted that the system dynamics model constructed in this study makes a number of assumptions that should be addressed in future work to produce more general results. These include the variety of green certificates traded and the price constraints in each market, which affect the trading strategies and behavioral choices exhibited by different market participants. In addition, due to the large structure of the model, many variables and parameters are included internally. These issues led to some of the results showing dramatic fluctuations that are difficult to control and affect the scientific validity of this study’s conclusions.
In September 2024, the National Energy Administration and the General Office of the Ministry of Ecology and Environment issued a notice clearly pointing out that renewable energy power generators can independently choose to legally trade TGCs or apply for CCER. Therefore, renewable energy power producers are faced with the transactional puzzle of choosing between the CCER and TGC markets for trading the environmental value of green power. In addition, the expansion of the national carbon market has accelerated significantly since 2024. Carbon market construction will be further strengthened with the inclusion of the cement, steel and electrolytic aluminum industries. In the future, when all key industries are successively included in the trading scope of the CET market, what are the possible heterogeneous impacts of the RPS–CET–CCER coupling mechanism in different industries? How should it be designed to accommodate a wider range of trading needs? These issues deserve in-depth study in our future work.

5. Conclusions and Policy Implications

5.1. Conclusions

The 14th Five-Year Plan for renewable energy development clearly puts forward the basic principle of adhering to the market-led principle, emphasizing the market’s decisive role in the allocation of resources [45]. At present, the market mechanisms involved in China’s electricity market mainly include RPSs, CET and CCER. In this study, we construct an SD model to explores whether and how market mechanisms can optimize the power generation structure, and sensitivity analyses of CCER policy parameters are carried out to identify the impacts and scope for improvement. Based on the above discussion, this study draws the following conclusions.
(1) The market equilibrium prices under RPS, CET and CCER mechanisms continue to change and influence each other. The price of TGCs drops slightly after rising, while the prices of CET and CCER increase with fluctuations. In this process, the market prices of CET and CCER change in the opposite direction to TGCs and show a significant improvement effect on the electricity price.
(2) The market mechanisms regulate the profit and power production of generators and optimize the power generation structure. The RPS mechanism has a greater impact on RE and TE power generators’ profit than the CET mechanism, which transfers part of the profits of TE power generators to RE power generators, increases investment and construction in future RE power plants, and, thus, increases the proportion of RE power generation, boosting the RE industry and promoting the low-carbon transformation of the power sector.
(3) The implementation of the CCER mechanism can make the CET price change more obvious and can effectively energize the carbon market. Reducing the CCER benchmark price and participation proportion, and increasing the CCER offset ratio and CET fines, can increase the CET and CCER prices, thereby increasing the costs of TE power generators, forcing them to reduce investment and construction plans and further optimizing the power production structure.

5.2. Policy Implications

Based on these conclusions, this study makes the following policy implications.
(1) Promote TGC separation from power trading and improve the trading liquidity. Currently, China’s TGC market is dominated by unsubsidized TGCs, with prices ranging from CNY 30 to 50. This lower price results in fewer revenues for RE power generators. Taking agroforestry biomass power generation as an example, the feed-in tariff for non-subsidized agroforestry biomass power producers will be around CNY 400/MWh for 2024 according to the feed-in tariff simulation in Section 4.2, and even with the revenue of TGCs, it will only be CNY 430–450/MWh, which is hardly enough to cover the power generation costs of most of the generators. The low price of TGCs will become an obstacle to the future development of the RE power generation industry. Compared with the green power trading, the trading mode of the certificate and power separation allows for a wider range of consumer purchases, which stimulates the demand from the source and raises the price of TGCs, thus increasing the market revenue of RE power generators. On the other hand, it is also necessary to give full play to the attributes of the green certificate financial derivatives through the secondary market transactions to improve TGC trading enthusiasm, so as to truly stimulate power consumption.
(2) The design of the CCER policy will not only affect the compliance costs of TE power generators but also the profitability of RE power generators, which is crucial for the optimization of the power generation structure. Currently, China’s CET price is about 90 CNY/t [46], far less than the international carbon price level, which is not helpful to China’s convergence with international carbon market. According to the analysis in Section 4.2, the CET price can be effectively increased by reducing the CCER offset ratio and increasing the CET fine. However, based on the analysis of the generator’s revenue and cost component structure in Section 4.1, it can be found that the profitability of CCER projects is too small, which is not only because the CCER price is low but also because the CCER market capacity is too small. In the research hypothesis, the scope of TGCs, CET and CCER transactions is controlled within the electricity market, but directly increasing the CCER offset ratio and CCER participation proportion to increase the demand and supply of CCER in the power market cannot effectively increase the RE generator’s revenue. Therefore, the development of China’s CCER mechanism needs to expand industry coverage, accelerate the inclusion of other key carbon emission entities, and encourage and guide various market players to actively participate in CCER transactions, so as to better play the guiding role of the CCER mechanism on RE investment.

Supplementary Materials

The following supporting information can be downloaded at https://www.mdpi.com/article/10.3390/en18040894/s1, Table S1: model validation.

Author Contributions

Conceptualization, S.Y.; data curation, S.Y.; formal analysis, S.Y.; methodology, S.Y.; investigation, S.Y.; software, S.Y.; validation, S.Y.; writing—original draft preparation, S.Y.; writing—review and editing, S.Y.; project administration, F.M.; supervision, F.M.; funding acquisition, F.M. All authors have read and agreed to the published version of the manuscript.

Funding

This research was funded and supported by the Fundamental Research Funds for the Central Universities (Grant No. 2021SJZ01).

Data Availability Statement

The original contributions presented in this study are included in the article. Further inquiries can be directed to the corresponding author.

Conflicts of Interest

The authors declare no conflicts of interest.

Abbreviations

Parameters
ω 1 Proportion of RE environmental value traded in the TGC market
ω 2 Proportion of RE environmental value traded in CCER market
p r o p R P S RPSs quota
CCER offset ratio
α The proportion of carbon emissions from the power sector
ϵ Carbon emission factors for electricity
β Growth rate of electricity demand
C E G D P Carbon emissions per unit of GDP
e d Price elasticity of demand for electricity
M C r / t Marginal cost of RE/TE power generation.
γ Index of RE generator’s future investment and construction plan
λ Index of TE generator’s future investment and construction plan
h o u r s r / t RE/TE power annual utilization hours
Variables
Q r / t RE/TE power generation
T G C / C C E R / C E T s u p p l y The total supply of TGC/CET/CCER market
T G C / C C E R / C E T d e m a n d The total demand of TGC/CET/CCER market
P T G C / C E T / C C E R , t TGCs/CET/CCER/Electricity real-time price at time t
P T G C / C E T / C C E R / e , 0 TGCs/CET/CCER/Electricity benchmark price
P T G C / C E T / C C E R , m a x Maximum prices for TGCs/CET/CCER
f R P S / C E T Unit default fines for RPS or CET mechanisms
P T G C / C E T / C C E R TGCs/CET/CCER trading price
T G C / C C E R / C E T p u r c h a s e Expected purchases volume of TGCs/CET/CCER
T G C / C C E R / C E T s a l e s Expected sales volume of TGCs/CET/CCER
T G C / C C E R / C E T t r a d i n g Actual trading volume of TGCs/CET/CCER
T G C / C C E R / C E T b u y e r s TGCs/CET/CCER holding of the buyers
T G C / C C E R / C E T s e l l e r s TGCs/CET/CCER holding of the sellers
R T G C / C E T / C C E R TGCs/CET/CCER sales revenue
C T G C / C E T / C C E R TGCs/CET/CCER purchases cost
GDPGross domestic product
D e The total demand of electricity
D e , 0 Initial electricity demand of 2021
D e , t Real-time electricity demand
R e , r / t RE/TE power generator’s revenue from the sale of electricity
C e , r / t RE/TE power generator’s cost from power generation
c o e r / t RE/TE power generator’s investment coefficient
C P r / t RE/TE power generator’s future investment plan
I C f i n i s h e d , r / t RE/TE power generator’s finished installed capacity
I C c u m , r / t RE/TE power generator’s cumulative installed capacity
R E p r o Proportion of RE/TE generation to total electricity generation

References

  1. The State Council Information Office of the People’s Republic of China. Available online: http://www.scio.gov.cn/zfbps/32832/Document/1695117/1695117.htm (accessed on 18 October 2021).
  2. Cui, H.; Zhao, T.; Wu, R. CO2 emissions from China’s power industry: Policy implications from both macro and micro perspectives. J. Clean. Prod. 2018, 200, 746–755. [Google Scholar] [CrossRef]
  3. Jaccard, M. Renewable portfolio standard. Encycl. Energy 2004, 5, 413–421. [Google Scholar]
  4. People’s Daily. Available online: http://paper.people.com.cn/rmrb/html/2023-11/17/nw.D110000renmrb_20231117_2-08.htm (accessed on 17 November 2023).
  5. Xin-gang, Z.; Lei, X.; Ying, Z. How to promote the effective implementation of China’s renewable portfolio standards considering non-neutral technology? Energy 2022, 238, 121748. [Google Scholar] [CrossRef]
  6. Hu, Y.; Ren, S.; Wang, Y.; Chen, X. Can carbon emission trading scheme achieve energy conservation and emission reduction? Evidence from the industrial sector in China. Energy Econ. 2020, 85, 104590. [Google Scholar] [CrossRef]
  7. Zhao, X.; Wu, L.; Li, A. Research on the efficiency of carbon trading market in China. Renew. Sustain. Energy Rev. 2017, 79, 1–8. [Google Scholar] [CrossRef]
  8. Lin, B.; Huang, C. Analysis of emission reduction effects of carbon trading: Market mechanism or government intervention? Sustain. Prod. Consum. 2022, 33, 28–37. [Google Scholar] [CrossRef]
  9. Ning, Z.; Jun, P. The economic impacts of introducing CCER trading and offset mechanism into the national carbon market of China. Adv. Clim. Change Res. 2022, 18, 622. [Google Scholar]
  10. Lo, A.Y.; Cong, R. After CDM: Domestic carbon offsetting in China. J. Clean. Prod. 2017, 141, 1391–1399. [Google Scholar] [CrossRef]
  11. Wang, T.; Gong, Y.; Jiang, C. A review on promoting share of renewable energy by green-trading mechanisms in power system. Renew. Sustain. Energy Rev. 2014, 40, 923–929. [Google Scholar] [CrossRef]
  12. Kilinc-Ata, N. The evaluation of renewable energy policies across EU countries and US states: An econometric approach. Energy Sustain. Dev. 2016, 31, 83–90. [Google Scholar] [CrossRef]
  13. Kilinc-Ata, N.; Proskuryakova, L.N. The contribution of energy policies to green energy transition in the Asia-Pacific region. Renew. Energy 2024, 237, 121797. [Google Scholar] [CrossRef]
  14. Fan, J.L.; Wang, J.X.; Hu, J.W.; Wang, Y.; Zhang, X. Optimization of China’s provincial renewable energy installation plan for the 13th Five-year plan based on renewable portfolio standards. Appl. Energy 2019, 254, 113757. [Google Scholar] [CrossRef]
  15. Wu, J.; Chen, Y.; Yu, L.; Li, G.; Li, J. Has the evolution of renewable energy policies facilitated the construction of a new power system for China? A system dynamics analysis. Energy Policy 2023, 183, 113798. [Google Scholar] [CrossRef]
  16. Zhang, F.; Li, Y.; Li, F.; Yuan, J.; Li, Y. Decision-making behavior of power suppliers in the green certificate market: A system dynamics analysis. Energy Policy 2022, 171, 113296. [Google Scholar] [CrossRef]
  17. Ying, Z.; Xin-gang, Z.; Lei, X. Supply side incentive under the Renewable Portfolio Standards: A perspective of China. Renew. Energy 2022, 193, 505–518. [Google Scholar] [CrossRef]
  18. Ying, Z.; Xin-gang, Z.; Zhen, W. Demand side incentive under renewable portfolio standards: A system dynamics analysis. Energy Policy 2020, 144, 111652. [Google Scholar] [CrossRef]
  19. Lin, B.; Jia, Z. Is emission trading scheme an opportunity for renewable energy in China? A perspective of ETS revenue redistributions. Appl. Energy 2020, 263, 114605. [Google Scholar] [CrossRef]
  20. Shi, M.; Zou, T.; Xu, J.; Wang, J. Can carbon emissions trading scheme make power plants greener? Firm-level evidence from China. Front. Energy Res. 2022, 10, 906033. [Google Scholar] [CrossRef]
  21. Sun, K.; Zhou, F.; Liu, X. Study on the impact of emission trading scheme on technological progress of power generation sector in China: A perspective from energy transition. Energy 2024, 302, 131750. [Google Scholar] [CrossRef]
  22. Lin, B.; Jia, Z. What will China’s carbon emission trading market affect with only electricity sector involvement? A CGE based study. Energy Econ. 2019, 78, 301–311. [Google Scholar] [CrossRef]
  23. Shobande, O.A.; Ogbeifun, L.; Tiwari, A.K. Extricating the impacts of emissions trading system and energy transition on carbon intensity. Appl. Energy 2024, 357, 122461. [Google Scholar] [CrossRef]
  24. Li, J.; Hu, Y.; Chi, Y.; Liu, D.; Yang, S.; Gao, Z.; Chen, Y. Analysis on the synergy between markets of electricity, carbon, and tradable green certificates in China. Energy 2024, 302, 131808. [Google Scholar] [CrossRef]
  25. Ma, X.; Pan, Y.; Zhang, M.; Ma, J.; Yang, W. Impact of carbon emission trading and renewable energy development policy on the sustainability of electricity market: A stackelberg game analysis. Energy Econ. 2024, 129, 107199. [Google Scholar] [CrossRef]
  26. Li, C.; Wang, D.; Mao, J.; Chen, F. How to facilitate the implementation of the renewable portfolio standard? A system dynamics model analysis. Renew. Energy. 2024, 223, 120120. [Google Scholar] [CrossRef]
  27. Fikru, M.G.; Kilinc-Ata, N.; Belaïd, F. Climate policy stringency and trade in energy transition minerals: An analysis of response patterns. Res. Policy 2024, 96, 105236. [Google Scholar] [CrossRef]
  28. Kilinc-Ata, N.; Proskuryakova, L.N. Empirical analysis of the Russian power industry’s transition to sustainability. Util. Policy 2023, 82, 101586. [Google Scholar] [CrossRef]
  29. Feng, T.; Yang, Y.; Yang, Y. What will happen to the power supply structure and CO2 emissions reduction when TGC meets CET in the electricity market in China? Renew. Sustain. Energy Rev. 2018, 92, 121–132. [Google Scholar] [CrossRef]
  30. Chang, X.; Wu, Z.; Wang, J.; Zhang, X.; Zhou, M.; Yu, T.; Wang, Y. The coupling effect of carbon emission trading and tradable green certificates under electricity marketization in China. Renew. Sustain. Energy Rev. 2023, 187, 113750. [Google Scholar] [CrossRef]
  31. Liu, Y.; Mabee, W.; Zhang, H. Upgrading the development of Hubei biogas with ETS in China. J. Clean. Prod. 2019, 213, 745–752. [Google Scholar] [CrossRef]
  32. Li, K.; Qi, S.Z.; Yan, Y.X.; Zhang, X.L. China’s ETS pilots: Program design, industry risk, and long-term investment. Adv. Clim. Chang. Res. 2022, 13, 82–96. [Google Scholar] [CrossRef]
  33. Yan, Y.; Zhang, X.; Zhang, J.; Li, K. Emissions trading system (ETS) implementation and its collaborative governance effects on air pollution: The China story. Energy Policy 2020, 138, 111282. [Google Scholar] [CrossRef]
  34. Zhang, Y.J.; Liu, J.Y.; Woodward, R.T. Has Chinese certified emission reduction trading reduced rural poverty in China? Aust. J. Agric. Resour. Econ. 2023, 67, 438–458. [Google Scholar] [CrossRef]
  35. He, Y.; Jiang, R.; Liao, N. How to promote the Chinese Certified Emission Reduction scheme in the carbon market? A study based on tripartite evolutionary game model. Energy 2023, 285, 128723. [Google Scholar] [CrossRef]
  36. Zhang, M.; Tan, J.; Cheng, E.T.C. Pricing of Chinese certified emissions reduction scheme in a supply chain under the cap-and-trade policy. Ecol. Chem. Eng. S 2024, 31, 31–48. [Google Scholar] [CrossRef]
  37. Wang, L.; Li, Z.; Xu, Z.; Yue, X.; Yang, L.; Wang, R.; Chen, Y.; Ma, H. Carbon emission scenario simulation and policy regulation in resource-based provinces based on system dynamics modeling. J. Clean. Prod. 2024, 460, 142619. [Google Scholar] [CrossRef]
  38. Sun, Y.; Liu, N.; Shang, J.; Zhang, J. Sustainable utilization of water resources in China: A system dynamics model. J. Clean. Prod. 2017, 142, 613–625. [Google Scholar] [CrossRef]
  39. Li, C.; Zhang, L.; Ou, Z.; Ma, J. Using system dynamics to evaluate the impact of subsidy policies on green hydrogen industry in China. Energy Policy 2022, 165, 112981. [Google Scholar] [CrossRef]
  40. Li, C.; Hao, Q.; Wang, H.; Hu, Y.; Xu, G.; Qin, Q.; Wang, X.; Negnevitsky, M. Assessing green methanol vehicles’ deployment with life cycle assessment-system dynamics model. Appl. Energy 2024, 363, 123055. [Google Scholar] [CrossRef]
  41. Li, G.; Kou, C.; Wang, Y.; Yang, H. System dynamics modelling for improving urban resilience in Beijing, China. Resour. Conserv. Recycl. 2020, 161, 104954. [Google Scholar] [CrossRef]
  42. Zhao, X.; Zhou, Y.; Zuo, Y.; Meng, J.; Zhang, Y. Research on optimal benchmark price of tradable green certificate based on system dynamics: A China perspective. J. Clean. Prod. 2019, 230, 241–252. [Google Scholar] [CrossRef]
  43. Lei, X.; Xin-gang, Z. The synergistic effect between Renewable Portfolio Standards and carbon emission trading system: A perspective of China. Renew. Energy 2023, 211, 1010–1023. [Google Scholar] [CrossRef]
  44. Hu, Y.; Chi, Y.; Zhou, W.; Li, J.; Wang, Z.; Yuan, Y. The interactions between renewable portfolio standards and carbon emission trading in China: An evolutionary game theory perspective. Energy 2023, 271, 127047. [Google Scholar] [CrossRef]
  45. National Development and Reform Commission. Available online: https://www.ndrc.gov.cn/xwdt/tzgg/202206/t20220601_1326720.html (accessed on 1 June 2022).
  46. Shanghai Environment and Energy Exchange. Available online: https://www.cneeex.com (accessed on 4 September 2024).
Figure 1. The system boundary of SD model.
Energies 18 00894 g001
Figure 2. The causal loops of SD model.
Energies 18 00894 g002
Figure 3. The stock flow diagram of TGC market subsystem.
Energies 18 00894 g003
Figure 4. The stock flow diagram of CET market subsystem.
Energies 18 00894 g004
Figure 5. The stock flow diagram of CCER market subsystem.
Energies 18 00894 g005
Figure 6. The stock flow diagram of electricity market subsystem.
Energies 18 00894 g006
Figure 7. The market price under the mechanism of RPS, CET and CCER.
Energies 18 00894 g007
Figure 8. Revenues, costs and profits of generators under the mechanism of RPS, CET and CCER.
Energies 18 00894 g008
Figure 9. The power generation structure under the mechanism of RPS, CET and CCER.
Energies 18 00894 g009
Figure 10. The sensitivity analysis of CCER benchmark price.
Energies 18 00894 g010
Figure 11. The sensitivity analysis of CCER offset ratio.
Energies 18 00894 g011
Figure 12. The sensitivity analysis of CCER participation proportion.
Energies 18 00894 g012
Figure 13. The sensitivity analysis of CET fine.
Energies 18 00894 g013
Table 1. Important parameters in SD model.
Variables(Initial) ValueUnitData Recourse
1GDP101,598.62billion CNYPreliminary Gross Domestic Product (GDP) results for the fourth quarter and full year 2020
2RPSs quota15.9%China Renewable Energy Development Report of 2023 and Action Plan for Carbon Dioxide Peaking Before 2030
3RPSs quota growth rate0.38%
4Electricity demand7.52billion MWhChina Power Industry Annual Development Report 2021
5TGCs benchmark price 400CNYReference [42]
6CET benchmark price 50CNYReference [35]
7CCER benchmark price40CNYReference [35]
8The price range of TGCs200–800CNYReference [42]
9The price range of CET and CCER10–300CNY/tonReference [35]
10RPSs fine800CNYThe upper price of TGCs
11CET fine300CNYThe upper price of CET
12TE annual utilization hours4466Hour2023–2024 National Electricity Supply and Demand Situation Analysis and Forecast Report
13RE annual utilization hours2655 aHour
14The marginal generation cost of the TE power 540CNY/MWhChina power supply and demand analysis report
15The marginal generation cost of the RE power270CNY/MWh
16RE newly installed capacity139,000MWChina Renewable Energy Development Report 2020
17TE newly installed capacity51,870 MW
18RE cumulative installed capacity934,000MW14th Five-year plan for renewable energy development
19TE cumulative installed capacity1,263,647MW
20RE power generation2.21billion MWh
21TE power generation5.39billion MWh
a—Note: Based on RE installed capacity and generation data, RE annual utilization hours could be calculated by Equation (31) [43].
Table 2. Reality test of the model simulation (unit: 1 billion MWh).
YearElectricity DemandRenewable Energy Power GenerationTraditional Energy Power Generation
SVTVErrorSVTVErrorSVTVError
20218.318.053.10%2.482.412.76%6.025.508.70%
20228.608.620.24%2.672.622.15%6.015.685.66%
20239.229.230.09%3.003.154.87%6.456.213.83%
Average error 1.14% 3.26% 6.06%
Disclaimer/Publisher’s Note: The statements, opinions and data contained in all publications are solely those of the individual author(s) and contributor(s) and not of MDPI and/or the editor(s). MDPI and/or the editor(s) disclaim responsibility for any injury to people or property resulting from any ideas, methods, instructions or products referred to in the content.

