Article

Experimental Study on the Influence of Ion Components in Geothermal Water on Scaling Behavior

by
Yansong Yang
1,
Zhouhang Li
1,2,* and
Hua Wang
1
1
Faculty of Metallurgical and Energy Engineering, Kunming University of Science and Technology, Kunming 650093, China
2
Yunnan Key Laboratory of Clean Energy and Energy Storage Technology, Kunming University of Science and Technology, Kunming 650093, China
*
Author to whom correspondence should be addressed.
Energies 2025, 18(4), 946; https://doi.org/10.3390/en18040946
Submission received: 6 January 2025 / Revised: 30 January 2025 / Accepted: 14 February 2025 / Published: 16 February 2025
(This article belongs to the Section H2: Geothermal)

Abstract

:
Understanding the scaling behavior of geothermal water is essential for optimizing geothermal plant performance and ensuring sustainable energy use. However, research on the effects of common ionic components in geothermal environments on scaling is still insufficient, and there is a lack of in-depth exploration of the quantitative control of ion concentrations. This study selected common ionic components based on the ionic composition of geothermal water samples and simulated a realistic geothermal environment by setting concentration gradients. Static aeration immersion experiments, combined with XRD and SEM analysis, were conducted to systematically investigate the effects of various ionic components on scaling behavior. The results indicate that CaCO3 is the primary scaling substance in the simulated geothermal water. Ca2+, HCO3, and SiO32− significantly influence scaling. Specifically, the scaling amount increases with higher Ca2+ concentration. HCO3 exhibits a nonlinear trend, with scaling initially increasing and then decreasing once its concentration exceeds approximately 1000 mg/L. This inhibition is likely due to HCO3’s pH-buffering effect, restricting its conversion to CO32− and limiting CaCO3 precipitation. SiO32− significantly inhibits scaling, reducing the scaling amount by about 88.91% when its concentration increases from 0 to 200 mg/L. The effect of Mg2+ is relatively minor, with a 13.21% reduction in scaling as its concentration increases from 0 to 50 mg/L. However, Mg2+ notably alters the crystal phase of CaCO3, promoting aragonite formation. Without Mg2+, CaCO3 predominantly forms as calcite. These findings emphasize the crucial role of ionic components and their concentration gradients in scaling, providing theoretical support for effective scaling prevention and control strategies.

1. Introduction

Geothermal energy, as a renewable and clean resource, plays a vital role in addressing the global energy crisis and supporting the circular economy. It offers advantages such as low cost, minimal environmental impact, and stable year-round supply, making it a key player in combating climate change and a promising energy source for future growth [1,2,3,4].
Hydrothermal geothermal energy is the most common form of geothermal energy, but scaling is one of the key factors affecting equipment performance and economic viability in practical applications [5]. The interaction between high-temperature underground water and rock reservoirs leads to geothermal water with high salinity and extreme pH values. These conditions not only exacerbate equipment corrosion but also significantly accelerate the formation of scaling, particularly in heat exchangers where temperature decreases. Scaling forms deposits on heat transfer surfaces, significantly reducing heat transfer efficiency, increasing system energy consumption, and undermining the economic performance of geothermal energy utilization [6,7,8]. Moreover, severe scaling can block pipelines, forcing equipment shutdowns for maintenance and further raising operational costs. Therefore, scaling has become a critical technical bottleneck in geothermal energy applications. This is especially true for organic Rankine cycle power plants, where effective scaling control in heat exchangers is essential for ensuring efficient and stable system operation as well as economic feasibility [9,10,11].
The types of scaling that may occur in geothermal applications are complex, and their specific composition is difficult to define. Epstein [12] proposed at the 6th International Heat Transfer Conference that scaling can be categorized into several types based on the main factors of deposition: particulate scaling, crystalline scaling, chemical reaction scaling, corrosion scaling, biological scaling, and mixed scaling. In the actual development of geothermal resources, the scaling that forms in geothermal systems is generally of a mixed type. However, crystalline and particulate scaling are much more prevalent than other types. This is because the high-temperature conditions and highly mineralized geothermal water commonly found in geothermal energy systems effectively reduce the impact of biological scaling. Additionally, once scaling forms on the surface of pipes, the scaling layer provides a certain degree of protection, mitigating the effects of chemical reaction scaling and corrosion scaling [13]. Particulate scaling can be effectively controlled using methods like sedimentation or filtration, so crystalline scaling remains the biggest challenge among common scaling types in geothermal systems. The formation of crystalline scaling can be viewed as a crystallization process, which occurs in four stages: induction, nucleation, crystal growth, and maturation [14]. When the concentration increases, the solution becomes supersaturated, causing the dissolved substance to crystallize and precipitate, forming scaling [15,16]. The higher the supersaturation, the shorter the induction period and the faster the scaling rate [17]. Ions such as Ca2+, Mg2+, HCO3, and SO42−, abundant in geothermal fluids, are the main contributors to crystalline scaling, forming various insoluble inorganic salts and significantly influencing the scaling process.
In addition to these factors, certain substances present in the solution can significantly influence the scaling process. Studies have shown that naturally occurring Mg2+ and SO42− ions in seawater exchange with Ca2+ and CO32−, which disrupts the crystallization of CaCO3 [18]. Metal ions can also prolong the induction period. Ions such as Cu2+ [19,20], Zn2+ [21], Mg2+ [22], and Al3+ [23] effectively inhibit the formation of CaCO3 and CaSO4, thereby reducing the accumulation of scaling layers. Zep Zeppenfeld et al. [24] found that Cu2+ exhibits a stronger inhibitory effect compared to Zn2+. Benslimane et al. [25] demonstrated that the synergistic effect of Cu2+, Zn2+, and Mg2+ mixtures could significantly extend the induction period and suppress scaling. They also proposed that Cu2+, Zn2+, and Mg2+ could bind with OH to form hydrated complexes such as CuOH+, ZnOH+, and MgOH+, which in turn reduce the precipitation of CaCO3. In their study, by comparing the pH values of the precipitates, induction times, and supersaturation levels at the point of precipitation, they determined that the most effective scaling inhibition occurred when the concentrations of Cu2+, Zn2+, and Mg2+ were 0.5 ppm, 0.5 ppm, and 100 ppm, respectively. The water composition and temperature conditions in these systems differ significantly from geothermal environments, rendering their findings difficult to directly apply to the geothermal scaling process [26]. Current research on the influence of ionic components under geothermal conditions primarily focuses on the performance evaluation of coatings or materials. These coatings or materials are prone to electrochemical corrosion in highly mineralized geothermal water, releasing metal ions that subsequently affect the scaling process. However, these metal ions are typically not common components in geothermal fluids. Studies concerning common ionic components in geothermal water mainly emphasize the removal efficiency of specific ions or the comparison of scaling and corrosion tendencies in different geothermal water samples [13,27,28]. Nevertheless, systematic quantitative analyses and comprehensive comparisons of the effects of ionic components on the scaling process in geothermal water remain insufficient.
Understanding the role of ionic components in the scaling process of geothermal water is crucial for effective scaling prevention and control in geothermal energy production. Scaling is a significant challenge in geothermal systems, as it can reduce heat exchange efficiency, increase maintenance costs, and potentially damage equipment. Although the composition of geothermal water varies across different regions due to geological conditions, certain common ionic components and their concentration ranges are typically present. This study aims to simulate a complex geothermal water environment based on actual geothermal water samples, with controlled ionic concentrations as variables. Aeration immersion experiments were designed, and XRD and SEM analysis methods were employed to systematically investigate the effects of various ionic components and their concentration gradients on scaling behavior. By quantitatively analyzing the impact of these common ions and their concentration gradients on the scaling process, the study provides fundamental data and theoretical support for predicting scaling trends in complex geothermal water systems. Through examining the behavior of individual ions, this research not only unveils the specific mechanisms of their influence but also offers scientific guidance for process adjustments and water quality management in practical engineering applications. The findings contribute to optimizing water quality control strategies in geothermal systems, improving operational efficiency, and providing strong theoretical and practical support for the efficient utilization of geothermal energy and the prevention of scaling.

2. Corrosion and Scaling Trend Assessment Using Index Models

The Langelier Saturation Index (L.S.I.) model is based on the carbonate calcium equilibrium theory and is used to assess the stability of water quality. The expression of the model is as follows [29]:
L . S . I . = p H a p H s ,
where pHa is the measured pH value of the geothermal fluid, and pHs is the pH value at which calcium carbonate in the geothermal fluid reaches equilibrium, which can be calculated using the following relationship:
p H s = l o g C a 2 + l o g A L K + K c ,
where [Ca2+] represents the molar concentration of calcium ions in the fluid (mol/L), and [ALK] refers to the molar concentration of HCO3 in the fluid (mol/L). Kc is a complex constant that incorporates two temperature-dependent equilibrium constants and activity coefficients, which describe the interaction between ions in solution. The equilibrium constants and activity coefficients are typically determined through graphical methods and are influenced by temperature, affecting the solubility and precipitation behaviors of the ions.
The Ryznar Stability Index (R.S.I.) model and the Langelier Saturation Index (L.S.I.) model both rely on the dissolution equilibrium theory of calcium carbonate for assessment. However, while the L.S.I. model is grounded in a more robust theoretical framework, the R.S.I. model is an empirical index that compensates for some of the limitations of the L.S.I., offering enhanced practical applicability. In practical applications, the combined use of both indices can provide a more accurate evaluation of the scaling and corrosion tendencies of water; the index is defined as follows [30]:
R I = 2 p H s p H a ,
When the chloride ion concentration in geothermal water exceeds 25% of the milliequivalent fraction, the Larson index (L.I.) model provides more accurate results; the index is defined as [31]:
L I = C l + S O 4 A I K ,
where [Cl] and [SO4] represent the corresponding milliequivalent values of the respective ions, (mEq/L), and [ALK] is the milliequivalent concentration of HCO3, (mEq/L). For convenience in calculation, the following formulas can be used:
C l = 0.028 × C l m g / L = C l m E q / L ,
S O 4 = 0.0208 × S O 4 2 m g / L = S O 4 2 m E q / L ,
A I K = H C O 3 = 0.0164 × H C O 3 m g / L = H C O 3 m E q / L ,
Unlike the R.S.I. and the L.S.I., this index model does not involve the solubility of CaCO3 but instead takes into account the effects of two specific ions, chloride (Cl) and sulfate (SO42−). It is also used to assess corrosion trends.
The hydrochemical data of the geothermal water were provided by the Geothermal Energy Science and Technology (Dali) Research Institute, which collected 25 geothermal water samples from Er’yuan and Midu counties in the Dali region. Based on their utilization value and economic potential, six typical geothermal water samples with temperatures above 50 °C were selected for further analysis. The hydrochemical analysis results are presented in Table 1.
The corrosion and scaling trends of six typical geothermal water samples were calculated and analyzed using three index models. The calculation results are shown in Table 2.

3. Experimental

3.1. Materials

3.1.1. Simulated Geothermal Water Composition

The results from the L.S.I. and R.S.I. models indicate that sample 1# exhibits the strongest scaling tendency among the six typical geothermal water samples. However, the L.I. model shows that sample 1# presents a mild corrosive trend, with no significant scaling tendency observed. The results from the three index models are not consistent. Additionally, sample 1# has the highest mineralization and a temperature of 78 °C, classifying it as a low-temperature geothermal resource (25–90 °C). With technological advancements, economic power generation, which was previously possible only with medium-temperature geothermal resources (90–150 °C), can now be achieved with geothermal water at around 80 °C using organic Rankine cycle (ORC) technology. This opens up a wide range of application scenarios and economic value. Therefore, sample 1# is considered highly representative. Its hydrochemical composition and temperature will serve as a reference for configuring simulated geothermal water for immersion scaling experiments.
The reagents used for preparing the simulated geothermal water were all AR-grade chemicals. The simulated geothermal water was prepared by dissolving the corresponding salts in deionized water, restoring the concentrations of Na+, K+, Ca2+, Mg2+, Cl, HCO3, and SO42− ions present in the 1# sample. These seven ions are among the most widely distributed in the diverse compositions of geothermal waters worldwide. In addition, the soluble SiO2 in the 1# sample is the main component of silica scale, which is typically the primary cause of silica scale deposition in high-temperature geothermal systems. However, SiO2 and SiO32− are in a state of chemical equilibrium in weakly alkaline, high-temperature geothermal water environments, where they can interconvert and are difficult to quantify accurately. Therefore, this experiment uses only SiO32− for the simulated water preparation, and the concentrations of other major ions are low, even close to zero. The five ions, Ca2+, Mg2+, Cl, HCO3, and SO42−, are closely related to corrosion and scaling processes. By controlling the amount of salt used, the concentrations of these ions can be adjusted to form control groups with ion concentration gradients. Additionally, a control group with increased SiO32− concentration was set up, while no SiO32− was added to the other ion concentration gradient control groups.
The concentration gradients of ionic components were designed based on the chemical composition data of six geothermal water samples collected from Er’yuan and Midu counties in the Dali region, with temperatures above 50 °C. The Ca2+ concentration ranged from 36.7 to 135 mg/L, and the baseline water sample had a Ca2+ concentration of 135 mg/L. To investigate the impact of Ca2+ concentration on scaling behavior, the baseline Ca2+ concentration was scaled within a reasonable range. Two control groups with lower Ca2+ concentrations than the baseline, including a group with Ca2+ completely removed, and two control groups with higher Ca2+ concentrations than the baseline were set. The final Ca2+ concentration gradient was designed as 0, 50, 135 (baseline sample), 200, and 250 mg/L.
The Mg2+ concentration ranged from 6.72 to 18.6 mg/L, and the baseline water sample had an Mg2+ concentration of 12.8 mg/L. Following the same principle as the Ca2+ concentration gradient, the baseline Mg2+ concentration was adjusted within a reasonable range, resulting in a final Mg2+ concentration gradient of 0, 5, 12.8 (baseline sample), 20, and 50 mg/L.
The HCO3 concentration ranged from 300 to 999 mg/L, and the baseline water sample had an HCO3 concentration of 999 mg/L. By scaling the baseline HCO3 concentration within a reasonable range, the final HCO3 concentration gradient was set to 0, 500, 999 (baseline sample), 1500, and 2000 mg/L.
The SO42− concentration ranged from 52 to 309 mg/L, and the baseline water sample had an SO42− concentration of 131 mg/L. Similarly, the baseline SO42− concentration was adjusted within a reasonable range to create a final SO42− concentration gradient of 0, 50, 131 (baseline sample), 200, and 250 mg/L.
The SiO2 concentration ranged from 50 to 120 mg/L, and the baseline water sample had an SiO2 concentration of 91.1 mg/L. By scaling the baseline SiO2 concentration within a reasonable range, the final SiO32− concentration gradient was designed as 0, 50, 91.1 (baseline sample), and 200 mg/L.
In the simulated geothermal water, Ca2+ was provided by CaCl2·2H2O, and Mg2+ was provided by MgCl2·6H2O. Adjusting the concentrations of Ca2+ and Mg2+ indirectly affected the concentration of Cl. Therefore, for control groups with Ca2+ and Mg2+ concentrations lower than the baseline sample, additional Cl was supplemented by adding NaCl to match the Cl concentration level of the baseline sample. This approach eliminates the influence of Cl concentration variations on the experimental results, allowing for a more accurate evaluation of the effects of Ca2+ and Mg2+ on scaling behavior. The compositions of the baseline water sample and the ionic concentration gradient control groups for simulated geothermal water are shown in Table 3. The above concentration gradient design references the actual concentration ranges observed in the collected geothermal water samples. It aims to systematically investigate the effects of various ionic components on scaling behavior under different concentrations while ensuring the rationality of ionic concentrations, thereby providing scientific guidance for scaling control and mitigation strategies.

3.1.2. Sample Preparation

The metal stainless steel sample material is SS304 stainless steel, with dimensions of 50 × 30 mm in length and width, and a thickness of 1 mm, The chemical composition of the stainless steel is shown in Table 4. To ensure consistency in surface roughness and other surface conditions, the samples were polished using sandpaper, starting with 200 mesh, followed by 400 mesh, 600 mesh, and 800 mesh sandpapers, until the surface was smooth and even. Then, the polished surface was further treated with a wool felt pad coated with polishing paste, until no visible scratches or indentations were observed. After polishing, the samples were washed: First, the surface was cleaned with a detergent, followed by ultrasonic cleaning with a mixed alkaline solution (NaOH at 5.0 g/L, Na2SiO3 at 3.0 g/L), anhydrous ethanol, and distilled water for 5–10 min. Finally, the samples were dried in a blast drying oven at 80 °C for 1 h to complete the preparation.

3.2. Test Methods

The prepared samples were suspended in a wide-mouthed glass bottle using nylon threads, with 250 mL of simulated geothermal water added to the bottle. The bottle was then placed in a water bath set at 80 °C for constant-temperature immersion. To observe and record the scaling conditions of the samples and maintain the ion concentration stability of the simulated geothermal water, the samples were removed every 2 days, dried for 1 h in a drying oven at 80 °C, and then weighed using an electronic analytical balance (accuracy 0.1 mg) to record the mass changes. At the same time, images of the scaling on the surface of the samples were taken. Afterward, the water in the bottle was replaced with freshly prepared simulated geothermal water, and the samples were returned to the bottle for continued immersion in the constant-temperature water bath. The experiment lasted for 30 days. After completion, the mass change rate of the samples was calculated using Formula (8):
v = w 0 w 1 A t = Δ w A t ,
where v represents the weight change rate of the stainless steel sample, in g/(m2·h), w0 is the initial weight of the stainless steel sample, in g, w1 is the weight of the stainless steel sample after the experiment, in g, A is the surface area of the stainless steel sample immersed in the solution, in m2, and t is the immersion time, in hours.
The samples were observed using a scanning electron microscope (SEM) to examine the scaling morphology in different simulated geothermal waters. The scaling composition was analyzed using an X-ray diffraction (XRD) instrument. The weight change rate of the samples was also analyzed in conjunction with the ion components to evaluate their roles in the scaling process in geothermal water.

4. Results and Discussion

4.1. Effect of Major Cations on Scale Deposition

Na+ and K+ are common cations in geothermal water. As typical electrolytes, they may play a role in maintaining charge balance and solubility in geothermal water. However, existing studies and experimental results indicate that their direct impact on scale formation is not significant. Therefore, this study did not include separate control experiments or detailed discussions on these ions. Instead, the focus of this research is on the specific effects of Ca2+ and Mg2+ on scaling behavior in geothermal water, as these cations show the most significant correlation with the scaling process. Additionally, to compensate for the changes in Cl concentration caused by adjustments in Ca2+ and Mg2+ concentrations, supplementary Cl control groups were introduced. By adding NaCl to match the Cl concentration of the baseline water sample, this approach eliminates potential interference from Cl concentration variations. Comparisons of scaling amounts and crystal phase changes with and without Cl supplementation allowed for a more precise investigation of the specific roles of Ca2+ and Mg2+ in scaling behavior.

4.1.1. Effect of Ca2+ on Scale Deposition

The weight-increase trend and scale deposition rate of the Ca2+ concentration gradient control group samples after 30 days of immersion in simulated geothermal water at 80 °C are shown in Figure 1. It is evident that Ca2+ concentration is closely correlated with scaling deposition. When Ca2+ was completely removed, there was almost no change in the sample weight. As the Ca2+ concentration increased, both the scale deposition amount and rate showed significant growth. Using the baseline water sample as a reference, the scaling rate at a Ca2+ concentration of 135 mg/L was 0.053 g/(m2·h). When the Ca2+ concentration was reduced by 63% to 50 mg/L, the scaling rate decreased to 0.021 g/(m2·h), a reduction of 60.38%. When the Ca2+ concentration increased by 48.2% to 200 mg/L, the scaling rate rose to 0.094 g/(m2·h), an increase of 77.36%. When the Ca2+ concentration further increased by 85.2% to 250 mg/L, the scaling rate reached 0.111 g/(m2·h), an increase of 109.4%.
The increase in Ca2+ concentration exhibited a pronounced nonlinear effect on the scaling rate. The rate of increase was relatively modest between 50 mg/L and 135 mg/L but accelerated significantly as the concentration increased from 135 mg/L to 200 mg/L and 250 mg/L, indicating that higher Ca2+ concentrations have a stronger promoting effect on the scaling process.
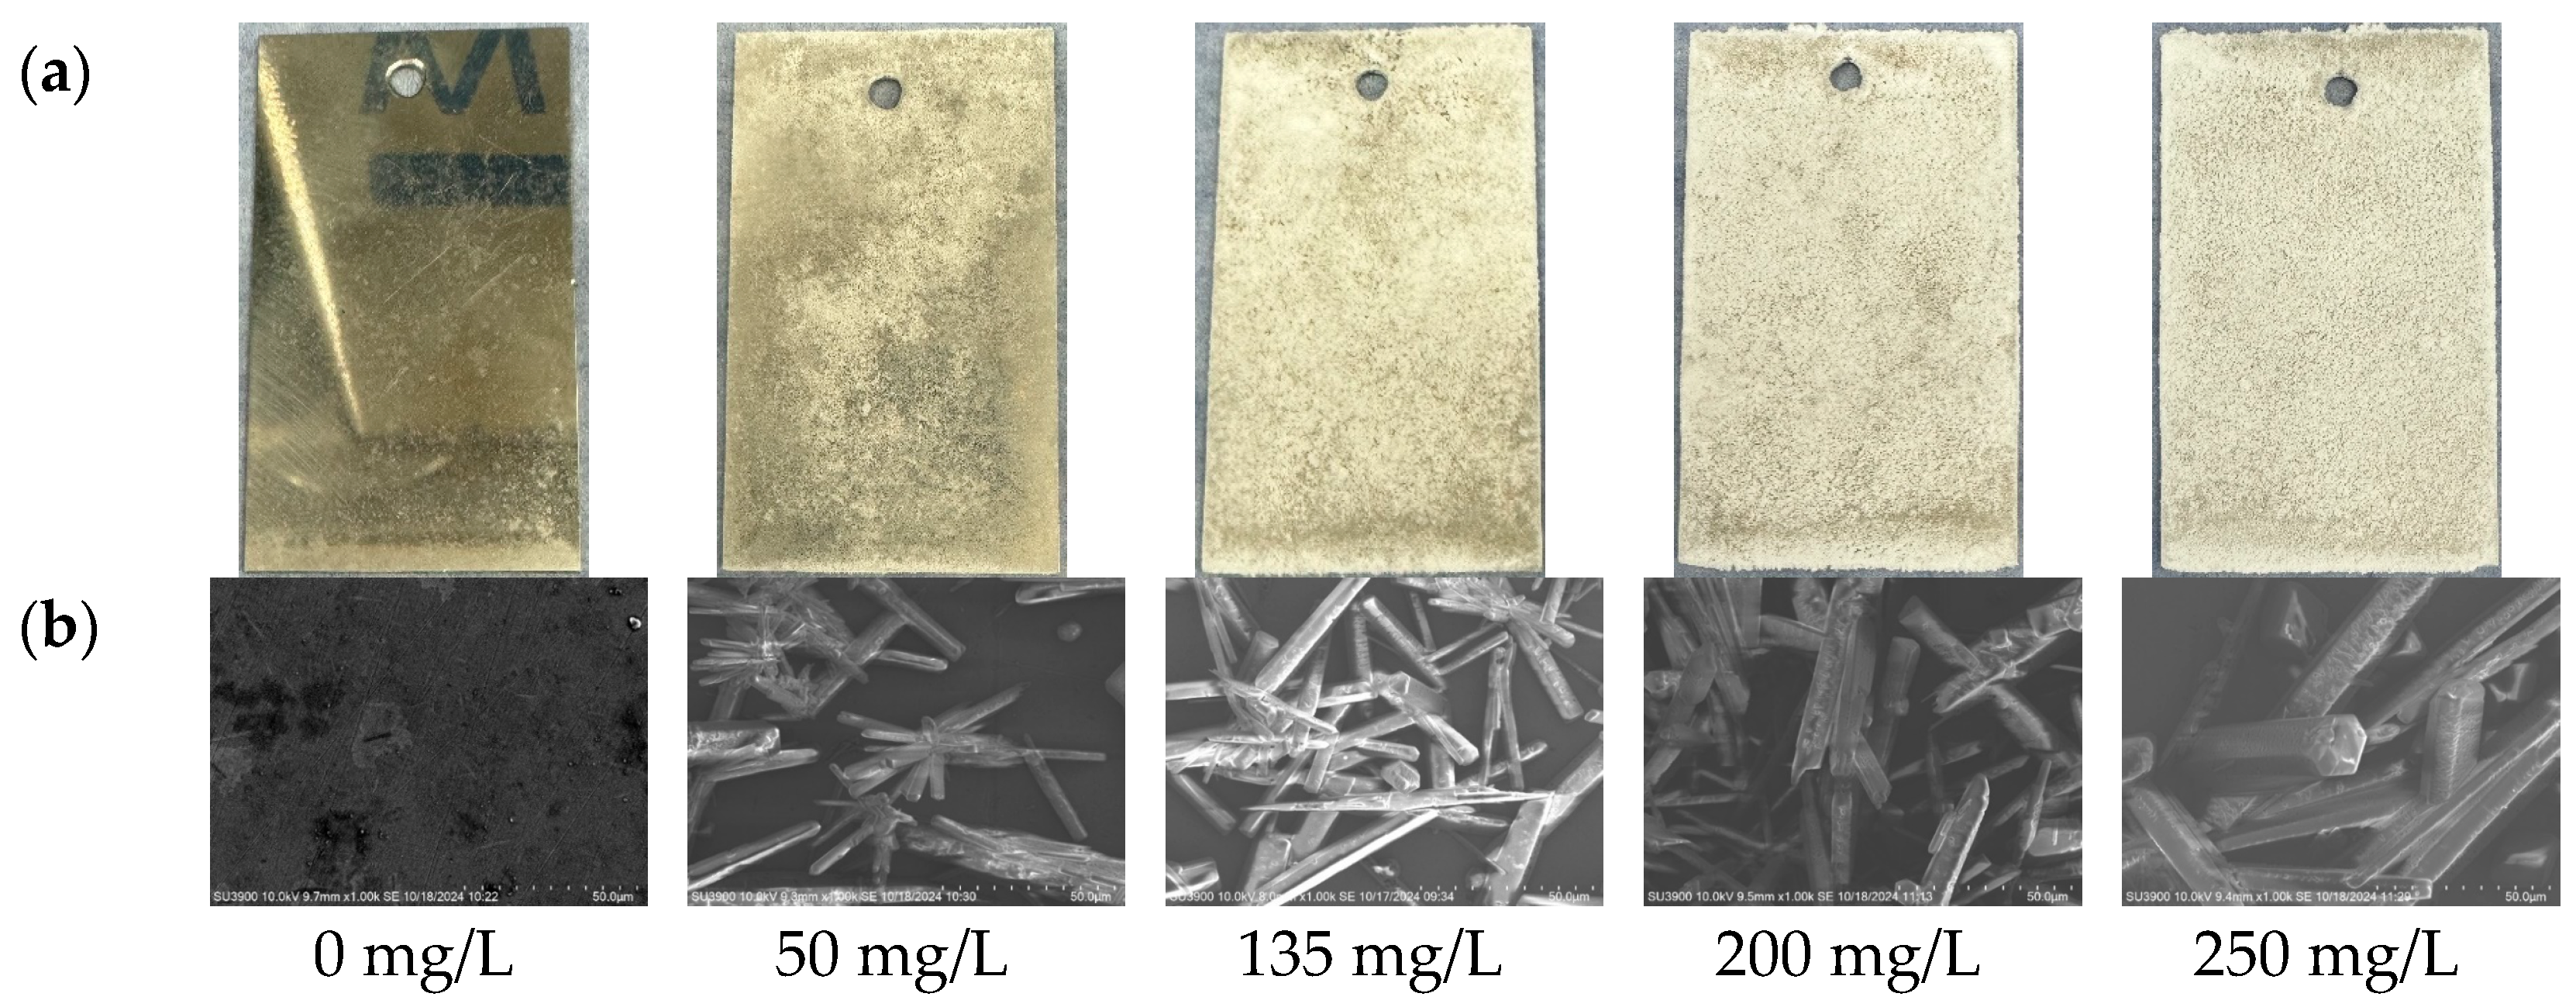
From Figure 2, it can be observed that the scale deposits in the simulated geothermal water are white, powdery substances. The differences in scale deposition are mainly reflected in the extent of scale coverage on the sample surfaces. When the Ca2+ concentration is 0 mg/L, no significant scale deposits are observed on the sample surface. Compared to before immersion, only a small amount of water stains is visible, and no obvious signs of corrosion are found. At this concentration, the SEM images show only the surface of the sample. As the Ca2+ concentration increases, more white, granular scale deposits gradually accumulate on the sample surface. When the Ca2+ concentration is 50 mg/L, some areas of the sample surface remain uncovered by the scale layer. When the Ca2+ concentration further increases to 135 mg/L, the scale layer covers the entire sample surface. As the Ca2+ concentration continues to increase to 200 mg/L and 250 mg/L, the scale layer becomes thicker, and the distribution of scale thickness becomes slightly uneven. The morphology of the scale deposits consistently remains white and granular, with no significant changes as the Ca2+ concentration increases. In the SEM images, the scale material predominantly appears as needle-like or columnar aggregates, with a small number of rhombohedral structures.
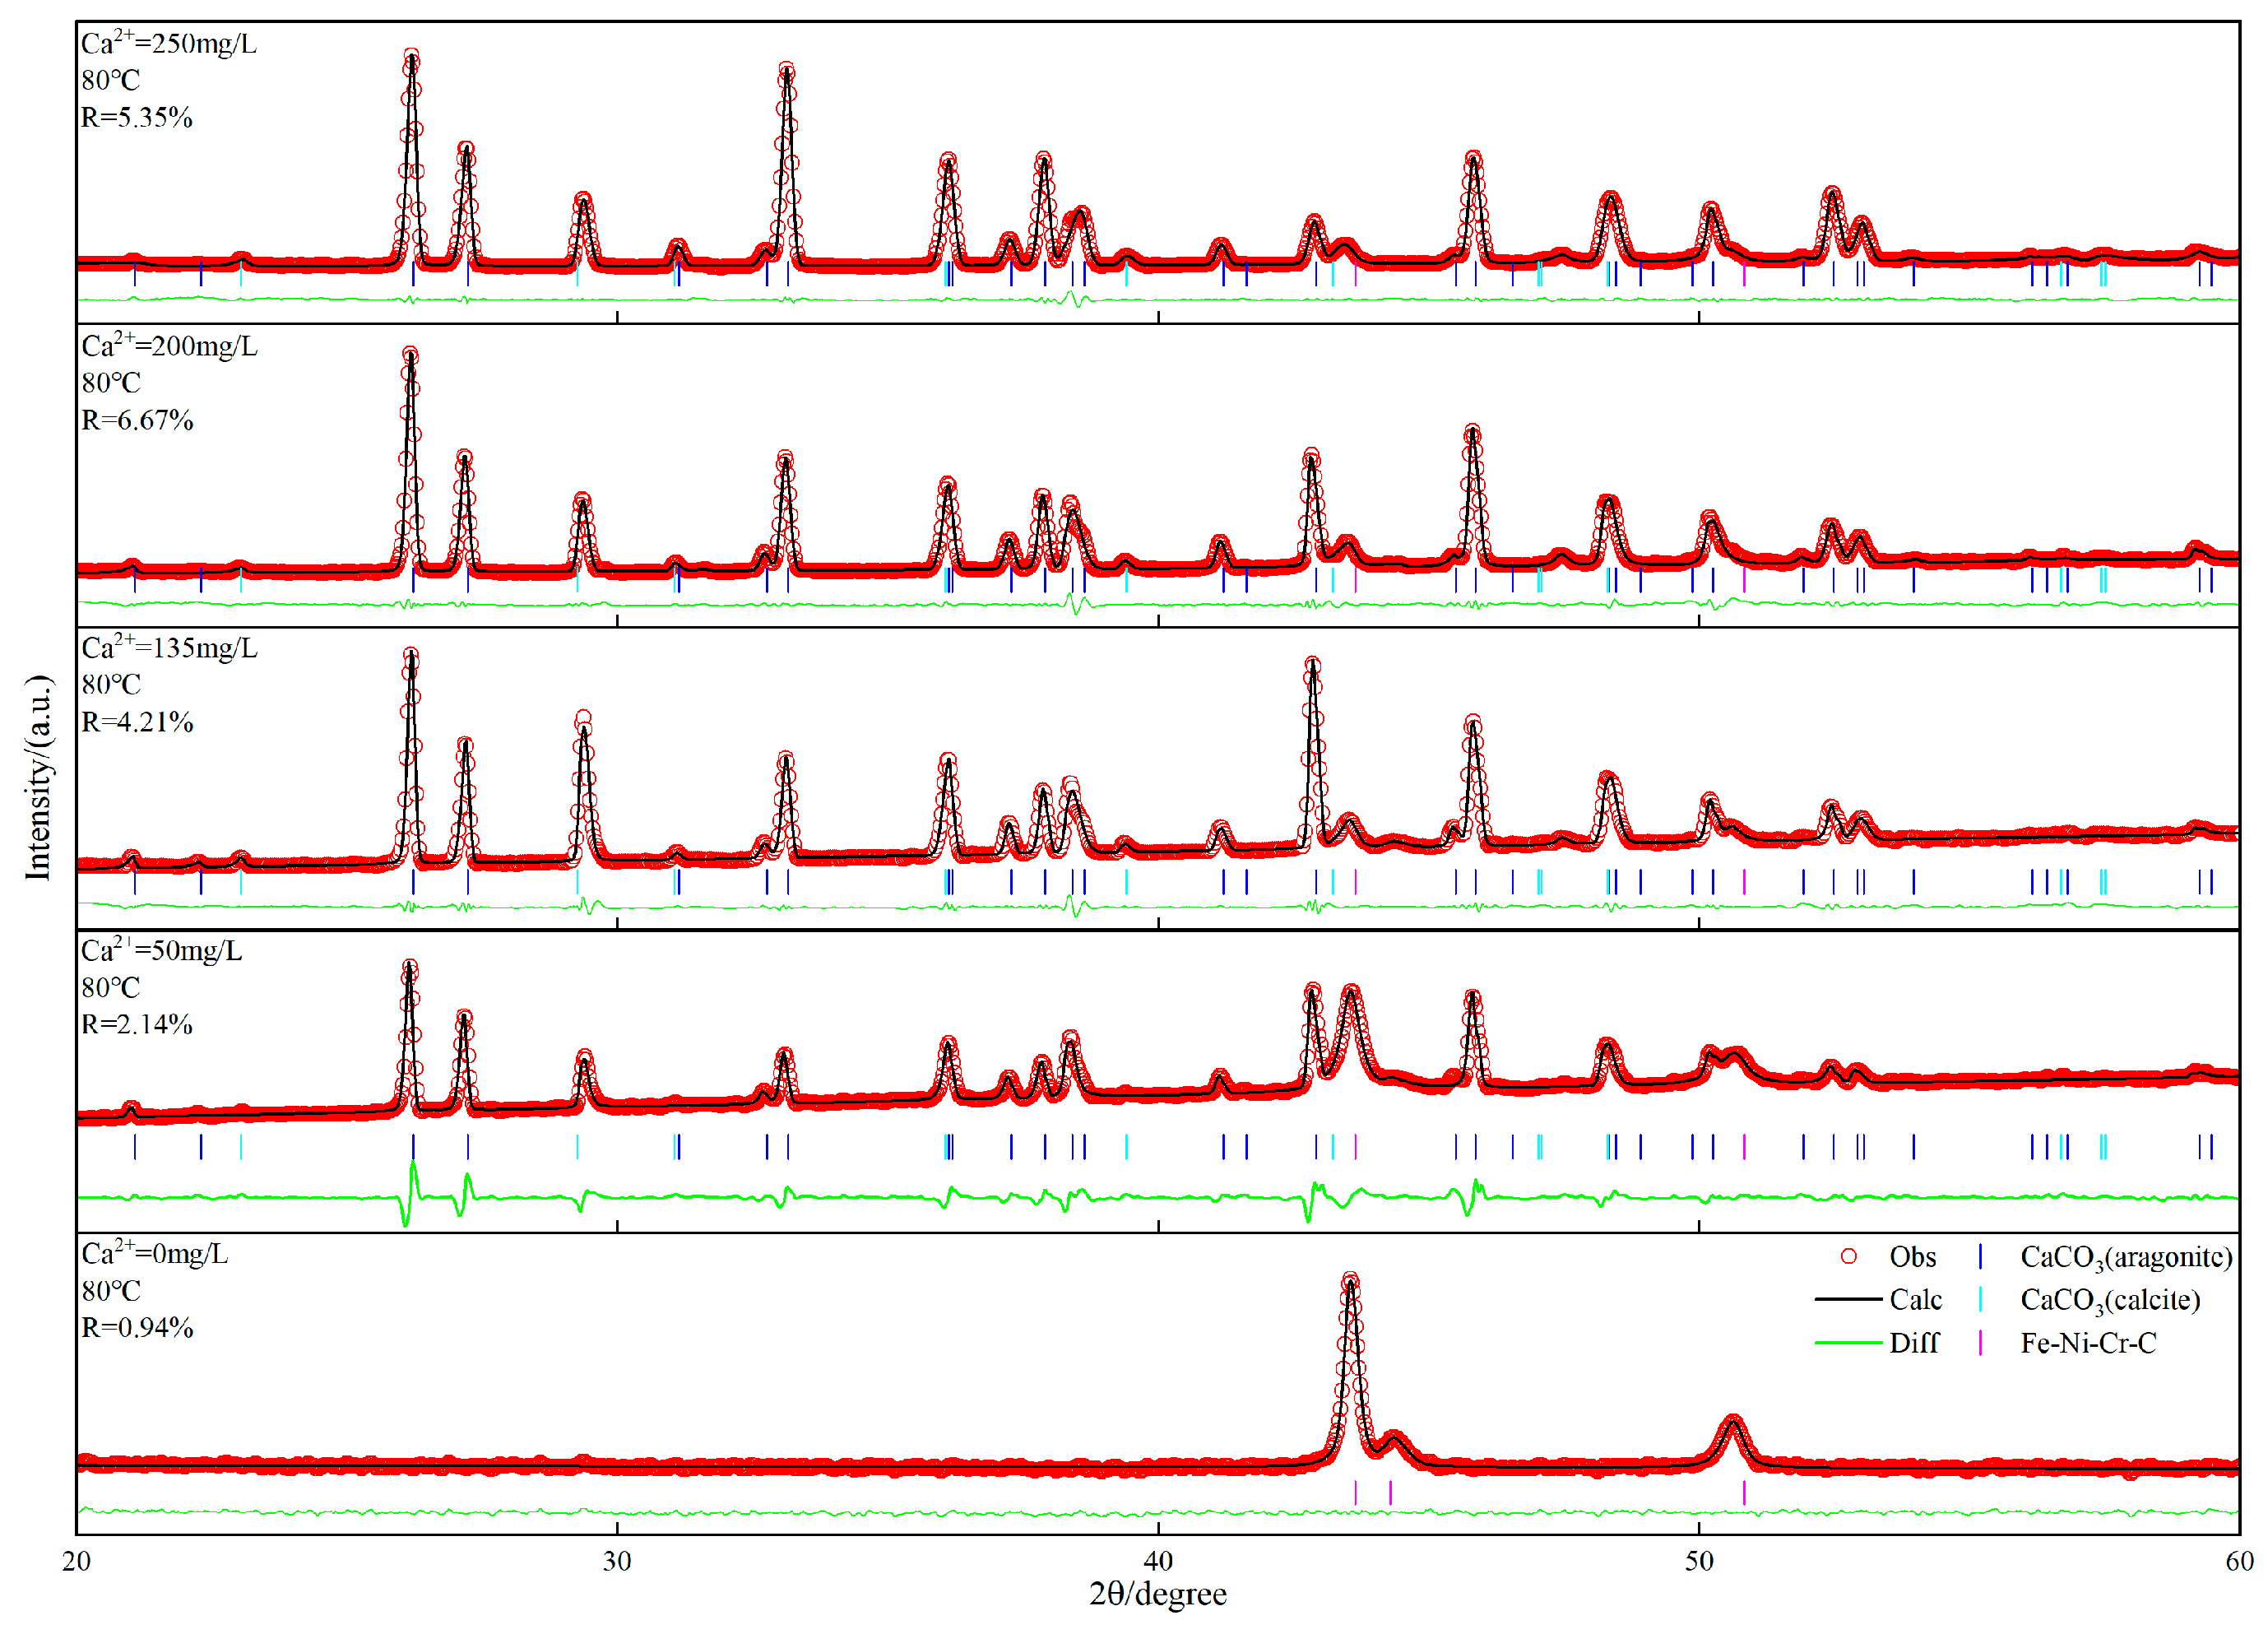
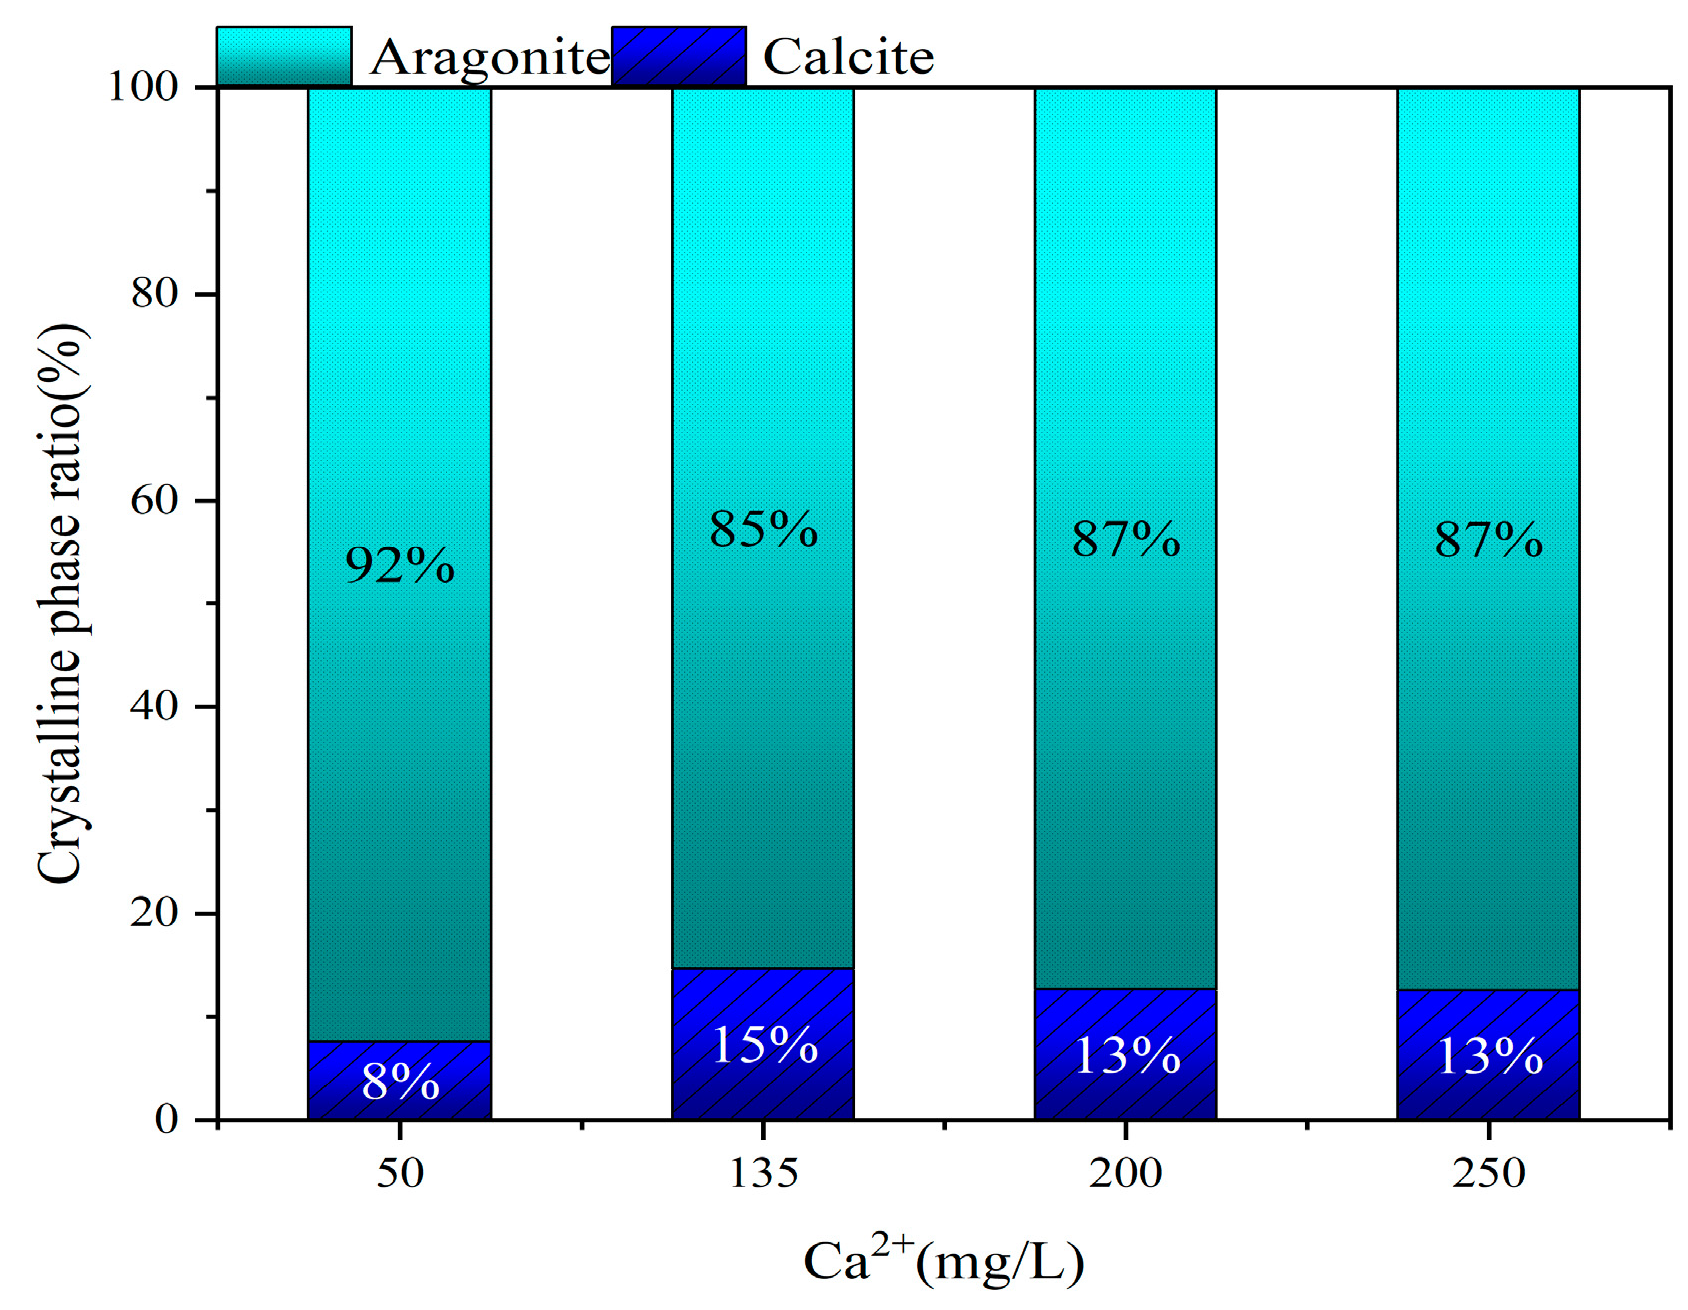
To determine the primary components of the scale deposits, XRD analysis was performed on the samples. According to the XRD results shown in Figure 3, the main component of the scale deposits on the sample surface was identified as CaCO3. The needle-like or columnar crystals were primarily aragonite, while the rhombohedral crystals were calcite. Using the MDI Jade 9 software, a simple quantitative analysis of the characteristic peaks in the XRD data was conducted to calculate the crystal phase ratio of aragonite to calcite. The results presented in Figure 4 show that aragonite dominates the scale deposits (>85%). The crystal phase ratio did not exhibit any significant regularity with changes in Ca2+ concentration, with aragonite consistently remaining the dominant phase, accounting for 85% to 92% of the total scale deposits.
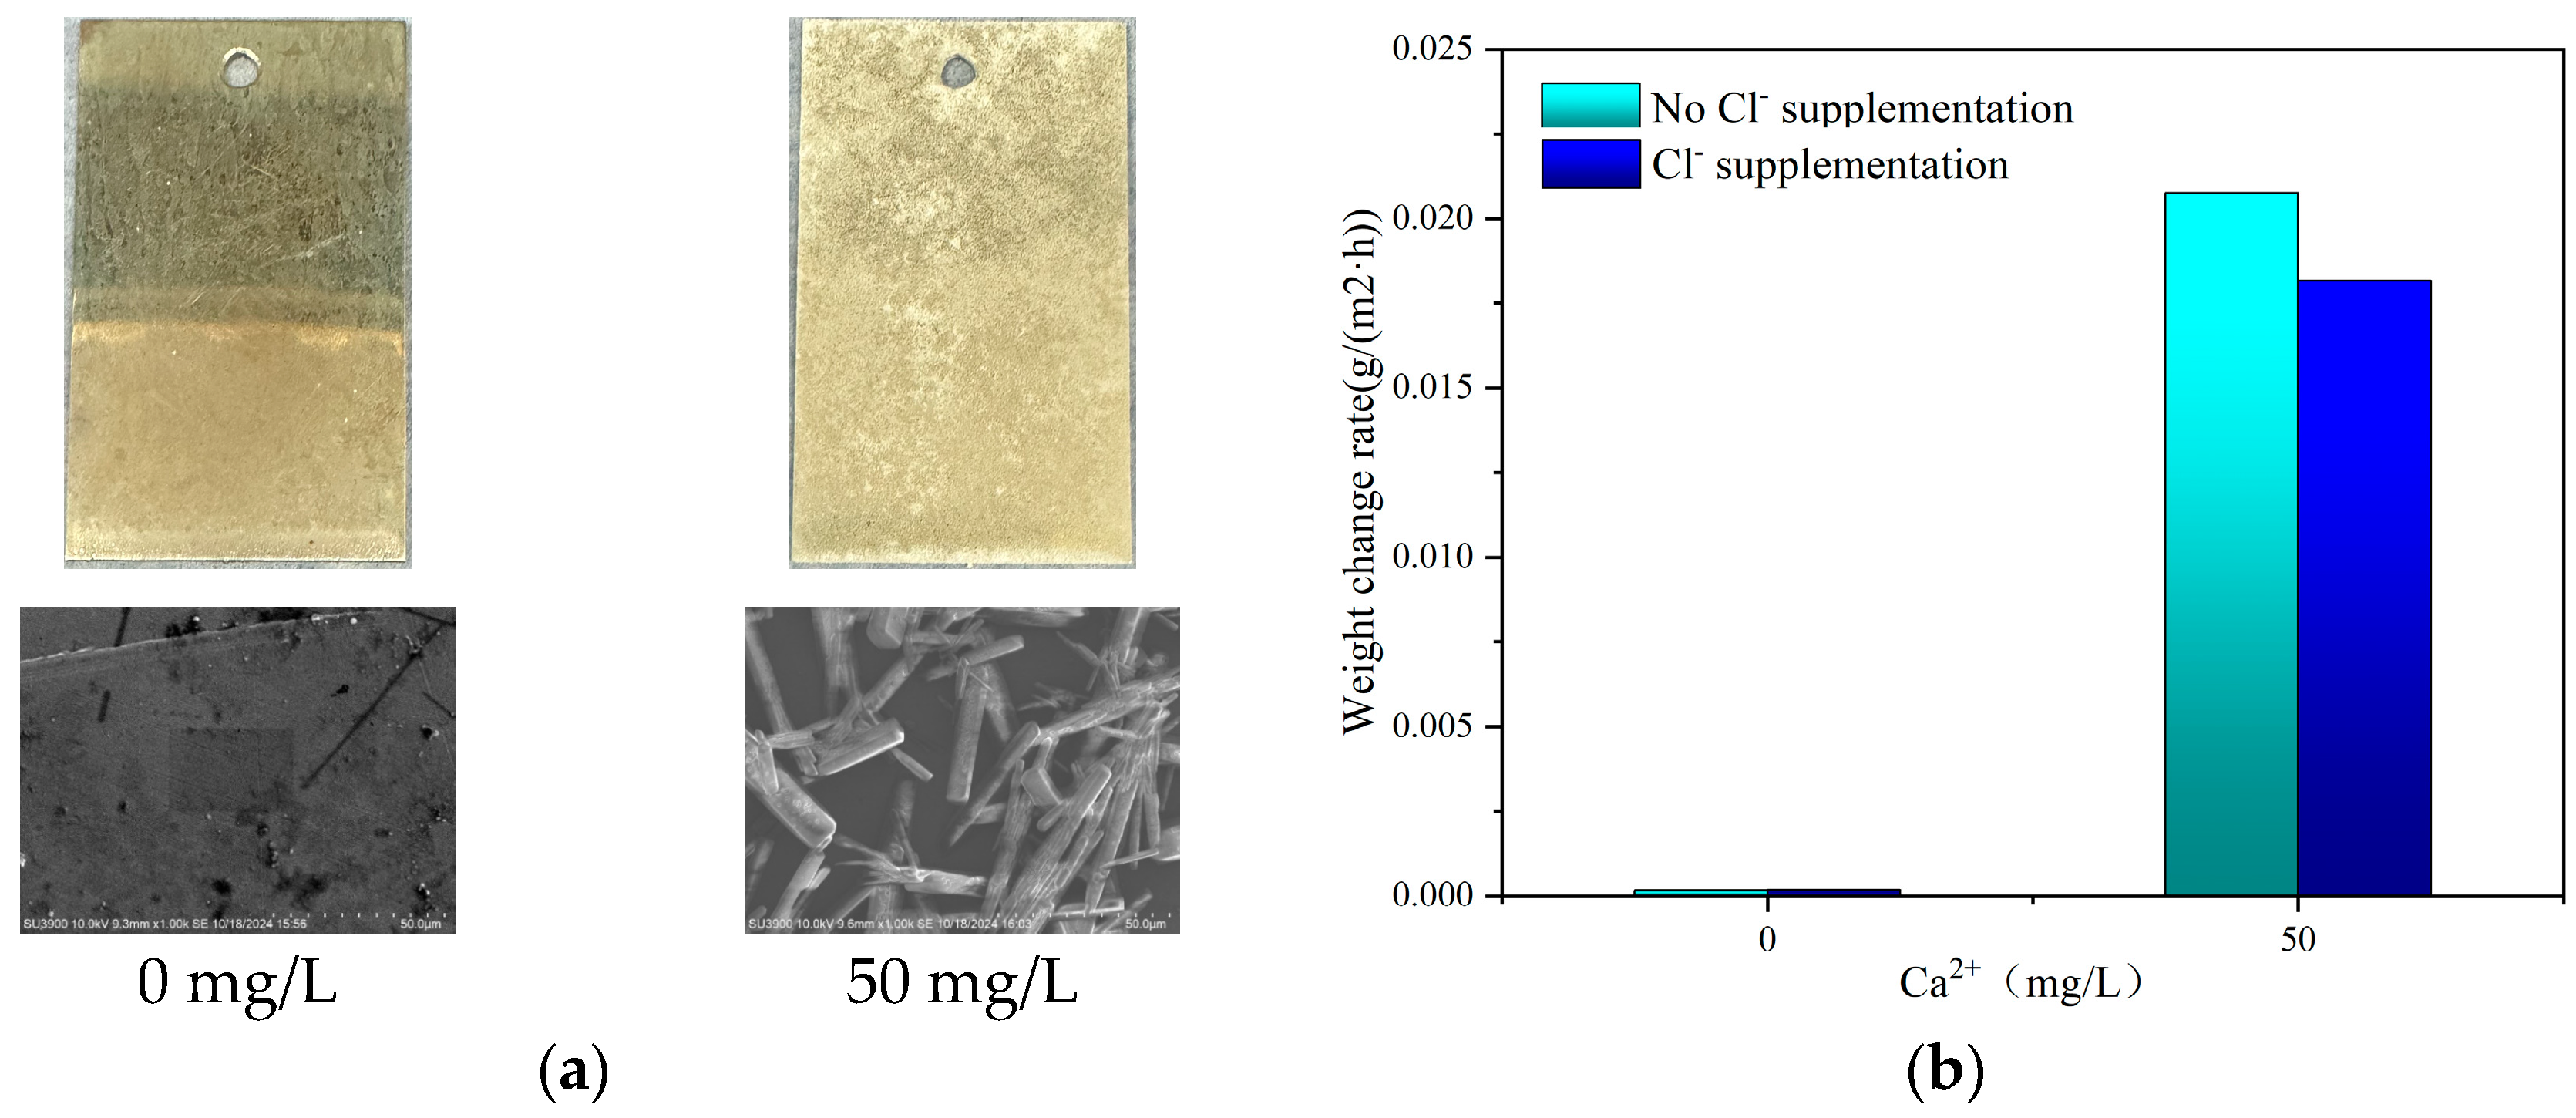
In the control groups with Ca2+ concentrations of 0 mg/L and 50 mg/L, NaCl was added to bring the Cl concentration up to the baseline water sample level. After 30 days of immersion in simulated geothermal water at 80 °C, a comparison of scaling rates before and after Cl supplementation is shown in Figure 5. The results indicate that the scaling morphology on the sample surface before and after Cl supplementation was very similar; in the Cl supplemented control group with a Ca2+ concentration of 0 mg/L, no significant scaling was observed, similar to the results of the control group without Cl supplementation. In the control group with a Ca2+ concentration of 50 mg/L, the addition of NaCl increased the Cl concentration from 88 mg/L to 238.8 mg/L, representing an increase of approximately 171.36%. This change resulted in a reduction in the final scaling rate of about 12.56%.
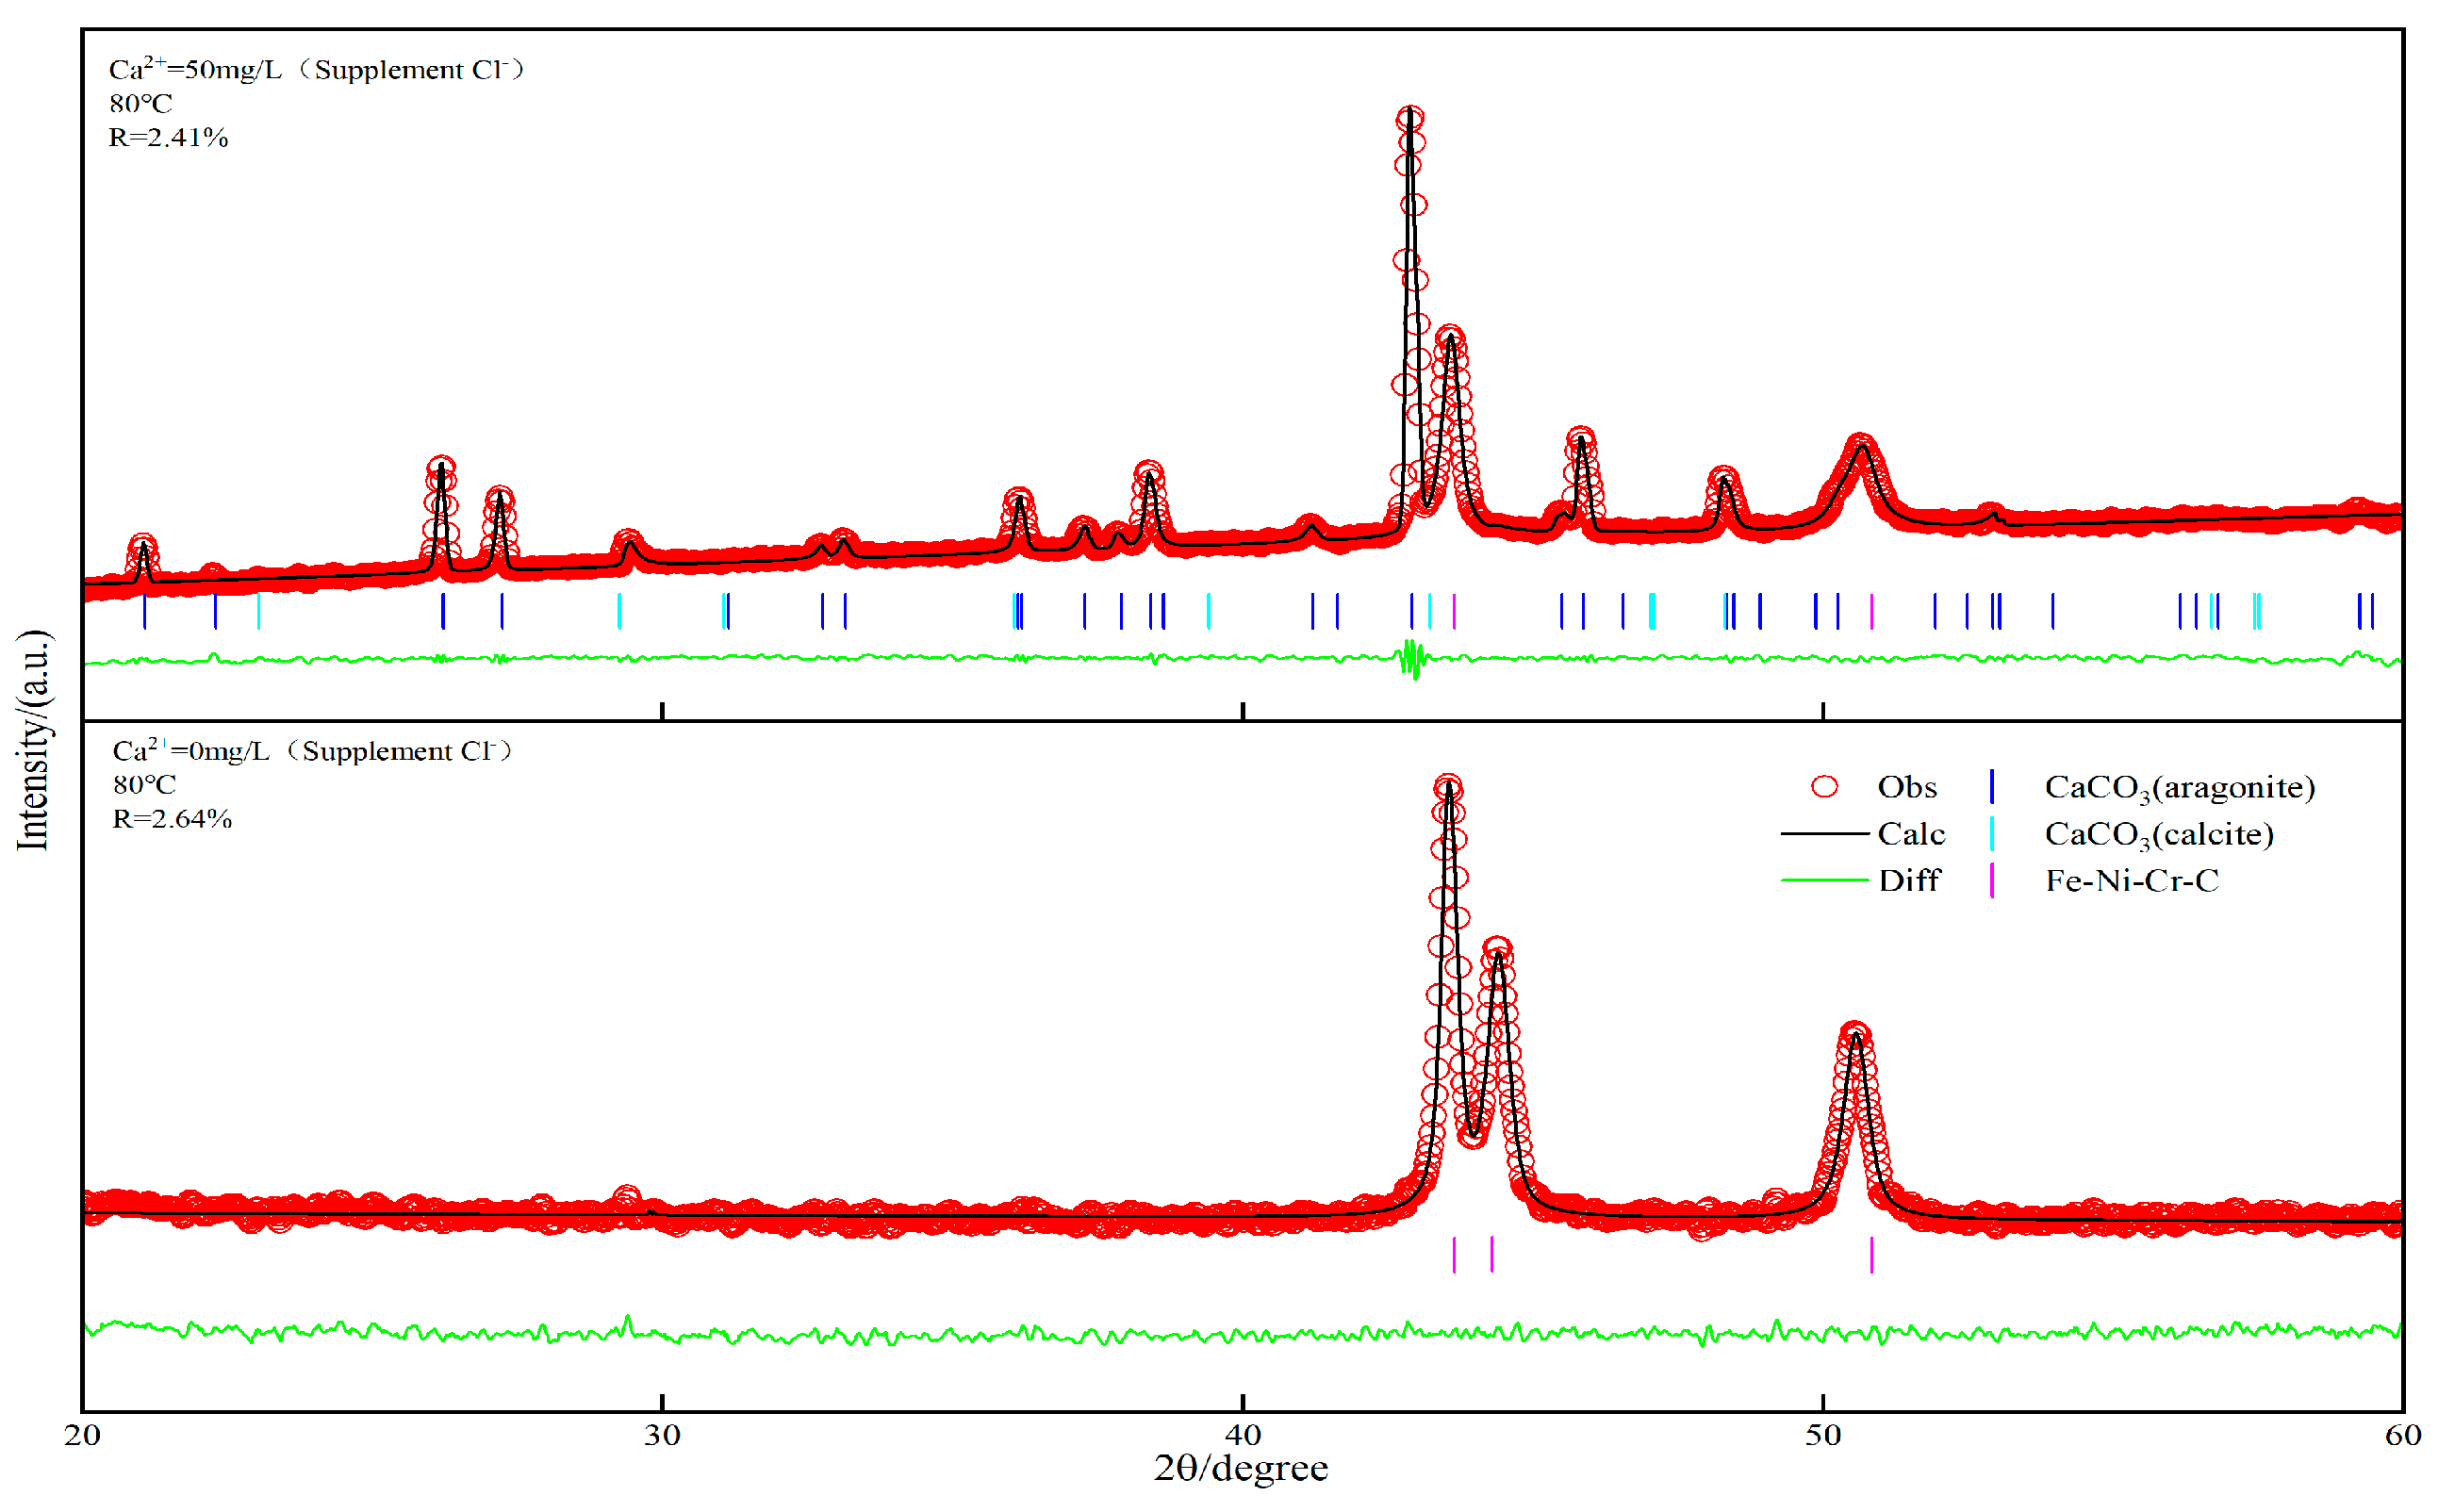
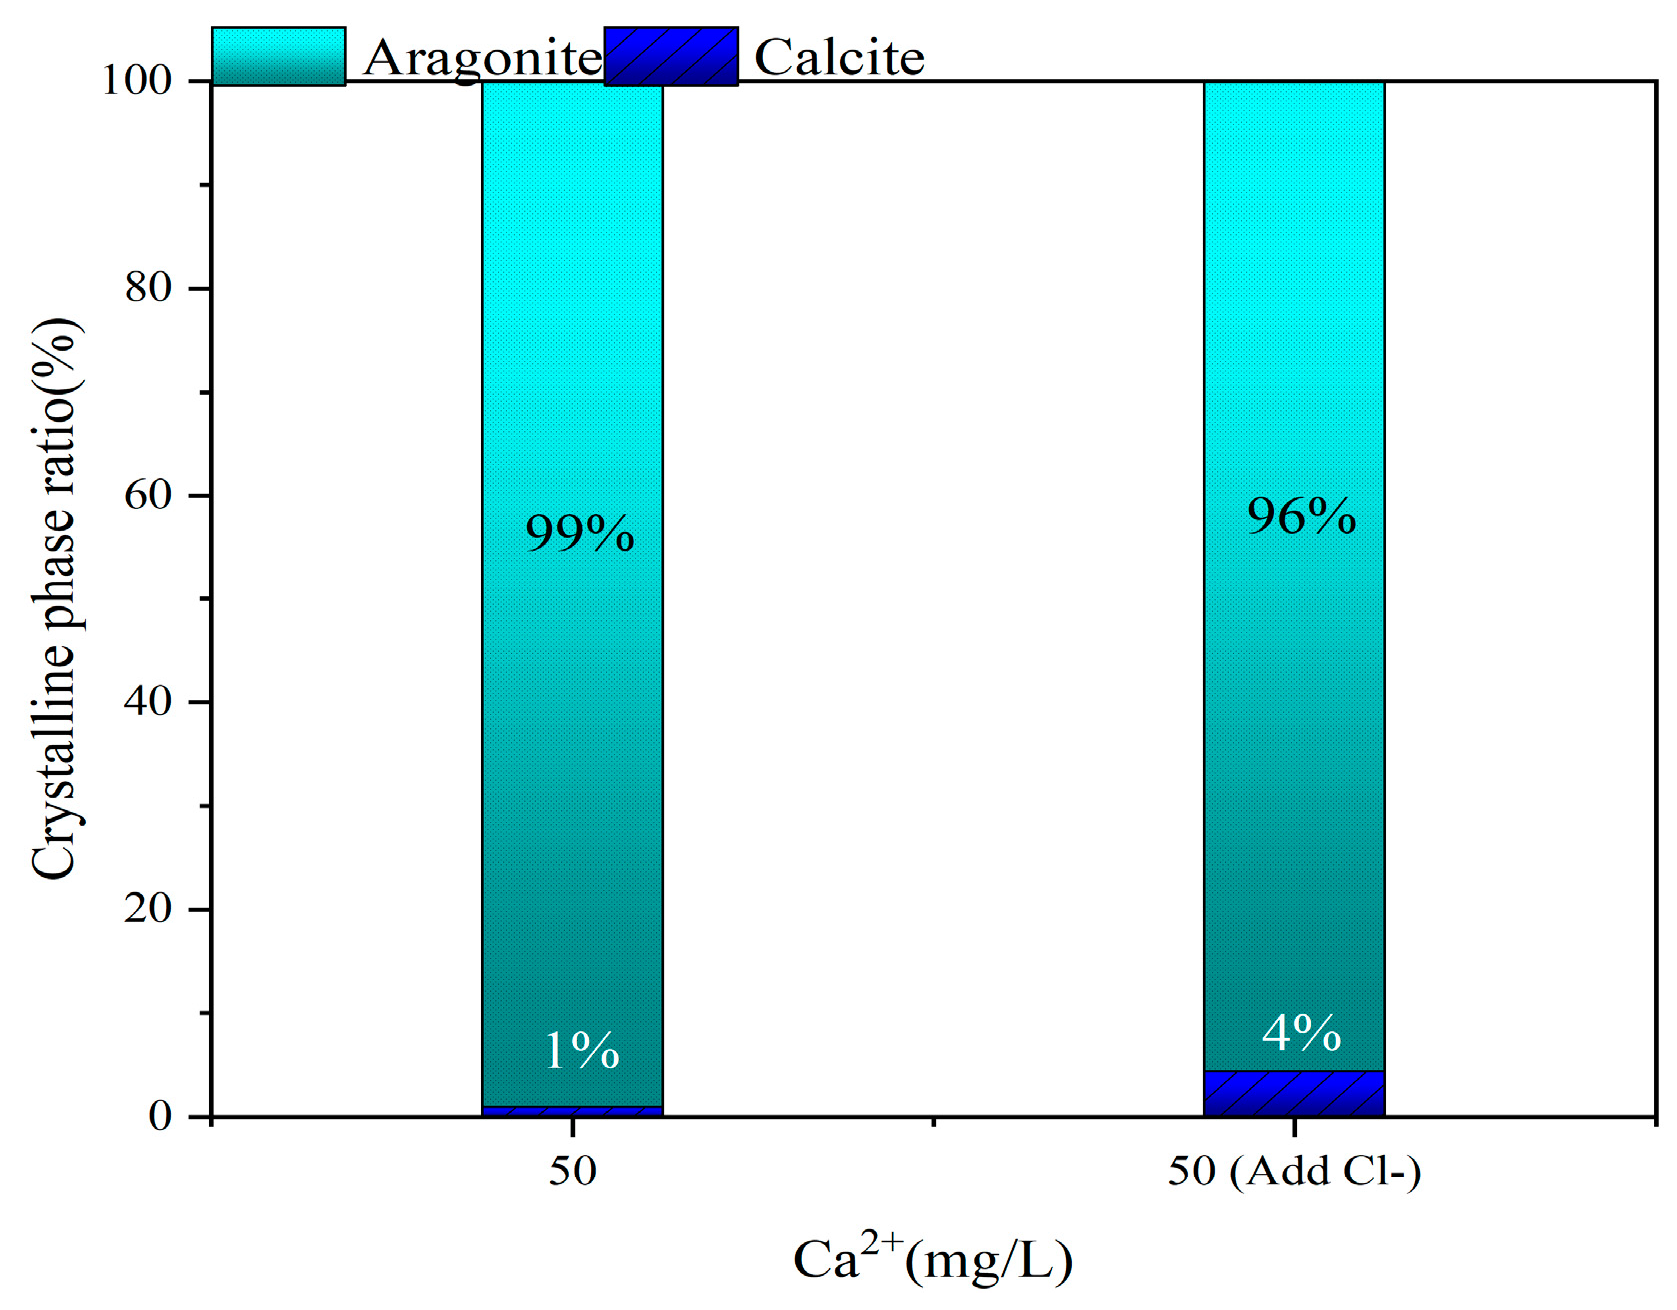
Furthermore, the XRD analysis results in Figure 6 and the comparison of crystal phase ratios in Figure 7 show that there were no significant changes in scaling substances or crystal phases before and after Cl supplementation.
The above results indicate that Ca2+ concentration has a significant effect on scaling in simulated geothermal water, with the primary component of the scale being CaCO3. As Ca2+ is the main constituent for the formation of CaCO3, its concentration directly influences both the scaling rate and the amount of scale. Additionally, an increase in Cl concentration can moderately reduce the scaling amount, likely because Cl slightly enhances the solubility of CaCO3 through ionic interactions, resulting in a minor decrease in scaling rate and amount. However, this effect is relatively weak compared to the significant changes in scaling rate and amount caused by variations in Ca2+ concentration. Therefore, it can be concluded that the scaling process is predominantly controlled by Ca2+ concentration. When Ca2+ was completely removed, no significant scaling was observed in the simulated geothermal water. This suggests that even in complex water environments, scaling is still dominated by CaCO3; no other potentially scaling carbonates or sulfates were observed. This phenomenon is likely due to the inverse solubility characteristic of CaCO3. At a temperature of 80 °C, CaCO3 scaling overwhelmingly dominates in groups containing Ca2+ [32]. In contrast, in groups without Ca2+, the concentration of Mg2+, another ion that could potentially contribute to scaling, was relatively low (12.8 mg/L) and did not result in significant scaling.

4.1.2. Effect of Mg2+ on Scale Deposition

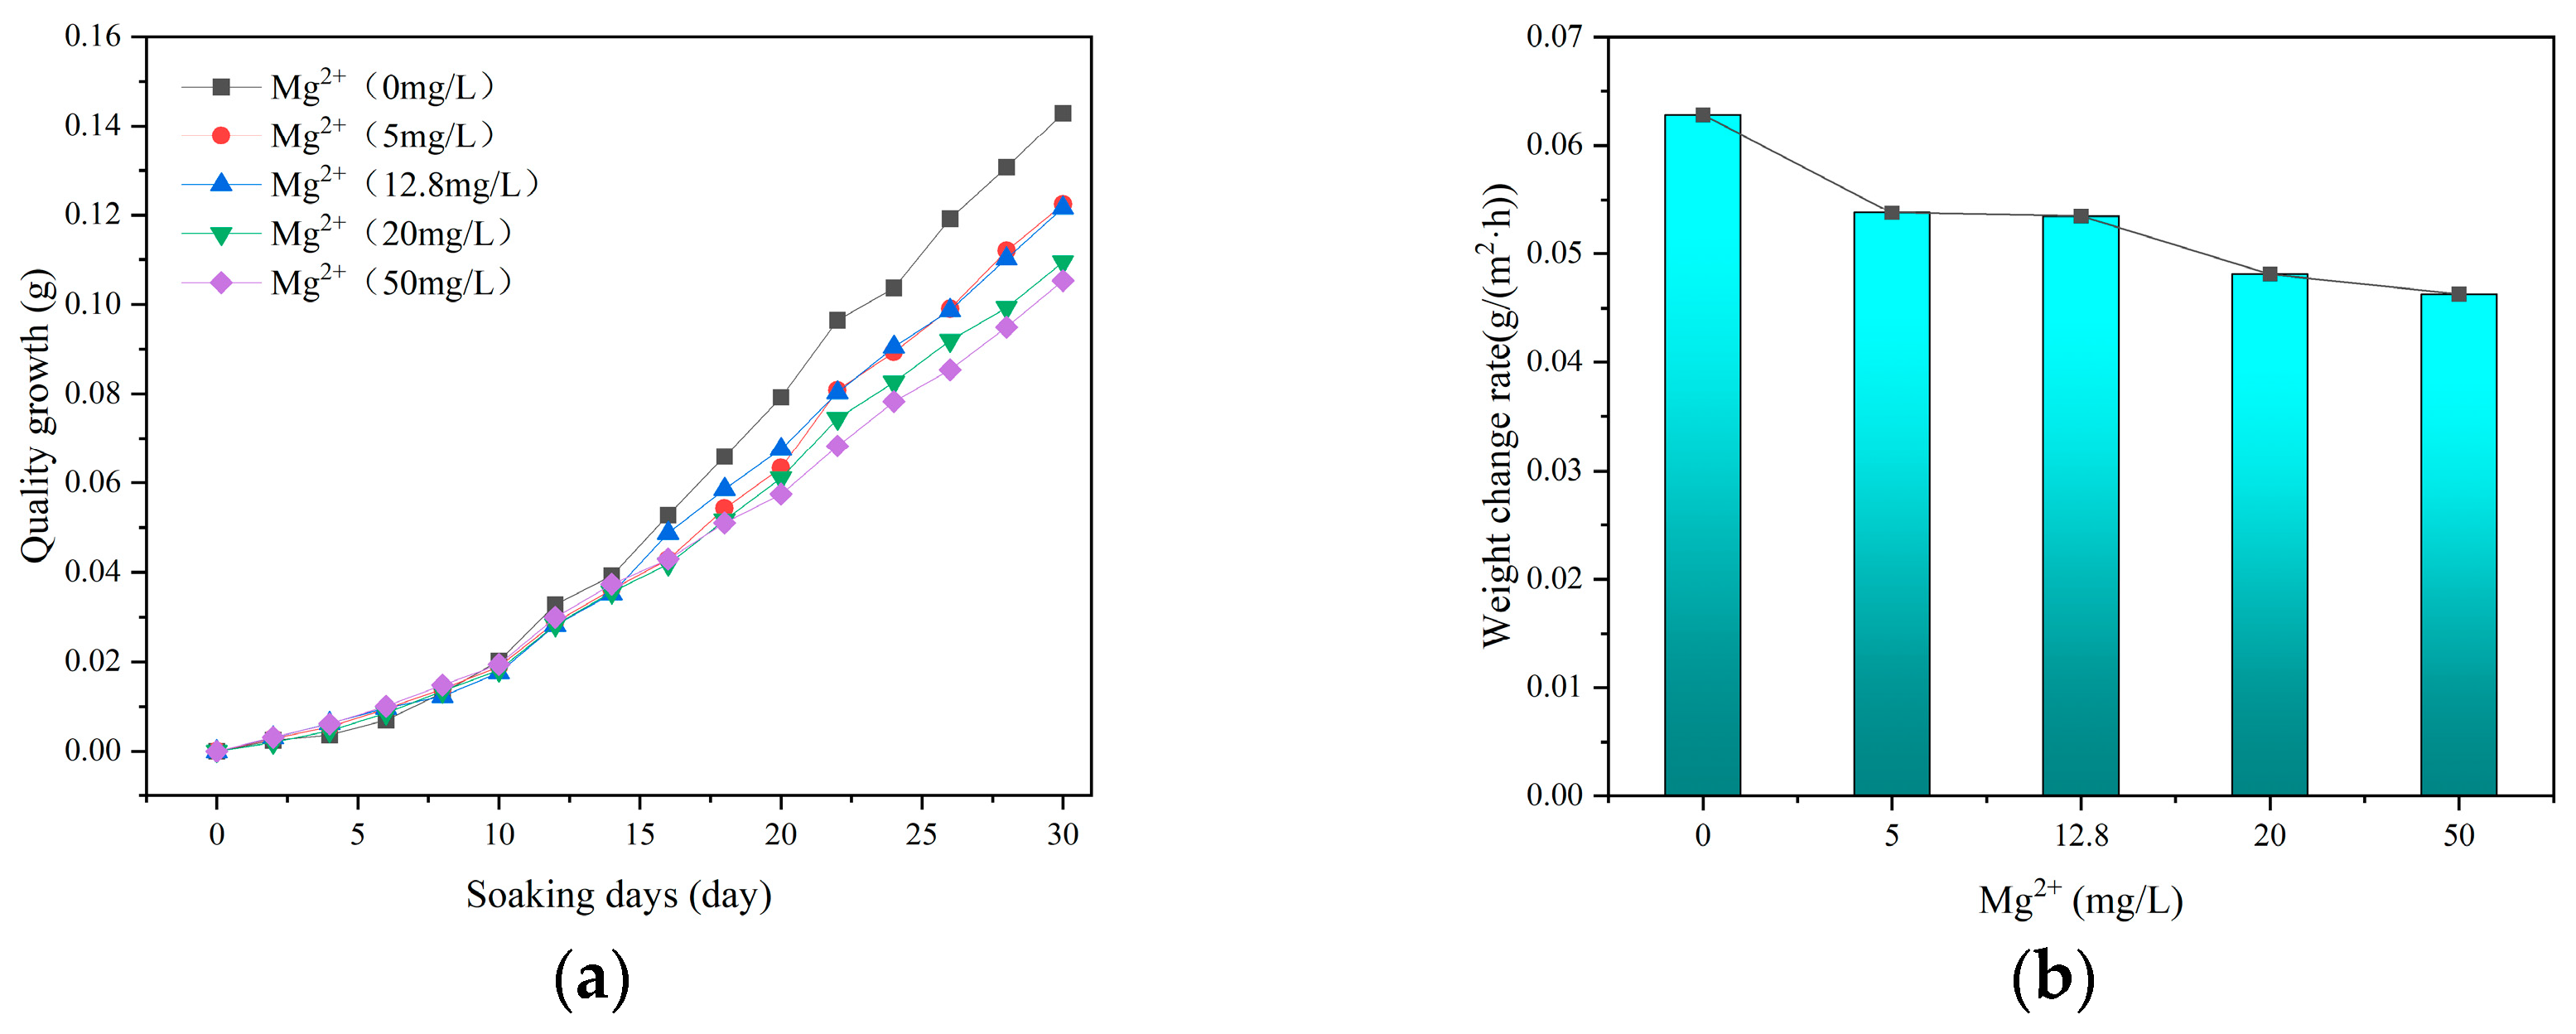
The weight-increase trend and scaling rate of the Mg2+ concentration gradient control group samples after 30 days of immersion in simulated geothermal water at 80 °C are shown in Figure 8. The experimental results indicate that the presence of Mg2+ has a certain impact on scaling deposition, with the scaling amount gradually decreasing as the Mg2+ concentration increases. Using the baseline water sample as a reference, when the Mg2+ concentration was 12.8 mg/L, the scaling rate was 0.053 g/(m2·h). When Mg2+ was completely removed, the scaling rate increased to 0.063 g/(m2·h), which is 18.87% higher than that of the baseline water sample. When the Mg2+ concentration was reduced by 60.94% to 5 mg/L, the scaling rate was 0.054 g/(m2·h), nearly identical to the scaling rate of the baseline water sample. When the Mg2+ concentration increased by 56.25% to 20 mg/L, the scaling rate decreased to 0.048 g/(m2·h), a reduction of 9.43%. Further increasing the Mg2+ concentration by 290.63% to 50 mg/L resulted in a scaling rate of 0.046 g/(m2·h), a reduction of 13.21%.
The variation in Mg2+ concentration exhibits a nonlinear effect on the scaling rate. When Mg2+ was completely removed, the scaling rate increased significantly, indicating that Mg2+ has a noticeable inhibitory effect on the scaling process. Between 5 mg/L and 12.8 mg/L, the scaling rate showed minimal variation, remaining close to the level of the baseline water sample. However, when the Mg2+ concentration increased further from 12.8 mg/L to 20 mg/L and 50 mg/L, the scaling rate decreased slightly but with diminishing magnitude. This trend suggests that Mg2+ can mitigate scaling within a certain concentration range, but its effect is relatively weak, and its influence on the scaling rate gradually plateaus at higher concentrations.
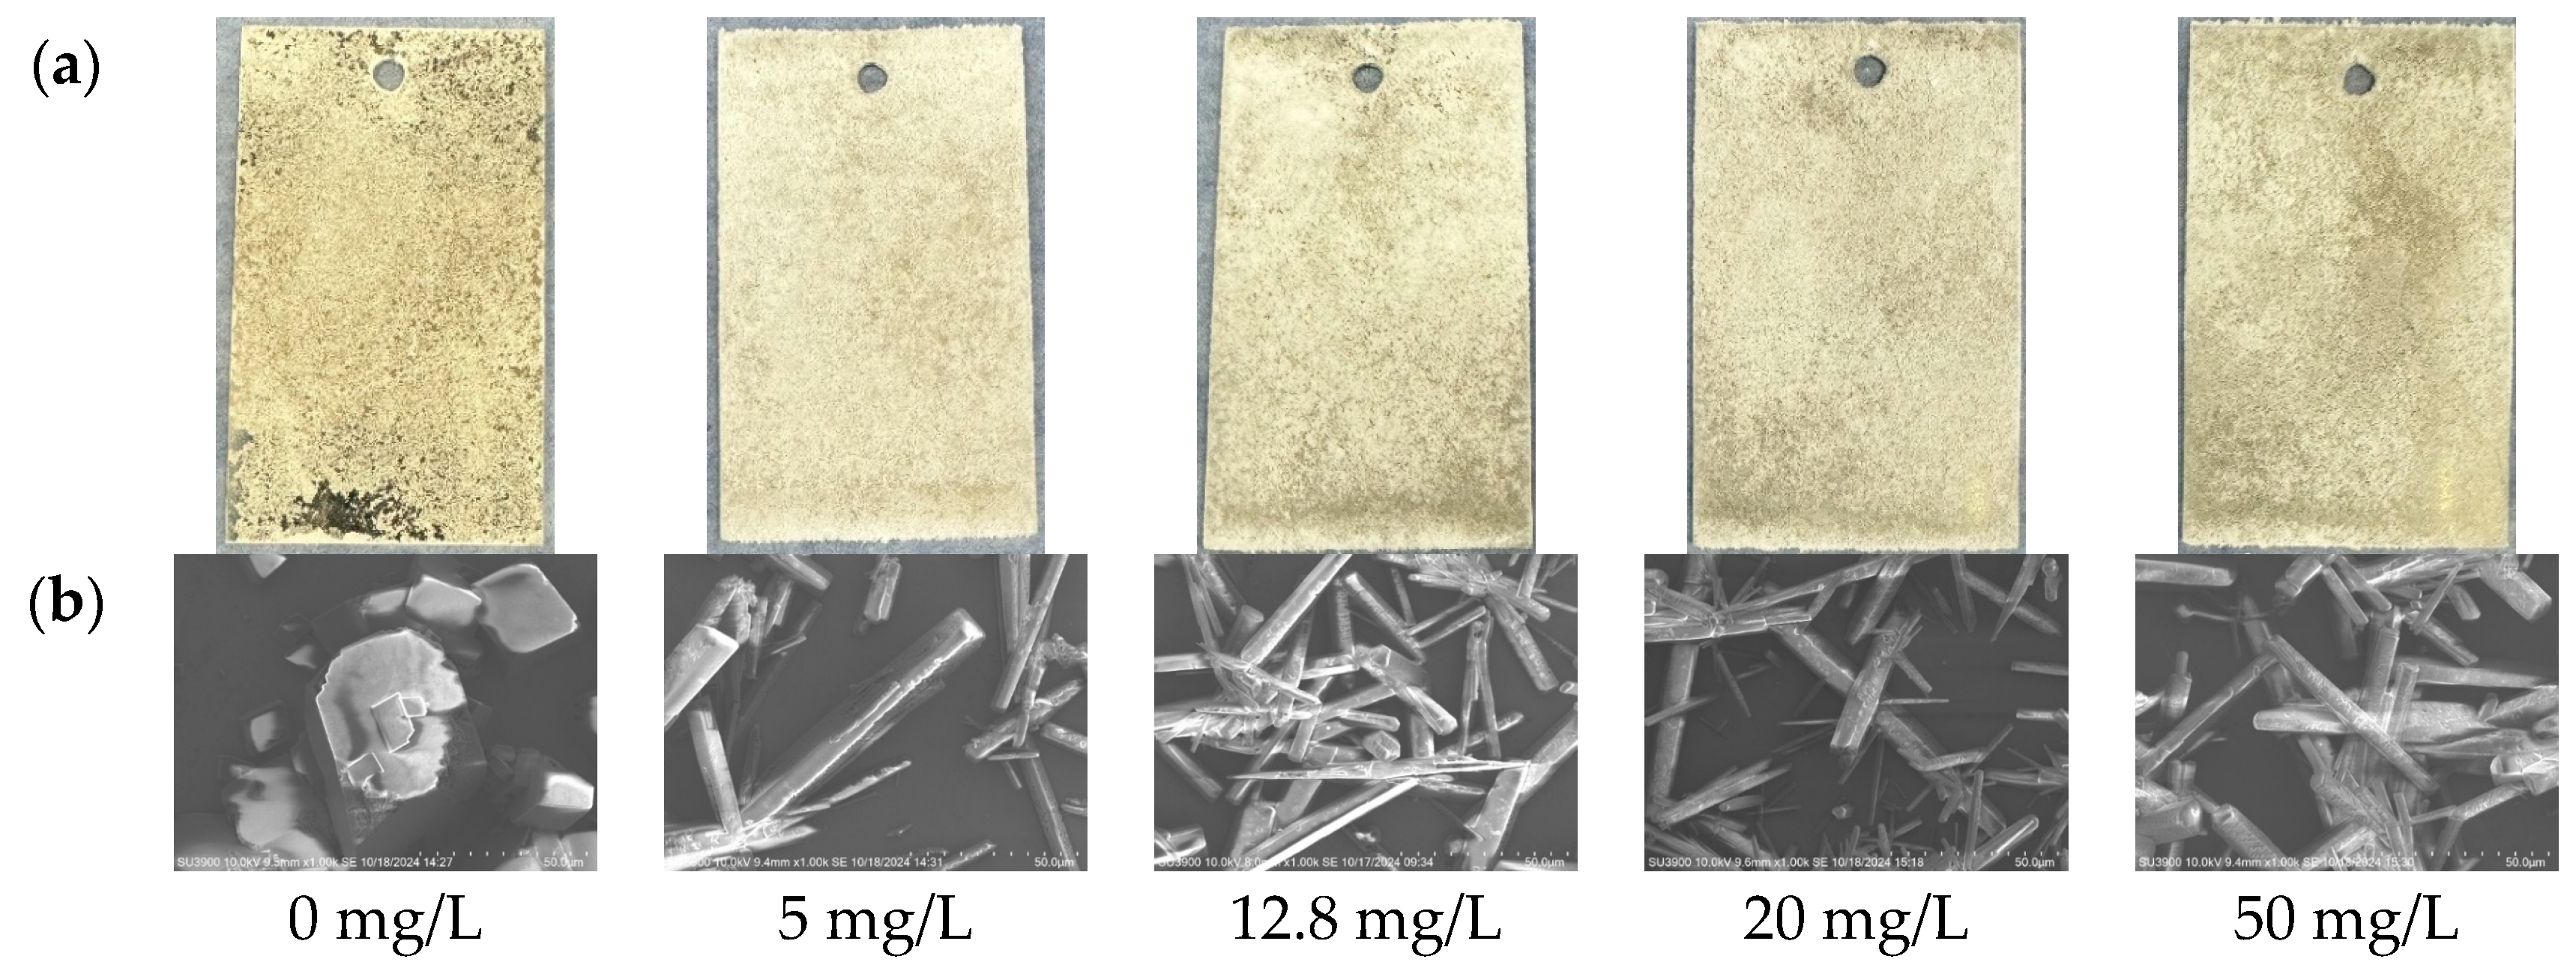
The scaling morphology on the surface of the samples after immersion is shown in Figure 9. When Mg2+ was completely removed, the scaling morphology on the sample surface underwent significant changes, presenting as dense, thin-layered scales with a translucent appearance. Some scale layers detached, exposing the sample surface, and the scaling morphology was noticeably different from that of other control group samples. SEM images revealed that the scale at this concentration primarily consisted of rhombohedral structures. In contrast, for samples containing Mg2+, the scaling on the surface appeared as loose, white granular deposits. SEM images showed that the scale material mainly appeared as needle-like or columnar aggregates, accompanied by a small number of rhombohedral structures, resembling the scaling morphology observed in the Ca2+ control group samples.
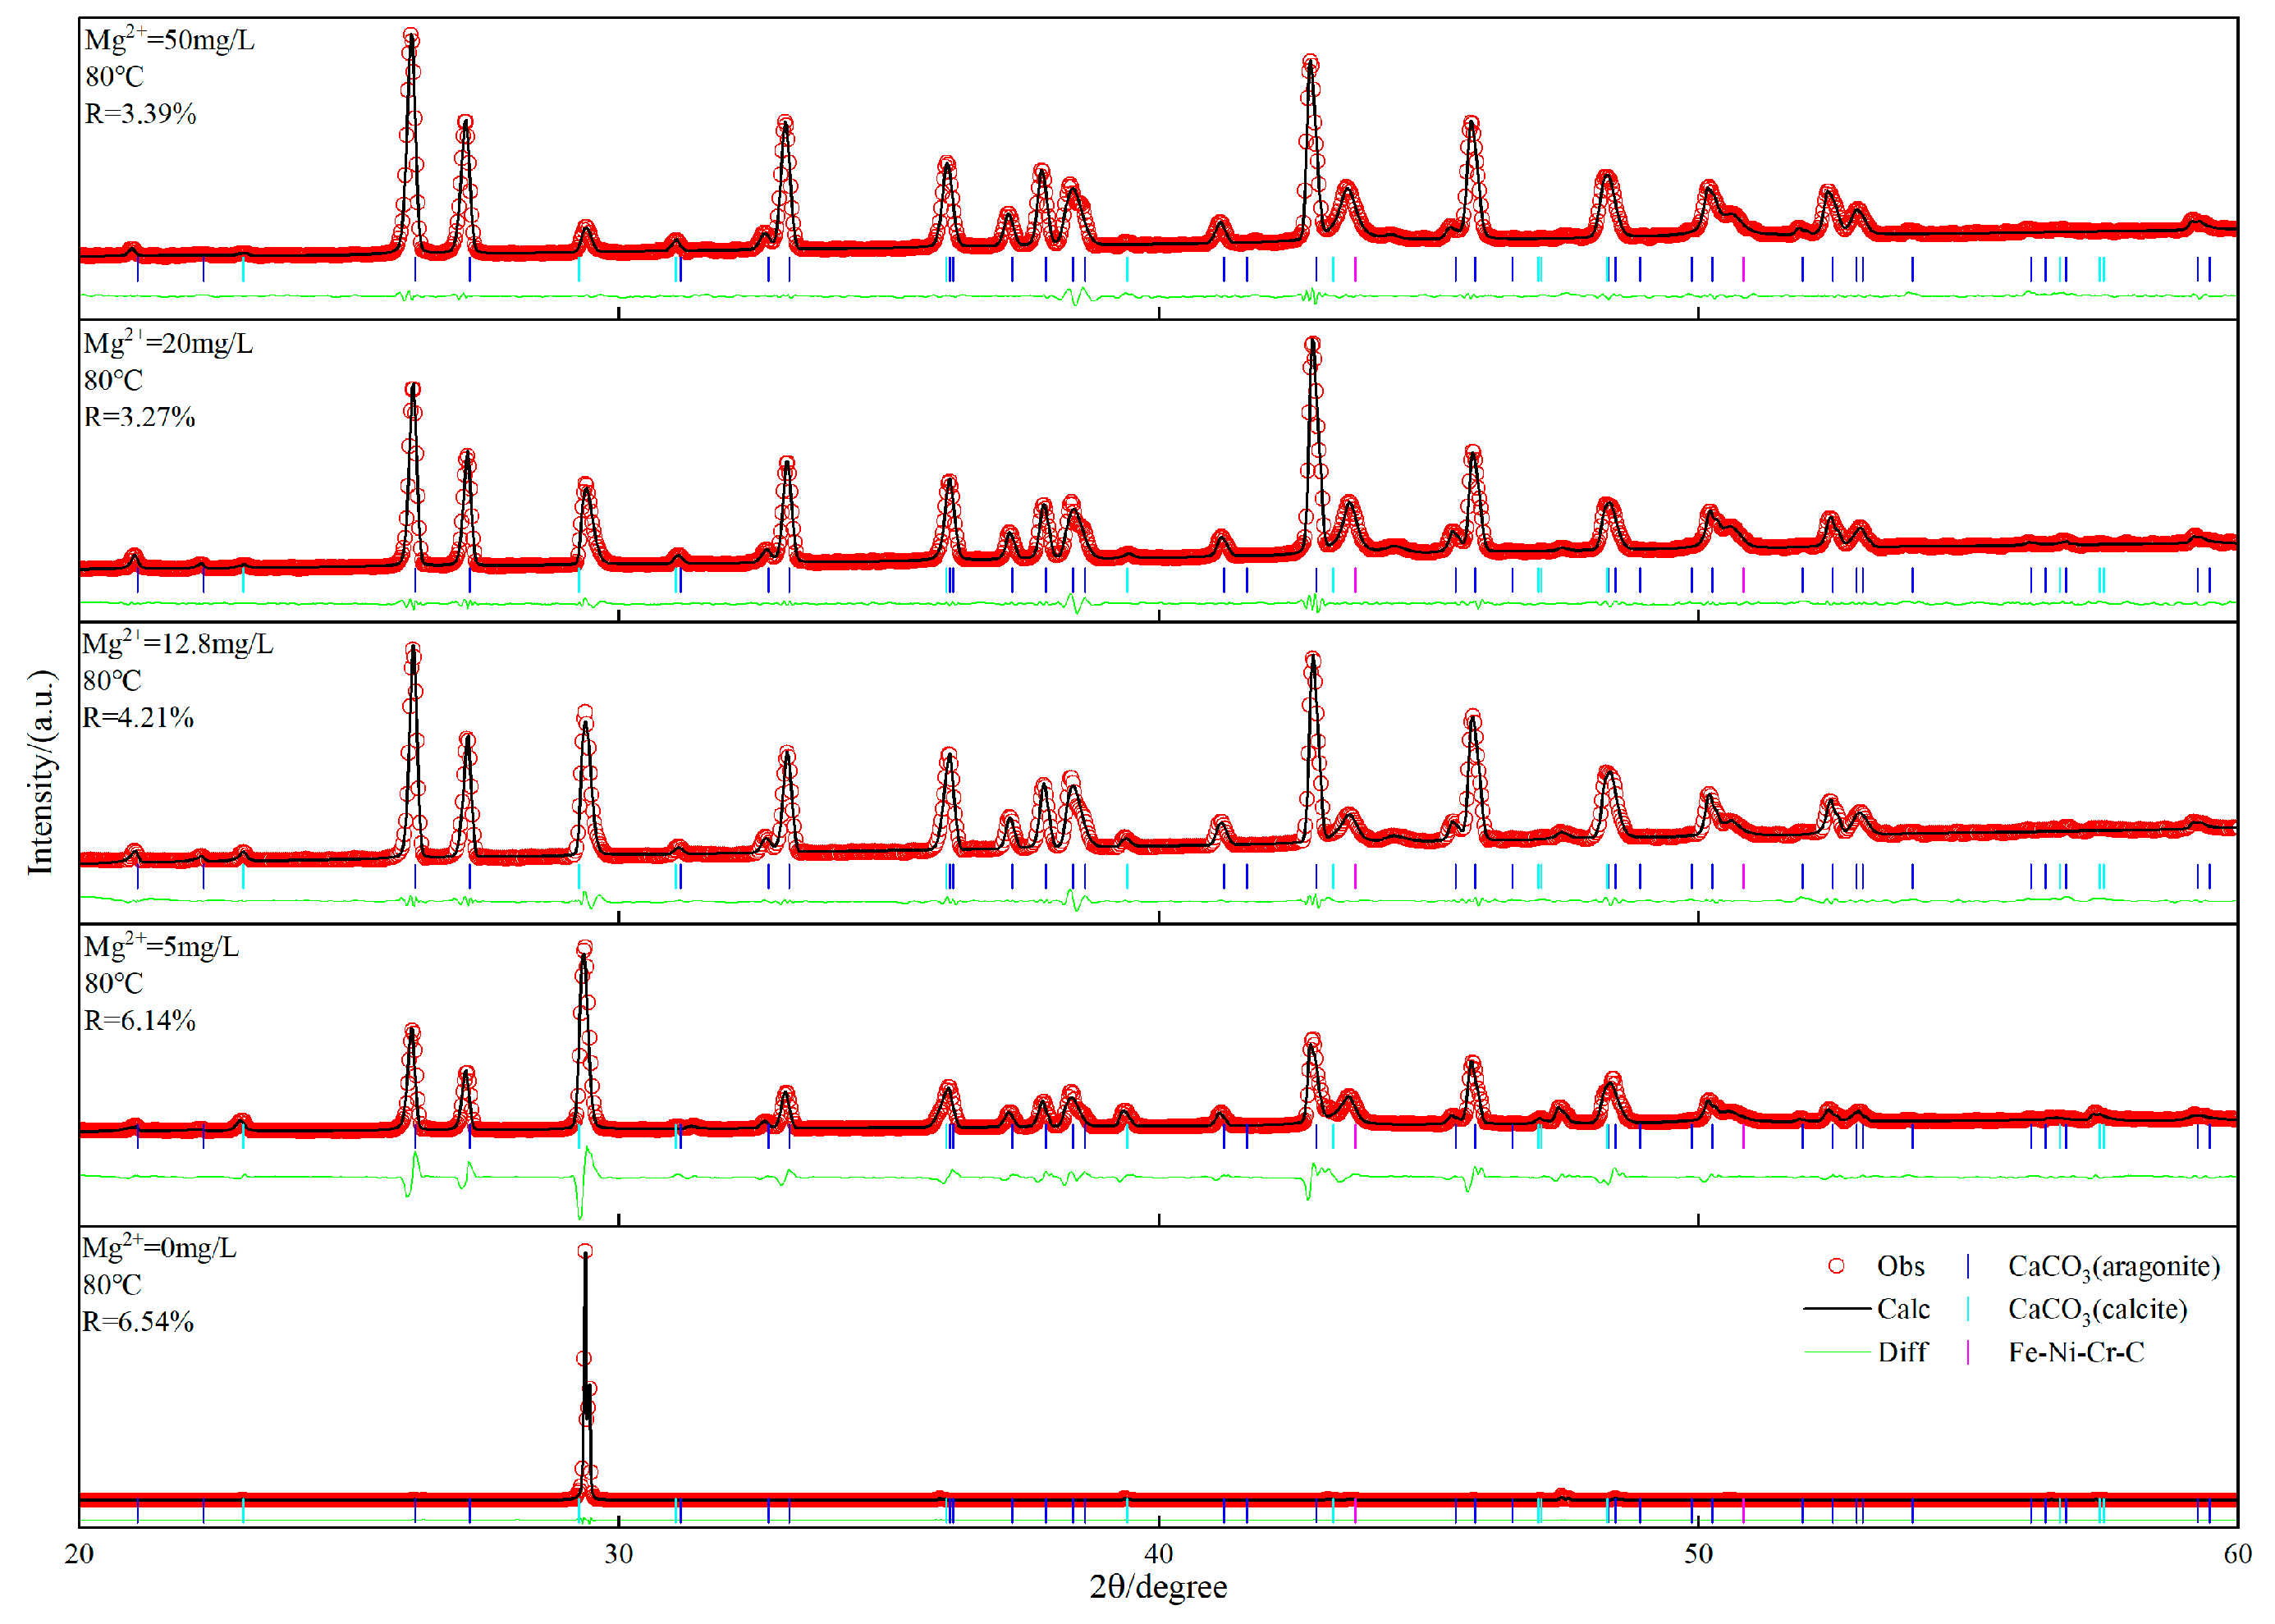
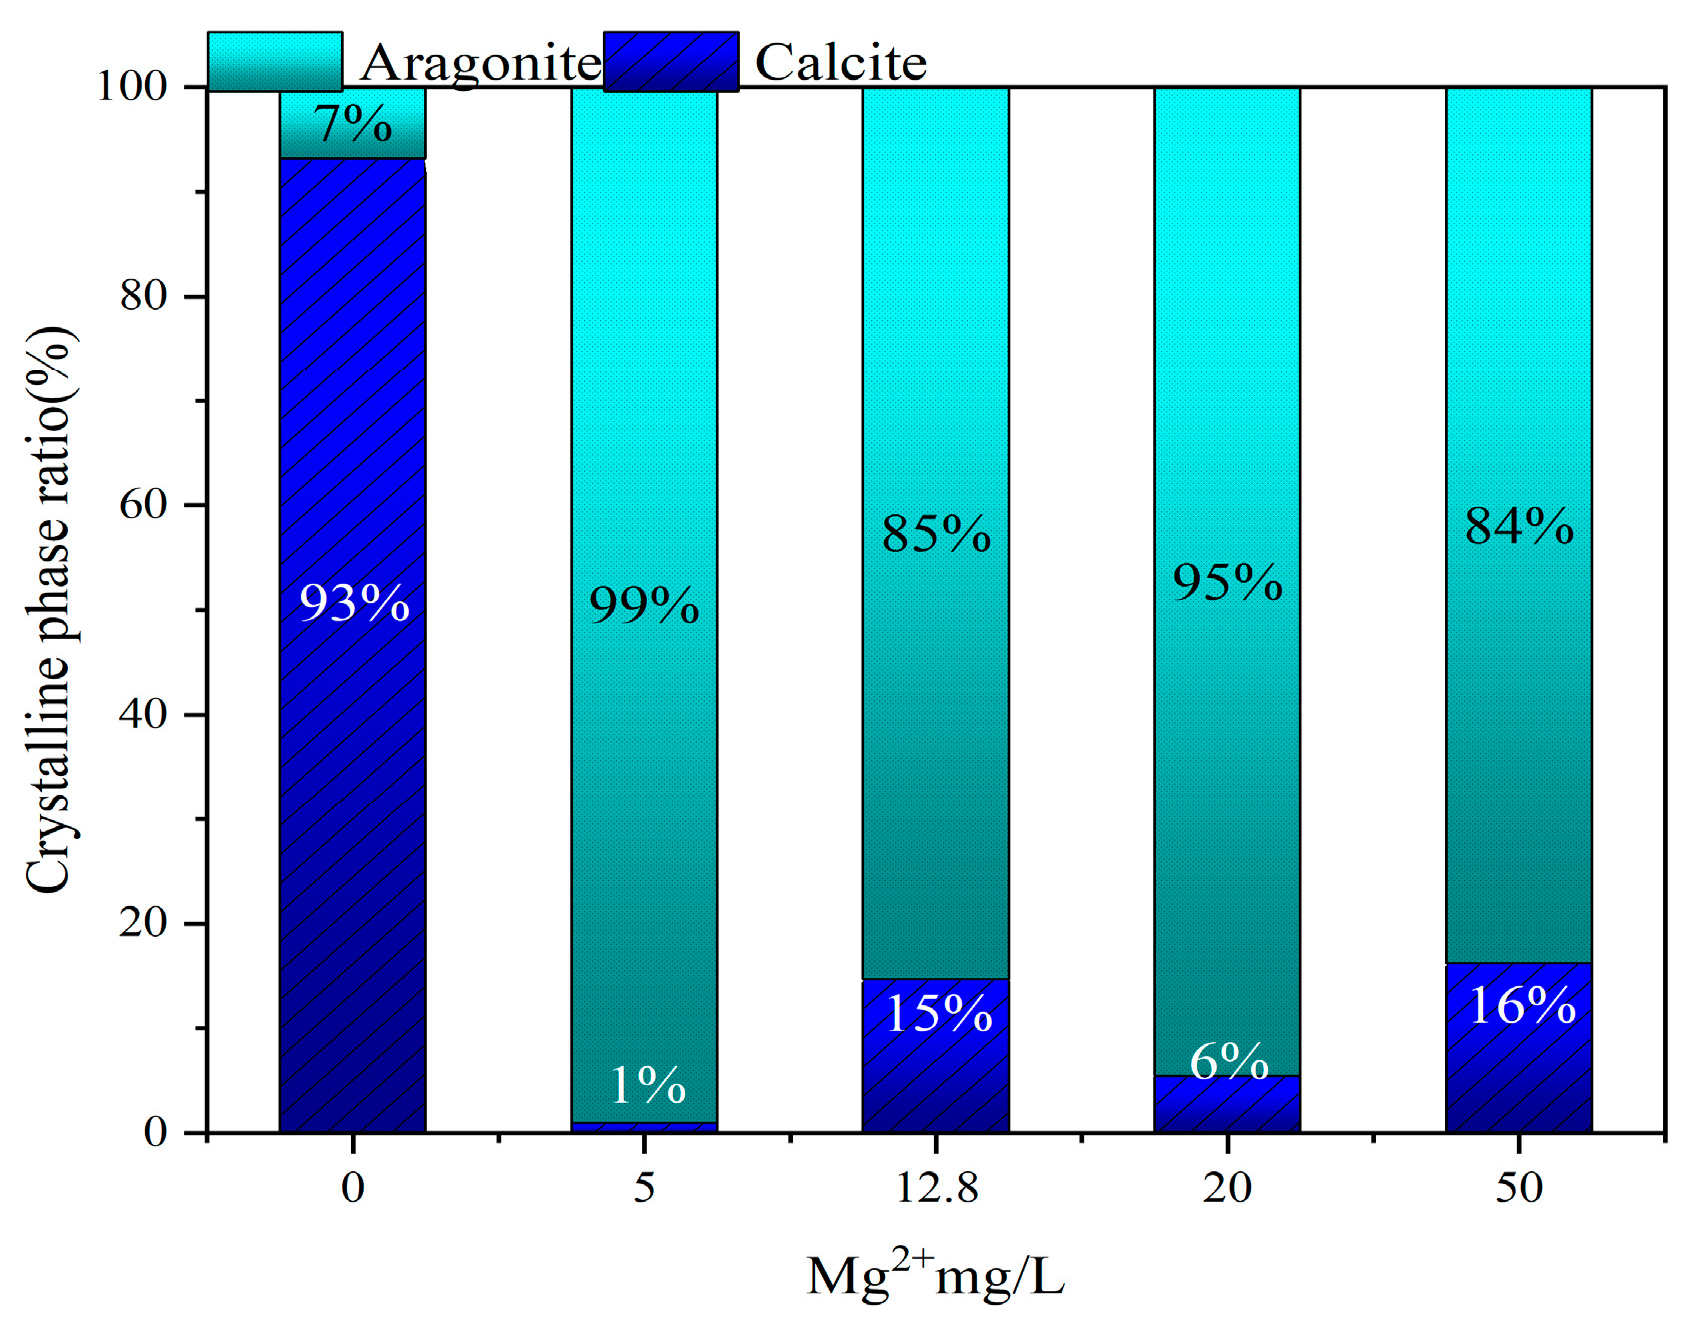
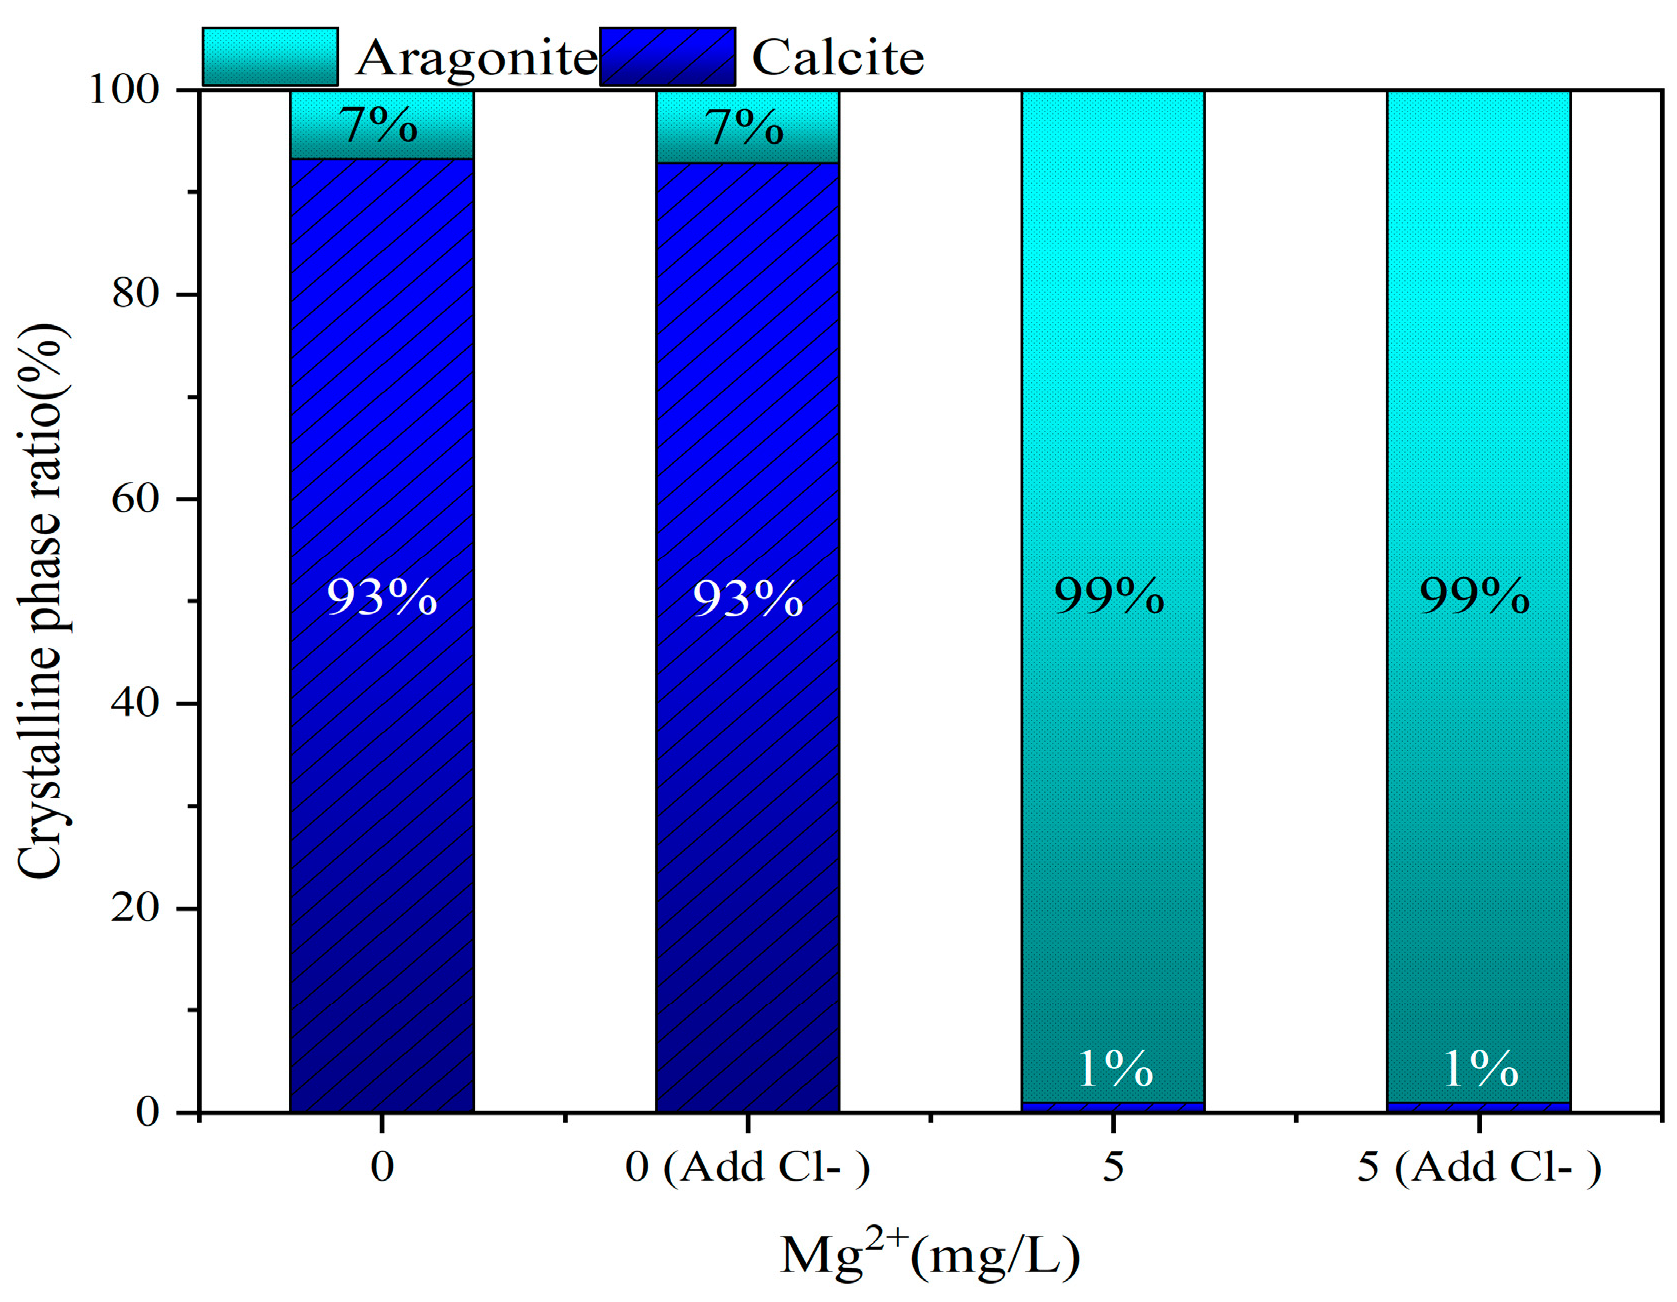
The XRD analysis results, shown in Figure 10, indicate that the main component of the scale on the sample surface is CaCO3. Among the CaCO3 crystals, the needle-like or columnar crystals were primarily aragonite, and the rhombohedral crystals were calcite. The crystal phase ratio of aragonite to calcite, shown in Figure 11, reveals that at 0 mg/L Mg2+ concentration, calcite dominated (93%), with typical rhombohedral calcite crystals observed in the SEM images, while aragonite was present at a lower proportion (7%). With the addition of Mg2+, aragonite became the dominant phase (>84%), and as the Mg2+ concentration gradually increased, the crystal phase ratio of calcite to aragonite did not show significant regular variation, with aragonite continuing to dominate, ranging from 84% to 99%.
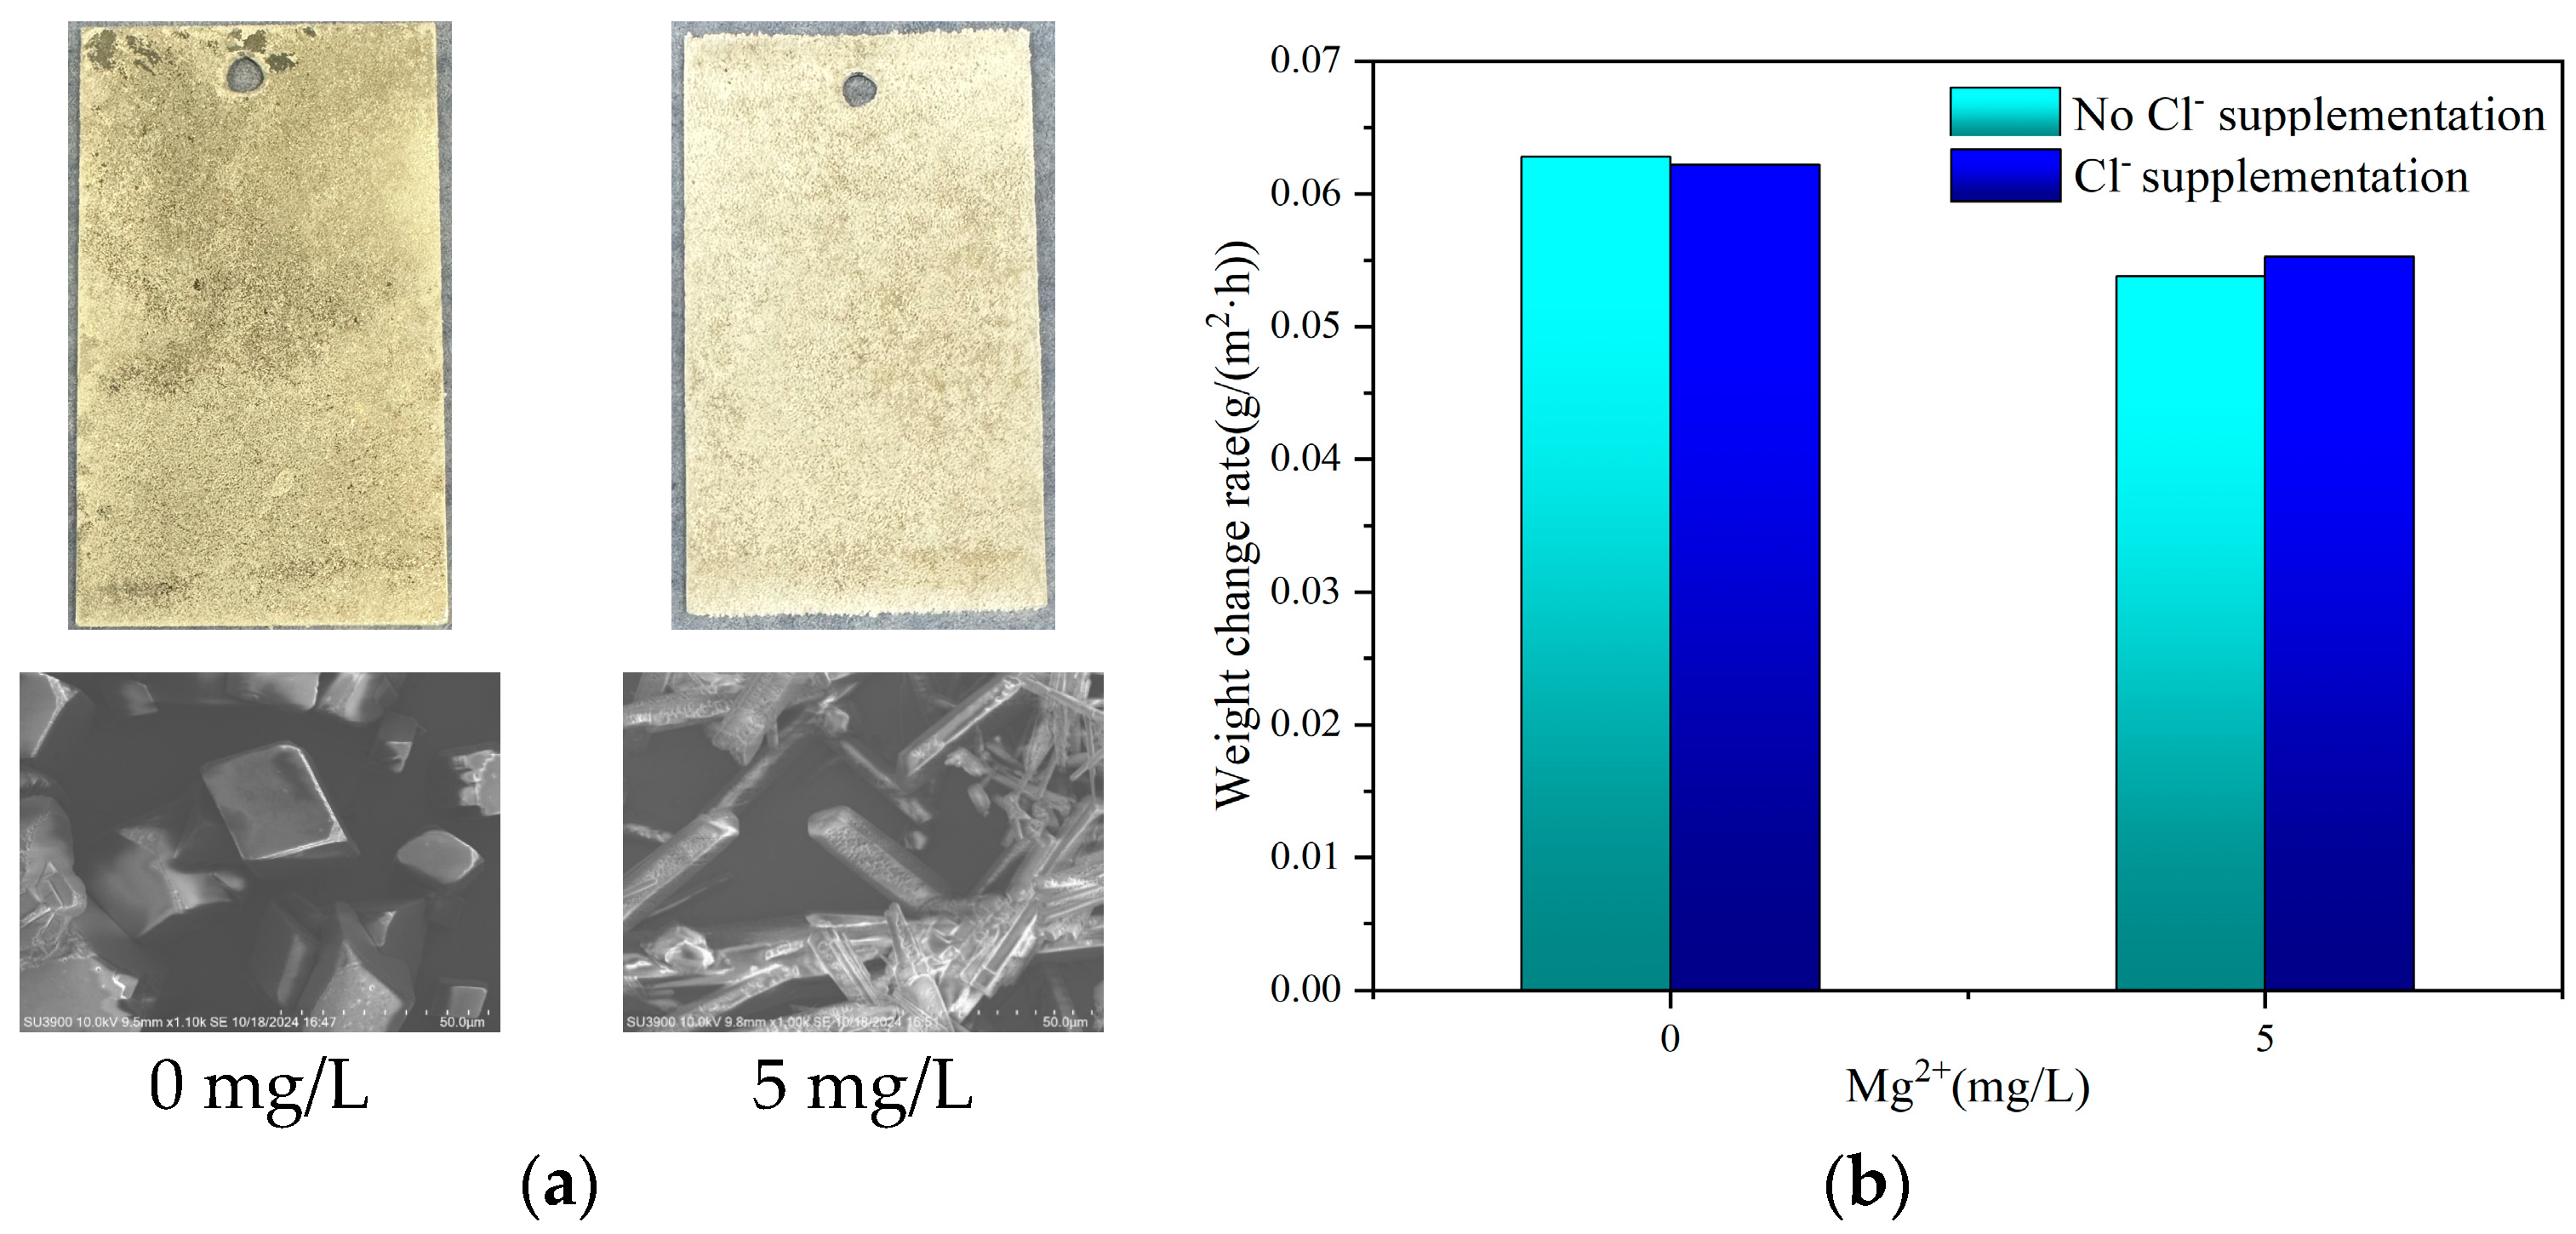
In the control groups with Mg2+ concentrations of 0 mg/L and 5 mg/L, NaCl was added to bring the Cl concentration up to the baseline water sample level. After 30 days of immersion in simulated geothermal water at 80 °C, a comparison of the scaling morphology and scaling rates before and after Cl supplementation was performed, and the results are shown in Figure 12.The results indicate that in the Cl supplemented control group with an Mg2+ concentration of 0 mg/L, the Cl concentration increased from 201.5 mg/L to 238.8 mg/L, representing an increase of approximately 18.55%, and the final scaling rate decreased by about 0.98%. In the Cl supplemented control group with an Mg2+ concentration of 5 mg/L, the Cl concentration increased from 216 mg/L to 238.8 mg/L, representing an increase of approximately 10.59%, and the final scaling rate increased by about 2.76%.
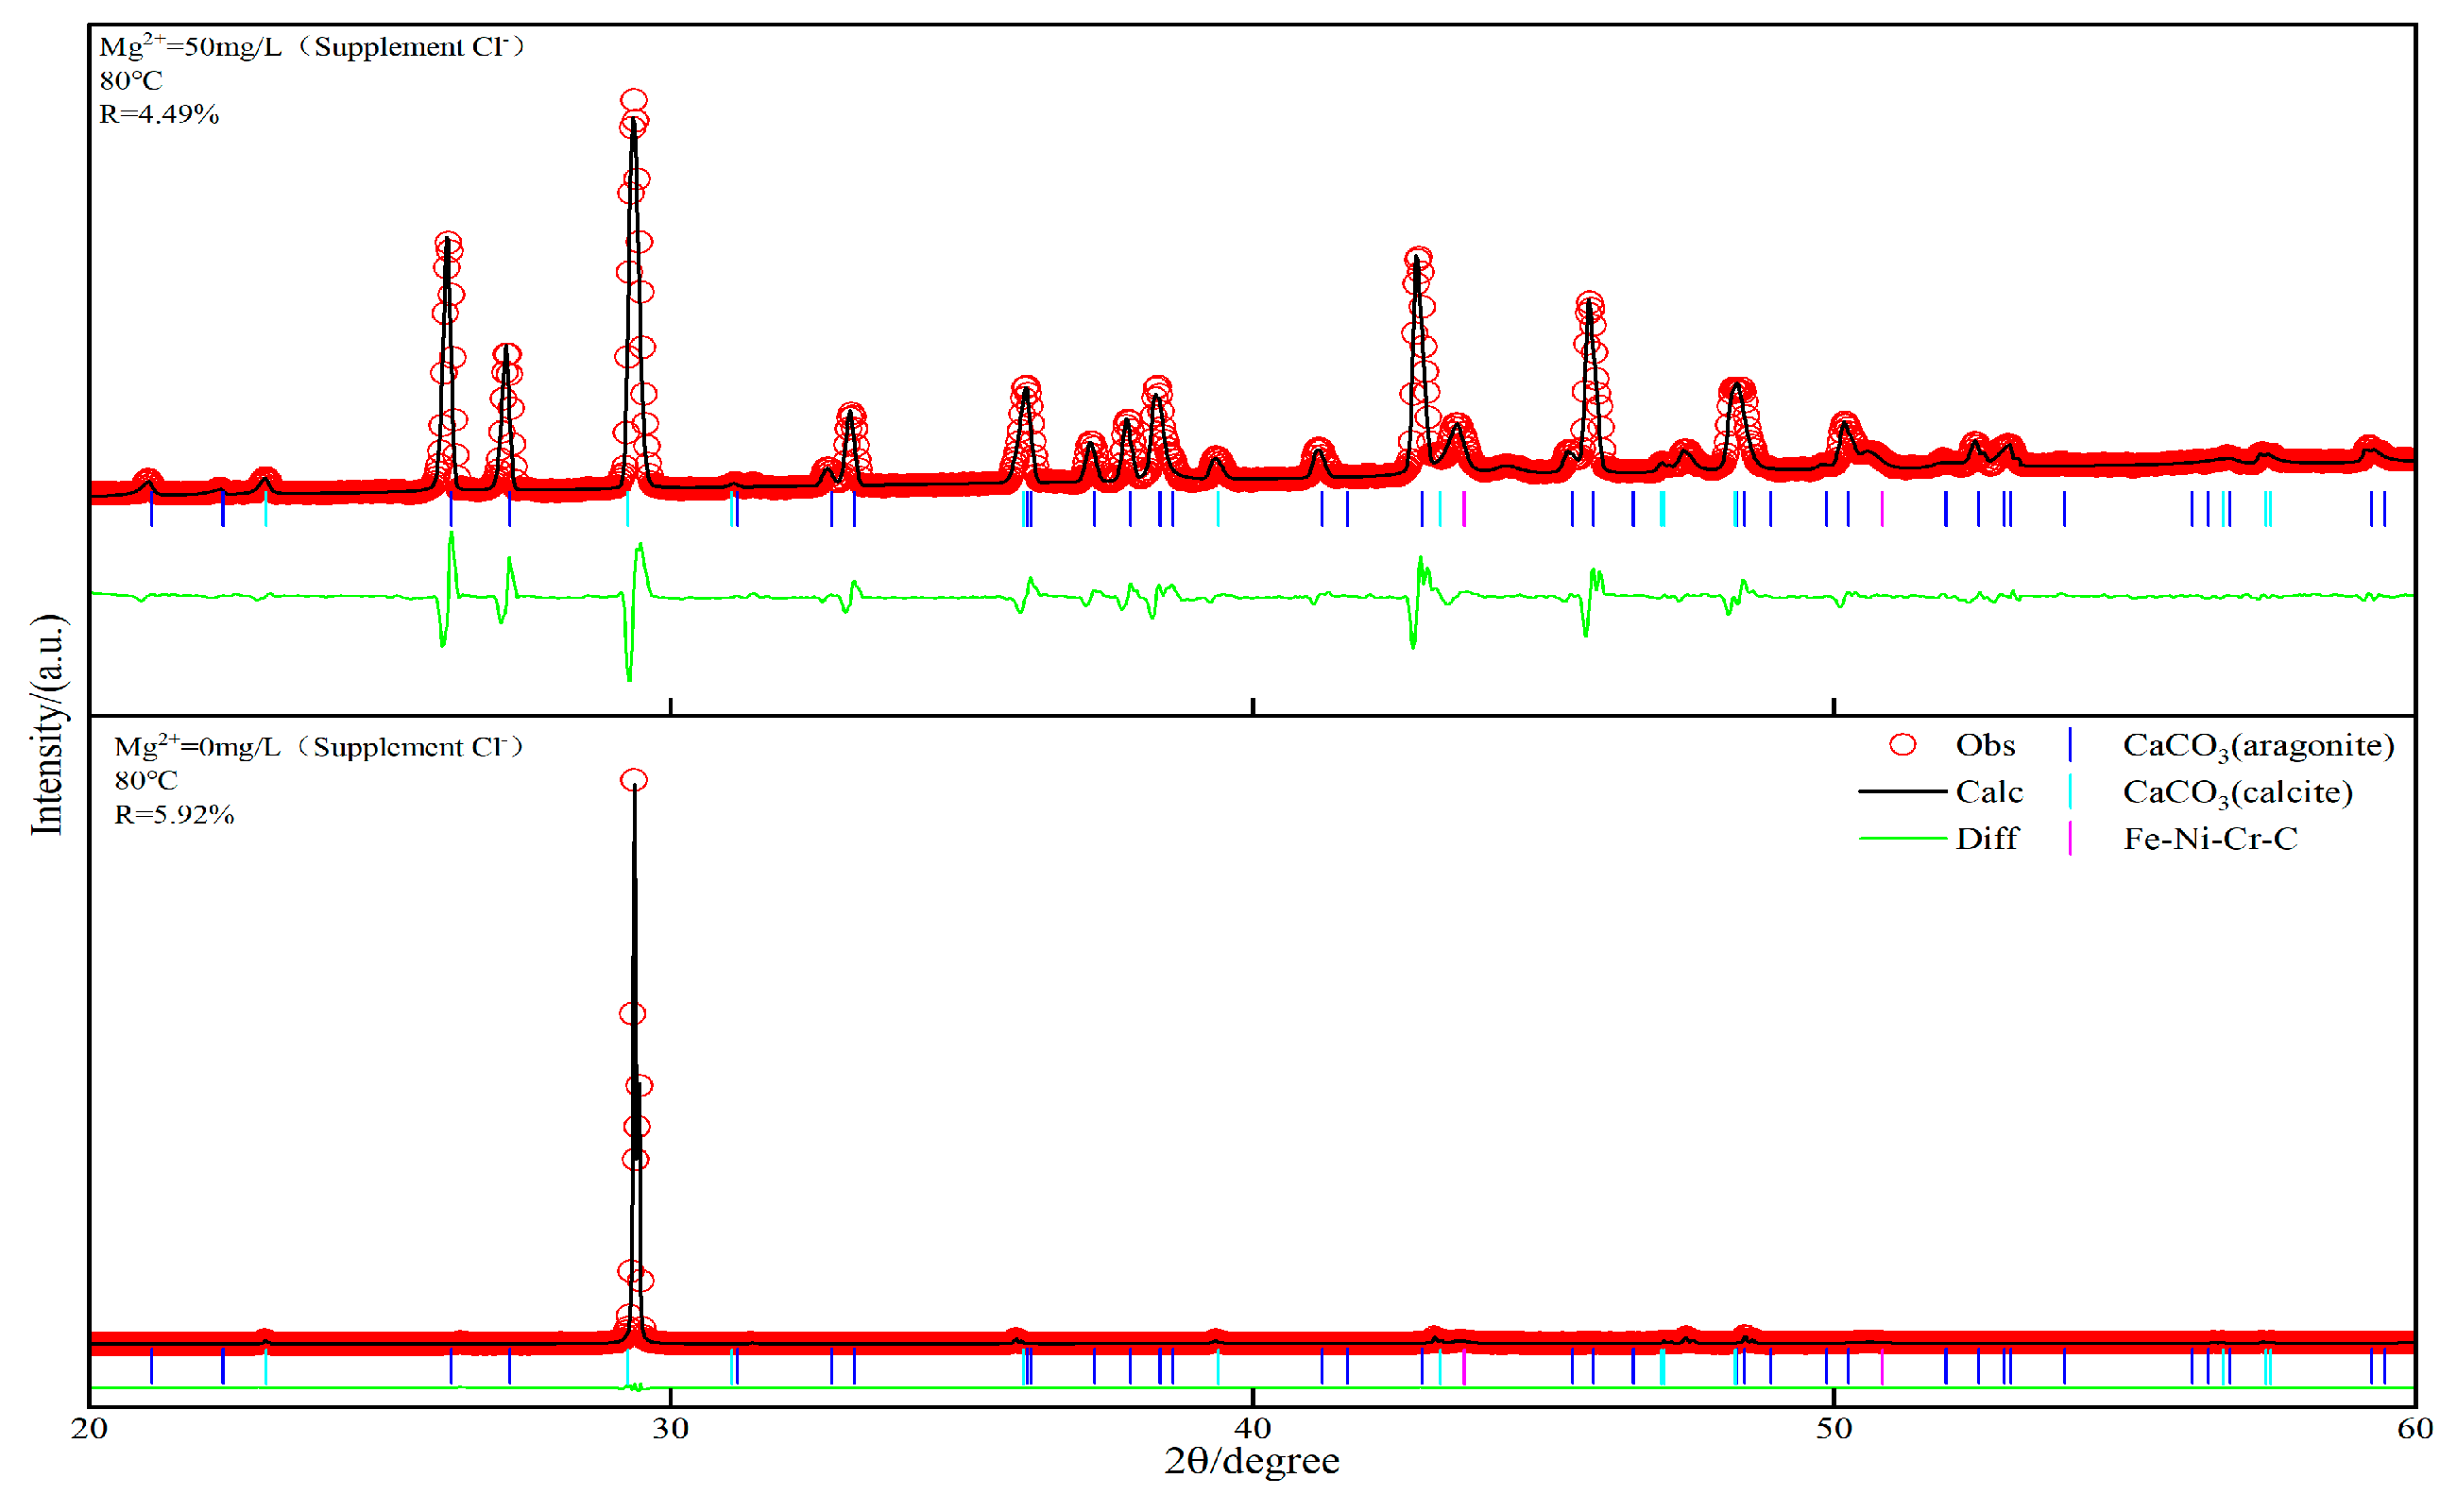
Furthermore, the XRD analysis results in Figure 13 and the comparison of crystal phase ratios in Figure 14, show that there were no significant changes in scaling substances or crystal phases before and after Cl supplementation.
The current data indicate that the effect of Mg2+ on CaCO3 scaling behavior is primarily reflected in its regulation of crystal phase distribution. The complete removal of Mg2+ results in CaCO3 predominantly forming as calcite, whereas in simulated geothermal water containing Mg2+, CaCO3 primarily forms as aragonite. The presence of Mg2+ significantly influences the crystal phase ratio of CaCO3, but variations in Mg2+ concentration do not appear to have a notable effect on the ratio of aragonite to calcite. Additionally, as the Mg2+ concentration increases, the total scale deposition slightly decreases, but the impact is limited. Moreover, changes in Cl concentration have no significant effect on either the scaling amount or the crystal phase distribution. This is likely because the Mg2+ concentration in the baseline water sample is relatively low (12.8 mg/L), and adjustments in Mg2+ concentration only induce a maximum Cl variation of 37 mg/L, accounting for 13.4% of the original Cl concentration. Given this small variation, the impact on both the scaling amount and the crystal phase is negligible. Thus, it can be concluded that the variations in crystal phase, scaling rate, and scaling amount during Mg2+ concentration adjustments are predominantly governed by Mg2+ itself.
The scaling process of CaCO3 involves six different crystal forms, including three anhydrous polymorphs, calcite, aragonite, and vaterite, as well as three hydrated forms, amorphous calcium carbonate (ACC), monohydrate calcium carbonate (MCC), and hexahydrate calcium carbonate (CCH). Although all of these forms belong to CaCO3, they differ in terms of crystal morphology, color, hardness, and refractive index. In geothermal water scaling, the primary forms are the three anhydrous polymorphs (calcite, aragonite, and vaterite). Among them, calcite is the most common scaling form and is the most thermodynamically stable crystallographic phase. Calcite scaling is usually harder, resulting in more solid deposits that can lead to blockages and reduced efficiency in geothermal systems. In contrast, aragonite and vaterite are metastable, non-adhesive crystal phases that form softer scales, which can be easily carried away by the fluid, thereby reducing their long-term impact on the system.
Mg2+ interferes with the morphology of CaCO3 crystals mainly by influencing the crystal surface energy and lattice structure [33]. Due to its smaller ionic radius (0.72 Å), Mg2+ cannot fully replace Ca2+ (1.00 Å) in the lattice but can adsorb onto the crystal surface, particularly on specific crystal planes. This adsorption alters the growth direction and surface energy of CaCO3 crystals, promoting the preferential formation of metastable aragonite or vaterite rather than the thermodynamically most stable calcite. Previous studies have shown that Mg2+ naturally present in seawater can effectively inhibit CaCO3 formation. By competitively adsorbing at the nucleation sites of CaCO3, Mg2+ extends the induction period of crystal nucleation, thereby hindering the binding of Ca2+ and CO32−. This competitive adsorption reduces the opportunities for Ca2+ and CO32− to combine, delaying the nucleation process. In other words, Mg2+ occupies the growth sites of the crystal, slowing the nucleation rate of CaCO3 and requiring a longer time to reach the supersaturation level necessary for crystal formation. If the scaling process tends to favor the formation of aragonite, the scaling rate will be relatively slow, and the scale layer will be more loosely bound, making it easier to be carried away by the fluid. On the other hand, calcite forms more solid deposits during the scaling process, leading to a faster scaling rate and harder-to-remove deposits. In geothermal systems, if aragonite or other metastable phases dominate, the scaling issue may be less severe, as these softer scales are carried away with the fluid flow.
However, if calcite becomes the dominant crystalline phase, the scaling rate will significantly increase, potentially leading to system blockages and a decline in efficiency.
However, in the 80 °C simulated geothermal water environment, the inhibitory effect of Mg2+ on CaCO3 formation is not as pronounced as in seawater or high-salinity wastewater. When the Mg2+ concentration increased from 5 mg/L to 50 mg/L, despite a 10-fold increase in concentration, the scale deposition decreased by only about 13.93%. This phenomenon may be attributed to the inverse solubility of CaCO3 (its solubility decreases with increasing temperature). At high temperatures, the inverse solubility of CaCO3 promotes its rapid precipitation, reducing the reliance on an extended induction period. Under such conditions, the interference effect of Mg2+ may be diminished due to the accelerated precipitation process. In contrast, in seawater (at lower temperatures), the higher solubility and slower nucleation rate provide Mg2+ with more time and opportunities to adsorb and interfere with the crystal growth of CaCO3.

4.2. Effect of Anions on Scale Deposition

4.2.1. Effect of HCO3 on Scale Deposition

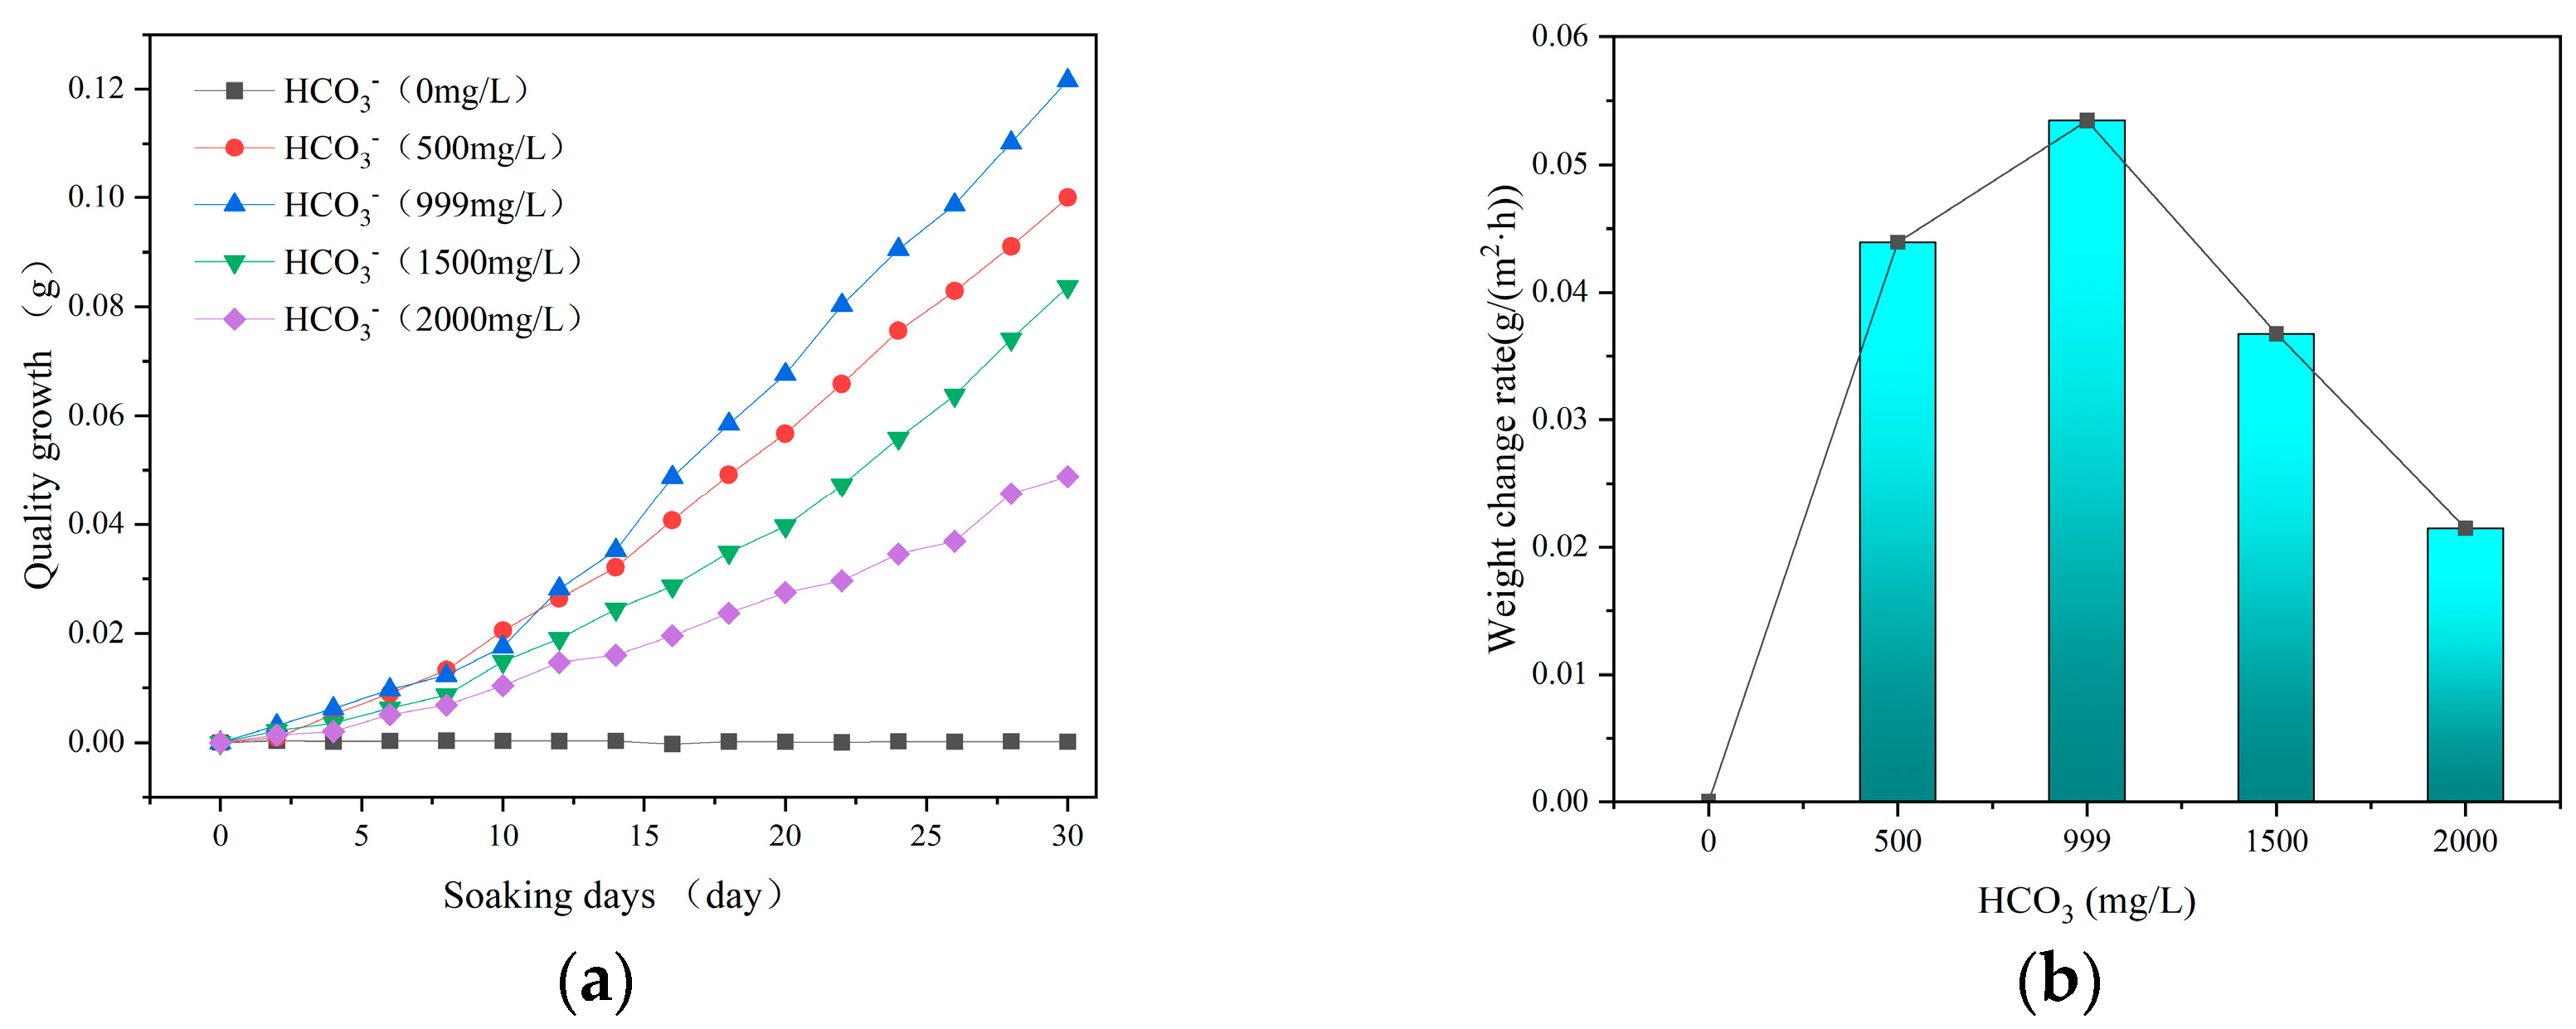
The weight-increase trend and scaling rate of the HCO3 concentration gradient control group samples after 30 days of immersion in simulated geothermal water at 80 °C are shown in Figure 15. The experimental results indicate that HCO3 concentration is closely correlated with the scaling process. When HCO3 was completely removed, little to no scaling occurred, a result consistent with the behavior observed when Ca2+ was entirely removed. Using the baseline water sample as a reference, the scaling rate at an HCO3 concentration of 999 mg/L was 0.053 g/(m2·h). When the HCO3 concentration decreased by 49.95% to 500 mg/L, the scaling rate dropped to 0.044 g/(m2·h), representing a reduction of 16.98%. When the HCO3 concentration increased by 50.15% to 1500 mg/L, the scaling rate further decreased to 0.037 g/(m2·h), a reduction of 30.19%. With a further increase in HCO3 concentration of 100.2% to 2000 mg/L, the scaling rate dropped to 0.021 g/(m2·h), a 60.38% reduction compared to the baseline sample.
The variation in HCO3 concentration exhibited a pronounced nonlinear effect on the scaling rate. Between 500 mg/L and 999 mg/L, the scaling rate slightly increased with concentration. However, as the HCO3 concentration increased to 1500 mg/L, the scaling rate showed a significant downward trend, with the reduction becoming more pronounced as the concentration further increased. This trend suggests that HCO3 promotes the scaling process within a moderate concentration range, while its inhibitory effect gradually becomes apparent at higher concentrations. The inflection point observed in this experiment occurred at an HCO3 concentration of approximately 1000 mg/L. This may be related to the alteration of carbonate equilibrium in the solution at high HCO3 concentrations, which inhibits CaCO3 scaling behavior.
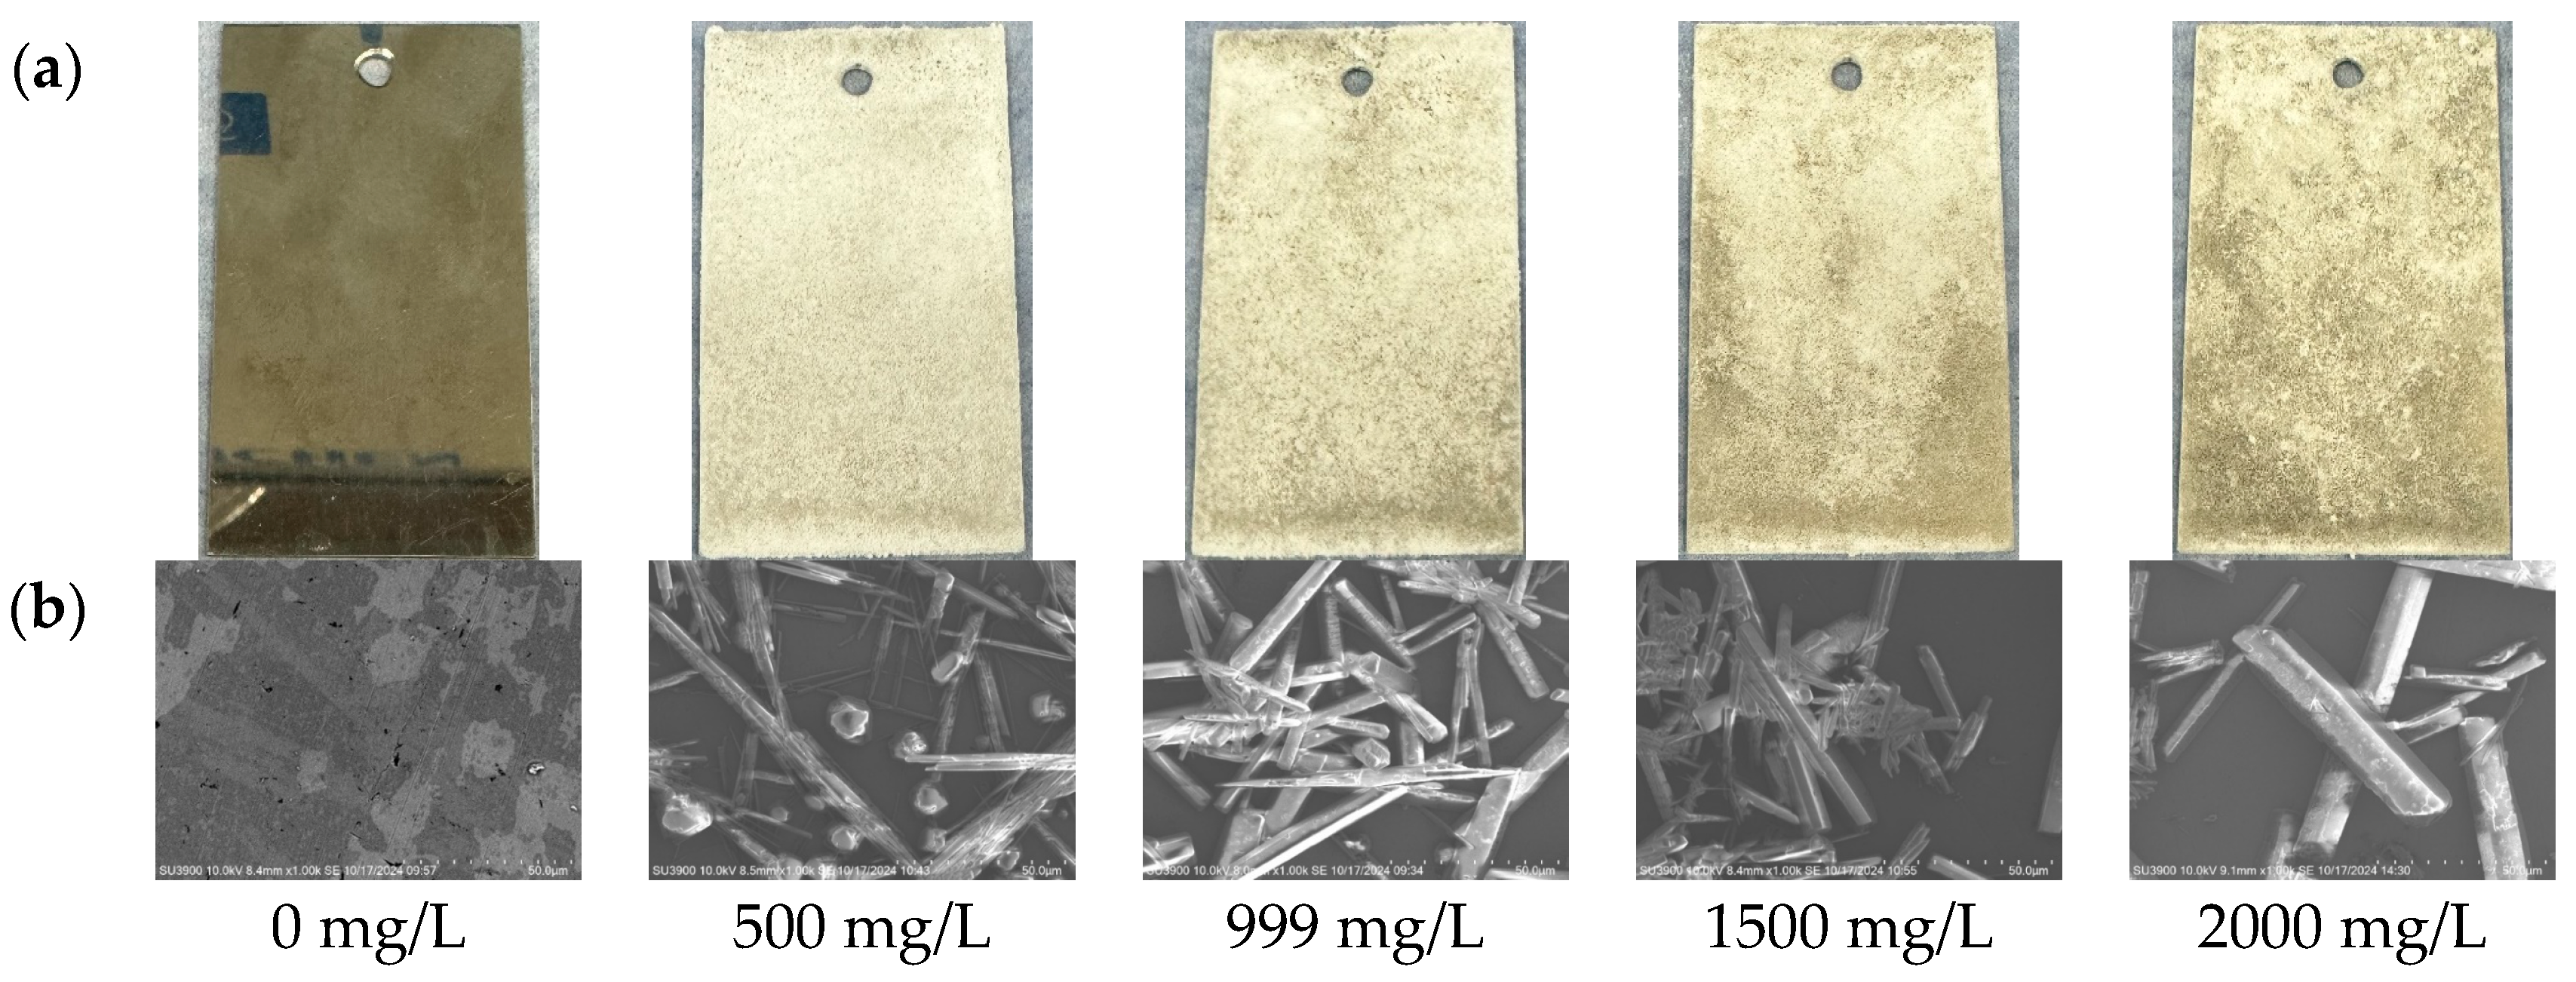
The scale deposits in the simulated geothermal water, as shown in Figure 16, appear as white, powdery substances. Differences in the amount of scale deposition are primarily reflected in the extent of surface coverage on the samples. When the HCO3 concentration was 0 mg/L, no significant scale deposits were observed on the sample surface. Compared to before immersion, only a small amount of water staining was visible, with no obvious signs of corrosion. As the HCO3 concentration increased, more white, granular scale deposits gradually accumulated on the sample surface. Within the HCO3 concentration range of 0 mg/L to 999 mg/L, the amount of scale increased with rising HCO3 concentration. At 999 mg/L, the sample surface was almost completely covered by the scale layer. However, further increases in HCO3 concentration resulted in a gradual decrease in scale deposition. At higher concentrations, the scale layer visibly thinned, with uneven thickness distribution observed. Despite the variations in scale deposition, the morphology of the scale deposits consistently remained white and granular, showing no significant changes with increasing HCO3 concentration. SEM images revealed that at 0 mg/L HCO3 concentration, only the surface of the sample was visible. In contrast, for other concentration groups, the scale material primarily appeared as needle-like or columnar aggregates, with a small number of rhombohedral structures.
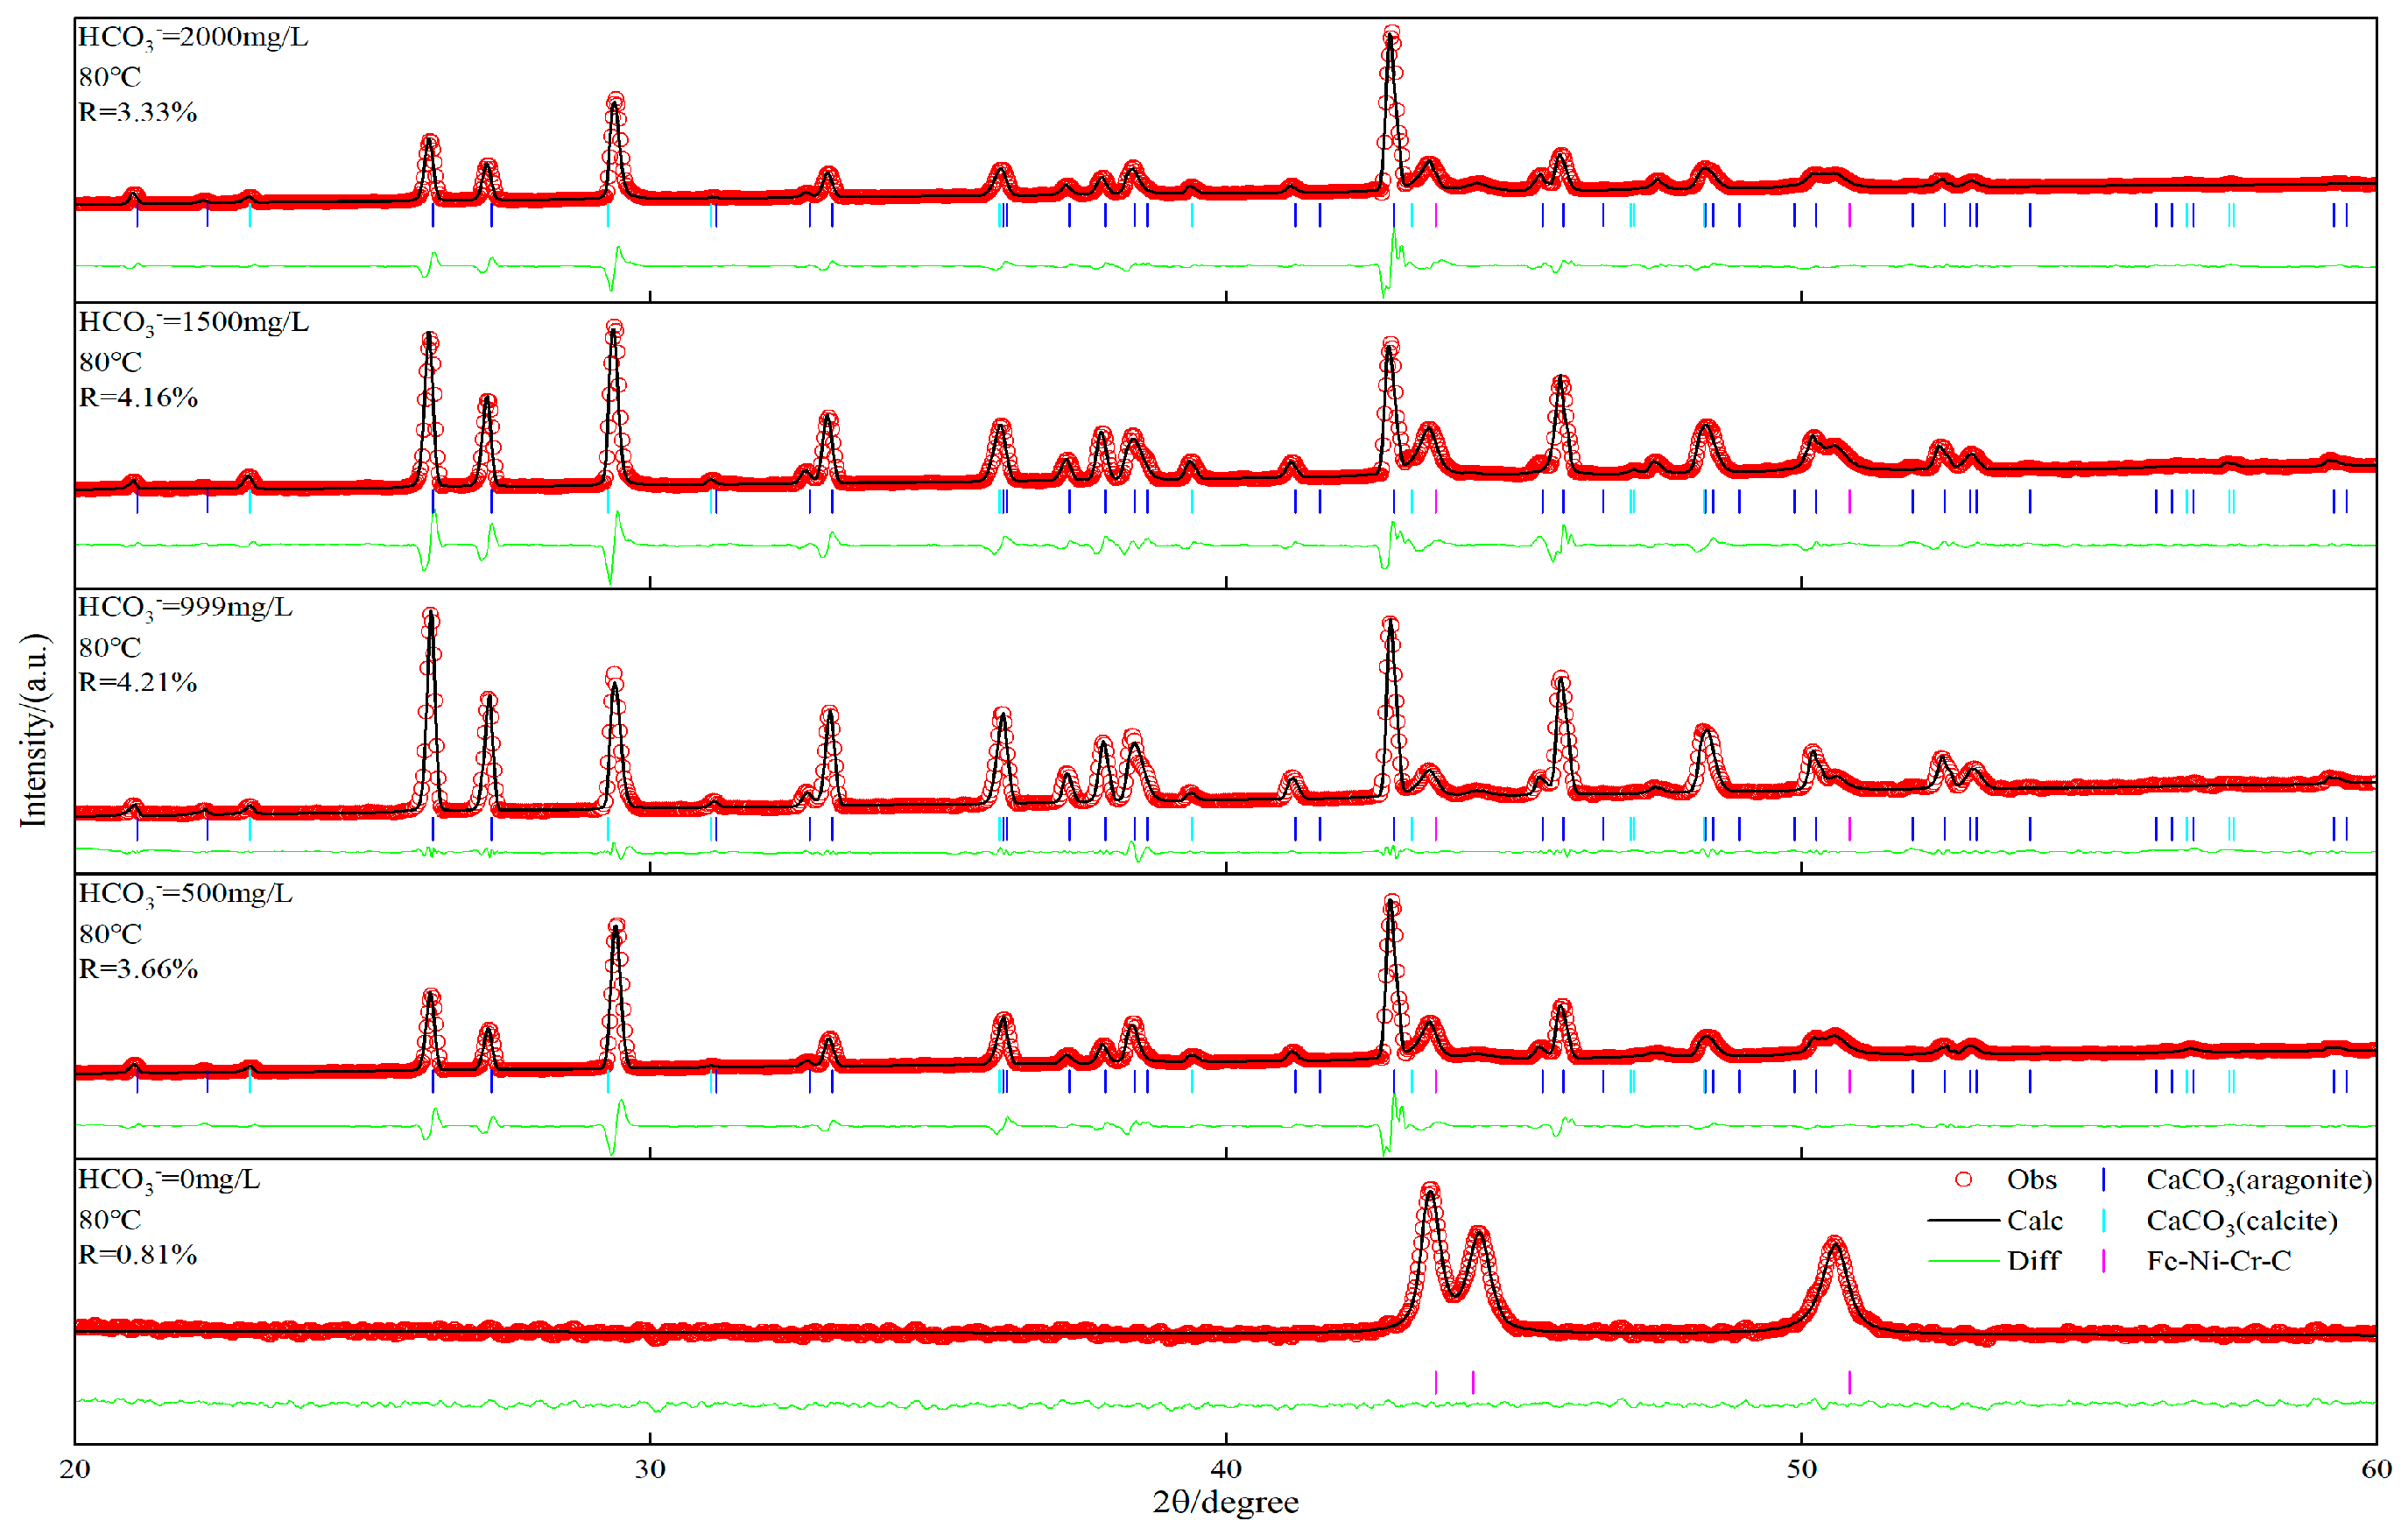
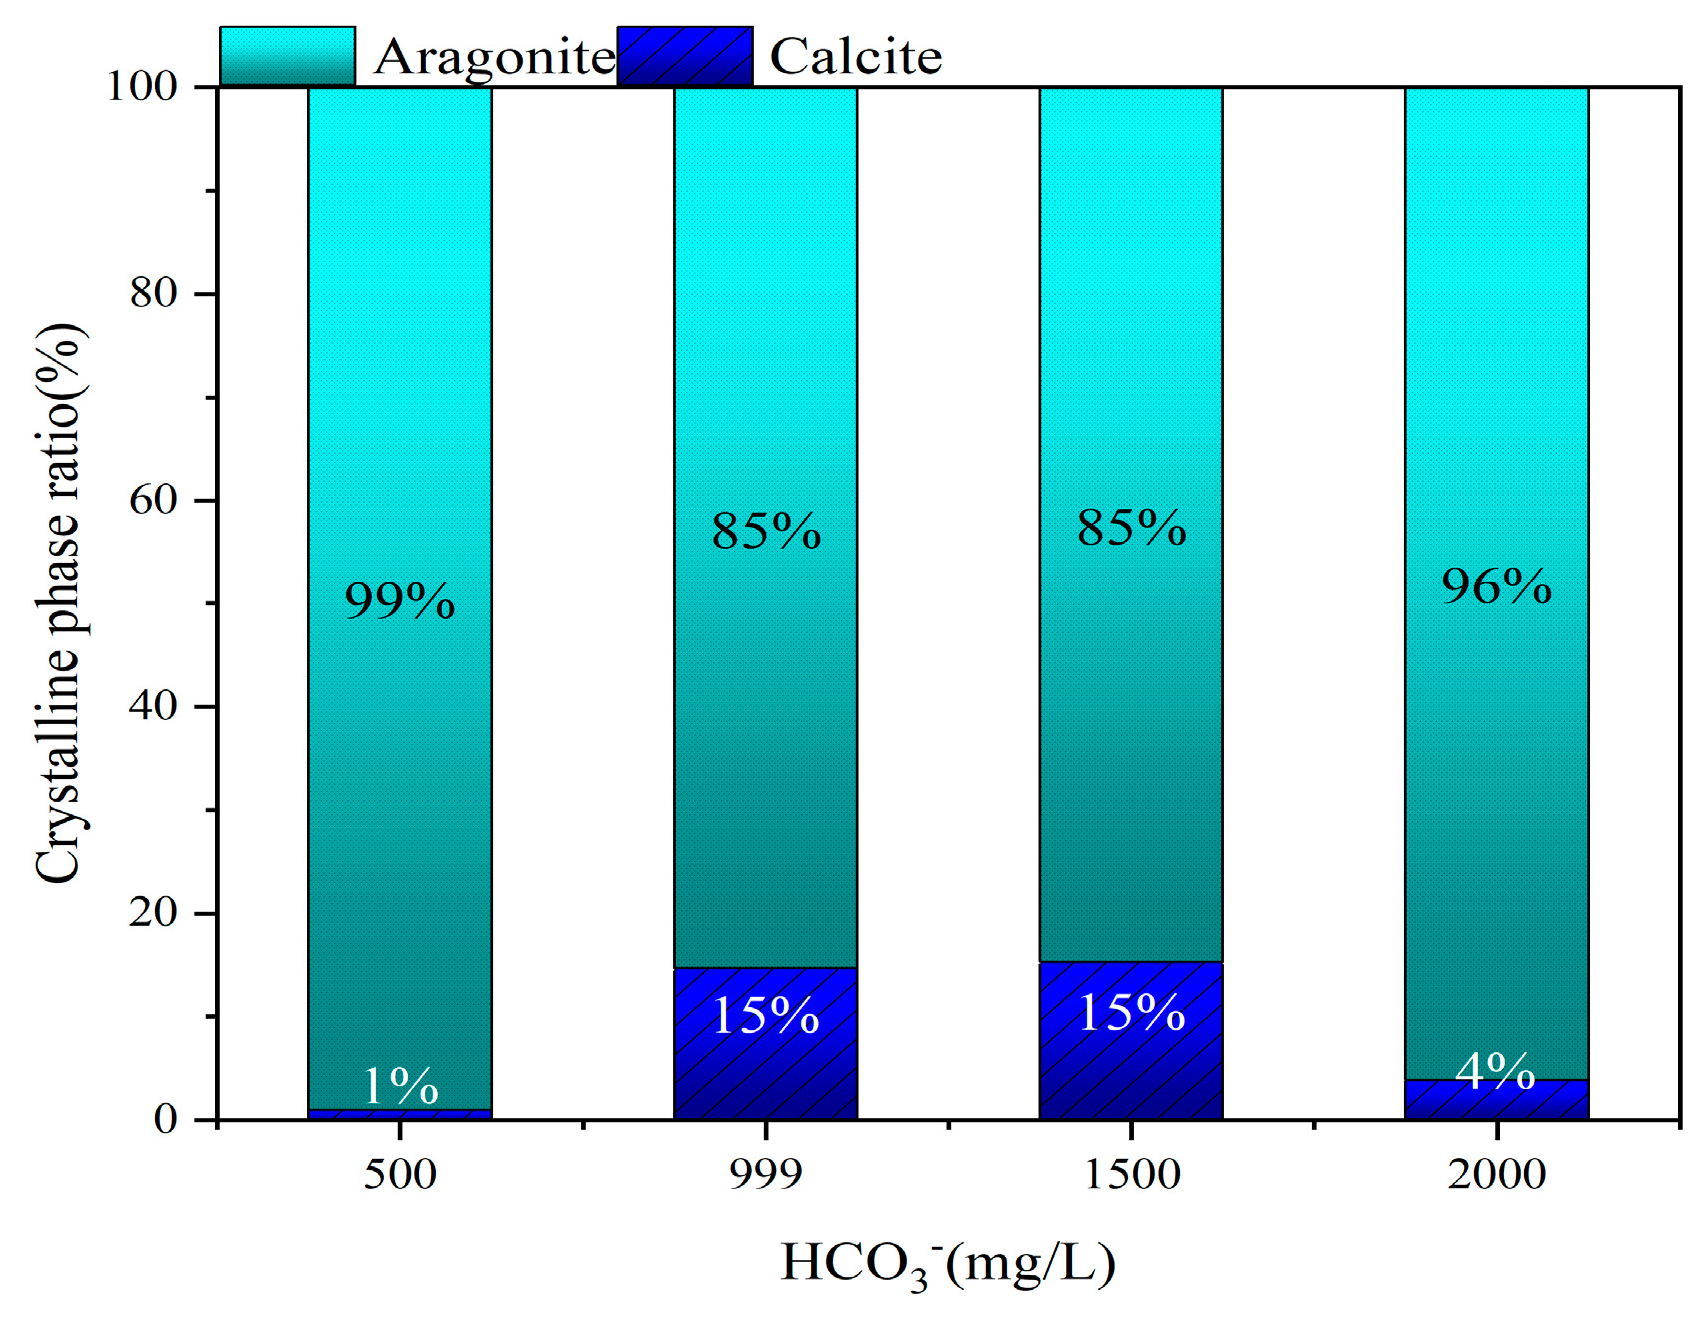
The XRD analysis of the samples, shown in Figure 17, confirmed that the primary component of the scale deposits on the sample surface is CaCO3. Among the CaCO3 crystals, the needle-like or columnar crystals were predominantly aragonite. A quantitative calculation of the crystal phase ratio of aragonite to calcite, as shown in Figure 18, revealed that aragonite consistently dominated the scale deposits, accounting for more than 85% of the total. The crystal phase ratio did not exhibit a discernible pattern of variation with changes in HCO3 concentration, with aragonite remaining the dominant phase, with its proportion ranging from 85% to 99%.
The results indicate that the concentration of HCO3 has a significant impact on scale deposition, but its influence on the crystalline phase distribution of the main scaling substance, CaCO3, is relatively limited. Experimental data show that when the concentration of HCO3 exceeds approximately 1000 mg/L, it exhibits a noticeable inhibitory effect on the formation of CaCO3. At this point, the mass concentration ratio of HCO3 to Ca2+ in the water is about 7:1. A similar phenomenon was observed in the study by Song et al. [28]. Song et al. experimentally compared the corrosion and scaling tendencies of seven different geothermal water samples. Based on Song’s experimental data, I further performed a ranking analysis of scaling amounts according to the mass concentration ratio of HCO3 to Ca2+ and found that the scaling amount similarly shows a trend of increasing first and then decreasing as the mass concentration ratio of Ca2+ to HCO3 increases. In Song’s experimental results, the inflection point appeared when the HCO3 concentration reached 2560 mg/L, at which point the mass concentration ratio of Ca2+ to HCO3 was 102:1. However, the significant difference in the inflection points between the two experiments suggests that the turning point of the scaling trend may be influenced not only by the concentration of HCO3 or the mass concentration ratio of HCO3 to Ca2+, but also by being closely related to environmental factors such as temperature or the concentrations of other ion components. This phenomenon warrants further investigation and discussion.
The inhibitory effect of HCO3 on scaling may be closely related to its buffering capacity. The main scaling substance is CaCO3, which forms through a series of reactions between Ca2+ and HCO3, as shown in the following reactions [34]:
H C O 3 O H + C O 2 ,
O H + H C O 3 C O 3 2 + H 2 O ,
C a 2 + + C O 3 2 C a C O 3 ,
The overall reaction is as follows:
C a 2 + + 2 H C O 3 C a C O 3 + C O 2 + H 2 O ,
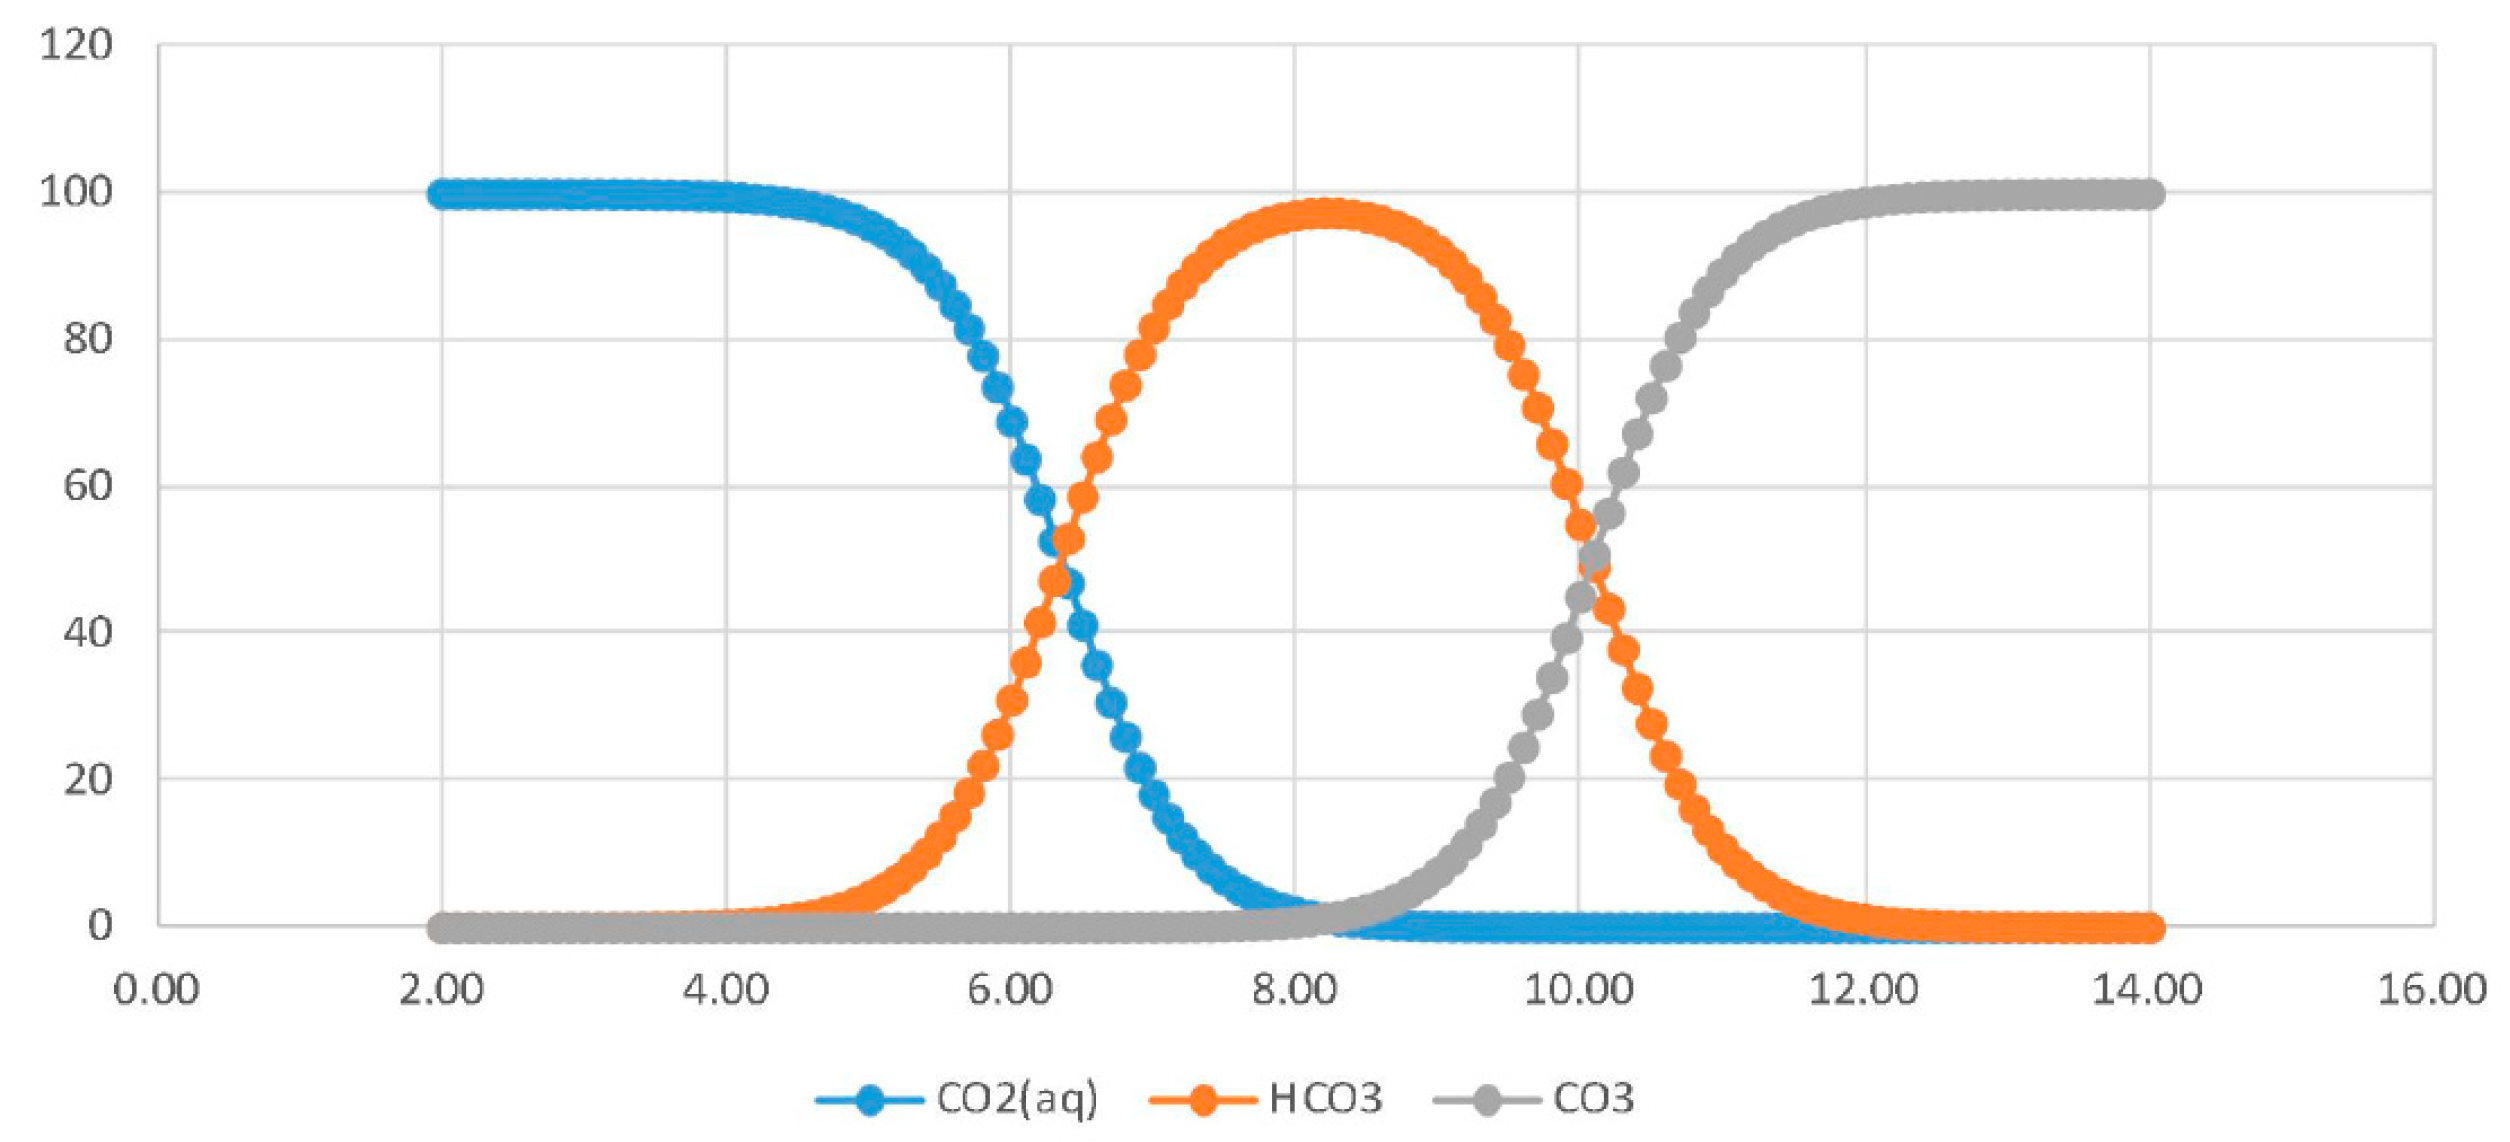
Carbon-containing ions in water primarily exist as CO2 (aq), HCO3, and CO32−. However, the proportion of these species changes with pH, as shown in Figure 19. The addition of HCO3 to the water shifts the pH toward alkaline conditions. Under alkaline conditions, the carbon species transition from HCO3 to CO32−. CO32− then reacts with Ca2+ to form CaCO3. However, HCO3 has a strong pH-buffering capacity and can combine with H+ and OH, undergoing the following reactions to adjust the pH of the water:
H C O 3 + H + H 2 C O 3 ,
O H + H C O 3 C O 3 2 + H 2 O
When HCO3 is present in excess, the solution’s pH remains neutral, and the carbon ions tend to stay in the HCO3 form. This reduces the interaction between Ca2+ and CO32− and inhibits the formation of CaCO3.

4.2.2. Effect of SO42− on Scale Deposition

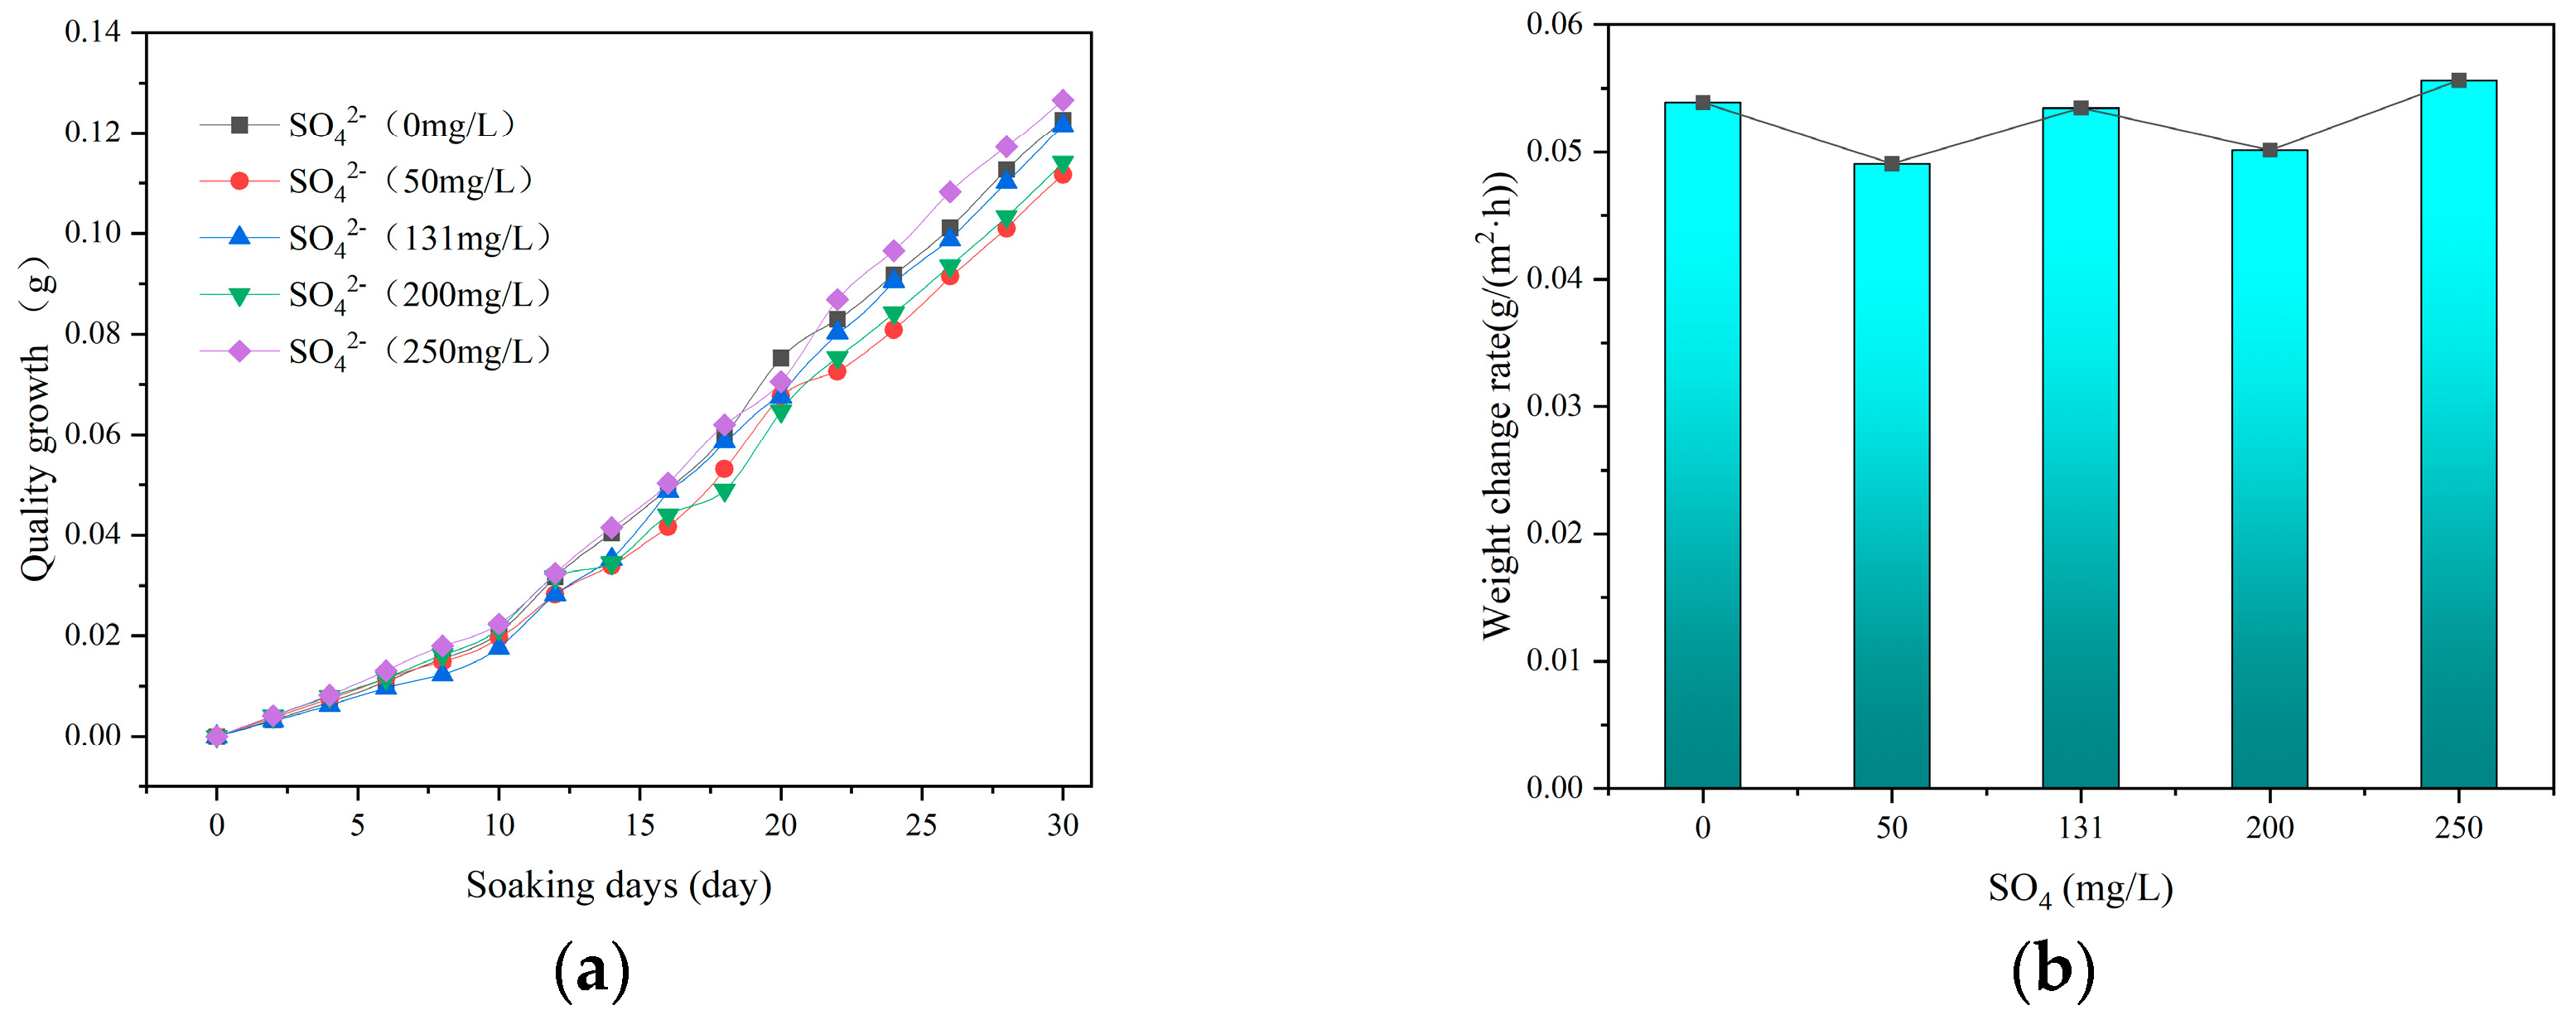
The weight-increase trend and scale deposition rate of the SO42− concentration gradient control group samples after 30 days of immersion in simulated geothermal water at 80 °C are shown in Figure 20. The experimental results indicate that the effect of SO42− concentration on scaling behavior is relatively limited. Using the baseline water sample as a reference, when the SO42− concentration was 131 mg/L, the scaling rate was 0.053 g/(m2·h). When the SO42− concentration decreased by 61.83% to 50 mg/L, the scaling rate dropped to 0.049 g/(m2·h), representing a reduction of 7.55%. When SO42− was completely removed, the scaling rate slightly increased to 0.054 g/(m2·h), an increase of 1.89%. When the SO42− concentration increased by 52.67% to 200 mg/L, the scaling rate decreased to 0.05 g/(m2·h), a reduction of 5.66%. When the SO42− concentration further increased by 90.84% to 250 mg/L, the scaling rate rose to 0.056 g/(m2·h), reflecting an increase of 5.66% compared to the baseline sample.
According to Figure 21, the scale deposits in the simulated geothermal water appeared as white, powdery substances. The scale morphology and coverage on the sample surfaces of different concentration gradient control groups were similar, with the thickness distribution of the scale layer showing slight unevenness. Overall, changes in SO42− concentration did not result in significant or systematic differences in the amount or morphology of scale deposition. SEM images revealed that the scale deposits in all SO42− concentration gradient control groups predominantly consisted of needle-like or columnar aggregates, accompanied by a small number of rhombohedral structures.
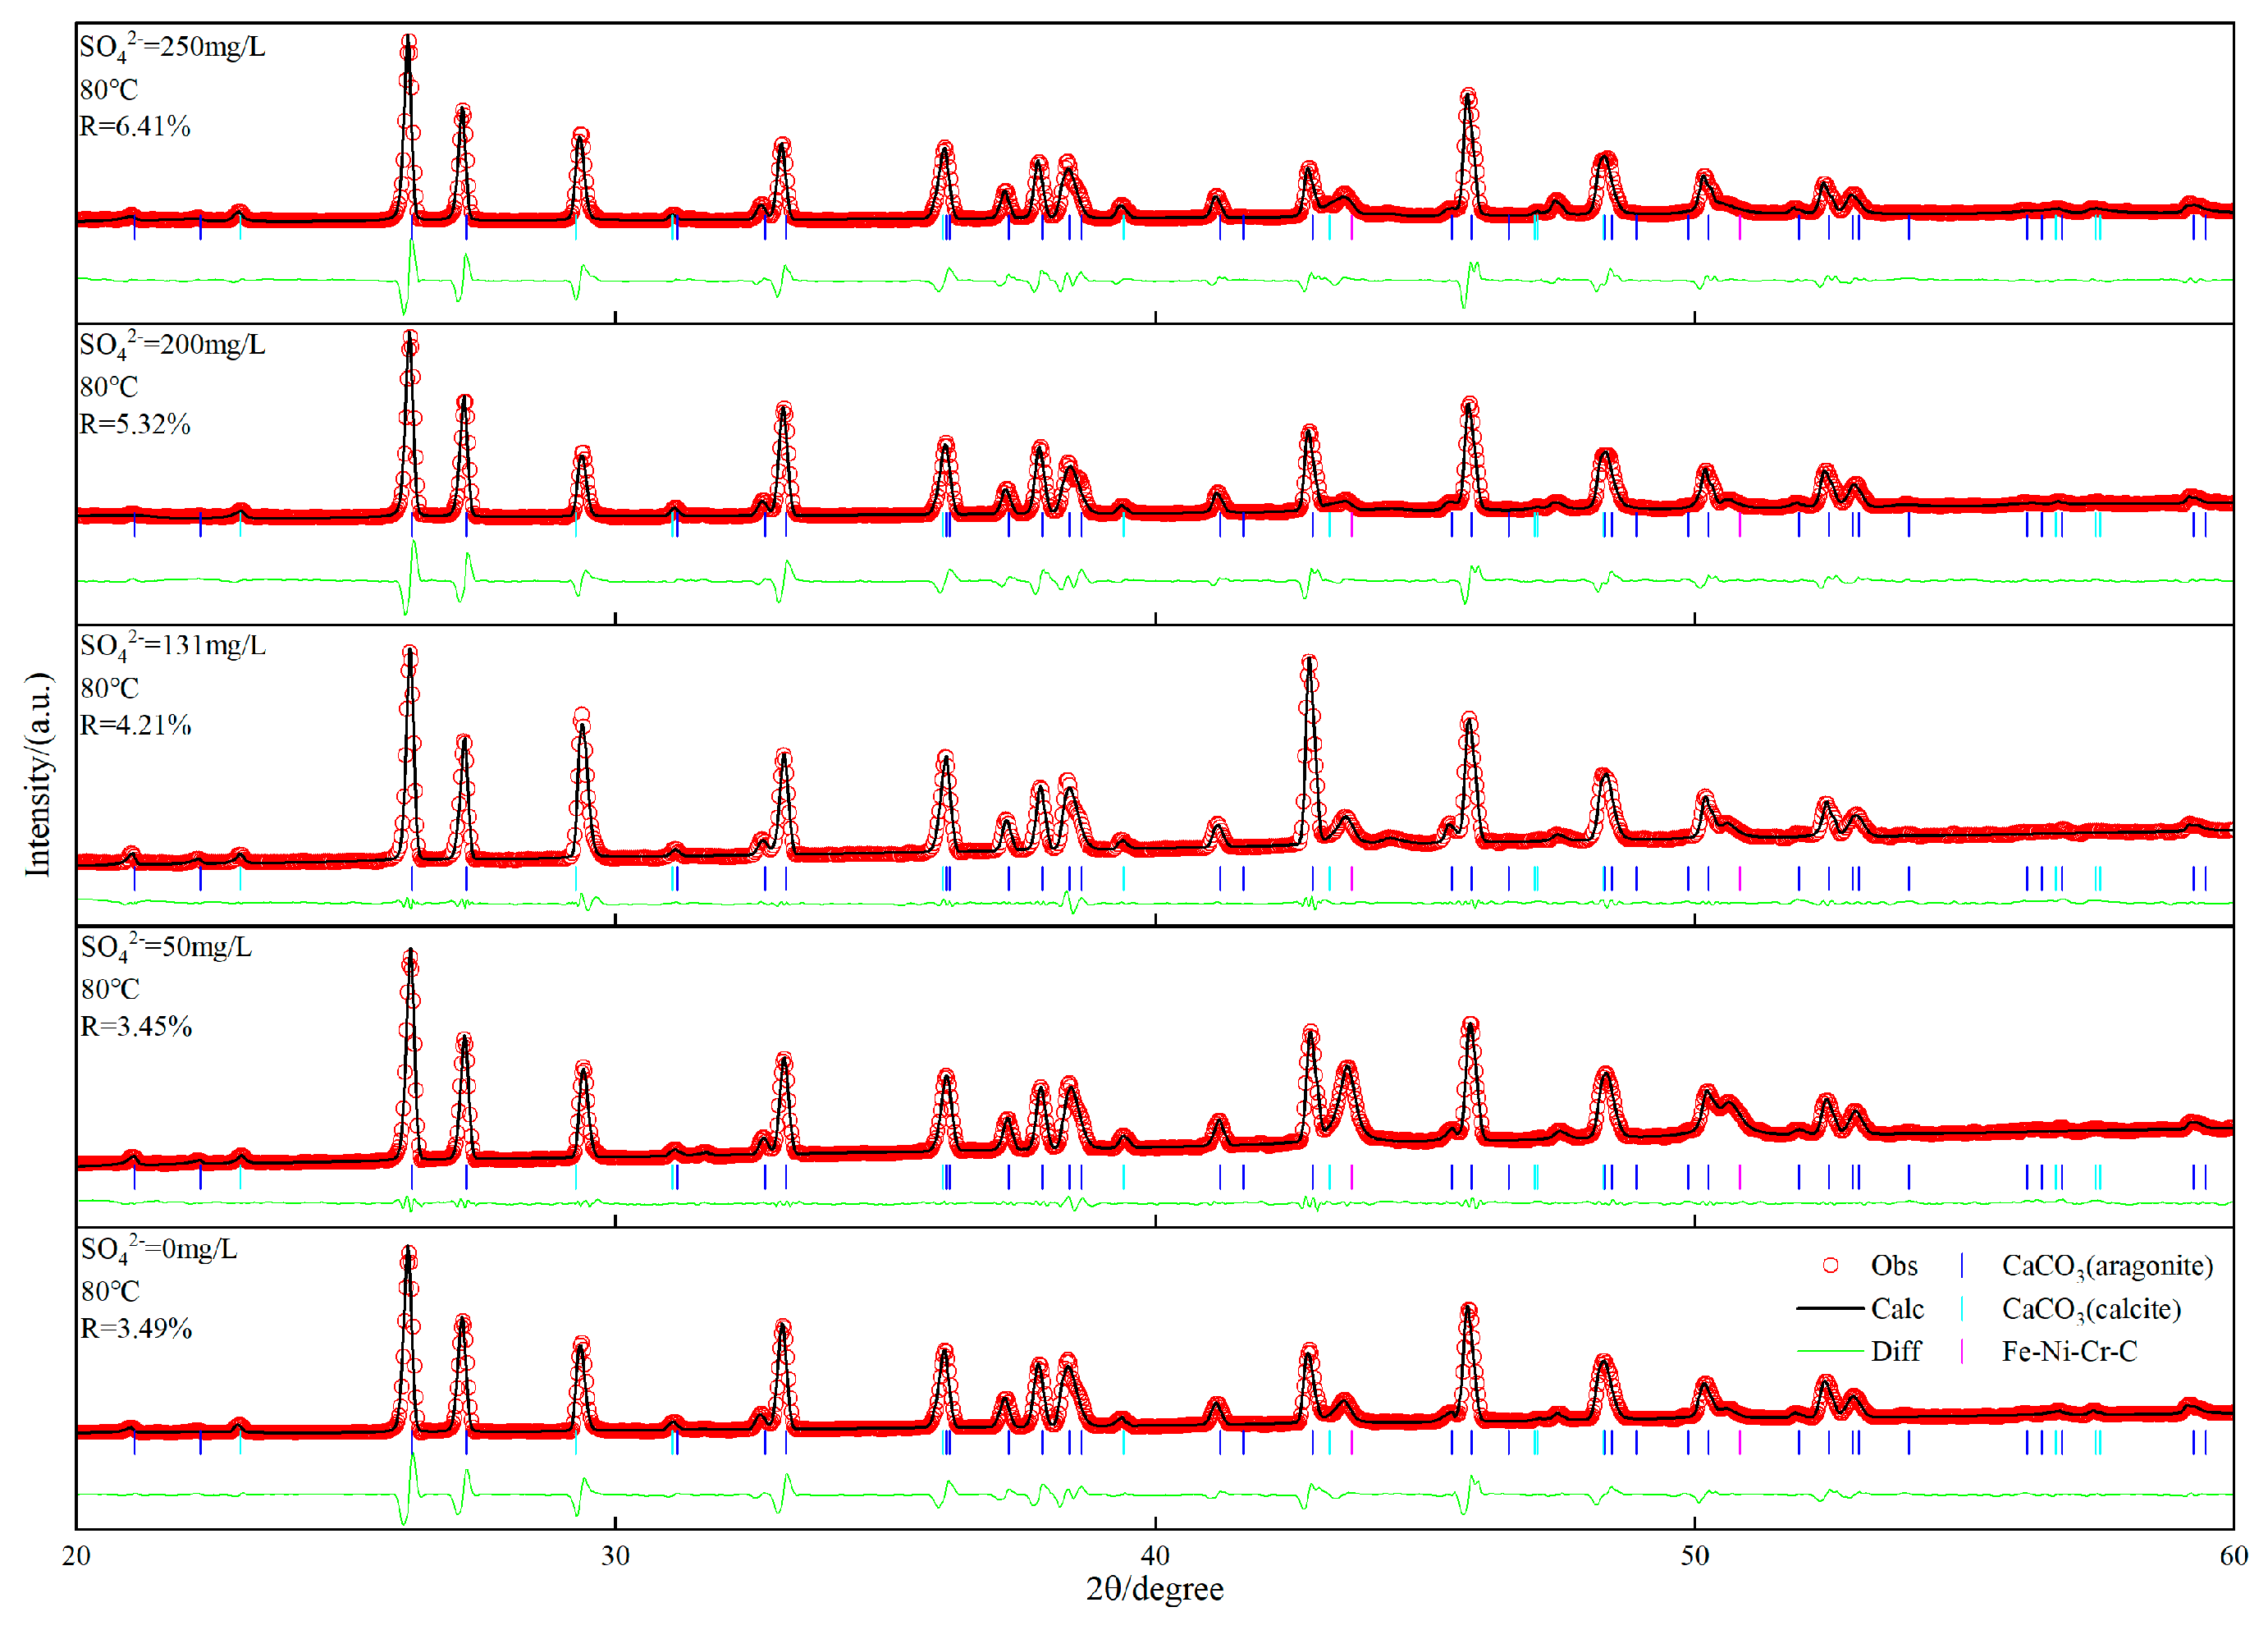
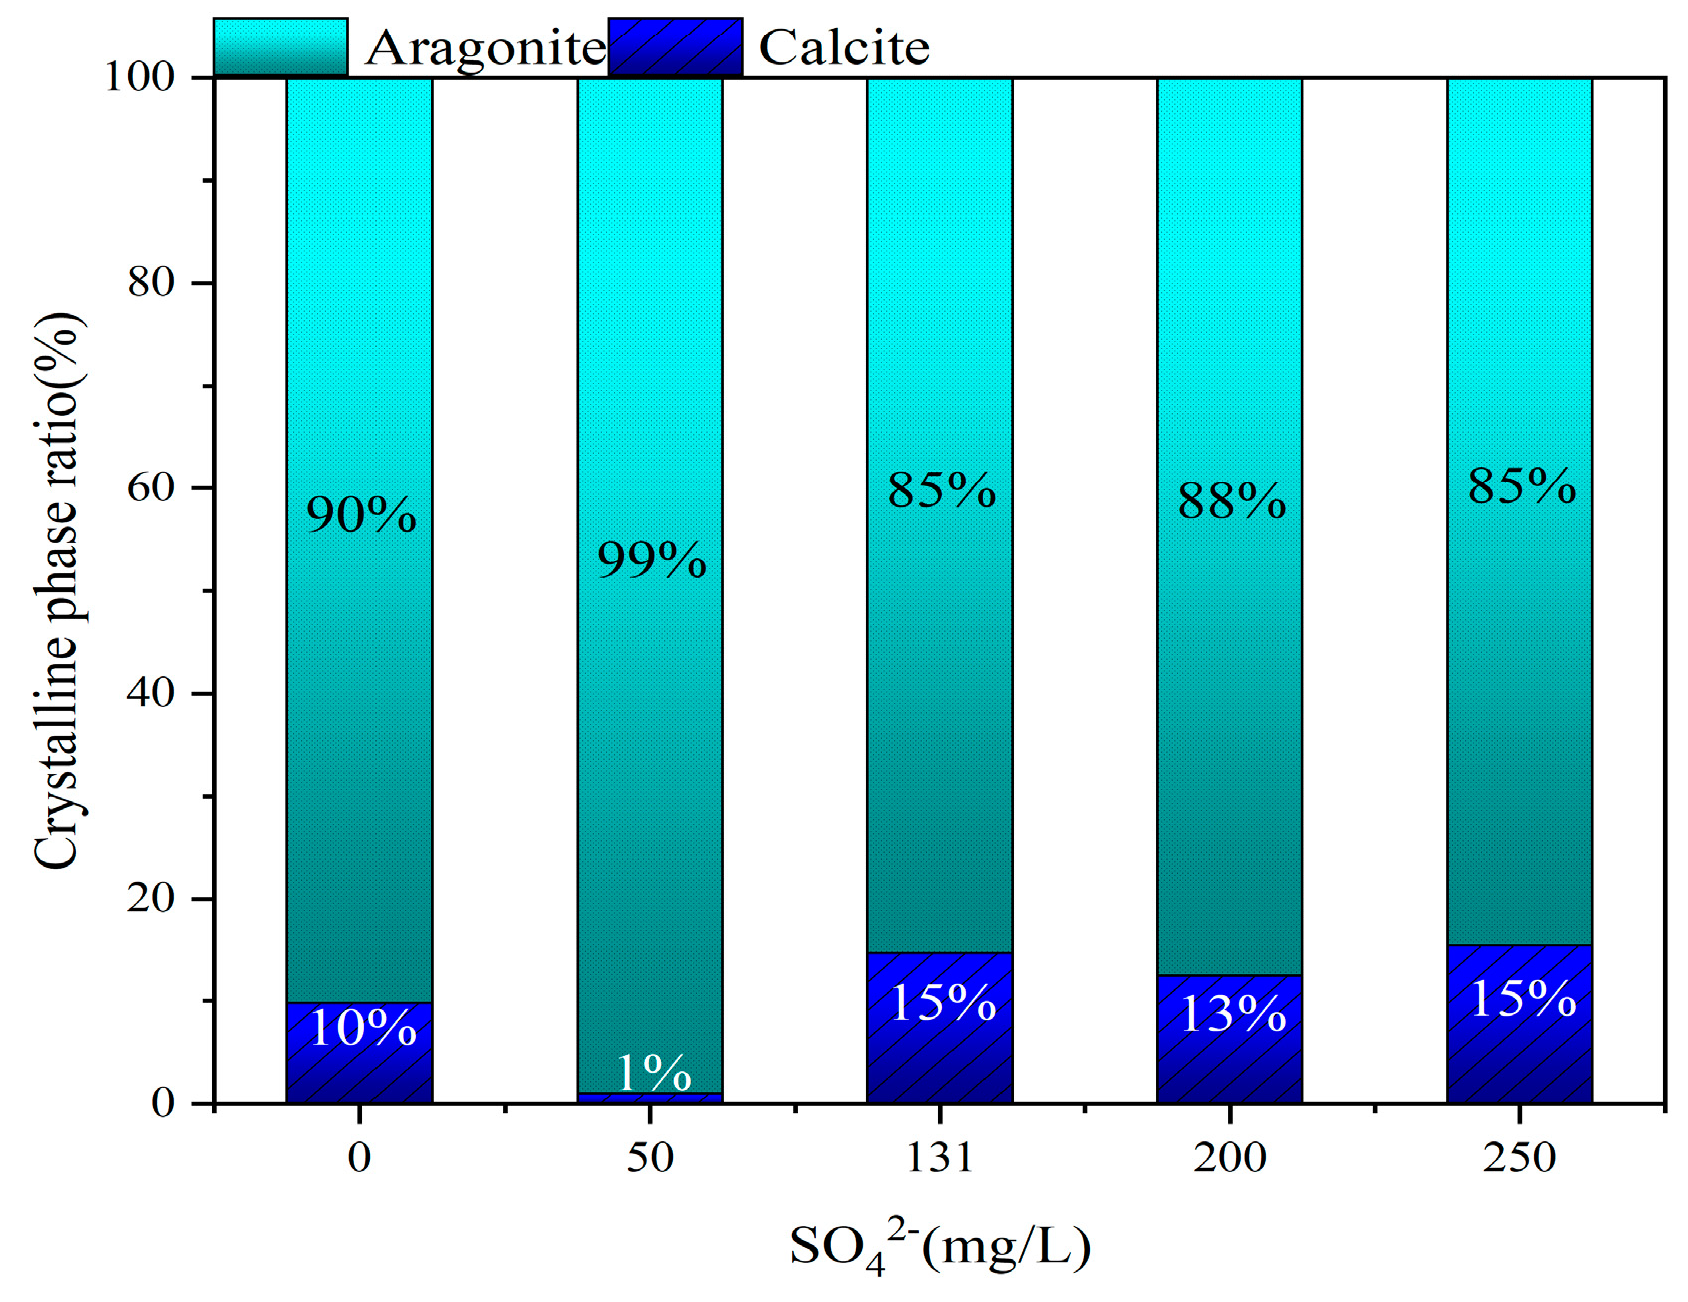
To further investigate the effect of SO42− concentration on scaling behavior in simulated geothermal water, XRD analysis was performed on the samples, and the results are shown in Figure 22. The analysis indicated that the main component of the scale on the sample surface was CaCO3, with no evidence of sulfate or corrosion products. The needle-like or columnar crystals were identified as aragonite, while the rhombohedral crystals were identified as calcite. A simple quantitative analysis was conducted to calculate the crystal phase ratio of aragonite to calcite, and the results are shown in Figure 23. Aragonite was the dominant phase (>85%). Despite variations in SO42− concentration, the crystal phase ratio did not exhibit any significant regular trends, with aragonite consistently remaining the dominant phase, ranging from 85% to 99%.
Overall, although variations in SO42− concentration caused some fluctuations in the scaling rate, no clear or systematic trend was observed. This suggests that under the conditions of this experiment, the role of SO42− in the scaling process is relatively weak, with minimal influence on both the scaling rate and the amount of scale deposition. Furthermore, changes in SO42− concentration did not affect the scaling substances. These findings indicate that, under the experimental conditions, SO42− has no significant effect on the scaling process in the simulated geothermal water environment.

4.2.3. Effect of SiO32− on Scale Deposition

The weight-increase trend and scaling rate of the SiO32− concentration gradient control group samples after 30 days of immersion in simulated geothermal water at 80 °C are shown in Figure 24. The experimental results indicate that the increase in SiO32− concentration significantly affects both the scaling amount and scaling rate. When SiO32− was not added to the baseline water sample, the scaling rate was 0.053 g/(m2·h). As the SiO32− concentration increased to 50 mg/L, the scaling rate decreased to 0.028 g/(m2·h), representing a reduction of 46.82% compared to the baseline water sample. Further increasing the SiO32− concentration to 91.1 mg/L resulted in a scaling rate of 0.018 g/(m2·h), a decrease of 35.71%. When the SiO32− concentration was increased to 200 mg/L, the scaling rate further dropped to 0.006 g/(m2·h), a reduction of 78.57% compared to the baseline water sample.
The results clearly demonstrate that SiO32− concentration has a significant inhibitory effect on scaling behavior. As the SiO32− concentration increases, both the scaling amount and scaling rate decrease markedly, with the inhibitory effect of SiO32− becoming more pronounced at higher concentrations.
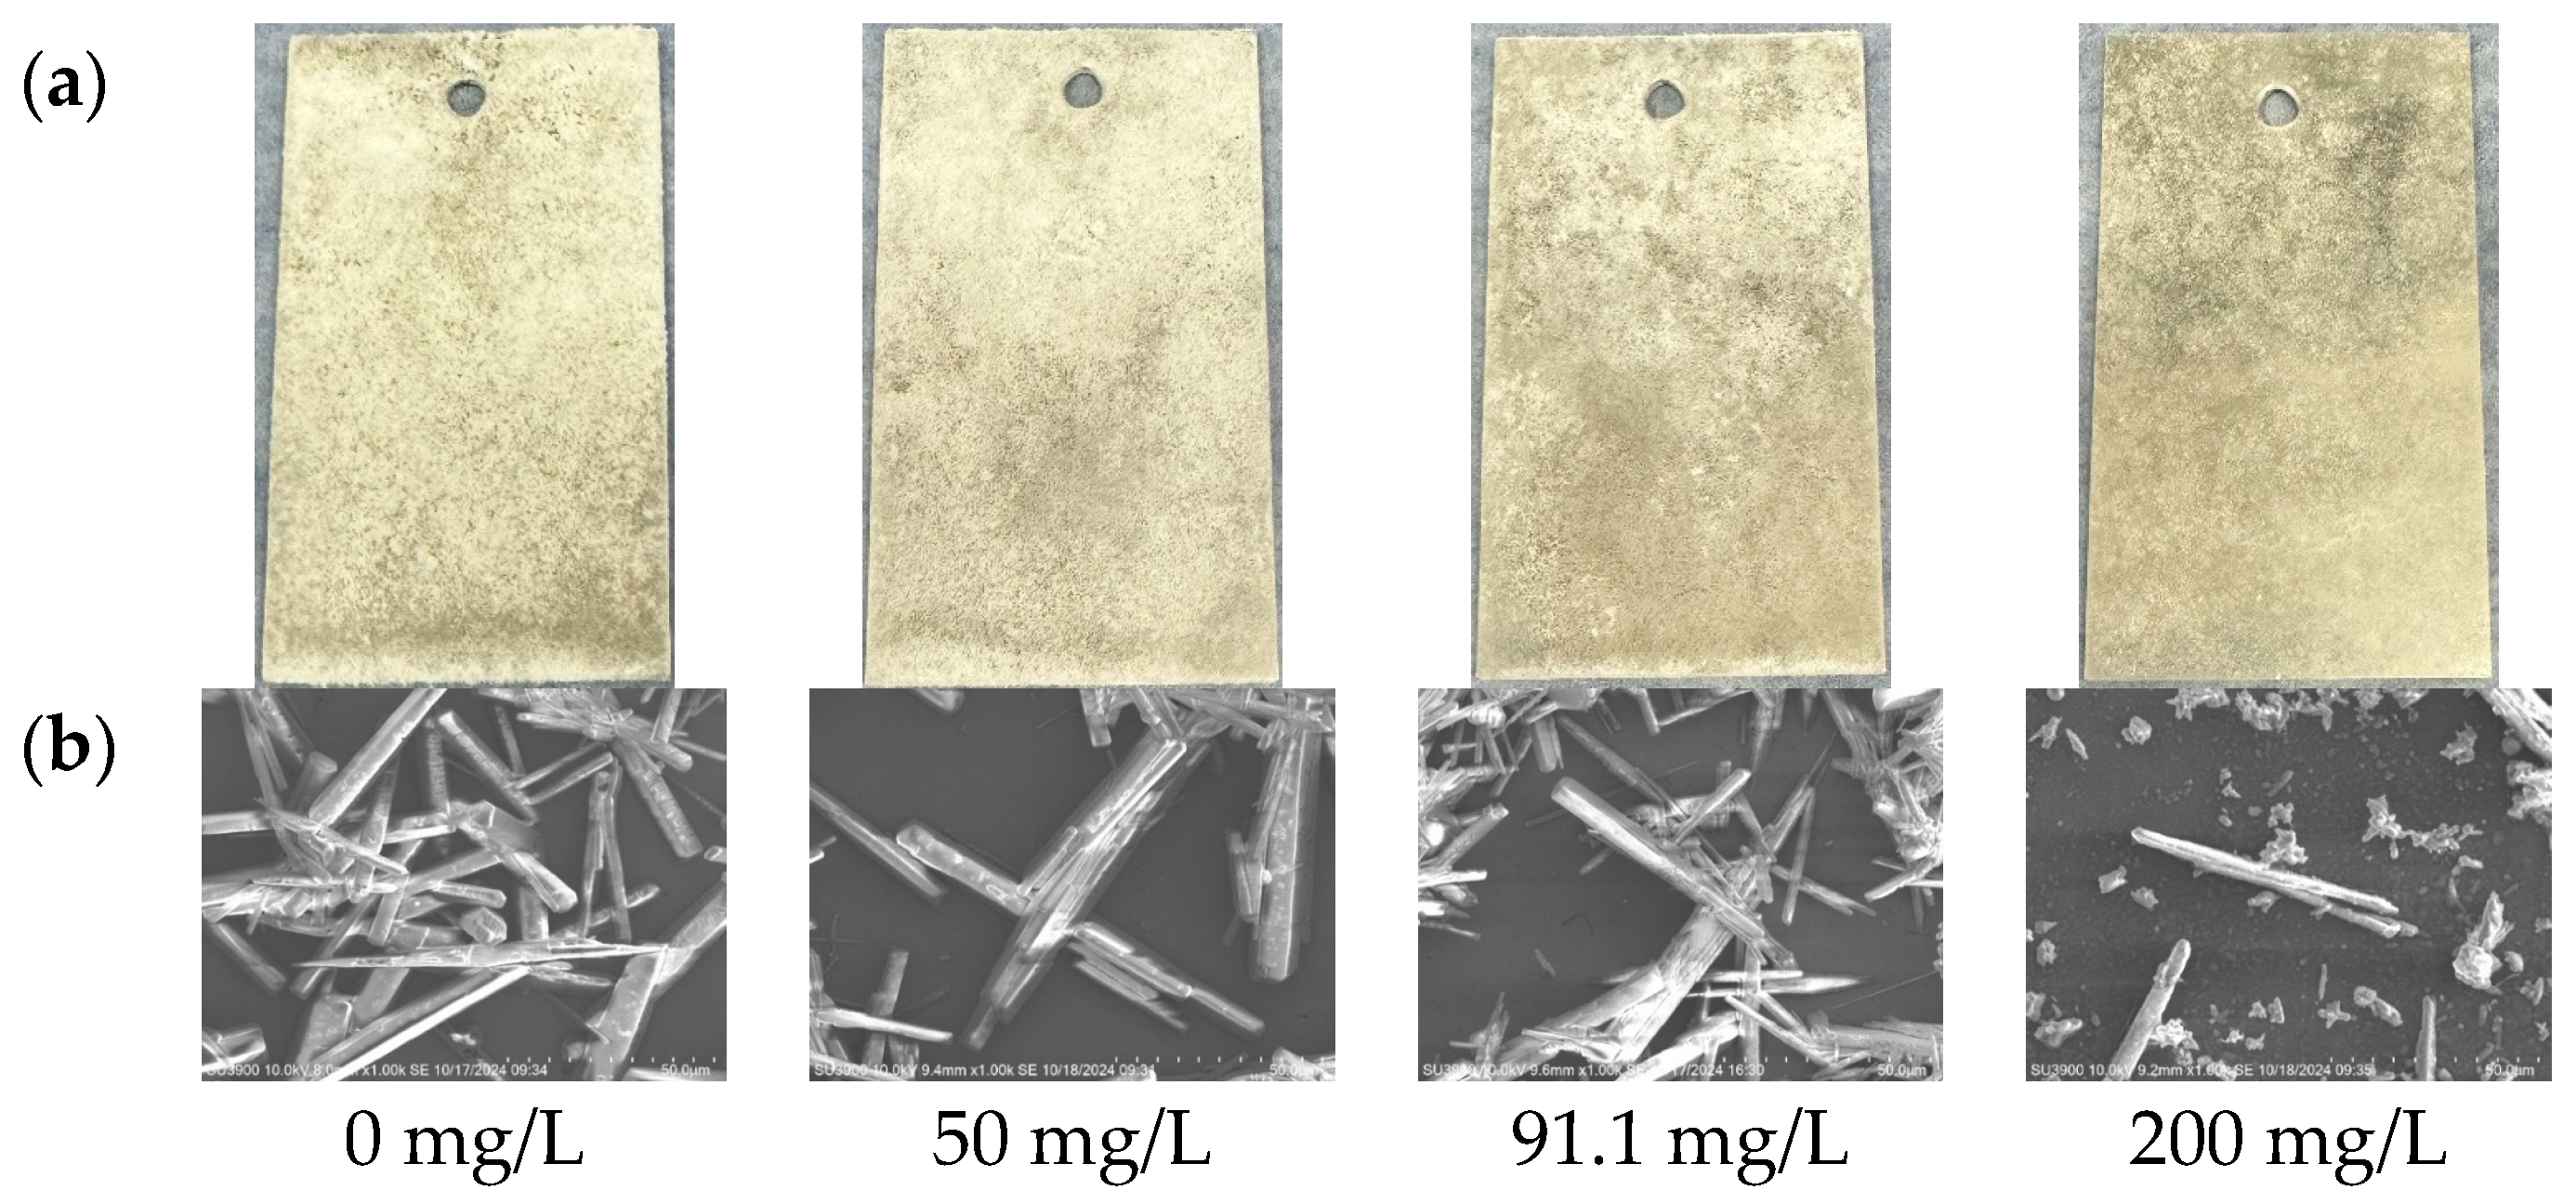
According to Figure 25, the scale deposits in the simulated geothermal water primarily appear as white, powdery substances. As the SiO32− concentration increases, the scale deposition on the sample surface gradually decreases, and the scale layer becomes thinner. When the SiO32− concentration reaches 200 mg/L, no obvious granular scale deposits are observed on the sample surface; instead, a white, thin-film-like scale layer is visible. SEM images show that at SiO32− concentrations of 0, 50, and 91.1 mg/L, the scale deposits mainly appear as needle-like or columnar aggregates, accompanied by a small amount of rhombohedral structures. When the SiO32− concentration increases to 200 mg/L, the scale deposits are observed as irregular particles, along with a small amount of needle-like or columnar structures. Additionally, a uniformly covered thin layer is observed on the sample surface beneath the scale deposits.
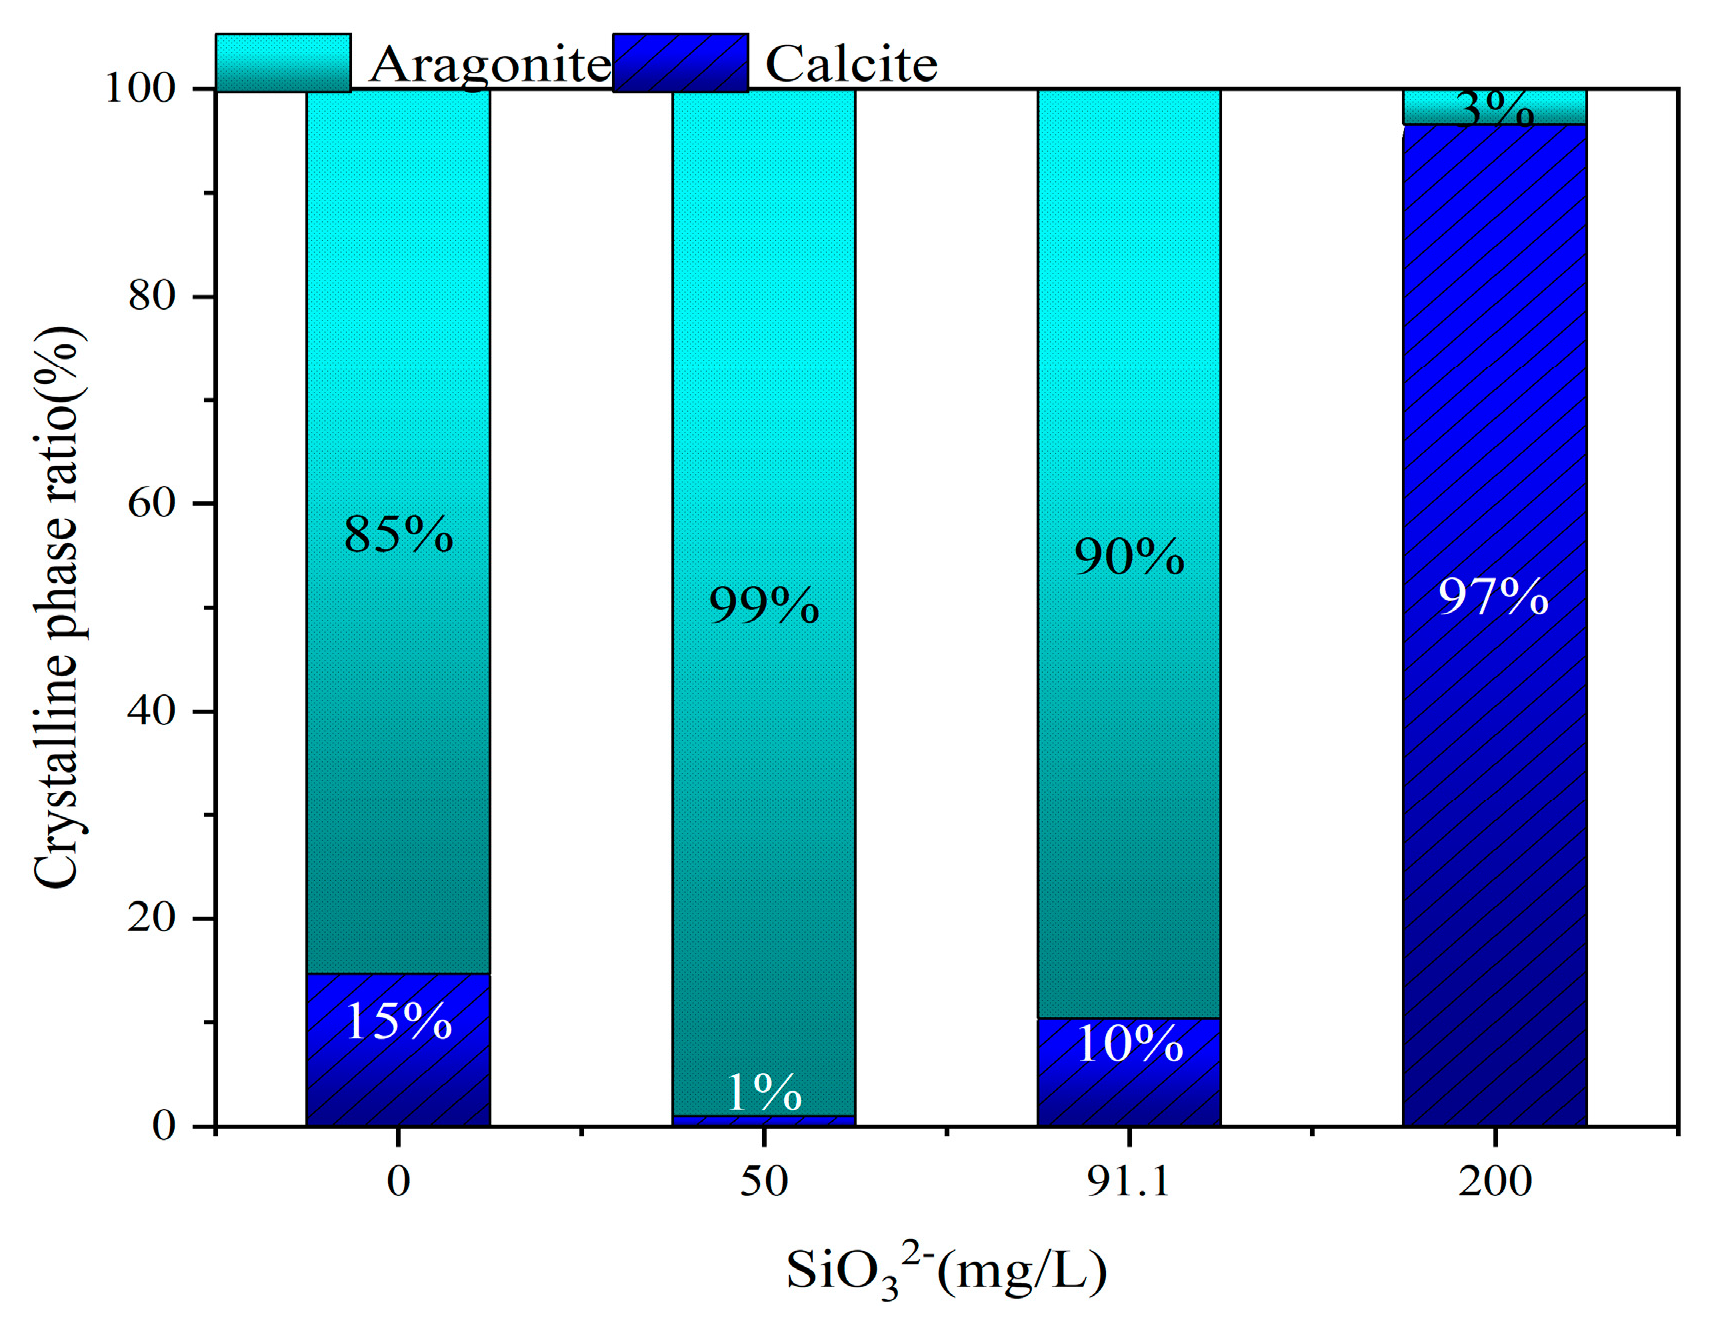
According to the XRD analysis results in Figure 26, the main component of the scale on the sample surface was confirmed to be CaCO3. The needle-like or columnar crystals were primarily aragonite. At a SiO32− concentration of 200 mg/L, the result was somewhat unique, as the scale layer was too thin, causing the main characteristic peaks in the XRD analysis to correspond to the metal sample material. Furthermore, only calcite characteristic peaks were detected. A simple quantitative analysis of the XRD data feature peaks was performed, yielding the crystal phase ratio of aragonite to calcite. The results are shown in Figure 27. When the SiO32− concentration is 0, 50, and 91.1 mg/L, aragonite predominates (>85%). However, when the SiO32− concentration increases to 200 mg/L, calcite becomes the dominant phase in the CaCO3 scale (96.2%), with a significant decrease in aragonite (to 3.4%). At this concentration, the scale amount on the sample surface was minimal, and the scale layer was thin.
This result is likely not due to SiO32− directly controlling the crystal phase distribution of CaCO3, as there is no clear evidence in the existing literature that SiO32− directly influences the crystal phase distribution of CaCO3. Furthermore, the crystal phase ratio changed abruptly with the concentration gradient, and no linear relationship between crystal phase distribution and SiO32− concentration was observed. Therefore, this phenomenon is more likely related to the dispersing and scale-inhibiting effects of soluble silicates (Na2SiO3) that provide SiO32−.
Na2SiO3 exhibits good dispersing properties in water, which may promote the detachment of some softer aragonite crystals from the scale and disperse them into the water [35], while the relatively harder and more stable calcite remains on the scale surface. This hypothesis is consistent with the differences in hardness and structural stability between aragonite and calcite.
In addition, regarding the role of silicate passivation layers, studies have shown that silicates can form passivation layers on metal surfaces, effectively reducing corrosion and scaling. One study found that when sulfide-containing ores (such as pyrite) are exposed to an oxidative environment, the addition of silicates leads to the formation of a smooth, continuous, and stable iron oxyhydroxide passivation layer on the oxidized pyrite surface, which significantly reduces the corrosion rate of pyrite [36]. Furthermore, SiO2, as a common nanoparticle, is widely used in coatings and can significantly improve the wear resistance, hydrophobicity, corrosion resistance, and anti-fouling properties of the coatings [37]. A smooth and hydrophobic surface can effectively prevent the adhesion of fouling. A similar mechanism may also exist in silicate passivation layers, where silicates alter the surface properties of the sample, making scaling less likely to adhere and, thus, inhibiting the occurrence of scaling. The formation of this silicate passivation layer is a dynamic process, and its long-term effects require further investigation. Although the passivation layer can suppress further scaling or corrosion, its weak structure may gradually degrade over time.

5. Conclusions

Based on the composition of actual geothermal water samples, simulated geothermal water was prepared, and scaling experiments were conducted by immersion. The weight gain trend of the samples was recorded, scaling rates were calculated, and XRD and SEM analyses were performed to investigate the effects of various ion components on the scaling process. The experimental results show that CaCO3 is the primary scaling substance in the simulated geothermal water environment, with no observed scaling of other inorganic salts or significant corrosion products. Ion components affect the scaling process in terms of both crystal phase distribution and scaling amount. The main conclusions are drawn as follows:
1. Ions significantly influencing scale deposition, Ca2+, HCO3, and SiO32− play crucial roles in the scaling process. Ca2+ and HCO3 are the primary ion sources for CaCO3 scaling. When either Ca2+ or HCO3 is absent, scaling is almost negligible. A positive correlation exists between Ca2+ concentration and the amount of scale deposition; as the Ca2+ concentration increases, the scale deposition rises significantly. The concentration of HCO3 also has a pronounced impact on CaCO3 scaling, but the relationship is nonlinear. When the HCO3 concentration exceeds a threshold (approximately 1000 mg/L), higher concentrations inhibit scaling. This inhibitory effect is likely due to the pH-buffering role of HCO3, which restricts its conversion to CO32−, thereby limiting the precipitation of CaCO3.
SiO32− demonstrates a strong inhibitory effect on scaling. The experimental results show that as the SiO32− concentration increases from 0 to 200 mg/L, the scale deposition decreases by approximately 88.91%. The inhibition mechanisms primarily include the dispersive properties of silicates and the protective effect of the passivation layer. At a concentration of 200 mg/L SiO32−, SEM images show the formation of a thin protective layer on the sample surface. This protective layer is likely composed of silicate deposits and effectively suppresses further corrosion or scaling. However, due to the thinness of the passivation layer, XRD analysis detected only metal characteristic peaks and a small amount of calcite scale.
2. Ions with minor effects on scale deposition, Mg2+ and Cl have relatively minor effects on scaling. Mg2+ reduces the scaling amount slightly by adsorbing onto the CaCO3 crystal surface, slowing crystal growth, and promoting the formation of metastable crystal phases. When the Mg2+ concentration increases from 0 to 50 mg/L, the scaling rate decreases by 13.21%. Additionally, Mg2+ promotes the formation of aragonite, a softer and less stable phase, which leads to a slight increase in the final scaling amount when Mg2+ is completely removed. Cl inhibits scaling to some extent by increasing the solubility of CaCO3. When the Cl concentration increases by 171.36%, the scaling rate decreases by approximately 12.56%, indicating a relatively limited effect. Furthermore, variations in SO42− concentration have no significant impact on the CaCO3 scaling process.
3. Regarding the impact on CaCO3 crystal phase distribution, Mg2+ influences the crystal phase distribution of CaCO3 by promoting the formation of aragonite. In the complete absence of Mg2+, CaCO3 primarily forms as the calcite phase. In contrast, in the presence of Mg2+, aragonite becomes the dominant phase. However, the crystal phase ratio does not exhibit a clear trend with increasing Mg2+ concentration, indicating that the presence or absence of Mg2+ is the primary factor affecting crystal phase distribution, while its concentration plays a limited role. Ca2+, HCO3, SO42−, and Cl show no significant influence on the crystal phase distribution of CaCO3, with calcite consistently being the dominant phase across all control groups, and no noticeable trends in phase ratios were observed with changes in ion concentration. Furthermore, SiO32−, due to its dispersing and scaling-inhibiting properties, not only significantly reduces CaCO3 deposition but also causes the softer aragonite crystals to detach from the surface. This dual effect results in the sample surface being primarily covered with the harder calcite phase.
These findings provide important theoretical insights for the prevention, inhibition, and removal of scaling in geothermal applications, with profound implications for the practical operation of geothermal energy systems. Controlling the concentrations of Ca2+, HCO3, and SiO32− helps alleviate CaCO3 scaling, which is one of the primary causes of blockages and reduced operational efficiency in geothermal power plants. In particular, the role of Ca2+ in the scaling process is the most direct; therefore, pre-treatment to reduce Ca2+ concentration before geothermal water enters the heat exchange equipment can effectively prevent and inhibit scaling. Moreover, the experimental results show that CaCO3 is the primary scaling substance. When scaling has already occurred, understanding the nature of the scaling material allows for the targeted application of descaling agents and methods, ensuring the efficient operation of geothermal systems. The control of ion concentrations and the use of chemical agents play crucial roles in controlling scaling in geothermal systems, although these measures inevitably impact the material balance of the groundwater system. With advancements in technology and heightened environmental awareness, the future trend may involve developing scale-resistant heat transfer surface materials and implementing a “heat extraction without water extraction” strategy to minimize environmental impact. Finally, these research findings provide valuable information for the system design of geothermal power plants, particularly in optimizing equipment lifespan. Reducing scaling not only enhances energy conversion efficiency but also effectively reduces downtime. In conclusion, this study provides effective strategies for scaling control in geothermal energy systems, contributing to the sustainable development and management of geothermal energy systems.

Author Contributions

Conceptualization, Z.L. and Y.Y.; methodology, Y.Y.; software, Y.Y.; validation, H.W., Z.L. and Y.Y.; formal analysis, Y.Y.; investigation, Y.Y.; resources, Y.Y.; data curation, Y.Y.; writing—original draft preparation, Y.Y.; writing—review and editing, H.W. and Z.L.; visualization, Y.Y.; supervision, H.W. and Z.L.; project administration, Y.Y.; funding acquisition, Z.L. All authors have read and agreed to the published version of the manuscript.

Funding

Financial supports from National Natural Science Foundation of China (grant No. 52176073), Yunnan Applied Basic Research Project (grant No. 202301AW070014), and Yunnan Provincial Integrated Special Fund for Key Laboratories (Integrated for Provincial and Municipal Levels) (202302AN360004).

Data Availability Statement

The data presented in this study are not publicly available due to privacy concerns and the need for subsequent research. However, the data can be made available upon request from the corresponding author.

Acknowledgments

The authors would like to thank Wenbing Yin from the Geothermal Energy Science and Technology (Dali) Research Institute for providing the geothermal water hydration data.

Conflicts of Interest

The authors declare no conflict of interest.

References

  1. Penot, C.; Martelo, D.; Paul, S. Corrosion and scaling in geothermal heat exchangers. Appl. Sci. 2023, 13, 11549. [Google Scholar] [CrossRef]
  2. Wan, Z.; Zhao, Y.; Kang, J. Forecast and evaluation of hot dry rock geothermal resource in China. Renew. Energy 2005, 30, 1831–1846. [Google Scholar] [CrossRef]
  3. El Haj Assad, M.; Bani-Hani, E.; Khalil, M. Performance of geothermal power plants (single, dual, and binary) to compensate for LHC-CERN power consumption: Comparative study. Geotherm. Energy 2017, 5, 17. [Google Scholar] [CrossRef]
  4. van der Zwaan, B.; Dalla Longa, F. Integrated assessment projections for global geothermal energy use. Geothermics 2019, 82, 203–211. [Google Scholar] [CrossRef]
  5. Zhao, H.; Huang, Y.; Deng, S.; Wang, L.; Peng, H.; Shen, X.; Ling, D.; Liu, L.; Liu, Y. Research progress on scaling mechanism and anti-scaling technology of geothermal well system. J. Dispers. Sci. Technol. 2023, 44, 1657–1670. [Google Scholar] [CrossRef]
  6. Keserovic, A.; Bäßler, R. Suitability of UNS S31603 steel for geothermal brines in volcanic areas-Influence of different physicochemical conditions on its corrosion behavior. Geothermics 2015, 53, 479–487. [Google Scholar] [CrossRef]
  7. Shannon, D.W. Economic Impact of Corrosion and Scaling Problems in Geothermal Energy Systems; Battelle Pacific Northwest Labs: Richland, WA, USA, 1975. [Google Scholar]
  8. Tardiff, G.E. Using Salton Sea geothermal brines for electrical power: A review of progress in chemistry and materials technology 1976 status. In Proceedings of the 12th Intersociety Energy Conversion Engineering Conference, Washington, DC, USA, 28 August–2 September 1977. [Google Scholar]
  9. Yang, J.; Li, C.; Pan, Y.; Huang, H. The failure mechanism of the 316 SS heat exchanger tube in the geothermal water environment. Materials 2022, 15, 8103. [Google Scholar] [CrossRef] [PubMed]
  10. Ledésert, B.A.; Hébert, R.L.; Mouchot, J.; Bosia, C.; Ravier, G.; Seibel, O.; Dalmais, É.; Ledésert, M.; Trullenque, G.; Sengelen, X.; et al. Scaling in a geothermal heat exchanger at soultz-sous-forêts (Upper Rhine Graben, France): A XRD and SEM-EDS characterization of sulfide precipitates. Geosciences 2021, 11, 271. [Google Scholar] [CrossRef]
  11. Morake, J.B.; Mutua, J.M.; Ruthandi, M.M.; Olakanmi, E.O.; Botes, A. Failure analysis of corroded heat exchanger CuNi tubes from a geothermal plant. Eng. Fail. Anal. 2023, 153, 107543. [Google Scholar] [CrossRef]
  12. Epstein, N. Fouling in heat exchangers. In International Heat Transfer Conference Digital Library; Begel House Inc.: Danbury, CT, USA, 1978. [Google Scholar]
  13. Wu, K.-H.; Zhu, L.-Q.; Li, W.-P.; Liu, H.-C. Effect of Ca2+ and Mg2+ on corrosion and scaling of galvanized steel pipe in simulated geothermal water. Corros. Sci. 2010, 52, 2244–2249. [Google Scholar] [CrossRef]
  14. Kim, W.T.; Bai, C.; Cho, Y.I. A study of CaCO3 fouling with a microscopic imaging technique. Int. J. Heat Mass Transf. 2002, 45, 597–607. [Google Scholar] [CrossRef]
  15. Bansal, B. Crystallisation Fouling in Plate Heat Exchangers. Doctoral Dissertation, ResearchSpace@Auckland, Auckland, New Zealand, 1994. [Google Scholar]
  16. Pääkkönen, T.; Ojaniemi, U.; Pättikangas, T.; Manninen, M.; Muurinen, E.; Keiski, R.; Simonson, C. CFD modelling of CaCO3 crystallization fouling on heat transfer surfaces. Int. J. Heat Mass Transf. 2016, 97, 618–630. [Google Scholar] [CrossRef]
  17. Lu, A.Y.-T.; Harouaka, K.; Paudyal, S.; Ko, S.; Dai, C.; Gao, S.; Deng, G.; Zhao, Y.; Wang, X.; Mateen, S.; et al. Kinetics of barium sulfate deposition and crystallization process in the flowing tube. Ind. Eng. Chem. Res. 2020, 59, 7299–7309. [Google Scholar] [CrossRef]
  18. Waly, T.; Kennedy, M.D.; Witkamp, G.-J.; Amy, G.; Schippers, J.C. The role of inorganic ions in the calcium carbonate scaling of seawater reverse osmosis systems. Desalination 2012, 284, 279–287. [Google Scholar] [CrossRef]
  19. SMuryanto, A.P.; Bayuseno, W.; Sediono, W. Mangestiyono, Influence of flow rates and copper (II) ions on the kinetics of gypsum scale formation in pipes. Int. J. Technol. 2014, 4, 217–223. [Google Scholar] [CrossRef]
  20. Wang, G.; Zhu, L.; Liu, H.; Li, W. Galvanic corrosion of Ni-Cu-Al composite coating and its anti-fouling property for metal pipeline in simulated geothermal water, Surf. Coat. Technol. 2012, 206, 3728–3732. [Google Scholar] [CrossRef]
  21. Cai, Y.; Quan, X.; Li, G.; Gao, N. Anticorrosion and scale behaviors of nanostructured ZrO2–TiO2 coatings in simulated geothermal water. Ind. Eng. Chem. Res. 2016, 55, 11480–11494. [Google Scholar] [CrossRef]
  22. Tai, C.; Chien, W. Interpreting the effects of operating variables on the induction period of CaCl2-Na2CO3 system by a cluster coagulation model. Chem. Eng. Sci. 2003, 58, 3233–3241. [Google Scholar] [CrossRef]
  23. Lei, B.; Li, M.; Zhao, Z.; Wang, L.; Li, Y.; Wang, F. Corrosion mechanism of an Al–BN abradable seal coating system in chloride solution. Corros. Sci. 2014, 79, 198–205. [Google Scholar] [CrossRef]
  24. Zeppenfeld, K. Prevention of CaCO3 scale formation by trace amounts of copper(II) in comparison to zinc (II). Desalination 2010, 252, 60–65. [Google Scholar] [CrossRef]
  25. Benslimane, S.; Bouhidel, K.E.; Ferfache, A.; Farhi, S. Mechanistic study of the synergetic inhibiting effects of Zn2+, Cu2+ and Mg2+ ions on calcium carbonate precipitation. Water Res. 2020, 186, 116323. [Google Scholar] [CrossRef]
  26. Zhang, F.; Liu, M.; Zhang, S.; Zhao, Q. Corrosion and fouling of different coatings in geothermal water. Acta Energiae Solaris Sin. 2015, 36, 510–516. [Google Scholar]
  27. Gallup, D.L.; Sugiaman, F.; Capuno, V.; Manceau, A. Laboratory investigation of silica removal from geothermal brines to control silica scaling and produce usable silicates. Appl. Geochem. 2003, 18, 1597–1612. [Google Scholar] [CrossRef]
  28. Song, J.; Liu, M.; Sun, X. Model analysis and experimental study on scaling and corrosion tendencies of aerated geothermal water. Geothermics 2020, 85, 101766. [Google Scholar] [CrossRef]
  29. Langelier, W.F. Chemical equilibria in water treatment. J. Am. Water Work. Assoc. 1946, 36, 169–178. [Google Scholar] [CrossRef]
  30. Ryznar, J.W. A new index for determining amount of calcium carbonate scale formed by a water. J. Am. Water Work. Assoc. 1944, 36, 472–483. [Google Scholar] [CrossRef]
  31. Larson, T.E.; Skold, R.V. Laboratory studies relating mineral quality of water to corrosion of steel and cast iron. Corrosion 1958, 14, 43–46. [Google Scholar] [CrossRef]
  32. Gryta, M. Alkaline scaling in the membrane distillation process. Desalination 2008, 228, 128–134. [Google Scholar] [CrossRef]
  33. Chen, T.; Neville, A.; Yuan, M. Assessing the effect of Mg2+ on CaCO3 scale formation–bulk precipitation and surface deposition. J. Cryst. Growth 2005, 275, e1341–e1347. [Google Scholar] [CrossRef]
  34. Wright, K.C.; Kim, H.S.; Cho, D.J.; Rabinovich, A.; Fridman, A.; Cho, Y.I. New fouling prevention method using a plasma gliding arc for produced water treatment. Desalination 2014, 345, 64–71. [Google Scholar] [CrossRef]
  35. Minkowicz, L.; Dagan, A.; Uvarov, V.; Benny, O. Controlling calcium carbonate particle morphology, size, and molecular order using silicate. Materials 2021, 14, 3525. [Google Scholar] [CrossRef] [PubMed]
  36. Fan, R.; Short, M.D.; Zeng, S.-J.; Qian, G.; Li, J.; Schumann, R.C.; Kawashima, N.; Smart, R.S.C.; Gerson, A.R. The formation of silicate-stabilized passivating layers on pyrite for reduced acid rock drainage. Environ. Sci. Technol. 2017, 51, 11317–11325. [Google Scholar] [CrossRef] [PubMed]
  37. Nie, Y.; Ma, S.; Tian, M.; Zhang, Q.; Huang, J.; Cao, M.; Li, Y.; Sun, L.; Pan, J.; Wang, Y.; et al. Superhydrophobic silane-based surface coatings on metal surface with nanoparticles hybridization to enhance anticorrosion efficiency, wearing resistance and antimicrobial ability. Surf. Coat. Technol. 2021, 410, 126966. [Google Scholar] [CrossRef]
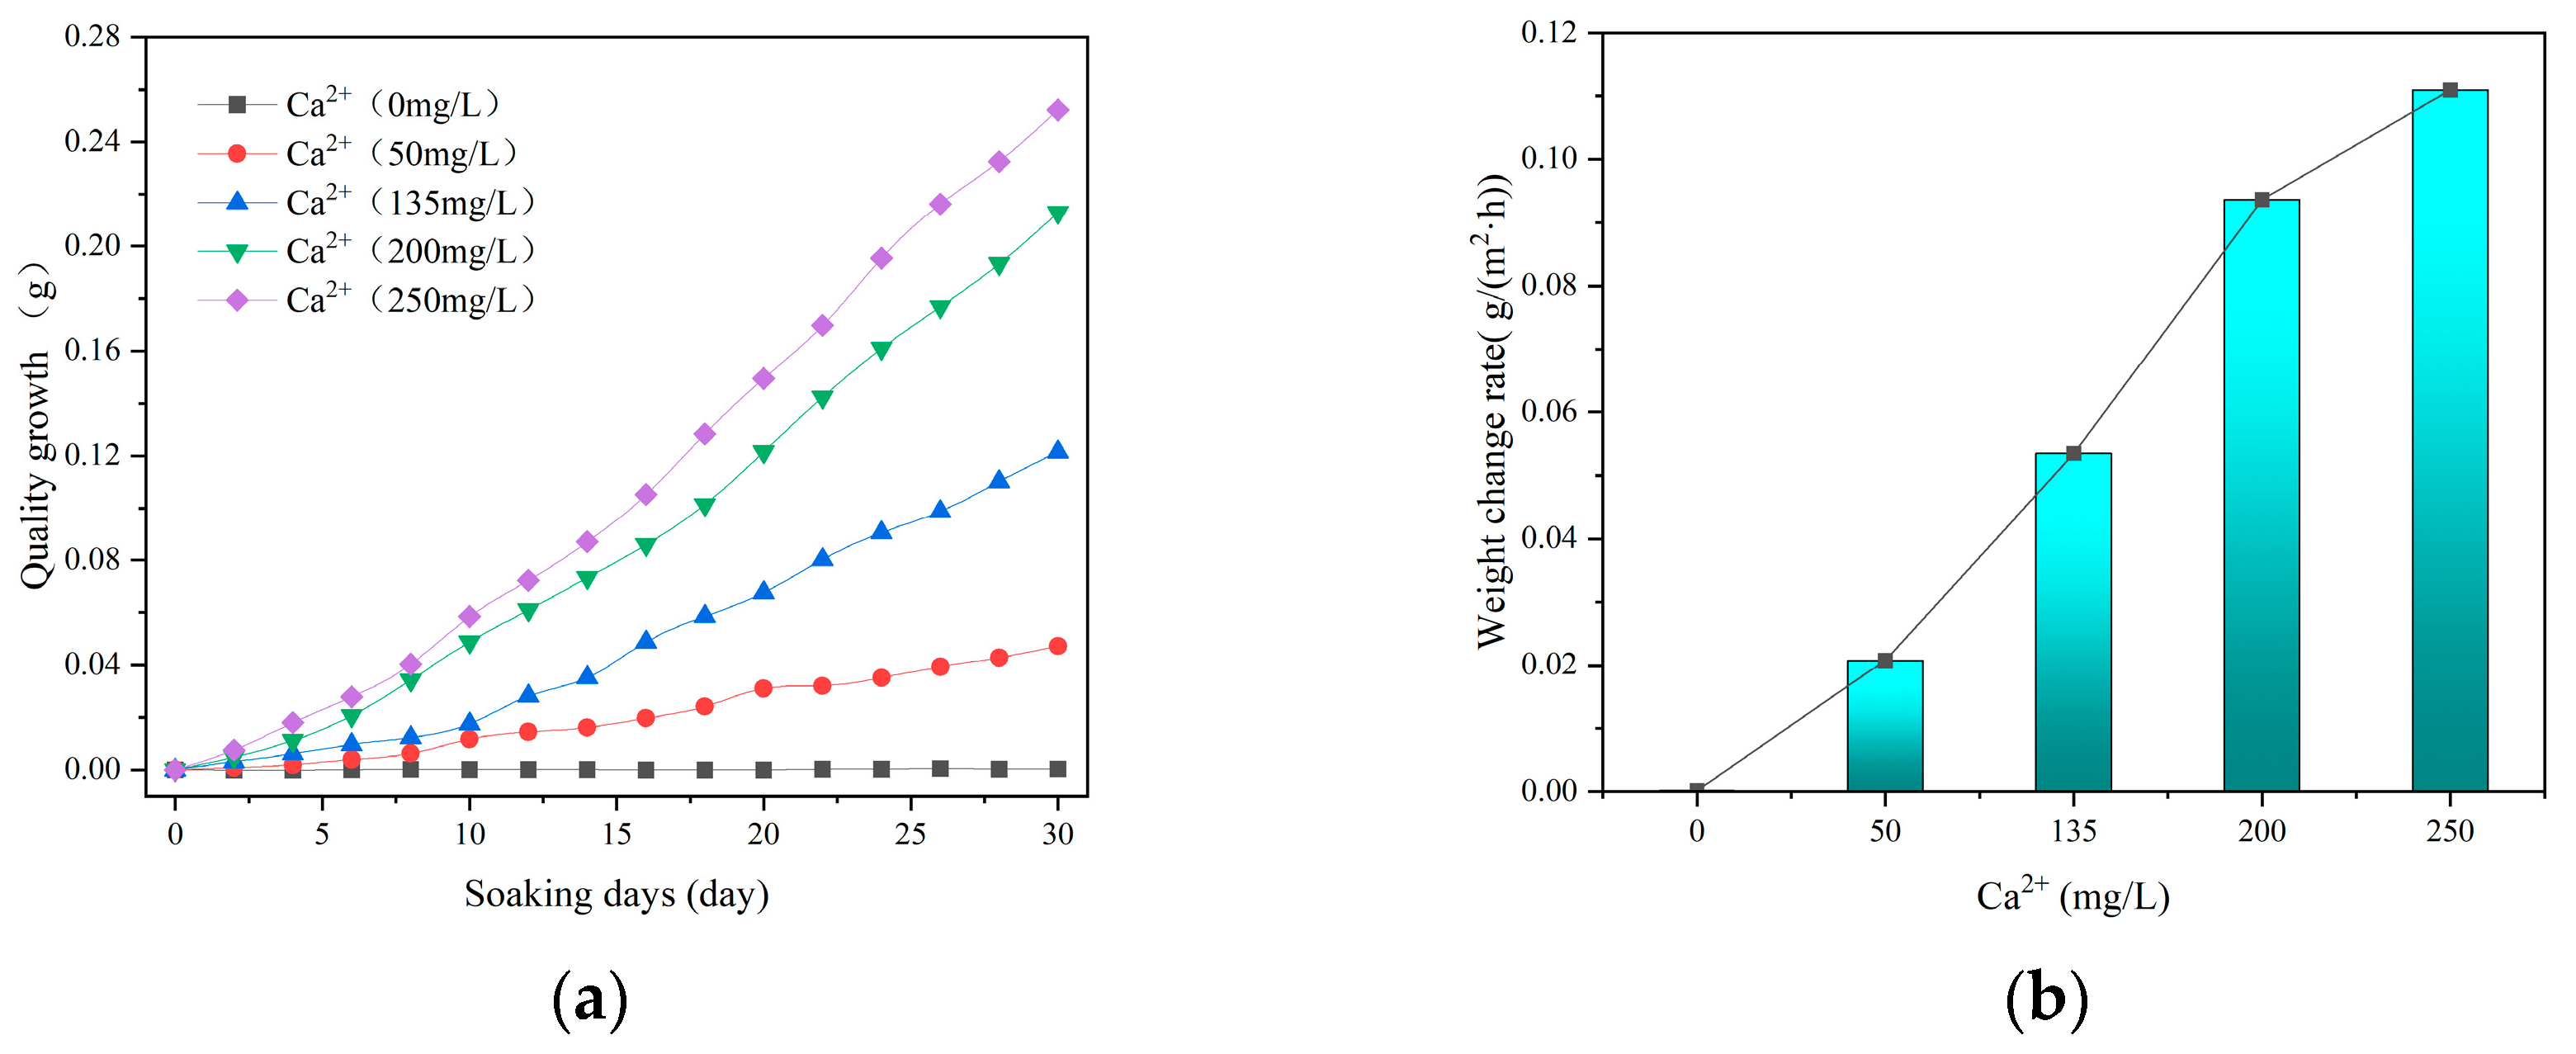
Figure 1. Experimental results of the Ca2+ concentration gradient control group. (a) Weight-increase trend of the samples; (b) scaling rate comparison chart.
Energies 18 00946 g001
Figure 2. Images of scaling morphology of Ca2+ concentration control groups after 30 days of immersion. (a) Digital images of the SS304 samples; (b) SEM images of SS304 samples.
Energies 18 00946 g002
Figure 3. XRD analysis results of SS304 samples in Ca2+ concentration control groups.
Energies 18 00946 g003
Figure 4. Ca2+ concentration control groups calcium carbonate crystal phase proportion diagram.
Energies 18 00946 g004
Figure 5. Experimental results of the Ca2+- Cl- supplemented control group. (a) Images of SS304 samples and scaling morphology; (b) comparative analysis of the effect on scaling rate.
Energies 18 00946 g005
Figure 6. XRD analysis comparison of SS304 samples in the Ca2+- Cl- supplemented control group.
Energies 18 00946 g006
Figure 7. Calcium carbonate crystal phase proportion in Ca2+- Cl- supplemented control group.
Energies 18 00946 g007
Figure 8. Experimental results of the Mg2+ concentration gradient control group. (a) Weight-increase trend of the samples; (b) scaling rate comparison chart.
Energies 18 00946 g008
Figure 9. Images of scaling morphology of Mg2+ concentration control groups after 30 days of immersion. (a) Digital images of the SS304 samples; (b) SEM images of SS304.
Energies 18 00946 g009
Figure 10. XRD analysis results of SS304 samples in Mg2+ concentration control groups.
Energies 18 00946 g010
Figure 11. Mg2+ concentration control groups calcium carbonate crystal phase proportion diagram.
Energies 18 00946 g011
Figure 12. Experimental results of the Mg2+- Cl- supplemented control group. (a) Images of SS304 samples and scaling morphology; (b) comparative analysis of the effect on scaling rate.
Energies 18 00946 g012
Figure 13. XRD analysis comparison of SS304 samples in the Mg2+- Cl- supplemented control group.
Energies 18 00946 g013
Figure 14. Calcium carbonate crystal phase proportion in Mg2+- Cl- supplemented control group.
Energies 18 00946 g014
Figure 15. Experimental results of the HCO3 concentration gradient control group. (a) Weight-increase trend of the samples; (b) scaling rate comparison chart.
Energies 18 00946 g015
Figure 16. Images of scaling morphology of HCO3 concentration control groups after 30 days of immersion. (a) Digital images of the SS304 samples; (b) SEM images of SS304 samples.
Energies 18 00946 g016
Figure 17. XRD analysis results of SS304 samples in HCO3 concentration control groups.
Energies 18 00946 g017
Figure 18. HCO3 concentration control groups calcium carbonate crystal phase proportion diagram.
Energies 18 00946 g018
Figure 19. Relationship between the proportion of carbon-containing ions and pH value.
Energies 18 00946 g019
Figure 20. Experimental results of the SO42− concentration gradient control group. (a) Weight-increase trend of the samples; (b) scaling rate comparison chart.
Energies 18 00946 g020
Figure 21. Images of scaling morphology of SO42− concentration control groups after 30 days of immersion. (a) Digital images of the SS304 samples; (b) SEM images of SS304 samples.
Energies 18 00946 g021
Figure 22. XRD analysis results of SS304 samples in SO42− concentration control groups.
Energies 18 00946 g022
Figure 23. SO42− concentration control groups calcium carbonate crystal phase proportion diagram.
Energies 18 00946 g023
Figure 24. Experimental results of the SiO32− concentration gradient control group. (a) Weight-increase trend of the samples; (b) scaling rate comparison chart.
Energies 18 00946 g024
Figure 25. Images of scaling morphology of SiO32− concentration control groups after 30 days of immersion. (a) Digital images of the SS304 samples; (b) SEM images of SS304 samples.
Energies 18 00946 g025
Figure 26. XRD analysis results of SS304 samples in SiO32− concentration control groups.
Energies 18 00946 g026
Figure 27. SiO32− concentration control groups calcium carbonate crystal phase proportion diagram.
Energies 18 00946 g027
Table 1. Main composition of geothermal water in Dali prefecture *.
NO.WTpHTDSClSO42−HCO3Ca2+Mg2+Na+K+SiO2
1#787.221560276.413199913512.844942.591.1
2#85.97.4959712.521630046.26.7215913.3120
3#54.96.9472912.512661010318.614010111
4#56.87.338328.930944413324.41339.970.3
5#53.67.746078.911249036.79.8517214.983.5
6#55.47.3948848.25239849.613.911515.250.8
* (1) WT: water temperature (°C). The unit of the concentration is mg/L.
Table 2. Evaluations of the scaling and corrosion tendencies obtained with the index models *.
NO.Langelier Saturation Index ModelRyznar Stability Index ModelLarson Index Model
Langelier IndexScaling TendencyRyznar IndexScaling TendencyLarson IndexCorrosion (Scaling) Tendency
1#1.58Severe scaling4.06Severe scaling0.64Slight corrosive (Generally stable)
2#0.99Slight scaling5.5Moderate scaling0.98Slight corrosive (Generally stable)
3#0.67Slight scaling5.6Moderate scaling0.3Non-corrosive (Potential for scaling)
4#1.06Severe scaling5.2Moderate scaling0.92Slight corrosive (Generally stable)
5#0.91Slight scaling5.93Moderate scaling0.32Non-corrosive (Potential for scaling)
6#0.65Slight scaling6.1Slight scaling0.37Non-corrosive (Potential for scaling)
* (1) The Langelier Saturation Index (L.S.I.) classification criteria are as follows: <0.0, corrosive type; 0~0.5, stable type; 0.5~1.0, slight scaling type; >1.0, severe scaling type. (2) The Ryznar Stability Index (R.S.I.) classification criteria are as follows: <4.0, extremely severe scaling type; 4.0~5.0, severe scaling type; 5.0~6.0, moderate scaling type; 6.0~7.0, slight scaling type; >7.0, non-scaling type. (3) The Larson index (L.I.) classification criteria are as follows: <0.5, non-corrosive (potential for scaling); 0.5~3.0, slightly corrosive (generally stable); 3.0~10.0, moderate corrosion (stable type); >10.0, severe corrosion (stable type).
Table 3. Compositions of simulated geothermal water sample *.
Control GroupComposition
CaCl2
2H2O
MgCl2
6H2O
NaHCO3Na2SO4KClNa2SiO3
9H2O
NaCl
baseline495.2107.11375.5193.781//
Ca2+ group
(concentration, mg/L)
0/----//
0/----/393.8
50183----//
50183----/247.9
200734.8----//
250918.4----//
Mg2+ group
(concentration, mg/L)
0-/---//
0-/---/61.6
5-41.8---//
5-41.8---/37.5
20-167.3---//
50-418.2---//
HCO3 group
(concentration, mg/L)
0-----//
500--688.5--//
1500--2065.4--//
2000--2753.9--//
SO42− group
(concentration, mg/L)
0---/-//
50---73.9-//
200---295.7-//
250---369.6-//
SiO32− group
(concentration, mg/L)
50-----185.2/
91.1-----339.6/
200-----747.6/
* (1) The unit of the composition is mg/L. (2) “-” indicates the concentration is the same as the baseline water sample. (3) “/” indicates no reagent added.
Table 4. The chemical composition of SS304 stainless steel sample.
GradeChemical Composition (%)
CMnSiPSNiCrN
SS3040.0530.850.430.0320.0078.0018.120.061
Disclaimer/Publisher’s Note: The statements, opinions and data contained in all publications are solely those of the individual author(s) and contributor(s) and not of MDPI and/or the editor(s). MDPI and/or the editor(s) disclaim responsibility for any injury to people or property resulting from any ideas, methods, instructions or products referred to in the content.