Article

Solid Insulation Partial Discharge Detection of Low-Intensity Noise Fiber Laser Based on Polarized Light Demodulation

China Electric Power Research Institute, Wuhan 430074, China
*
Author to whom correspondence should be addressed.
Energies 2025, 18(4), 955; https://doi.org/10.3390/en18040955
Submission received: 22 November 2024 / Revised: 9 February 2025 / Accepted: 10 February 2025 / Published: 17 February 2025
(This article belongs to the Special Issue Power Cables in Energy Systems)

Abstract

:
The distributed feedback fiber (DFB) laser has been extensively researched for the purpose of detecting partial discharges in power equipment. DFB is demodulated using an unbalanced interferometer, which is not only structurally complex but also prone to introducing significant noise when the fiber distance is long. In order to address this issue, this paper presents the design of a low-noise demodulation system. The theoretical model of external optical feedback noise is described in this study. The relationship between this noise and the DFB linewidth is established by introducing the external optical feedback coefficient C. The theoretical results demonstrate that the system noise is minimized when C is approximately 30. A low-noise partial discharge detection system combined with a polarization optical demodulation method is developed. The experimental results confirmed the local discharge detection capability of the system in solid insulation and significantly reduced the system noise. This result promotes wider application and promotion of DFB lasers.

1. Introduction

The maintenance and replacement procedures associated with solid insulation are complex and time-consuming. The power supply will be disrupted in the event of solid insulation breakdown, leading to considerable economic losses [1,2]. Partial discharge (PD) detection is an effective method for evaluating the condition of solid insulations. Optical fiber ultrasonic sensors have garnered considerable attention for PD detection in solid insulation in recent years [3]. Optical fiber ultrasonic sensors exhibit distinct advantages over traditional piezoelectric ceramic sensors, such as compact size, resistance to electromagnetic interference, and effective multiplexing capabilities. The optical ultrasonic sensors employed for partial discharge detection encompass fiber Bragg grating (FBG) sensors, extrinsic Fabry–Perot interferometric (EFPI) sensors, and fiber optic interferometric (FOI) Sensors.
Among these, FBG are characterized by their compact structure and high uniformity; however, they exhibit low sensitivity [4,5,6]. The multi-point FBG sensor demonstrates a sensitivity of approximately 14.06 dB when detecting partial discharge signals in transformers [7]. A static pressure measurement of approximately 27 Pa and a dynamic pressure measurement of 35 Pa were documented during the detection of partial discharge signals [8]. EFPI sensors possess high detection sensitivity. The response magnitude of the EFPI sensor is 19.14 times that of the traditional PZT sensor [9]. In addition, researchers believe that EFPI sensors can achieve higher positioning accuracy [10]. However, there is a gap in the EFPI sensor’s structure, thereby limiting its potential application in high-field environments [11]. FOI sensors use fiber coil sensing. The influence of fiber coil structure parameters on ultrasonic detection performance has been particularly studied [12]. The frequency range for the FOI sensor detection has been determined through time–frequency analysis on ultrasonic signals [13]. The average detection limit of the FOI system is 18.6% of that of the PZT system in oil, and the minimum measurable voltage is 21.5% lower than that of the PZT detection system when the distance between the sensor and the ultrasonic source is 300 mm [14]. The sensitivity of FOI sensors is proportional to the fiber length. However, the increase in fiber length hinders the detection range of FOI sensors. Additionally, the coupling efficiency with solid insulation is significantly impaired, presenting challenges for the application of FOI sensors in solid insulation [15].
Therefore, it is necessary to find a fiber optic ultrasonic sensor with higher sensitivity, more convenience to use, and independent sensing units to meet the increasing demand for the detection of solid insulation partial discharge. DFB has been widely studied in the detection of partial discharge in power equipment due to its high sensitivity and wide frequency response characteristics, based on the fiber optic Bragg grating structure [16,17]. The DFB configuration is an all-fiber structure, with the sensing component only a few centimeters long. Moreover, the sensing unit operates independently of the demodulation system, which significantly facilitates long-distance online monitoring of partial discharge in power equipment [18].
DFB lasers employ unbalanced interferometer demodulation systems currently. However, this system is not only characterized by its substantial size and complex structure, but it also tends to introduce significant noise, particularly when the fiber distance is lengthy. The polarization light demodulation system avoids the necessity of a long optical path unbalanced interferometer by utilizing the frequency difference of light generated by two orthogonal polarization modes to distinguish signals [19,20]. The anisotropy of the optical fiber leads to the appearance of an inconsistent birefringence phenomenon when the DFB laser resonator is subjected to the ultrasonic field. This disturbance leads to differences in the laser frequency on the two orthogonal components, causing changes in the laser polarization beat frequency, ultimately manifested as changes in the optical intensity signal [21,22]. The polarized light demodulation system has been extensively investigated in numerous measurements and applications in recent years [23,24,25]. Researchers have conducted thorough examinations of the fundamental characteristics of the polarized light de-modulation system, including sensitivity, linear response, bandwidth, and other related parameters [26,27]. However, the system will be affected by external optical feedback noise, due to factors such as the relatively large sensing distance and the bending of DFB deployment, in solid insulation detection environments [28].
Therefore, we propose a noise suppression scheme for active optical feedback to solve the problem of susceptibility to noise interference in the demodulation system. We establish the correlation between the optical feedback coefficient and the linewidth of DFB and propose an optical feedback suppression system to minimize the influence of external optical feedback on the DFB demodulation system.

2. Mechanism of DFB Polarized Light Demodulation System

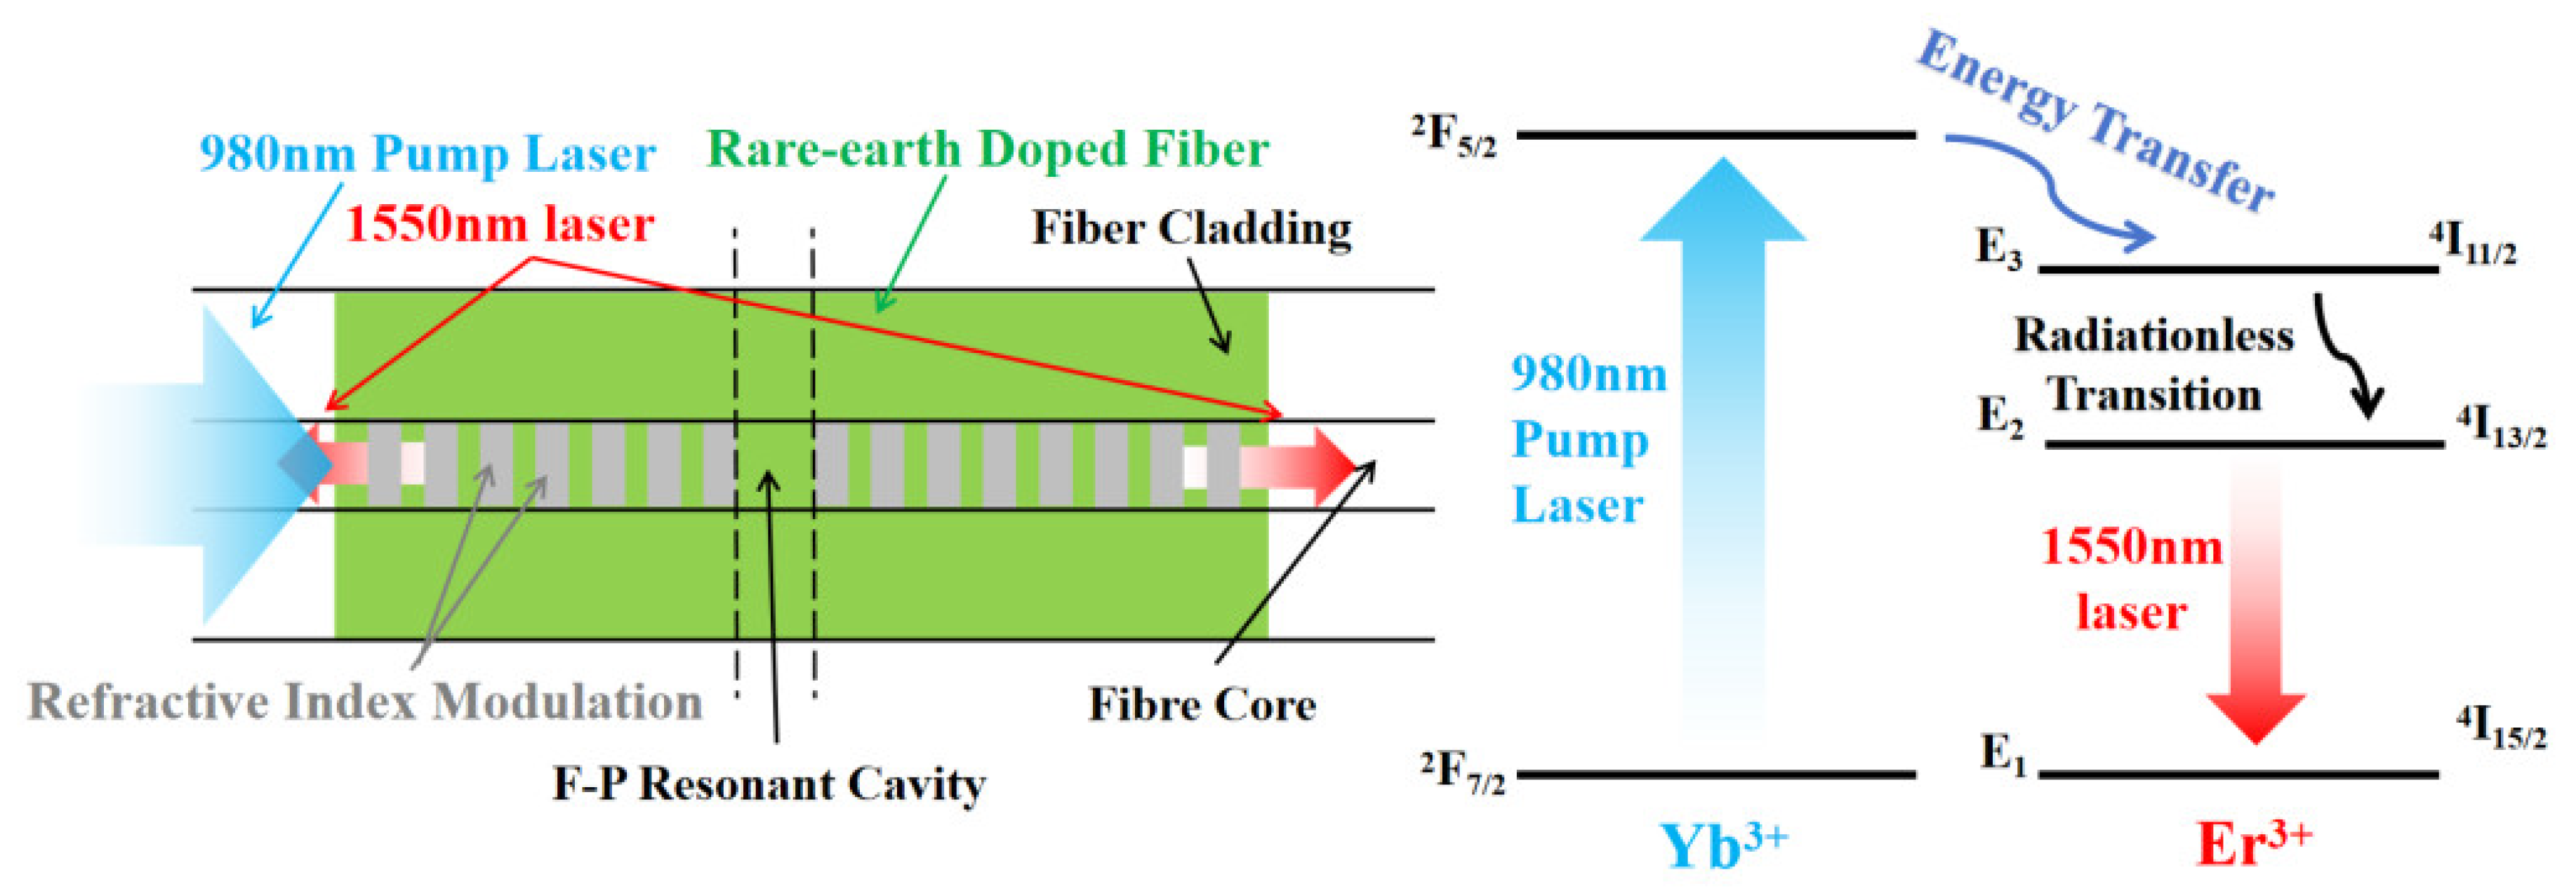
2.1. DFB Theoretical Structure Model

Figure 1 shows the specific structure of the DFB laser. The DFB laser is composed of a grating inscribed in rare-earth-doped fiber. The gain medium within the DFB laser cavity is activated by the rare earth ions present in the fiber. Erbium ions (Er3⁺) and ytterbium ions (Yb3⁺) are primarily co-doped. The behavior of the Er3⁺ ions can be modeled as a three-level system. The Er3⁺ ions undergo a direct transition from the E1 level to the E3 level due to stimulated absorption when subjected to 980 nm pump light. Following is a fast non-radiative transition to the E2 level. The combined effects of stimulated emission and spontaneous emission facilitate the transition of ions at the E2 level back to the E1 level, resulting in the emission of photons in the 1550 nm wavelength range.
The incorporation of Yb3⁺ ions enhances the absorption efficiency of the pump light, as Yb3⁺ ions possess a larger absorption cross-section and a broader absorption band. Yb3⁺ ions absorb the pump photons to elevate to the excited state and then transfer the energy to the ground state Er3⁺ ions during the pumping process. This process induces the transition of Er3+ ions from the E1 energy level to the E3 energy level and then quickly transitions without radiation to the E2 energy level. Finally, laser action occurs at a wavelength of 1550 nm through spontaneous and stimulated emission. The co-doping of Er3⁺ and Yb3⁺ ions reduces the possibility of the ion up-conversion effect and significantly improves the output power of DFB lasers.
The linewidth of the light source is defined as the width between two optical frequencies at half the height of the spectral peak. Light sources require narrow line widths and a single peak in sensing applications. DFB lasers achieve these conditions through periodic refractive index modulation gratings and F-P resonant cavities. The reflection spectrum T of DFB laser can be derived using fiber-coupled mode theory [29,30]. The results of the calculations can be succinctly summarized in Equation (1).
T = κ 2 Δ β 2 2 κ 2 Δ β 2 2 + 4 κ 2 Δ β 2 sinh 4 κ 2 Δ β 2 2 d
where d is the length of the resonant cavity; κ = πΔ0 is the coupling coefficient; β is the light field propagation constant; Δβ = 2πn (1/λ − 10) is the change in light field propagation constant; n is the effective refractive index in the fiber; Δn is the refractive index difference modulated by the fiber grating; λ is the wavelength of light; and λ0 is the central wavelength of the fiber grating. The DFB simulation spectrum is carried out by using the above formula.
Figure 2 shows that the DFB laser has a narrow peak at 1550 nm. It will only remain one peak at 1550 nm through apodization technology in industrial applications. The linewidth Δν of the DFB used in this study is approximately 5.6457−8 nm (7.049 kHz). This implies that the DFB has the ability to maintain a relatively consistent phase relationship, enabling more precise detection of minute phase alterations.

2.2. Principle of Polarized Light Demodulation System

An individual peak of the DFB consists of two perpendicular polarization peaks. The two polarized peaks are no longer degenerate when DFB is subjected to stress. The frequency changes of the two polarized peaks are inconsistent due to the inconsistent stress changes in different directions. This frequency difference results in an optical phase difference. Ultimately, this is evident through fluctuations in light intensity. The polarimetric demodulation system converts the changes in physical parameters into changes in DFB optical intensity by utilizing this frequency variation difference [31].
Figure 3 shows the principle of polarization demodulation. DFB lasers can be modeled as a symmetrical ideal optical fiber without stress. It can propagate two orthogonally coupled polarized lights simultaneously and has a uniform refractive index in all directions. The speed of light along the two orthogonal optical axes is equal. However, the DFB laser becomes an asymmetric structure when stress is applied to the DFB. The emission conditions of DFB lasers are no longer identical, due to the unequal refractive indices and light velocity of the two orthogonal optical axes. There are two polarization peaks observed simultaneously, known as beat frequency, which lead to significant fluctuations in light intensity. When the DFB is subjected to strain under the influence of the sound field, the wavelength changes in the two orthogonal directions can be expressed by Equation (2) [32].
λ x = 2 n x l + 2 Δ n x l m = λ x + 2 Δ n x l m λ y = 2 n y l + 2 Δ n y l m = λ y + 2 Δ n y l m
where the λx′ and λy′ are the wavelengths of the two polarization directions after the DFB is stressed; λx and λy are the respective wavelengths of the two polarization modes before the DFB is stressed; l is the effective length of the resonant cavity; m is the order of the resonant mode in the laser resonant cavity; nx and ny represent the effective refractive index of the two polarization modes; and Δnx and Δny represent the variation of the refractive index of the two polarization modes after the DFB is stressed. The relationship between DFB frequency drift and refractive index change can be shown in Equation (3) [33].
Δ ν = n y n x n 0 λ 0 c
The formula demonstrates that the frequency drift of the DFB laser is directly proportional to the change in refractive index and the response sensitivity. Even with a birefringence variation of only 10−8 in the resonant cavity, the beat frequency drift can be calculated using Formula (3) to be approximately 1 kHz. This value suggests that the frequency shift can be easily detected using a photoelectric conversion method.

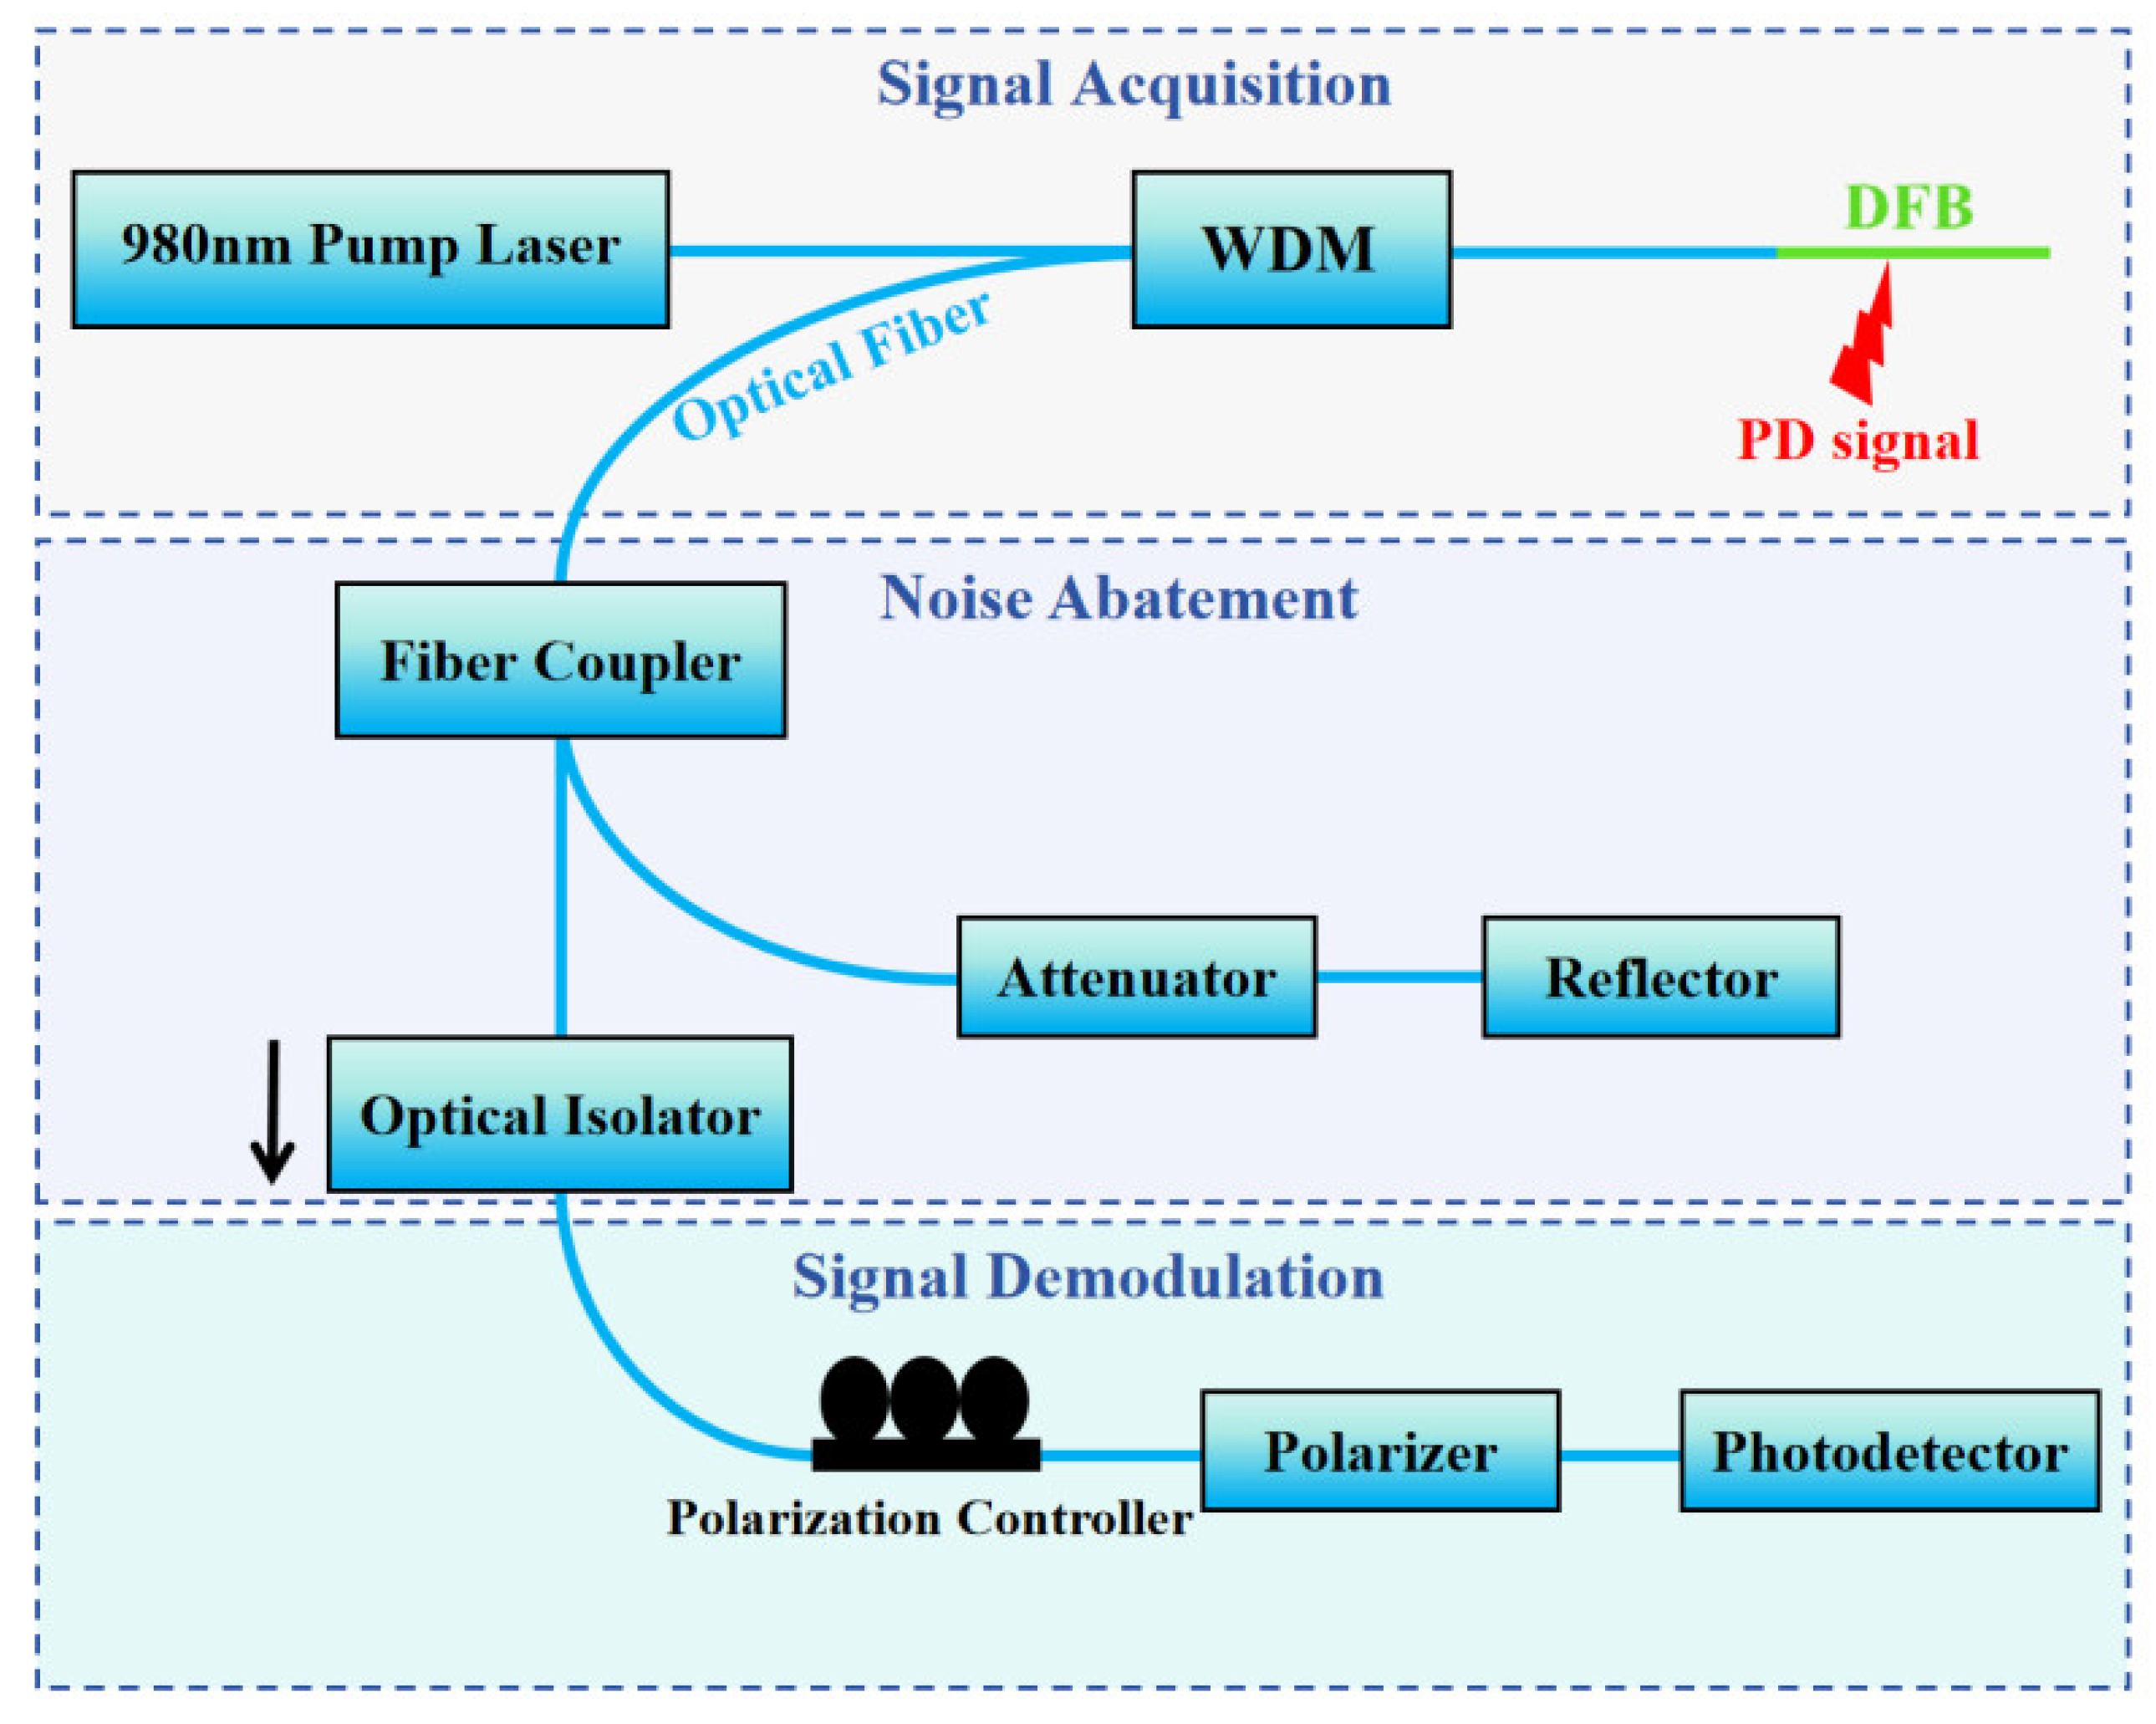
3. Active Feedback Optical Injection DFB Noise Suppression System

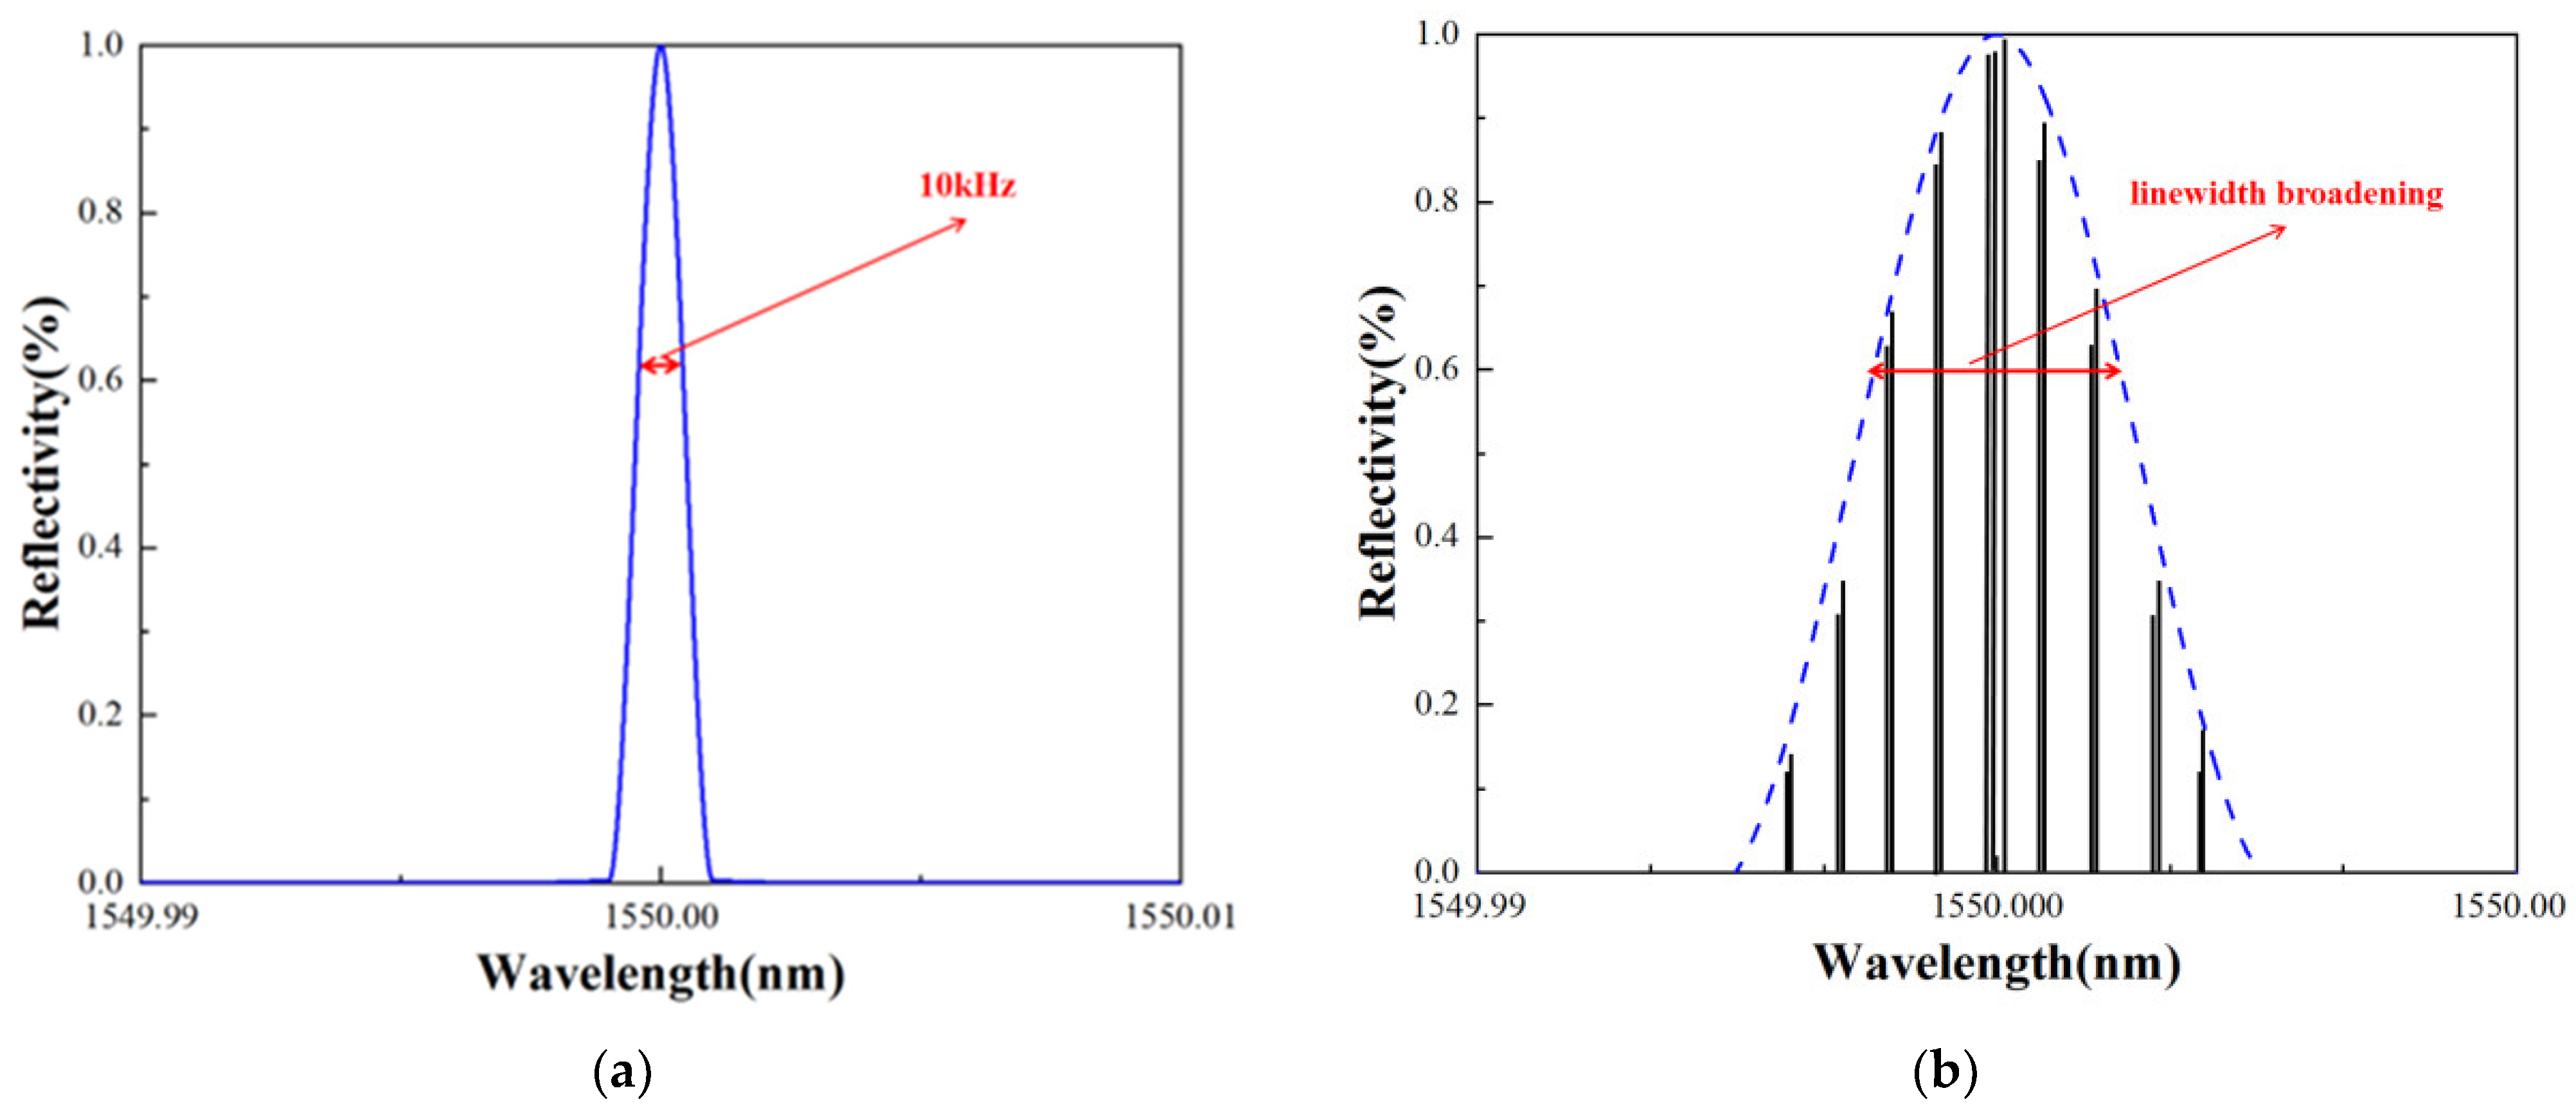
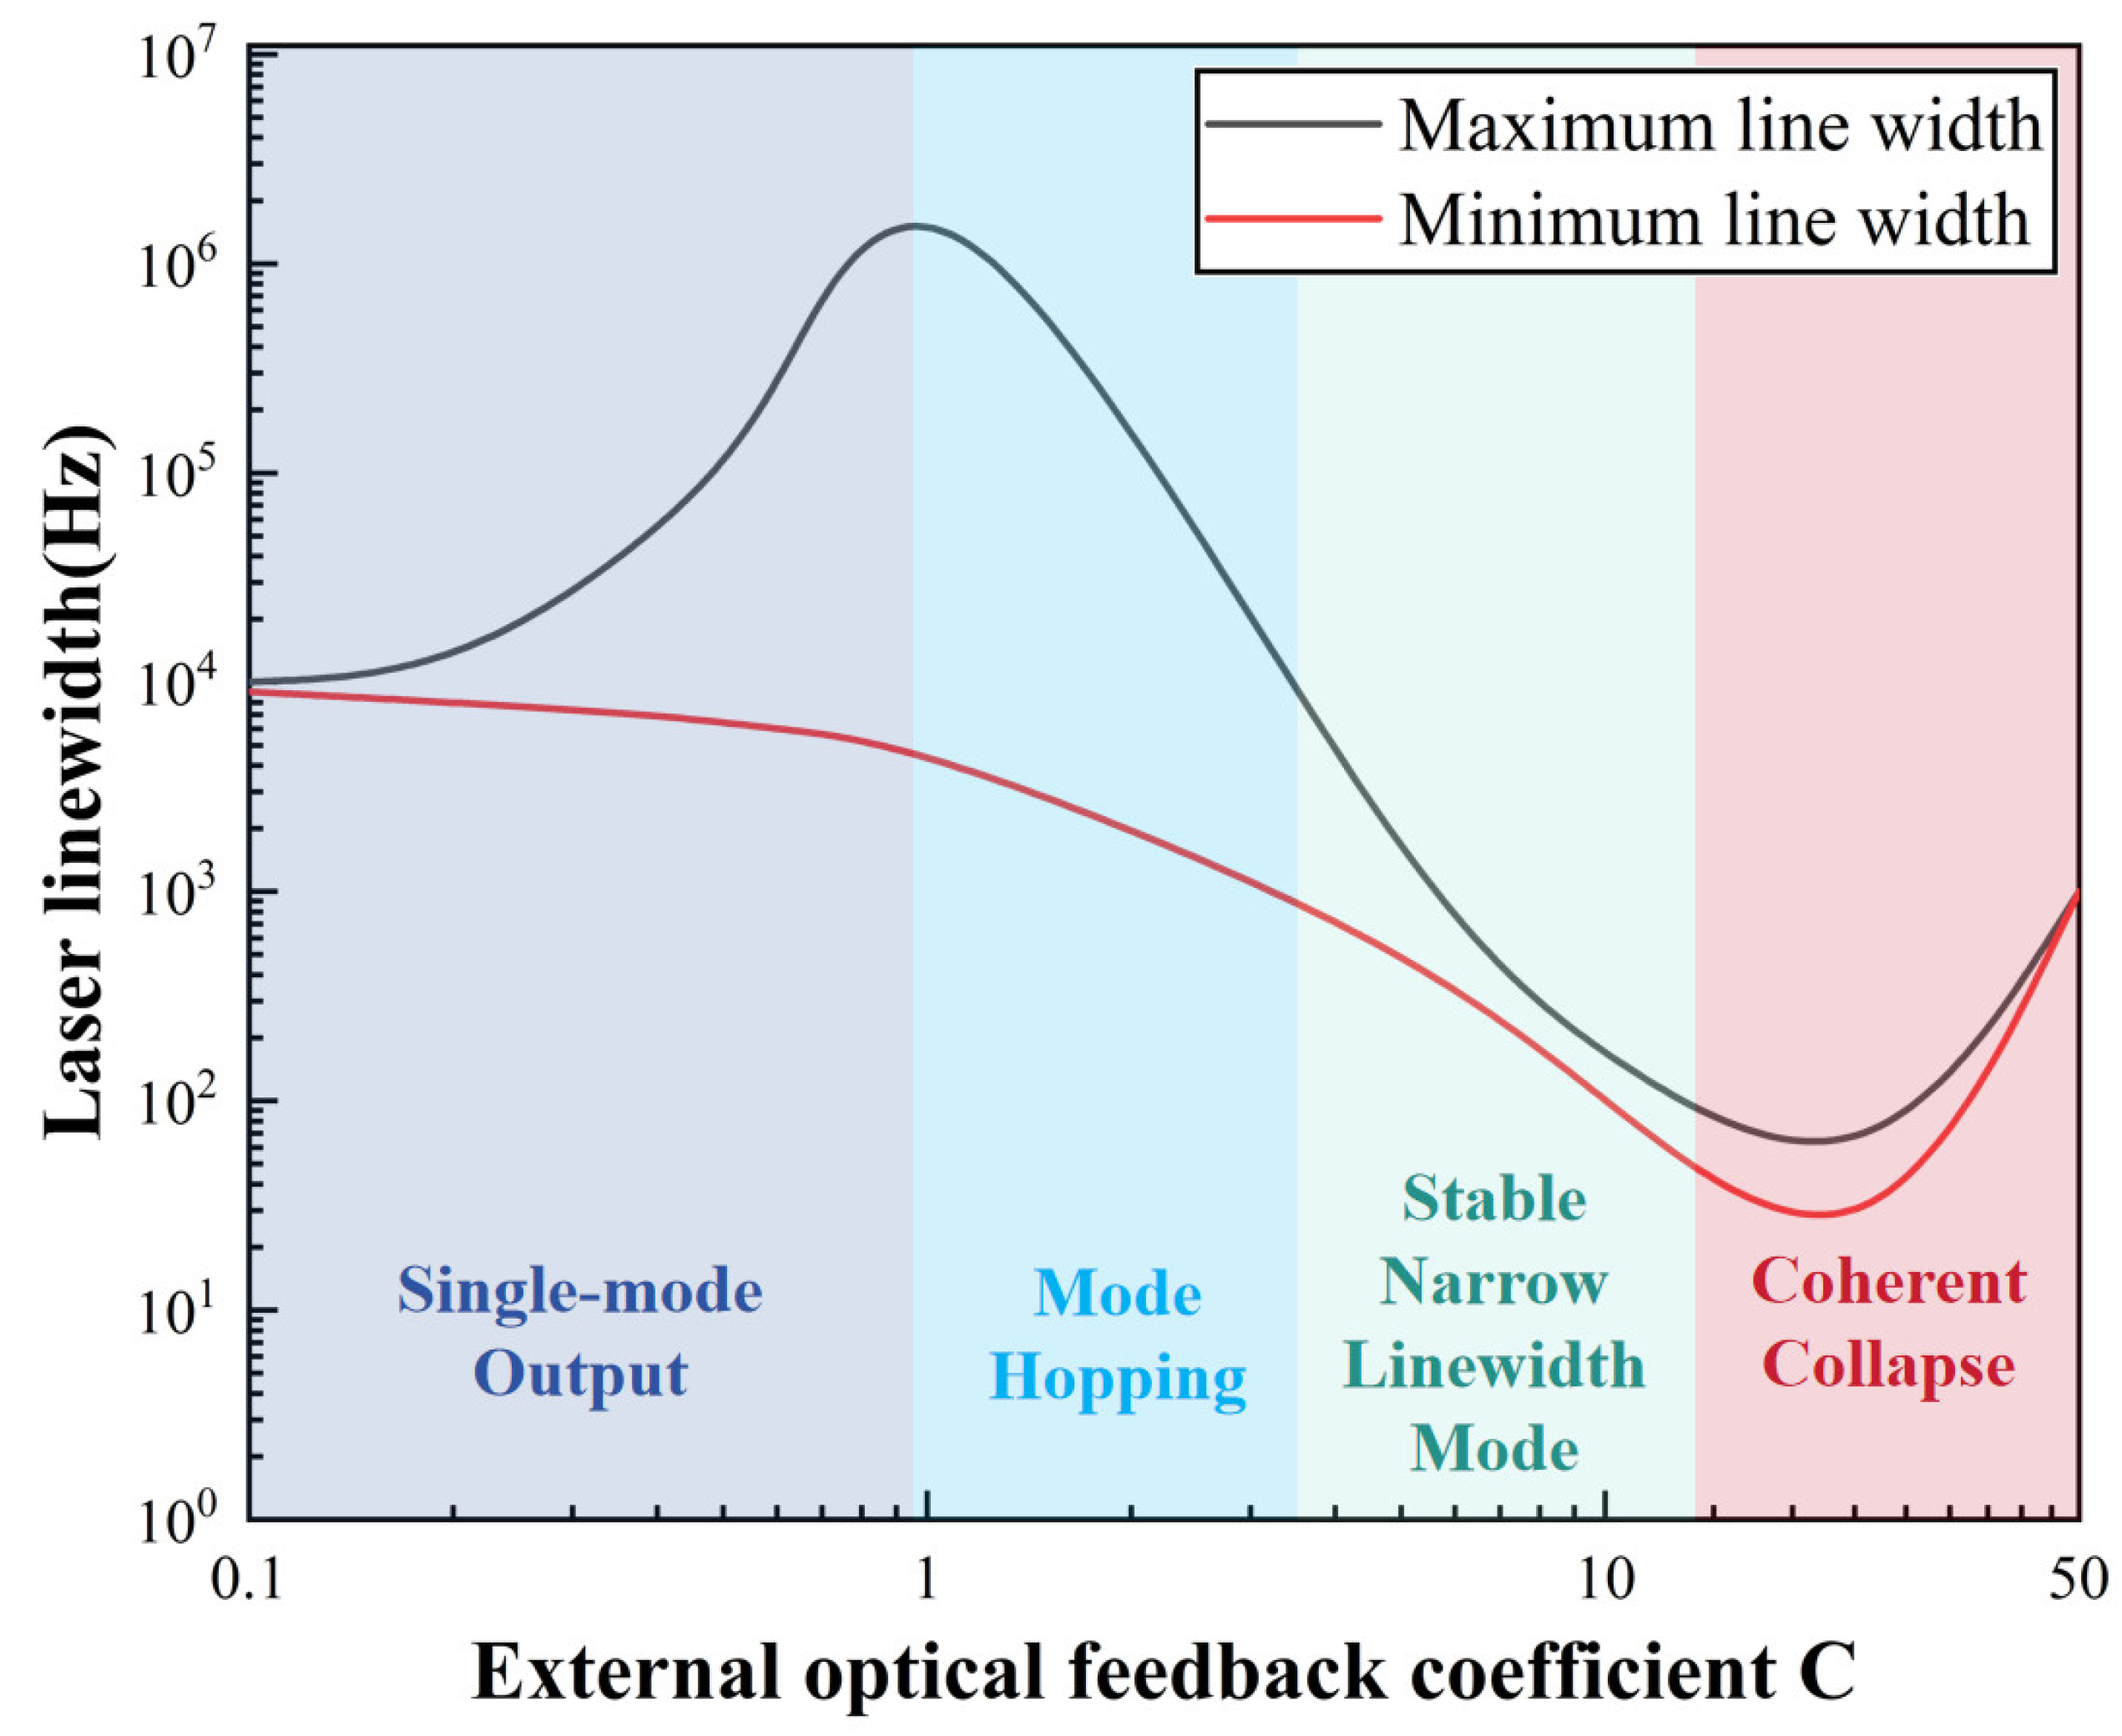
3.1. Feedback Optical Noise Mechanism

However, the polarization demodulation system has a large amount of noise. Rayleigh backscattering light is coupled into the DFB cavity due to the utilization of polarization devices and extended fibers, resulting in the formation of a new equivalent external cavity between the output end face of the cavity and the external reflection end face. The alteration of the phase condition of the laser resonance leads to the modification of the mode of the DFB laser and the stochastic variation of the output light intensity. This phenomenon is referred to as mode hopping noise.
Figure 4 shows the experimentally measured mode hopping noise. This type of noise occurs randomly and bears a resemblance to the partial discharge signal, which may lead to misinterpretation of equipment failure. Consequently, further investigation and elimination of this noise are necessary. The threshold gain of the laser will change the refractive index through the linewidth gain factor α [34]. The external optical feedback coefficient C is incorporated into the new expression for the external cavity mode to characterize this effect, as represented in Equation (4) [35].
C = 2 C e L e x t L c f e x t ( 1 + α 2 )
In this equation, Lext represents the optical path length of the feedback light, which can be considered equivalent to the guiding fiber length. Lc represents the length of the laser resonator, while fext denotes the external light reflectivity of the laser resonator during operation. Equation (5) presents the approximate expression for the output linewidth of a DFB laser with external optical feedback.
Δ f = Δ f 0 1 + C cos ( 2 π f τ e x t + arctan α ) 2
In this equation, Δf0 represents the linewidth of the DFB output laser without any external optical feedback. τext represents the external round-trip time of the output laser. The output linewidth of the DFB laser changes as the external optical feedback coefficient changes. This change results in the introduction of mode-hopping noise into the output laser of the DFB.
Figure 5 shows the output spectrum of the DFB laser in the presence of external optical feedback. Figure 5 simulates according to Formula (5) for scenes without external large amplitude interference. Figure 5a shows that the DFB laser exhibits a stable single longitudinal mode with an extremely narrow linewidth output in the absence of external optical feedback, or when the coupling coefficient (C) is significantly less than 1. It is a minimal effect of external optical feedback on the linewidth of the DFB laser in this scenario.
Figure 5b shows that the DFB spectrum generation mode splitting occurs when C exceeds 1. The principal mode centered at 1550 nm splits into multiple longitudinal modes. The power level of several splitting modes is close to the peak power of the spectrum. The results indicate that an increase in C will lead to mode hopping in the DFB spectrum. The laser is transformed from a stable single longitudinal mode output to a multi-longitudinal mode output with mode-hopping noise.
When the C value surpasses 30, this noise becomes significant. The resonant cavity structure of DFB cannot support the minimum linewidth mode of the output laser determined by external light feedback. This condition renders the output laser unstable. Consequently, the linewidth of the DFB output laser experiences not only explosive widening but also the introduction of severe relative intensity noise, a phenomenon referred to as the coherent collapse of the laser.
Theory of external optical feedback of the DFB Lasers not only provides a cogent explanation for the optical noise but also establishes a foundation for the noise suppression of DFB demodulation systems. The simplest and most effective solution is to install an optical isolation device after the output port of the wavelength division multiplexer (WDM) in the system. Ensure its proximity to the DFB laser by adjusting the positions of the optical isolator and WDM. It effectively reduces the impact of external light feedback in guiding optical fibers, making the C value close to zero. However, another solution with lower noise was found through a comprehensive analysis of external light feedback theory and numerical simulation of Equation (5).
Figure 6 shows the relationship between the maximum and minimum linewidths and the value of C. The output laser is in a single longitudinal mode when the value of c is less than 1. Although the maximum line width changes significantly, there is still only one mode in the output laser due to mode competition. Then, noise and multi-longitudinal mode output are generated in DFB lasers due to mode hopping, along with an increase in the parameter C. Next, the DFB laser demonstrates a stable and narrow linewidth mode, as the maximum and minimum linewidths gradually converge with a further increase in the parameter C. Finally, the linewidth of the DFB laser begins to increase rapidly when C exceeds 30. This results in significant intensity noise in the DFB laser, which is the phenomenon of coherent collapse.
Therefore, the linewidth of DFB can be stabilized by actively adjusting the intensity of external feedback light. DFB laser has modes with maximum and minimum linewidths that almost overlap when the external optical feedback coefficient C is between 5 and 30. This narrower linewidth mode helps to improve the pressure sensitivity of DFB lasers and suppresses mode-hopping noise.

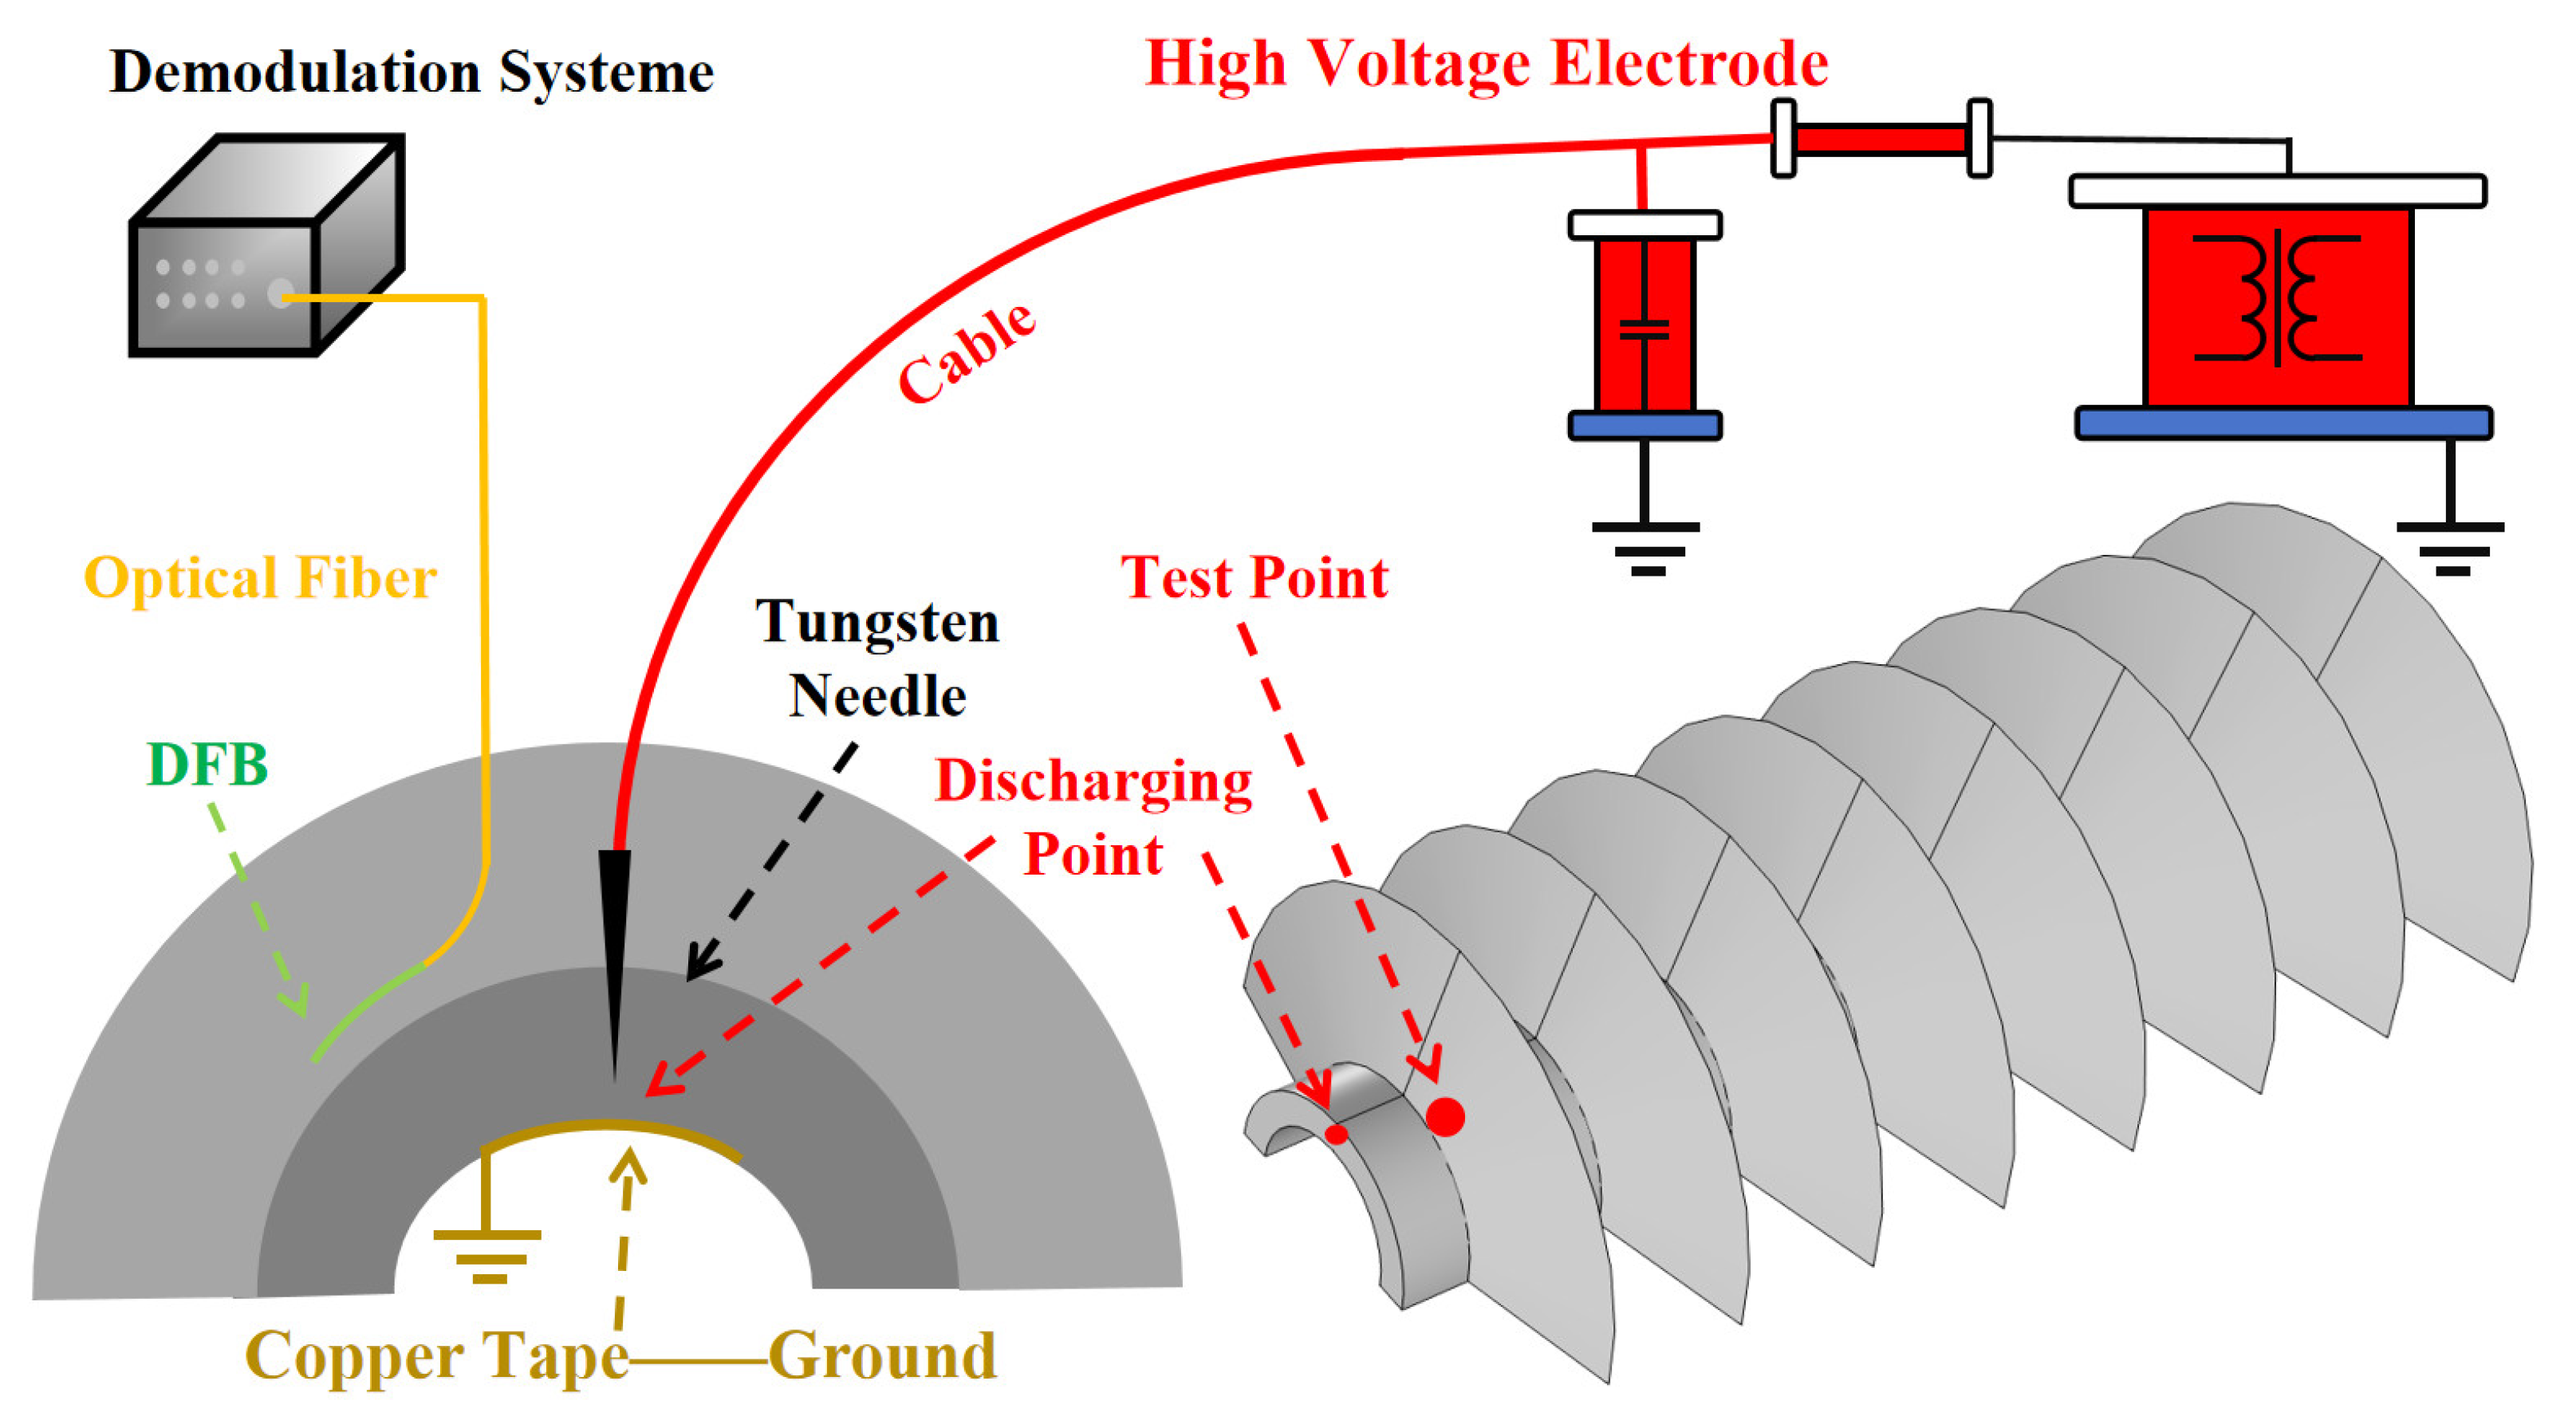
3.2. DFB Solid Insulation Partial Discharge Detection System

To make the DFB laser work at C ≈ 30, it requires more than 1 km of optical fiber, due to the external light reflectance caused by Rayleigh scattering being very weak. This length not only makes the system bulky but also leads to coherent collapse. The magnitude of the C value can be adjusted by controlling the intensity of the feedback light. Therefore, this study uses a 1 × 2 fiber coupler to install the fiber optic reflector into the optical path to obtain high-intensity feedback light. The intensity of the feedback light is adjusted by an attenuator to ensure the DFB demodulation system is operating stably within a low noise mode.
Figure 7 shows the structure of the active feedback optical injection DFB noise suppression system. The system is divided into three components: signal acquisition, noise abatement, and signal demodulation. The signal acquisition process involves stimulating the DFB laser to emit a 1550 nm laser using a 980 nm pump laser (Made by Si Chuan Zi Guan Photonics Technology Co., Ltd., Mianyang, China). Then, noise reduction is achieved by actively injecting feedback light into the DFB laser through a coupler and reflector. Finally, the signal is demodulated using a polarizer.
Figure 8a shows the system’s output optical noise. The average noise amplitude is around 2 to 3 V, with a duration of 1–2 ms. This is because the DFB laser is continuously affected by optical feedback, causing significant power fluctuations in the output of the DFB demodulation system. Figure 8b shows the output optical noise of the system after noise suppression. The noise amplitude is less than 100 mV, and there is no obvious amplitude fluctuation. In addition, there are still some fluctuations when the pump power is sufficient. However, the frequency of the fluctuations reaches several megahertz, far exceeding the frequency band of partial discharge. It can be eliminated by using a filter.
Figure 9 shows the noise comparison experiment between this system and the unbalanced interferometer demodulation system. The output light intensity of the two systems is controlled to be consistent, and both are filtered. Figure 9a shows the noise level of the demodulation system of the unbalanced interferometer. The system exhibits typical mode-hopping noise with an amplitude of 2–3 V. In addition, the noise frequency is within the partial discharge detection band and cannot be eliminated by filters. Figure 9b shows the noise level of the polarization demodulation system. The noise average amplitude is less than 100 mV. Due to the injection of external optical feedback, the stability of the DFB linewidth is achieved. The results showed the polarization heterodyne demodulation system is better suited for partial discharge detection.

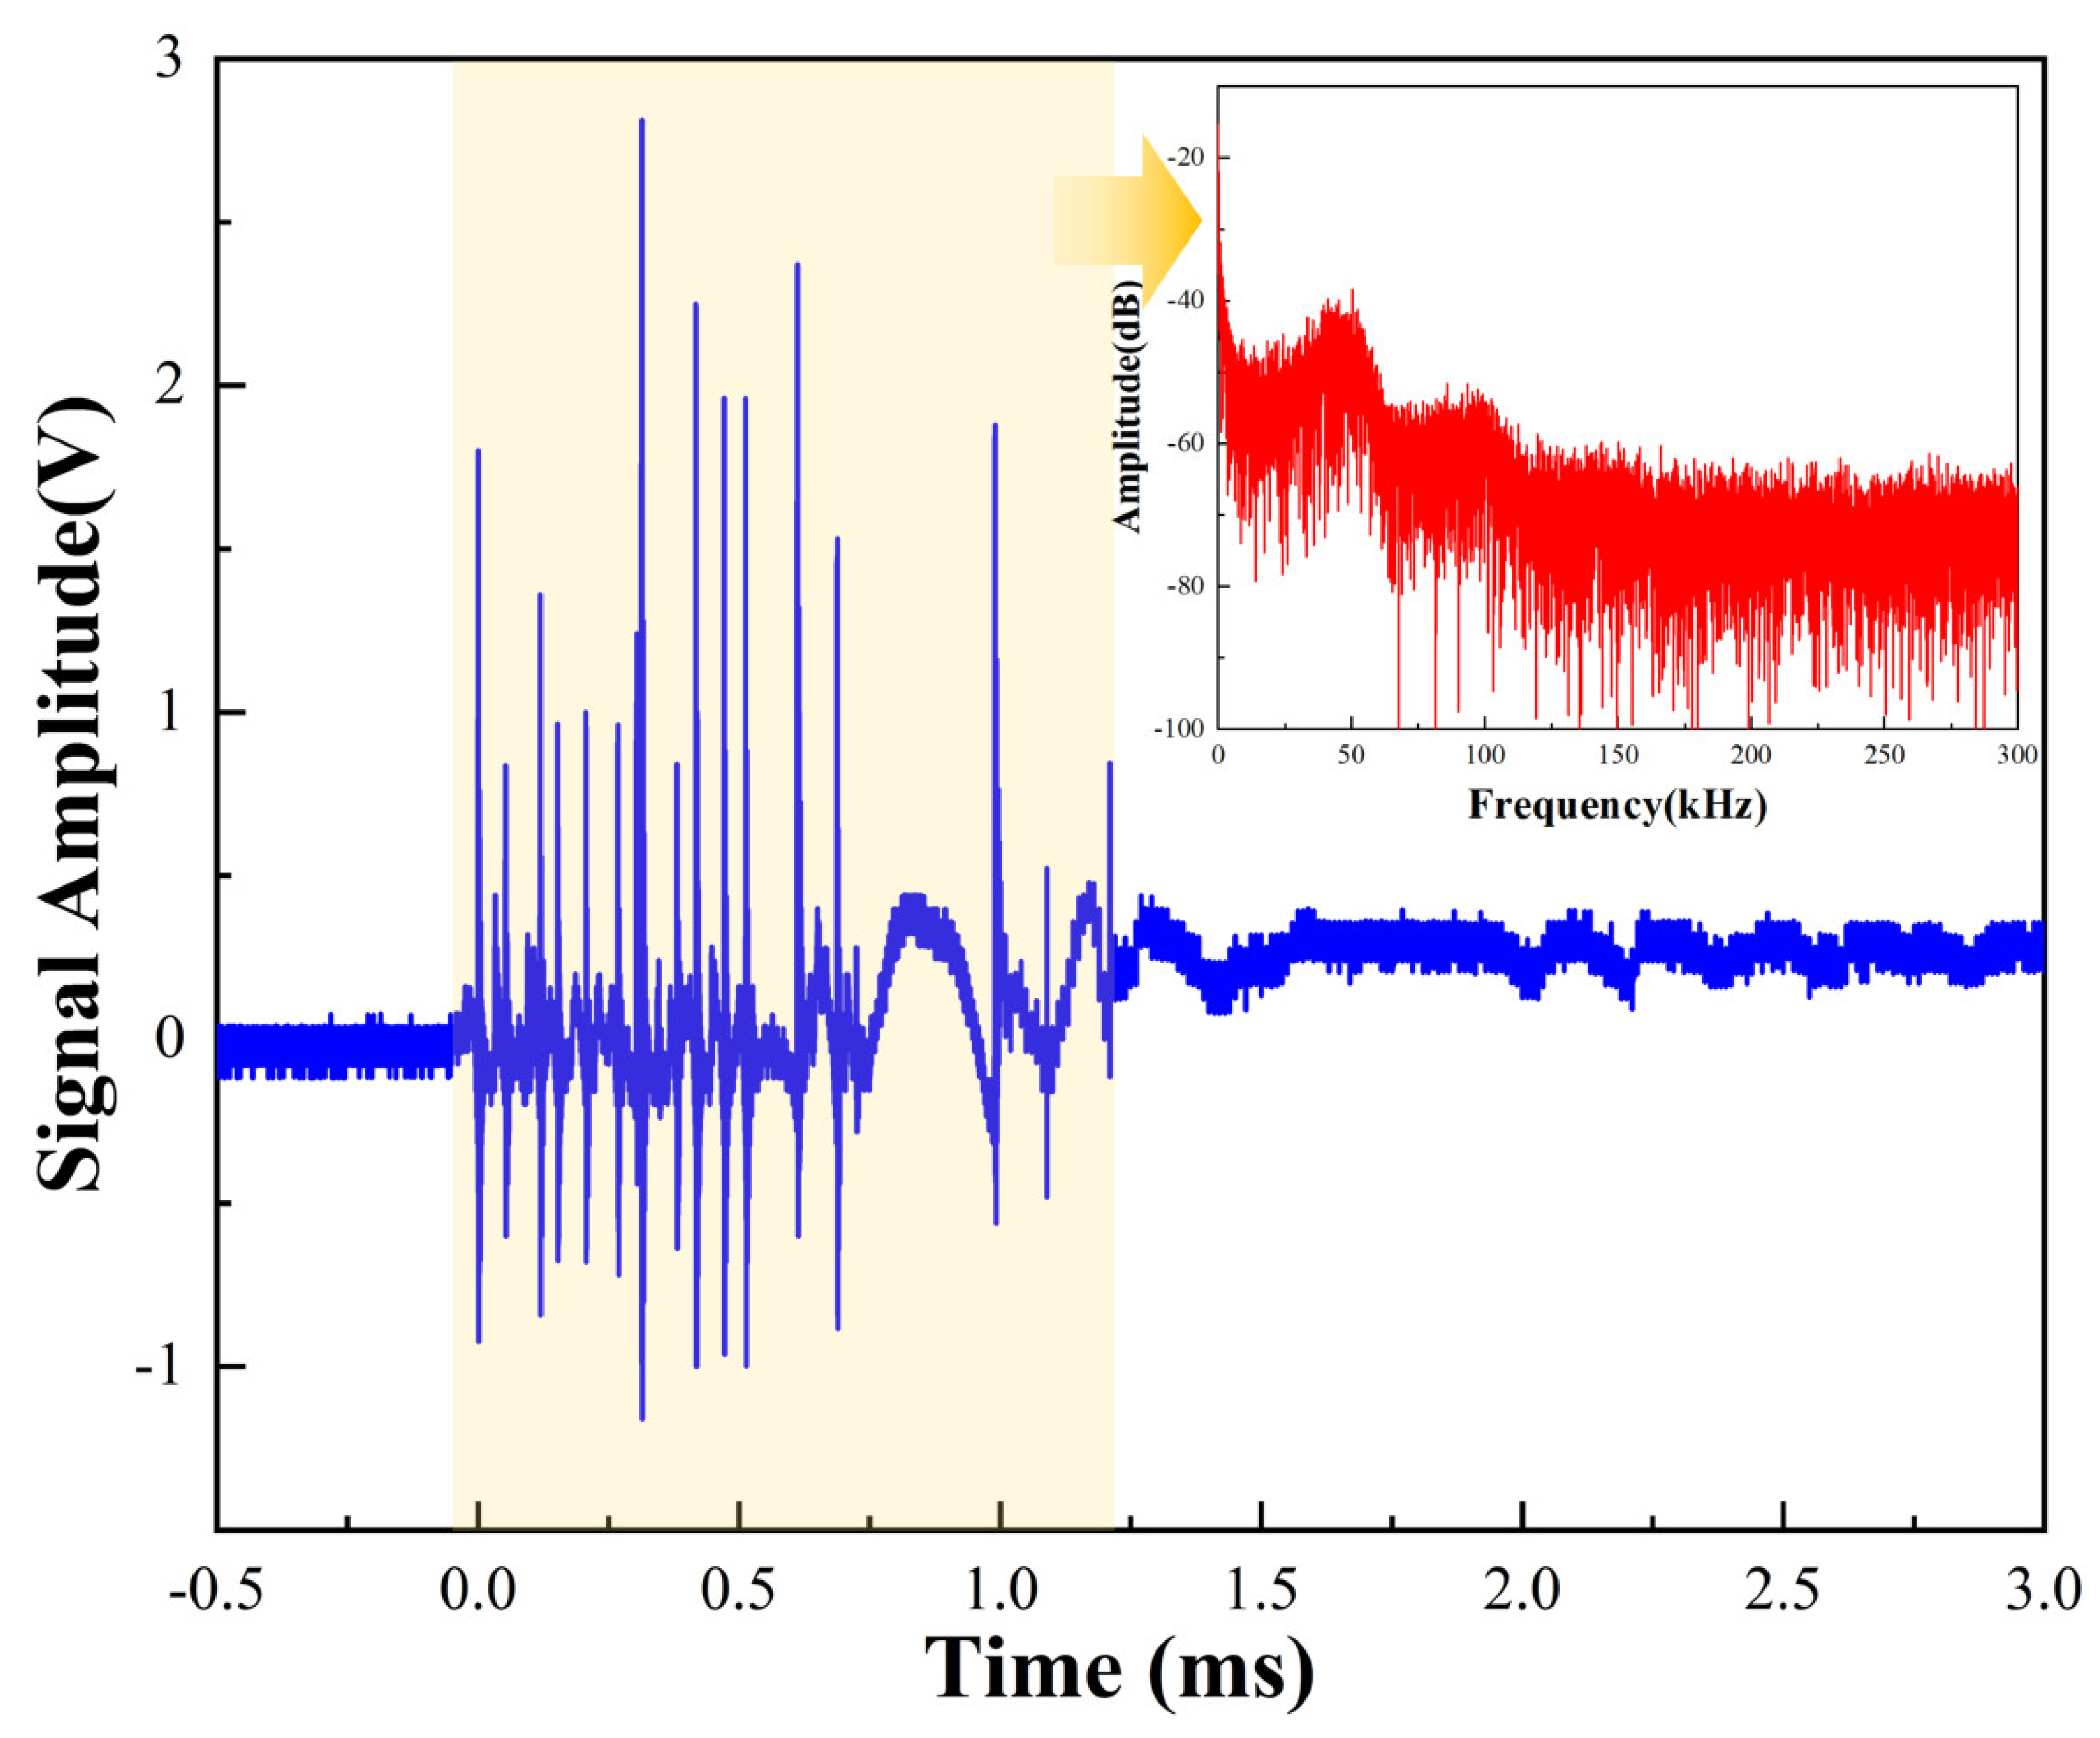
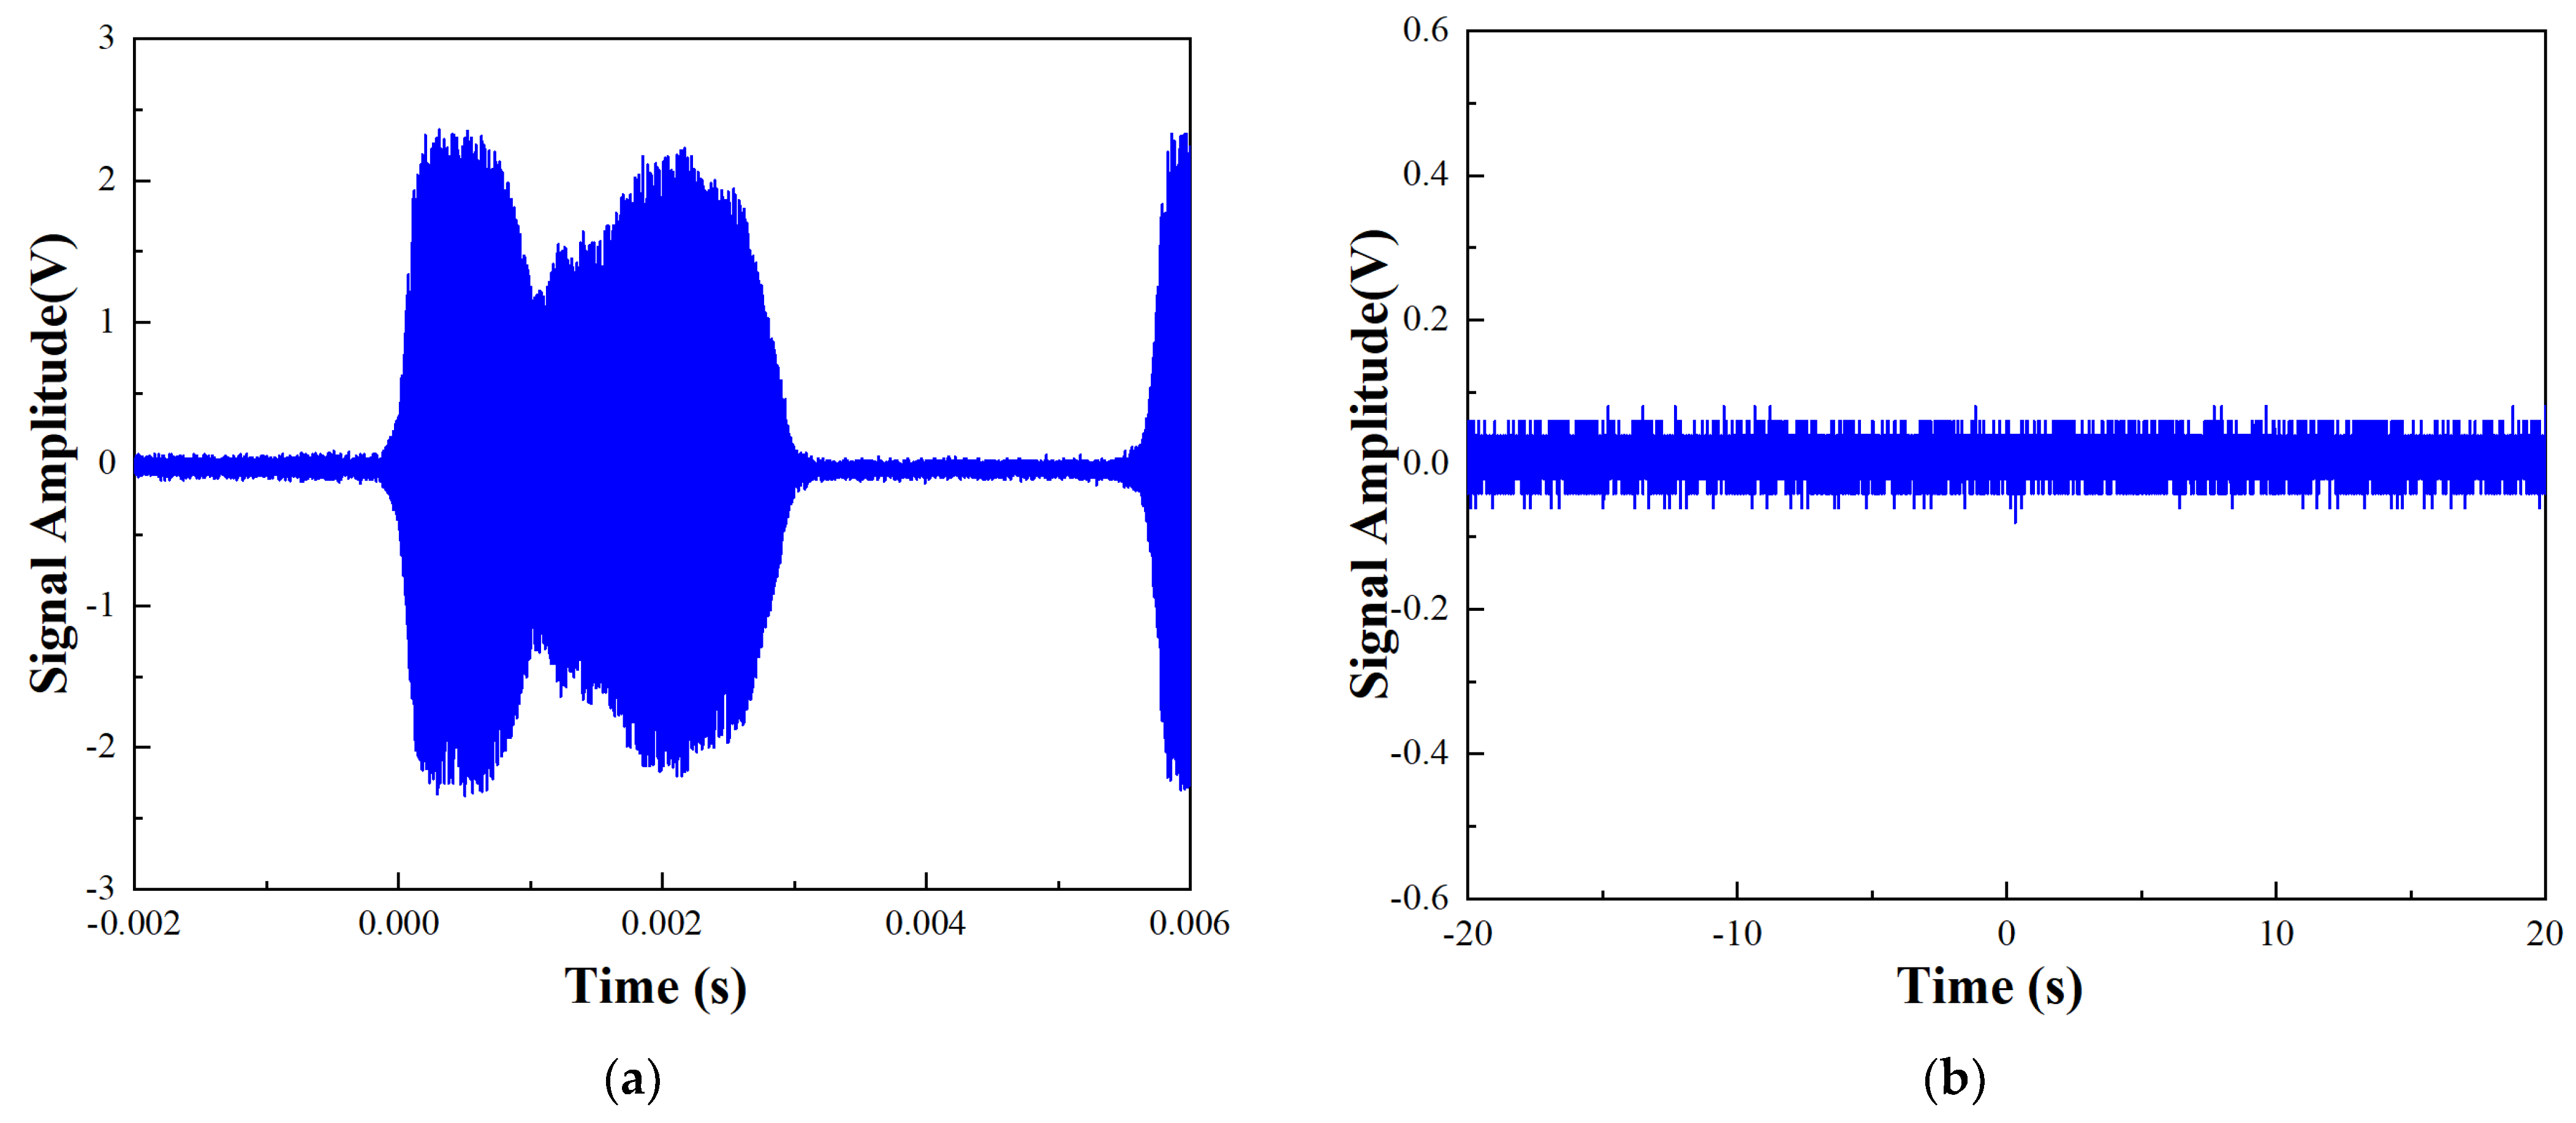
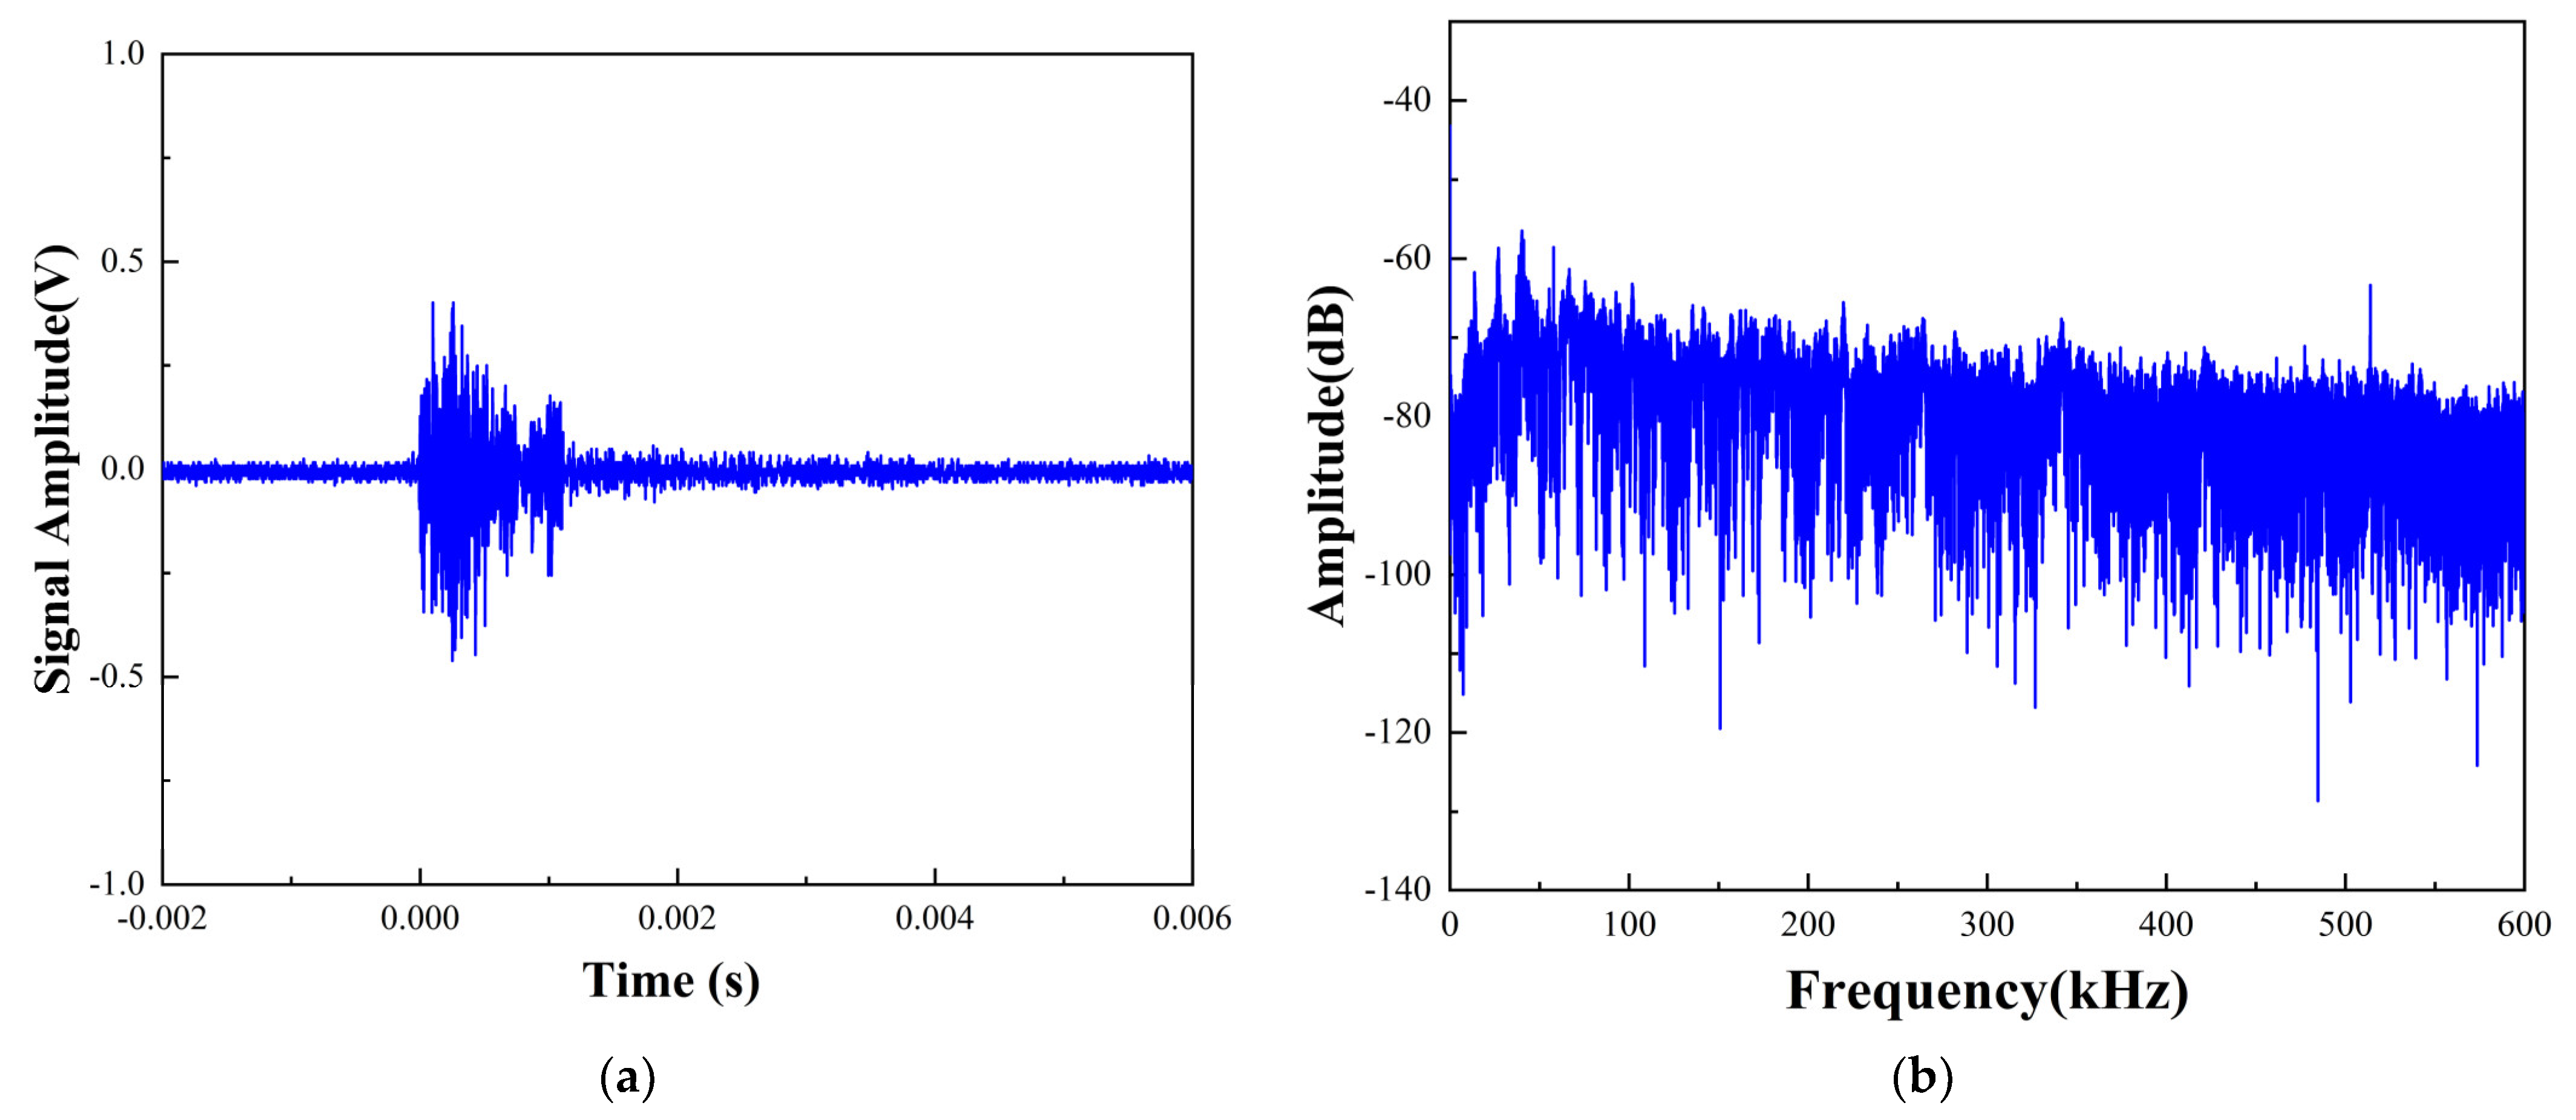
4. Partial Discharge Experimental Test

To verify the partial discharge detection performance of the system, a solid insulating PD detection experimental platform has been built. The rubber insulator sheds were chosen for experimental verification. Due to the excellent sound transmission performance of silicone rubber, it has the greatest potential in partial discharge detection.
Figure 10 shows the partial discharge testing platform. A tungsten needle electrode was vertically inserted into the rubber insulator sheds, and the other end of the tungsten needle was connected to the high-voltage generator. The ground potential was established using a copper strip. The tip of the tungsten needle is approximately 4–5 mm from the ground potential. The DFB fiber was applied to the surface of the silicone rubber shed, and acoustic coupling was achieved using a gel coupling agent. The demodulation system was connected to the oscilloscope through a photoelectric converter to capture the acoustic signal of partial discharge.
In the experiment, the voltage is increased using a high-voltage power supply, causing the tungsten to discharge inside the rubber model. The test voltage gradually increased from zero to 10 kV at a rate of 0.5 kV/s and then remained constant.
Figure 11 shows the test results of partial discharge. The time domain of the signal exhibits the characteristics of a typical partial discharge signal with oscillation attenuation. There are multiple peaks within a small range. This phenomenon arises from the complex structure of the shed, which causes the sound signal to undergo multiple reflections and superpositions. Figure 11b shows the frequency domain. The frequency of the detected signal decreases as the frequency increases. This discrepancy can be attributed to the viscoelastic nature of the polymer, which leads to a significant attenuation of the high-frequency component. Consequently, the majority of signals detected by the DFB system are low-frequency signals. Solid discharge frequency is lower compared to liquid discharge. However, the frequency of the partial discharge ultrasonic wave generated in the silicone rubber is higher, ranging from 10 to 100 kHz, with a peak frequency of approximately 60 kHz. Moreover, the frequency data gathered by DFB are extensive due to their exceptional frequency response characteristics. It has potential advantages in the pattern recognition of different types of partial discharges.
Figure 12 shows the analysis results using short-time Fourier transform. The system noise is almost zero within the partial discharge frequency band before partial discharge occurs, which is attributed to the influence of the external optical feedback structure. The frequency component of the PD signal starts to rapidly increase when the oscilloscope triggers. The frequency band of the signal is significantly different from the noise frequency band. Therefore, it can be concluded that the polarized light demodulation system with active feedback exhibits a strong capability for detecting solid insulation.

5. Conclusions

In this paper, we propose a polarized light demodulation system based on external optical feedback for detecting partial discharge in solid insulation. This system addresses complexity and optical noise issues associated with traditional unbalanced interferometer demodulation systems.
External optical feedback noise is analyzed through comprehensive simulations and experiments. The relationship between the external optical feedback coefficient and the DFB output beam width is established by introducing the concept of external optical feedback coefficient C. We suggest actively introducing feedback light to achieve a C value near 30, which reduces the optical feedback noise of the system.
To construct a low-noise polarization heterodyne demodulation system, we propose using a mirror and a 1 × 2 coupler to create an external optical feedback modulation structure. The experimental results demonstrate that the system effectively detects solid insulation partial discharge, and the introduction of optical feedback significantly improves the noise level of the system.
However, it is important to note that this paper specifically focuses on rubber materials with better sound transmission performance. The partial discharge detection performance of traditional insulation materials, such as cross-linked polyethylene, still requires further exploration. In the future, we plan to optimize the detection performance of this system for a wider range of insulation materials.

Author Contributions

Conceptualization, Z.Z. and Z.L.; methodology, Z.Z.; validation, Z.Z. and Z.L.; formal analysis, J.H.; investigation, L.C.; resources, L.T. and M.X.; data curation, Z.Z. and Z.L.; writing—original draft preparation, Z.Z., J.H., Z.L., M.X. and L.C.; writing—review and editing, Z.Z., J.H. and L.C.; visualization, M.X. and L.C.; supervision, J.H.; project administration, Z.Z. All authors have read and agreed to the published version of the manuscript.

Funding

This research was funded by [China Electric Power Research Institute (CEPRI)] grant number [SZ83-24-005], and the APC was funded by [China Electric Power Research Institute (CEPRI)].

Data Availability Statement

Data are contained within the article.

Conflicts of Interest

Authors Zhenpeng Zhang, Zhengbo Liang, Junping Hou, Li chen, Lin Tang, and Mingzhong Xu were employed by the China Electric Power Research Institute, Wuhan 430074, China. The authors declare that the research was conducted in the absence of any commercial or financial relationships that could be construed as potential conflicts of interest.

References

  1. Yaacob, M.M. Review on Partial Discharge Detection Techniques Related to High Voltage Power Equipment Using Different Sensors. Photonic Sens. 2014, 4, 325–337. [Google Scholar] [CrossRef]
  2. Álvarez, F.; Garnacho, F.; Ortego, J.; Sánchez-Urán, M.Á. Application of HFCT and UHF sensors in on-line partial discharge measurements for insulation diagnosis of high voltage equipment. Sensors 2015, 15, 7360–7387. [Google Scholar] [CrossRef] [PubMed]
  3. Casals-Torrens, P.; González-Parada, A.; Bosch-Tous, R. Online PD detection on high voltage underground power cables by acoustic emission. Procedia Eng. 2012, 35, 22–30. [Google Scholar] [CrossRef]
  4. Meitei, S.N.; Borah, K.; Chatterjee, S. Partial Discharge Detection in an Oil-Filled Power Transformer Using Fiber Bragg Grating Sensors: A Review. IEEE Sens. J. 2021, 21, 10304–10316. [Google Scholar] [CrossRef]
  5. Lee, J.-R.; Tsuda, H. A novel fiber Bragg grating acoustic emission sensor head for mechanical tests. Scr. Mater. 2005, 53, 1181–1186. [Google Scholar] [CrossRef]
  6. Lai, M.; Karalekas, D.; Botsis, J. On the effects of the lateral strains on the fiber Bragg grating response. Sensors 2013, 13, 2631–2644. [Google Scholar] [CrossRef]
  7. Shi, C.; Ma, G.; Mao, N.; Zhang, Q.; Zheng, Q.; Li, C.; Zhao, S. Ultrasonic detection coherence of fiber Bragg grating for partial discharge in transformers. In Proceedings of the 2017 IEEE 19th International Conference on Dielectric Liquids (ICDL), Manchester, UK, 25–29 June 2017; pp. 1–4. [Google Scholar]
  8. Ghorat, M.; Gharehpetian, G.B.; Latifi, H.; Hejazi, M.A.; Bagheri, M. High-resolution FBG-based fiber-optic sensor with temperature compensation for PD monitoring. Sensors 2019, 19, 5285. [Google Scholar] [CrossRef]
  9. Fu, X.; Lu, P.; Zhang, J.; Qu, Z.; Zhang, W.; Li, Y.; Hu, P.; Yan, W.; Ni, W.; Liu, D.; et al. Micromachined extrinsic Fabry-Pérot cavity for low-frequency acoustic wave sensing. Opt. Express 2019, 27, 24300–24310. [Google Scholar] [CrossRef]
  10. Lin, C.; Huang, Y.Q.; Lei, W.; Ye, X.J. A Novel Fabry-Perot Cavity Fiber Sensor. Phys. Procedia 2012, 33, 1939–1946. [Google Scholar] [CrossRef]
  11. Li, C.; Qi, H.; Han, X.; Zhao, X.; Zhang, Y.; Huang, J.; Peng, W.; Chen, K. Ultrahigh-speed phase demodulation of a Fabry–Perot sensor based on fiber array parallel spectral detection. Opt. Lett. 2024, 49, 714–717. [Google Scholar] [CrossRef]
  12. Sun, Y.; Lv, A.; Xie, Z.; Li, Y.; Yan, K. Impact analysis of fiber optic rings on partial discharge parameters. Meas. Sci. Technol. 2024, 36, 016037. [Google Scholar] [CrossRef]
  13. Wang, Y.; Li, X.; Gao, Y.; Zhang, H.; Wang, D.; Jin, B. Partial discharge ultrasound detection using the Sagnac interferometer system. Sensors 2018, 18, 1425. [Google Scholar] [CrossRef] [PubMed]
  14. Zhou, H.-Y.; Ma, G.-M.; Zhang, M.; Zhang, H.-C.; Li, C.-R. A High Sensitivity Optical Fiber Interferometer Sensor for Acoustic Emission Detection of Partial Discharge in Power Transformer. IEEE Sens. J. 2021, 21, 24–32. [Google Scholar] [CrossRef]
  15. Zhao, Z.; Macalpine, M.; Demokan, M.S. The directionality of an optical fiber high-frequency acoustic sensor for partial discharge detection and location. J. Light. Technol. 2000, 18, 795–806. [Google Scholar] [CrossRef]
  16. Ghosh, B.; Mandal, S. Mathematical Modeling of π-Phase-Shifted Fiber Bragg Grating and its Application for Strain Measurement in Epoxy Resin Cantilever Beam. IEEE Sens. J. 2020, 20, 9856–9863. [Google Scholar] [CrossRef]
  17. Ma, G.M.; Zhou, H.Y.; Shi, C.; Li, Y.B.; Zhang, Q.; Li, C.R.; Zheng, Q. Distributed Partial Discharge Detection in a Power Transformer Based on Phase-Shifted FBG. IEEE Sens. J. 2018, 18, 2788–2795. [Google Scholar] [CrossRef]
  18. Qiao, J.; Zhang, W.; Chen, Q.; Wang, X.; Zhao, H. DFB-FL Applied in the Liquid-Solid Composite Dielectric for Ultra-High Sensitive Partial Discharge Acoustic Emission Detection. IEEE Sens. J. 2021, 21, 20960–20968. [Google Scholar] [CrossRef]
  19. Zhang, W.C.; Yu, Q.; Chen, Q.C.; Shao, Q.B.; Qiao, J.X.; Zhao, H. Single Arm Optical Fiber Interferemeter Technology for Partial Discharge Acoustic Detection. IEEE Trans. Dielectr. Electr. Insul. 2024, 31, 3083–3091. [Google Scholar] [CrossRef]
  20. Shao, Q.; Zhang, W.-C.; Yu, Q.; Zhao, H. The effect of polymer material properties on partial discharge vibration signals using EYDF-πPSG. IEEE Trans. Instrum. Meas. 2024, 73, 3527810. [Google Scholar] [CrossRef]
  21. Qiao, J.; Zhang, W.; Wang, Y.; Zhao, H. Improved demodulation method for fibre optic sensors applied in transformer partial discharge detection. High Volt. 2023, 8, 445–454. [Google Scholar] [CrossRef]
  22. Qiao, J.; Zhang, W.; Liu, S.; Wu, H.; Zhao, H. DFB Fiber Laser Based on External Optical Feedback Theory Applied in Long-Distance Power Transformer Partial Discharge Detection. IEEE Sens. J. 2022, 22, 11747–11755. [Google Scholar] [CrossRef]
  23. Qiao, J.; Zhang, W.; Wang, Y.; Shao, Q.; Cai, J.; Zhao, H. Ultra-High SNR Demodulation Method for Optical Fiber Sensors Applied in Power Transformer Partial Discharge Detection. Sensors 2022, 22, 2828. [Google Scholar] [CrossRef] [PubMed]
  24. Tan, Y.N.; Zhang, Y.; Jin, L.; Guan, B.O. Simultaneous strain and temperature fiber grating laser sensor based on radio-frequency measurement. Opt. Express 2011, 19, 20650–20656. [Google Scholar] [CrossRef] [PubMed]
  25. Lau, G.S.T.; Shao, L.Y.; Chan, H.L.W.; Tam, H.Y.; Hu, C.H.; Kim, H.H.; Liu, R.; Shung, K.K. Characterization of a 40-MHz focused transducer with a fiber grating laser hydrophone. IEEE Trans. Ultrason. Ferroelectr. Freq. Control 2009, 55, 2714–2718. [Google Scholar]
  26. Guo, T.; Wong, A.C.L.; Liu, W.; Guan, B.O.; Lu, C.; Tam, H.Y. Beat-frequency adjustable Er-doped DBR fiber laser for ultrasound detection. Opt. Exp. 2011, 19, 2485–2492. [Google Scholar] [CrossRef]
  27. Liu, D.; Liang, Y.; Jin, L.; Sun, H.; Cheng, L.; Guan, B.O. Highly sensitive fiber laser ultrasound hydrophones for sensing and imaging applications. Opt. Lett. 2016, 41, 4530–4533. [Google Scholar] [CrossRef]
  28. Zhang, F.; Zhang, W.; Li, F.; Liu, Y. DFB fiber laser hydrophone with bandpass response. Opt. Lett. 2011, 36, 4320–4322. [Google Scholar] [CrossRef]
  29. Lam, D.K.W.; Garside, B.K. Characterization of single-mode optical fiber filters. Appl. Opt. 1981, 20, 440. [Google Scholar] [CrossRef]
  30. Ball, G.A.; Glenn, W.H. Design of a single-mode linear-cavity erbium fiber laser utilizing Bragg reflectors. J. Light. Technol. 1992, 10, 1338–1343. [Google Scholar] [CrossRef]
  31. Zhang, Y.; Guan, B.-O.; Tam, H. Distributed bragg-reflector fiber-laser sensor for lateral force measurement. In Proceedings of the 2007 Asia Optical Fiber Communication and Optoelectronics Conference, Shanghai, China, 17–19 October 2007; pp. 180–182. [Google Scholar]
  32. Guan, B.-O.; Sun, X.-S.; Tan, Y.-N. Dual polarization fiber grating laser accelerometer. In Proceedings of the (EWOFS’10) Fourth European Workshop on Optical Fibre Sensors, Porto, Portugal, 8–10 September 2010; Santos, J.L., Culshaw, B., López-Higuera, J.M., MacPherson, W.N., Eds.; SPIE: Bellingham, WA, USA, 2010; p. 76530Z. [Google Scholar]
  33. Chan, H.L.W.; Chiang, K.S.; Price, D.C.; Gardner, J.L. The characterization of high-frequency ultrasonic fields using a polarimetric optical fiber sensor. J. Appl. Phys. 1989, 66, 1565–1570. [Google Scholar] [CrossRef]
  34. Henry, C. Theory of the linewidth of semiconductor lasers. IEEE J. Quantum Electron. 1982, 18, 259–264. [Google Scholar] [CrossRef]
  35. Acket, G.; Lenstra, D.; Den Boef, A.; Verbeek, B. The influence of feedback intensity on longitudinal mode properties and optical noise in index-guided semiconductor lasers. IEEE J. Quantum Electron. 1984, 20, 1163–1169. [Google Scholar] [CrossRef]
Figure 1. The structure of DFB.
Energies 18 00955 g001
Figure 2. DFB simulation spectrum.
Energies 18 00955 g002
Figure 3. Principle of the polarization demodulation system.
Energies 18 00955 g003
Figure 4. Time domain diagram of mode hopping noise. Signal time domain graph is represented in blue, signal frequency domain graph is represented in red.
Energies 18 00955 g004
Figure 5. DFB simulation spectrum under external optical feedback. (a) is the case when the C value is less than 1, and (b) is the case when the C value is greater than 1.
Energies 18 00955 g005
Figure 6. The relationship between external optical feedback coefficient and DFB linewidth.
Energies 18 00955 g006
Figure 7. Active feedback optical injection DFB noise suppression system.
Energies 18 00955 g007
Figure 8. DFB system output results. (a) The signal before noise reduction; (b) the system output after noise reduction.
Energies 18 00955 g008
Figure 9. Noise comparison experimental results. (a) The polarization heterodyne demodulation system; (b) the unbalanced interferometer demodulation system.
Energies 18 00955 g009
Figure 10. Silicone rubber partial discharge test platform.
Energies 18 00955 g010
Figure 11. Partial discharge test results, where (a) is the signal time domain diagram and (b) is the signal frequency domain diagram.
Energies 18 00955 g011
Figure 12. Signal time–frequency analysis results, where (a) is the time–frequency contour map and (b) is the three-dimensional presentation of the results.
Energies 18 00955 g012
Disclaimer/Publisher’s Note: The statements, opinions and data contained in all publications are solely those of the individual author(s) and contributor(s) and not of MDPI and/or the editor(s). MDPI and/or the editor(s) disclaim responsibility for any injury to people or property resulting from any ideas, methods, instructions or products referred to in the content.

