Abstract
The increasing uncertainties and model computational complexity of large-scale power system state estimation have led to the emergence of a class of multi-source metrology devices to provide vector data for the grid to improve the observability. Considering the difficult problem of optimizing the configuration of multi-source measurement devices due to the large number of nodes, a distributed optimal configuration framework for multi-source measurement data is proposed. First, based on the concepts of sensitivity and electrical distance, the sensitivity electrical distance is derived and the power system is partitioned using the improved community partitioning principle; considering the problem of partitioning information exchange, synchronized phase measurement units are configured at the boundary nodes. Secondly, within the aforementioned partition, the optimal configuration of feeder terminal units and smart meters is carried out by combining the requirements of zero-injection nodes and viewability. Finally, the proposed method is verified in the IEEE33 node example, and the results show that the proposed method significantly reduces the configuration cost of the equipment on both sides of the system while guaranteeing the system viewability, which is highly feasible and economical.
1. Introduction
With the continuous advancement of the construction of new power system engineering, the distribution network is faced with the status quo of increased feeder branches and increased densification of load nodes, which exacerbates the imbalance and randomness of the grid output, giving rise to phenomena such as bidirectional flow of power and voltage fluctuations [1,2]. At the same time, the complex and changeable external environment is also prone to changing the values of line parameters, and these factors lead to problems such as low credibility of the estimation results of the SCADA system for distribution networks and low computational efficiency. Therefore, a new class of high-performance intelligent energy measurement equipment has emerged. Raw measurement data mainly include distribution network pseudo measurement data and real-time measurement data collected by synchronized phase measurement units (PMUs), feeder terminal units (FTUs), smart meters (SMs), etc., which can be used to form a multi-source measurement dataset and be used as inputs for interval state estimation [3,4]. How to configure the multi-source measurement devices to ensure the credibility of the distribution network state estimation by considering uncertainties such as lines is one of the urgent problems to be solved in building the current distribution network situational awareness system [5,6].
In order to improve the performance of the subsequent distribution network state estimation algorithm, the distributed solution of the power system is introduced into the solution of the multi-source measurement device configuration problem, which can ensure the accuracy of the state estimation results and improve the overall computational efficiency of the algorithm [7,8]. Partitioning the system according to the network topology [9] can reduce the complexity of the subsequent state estimation of each subregion, but this method cannot adapt to the complex power grid environment. In the distribution network measurement system, the full measurement configuration is used as the boundary to decoupage the distribution network feeder [10], and the partition is used as an independent analysis unit for state estimation, which greatly simplifies the complexity of the partition decoupling, but it needs to rely on a large amount of measurement equipment, and it is not cheap. The distribution network was decomposed into multiple subregions [11] by using the multi-criterion partition optimization model, and the complex active distribution network partition model was established, and the calculation speed and accuracy of state estimation of each subregion after the partition were also taken into account, effectively improving the calculation speed of state estimation. However, the model complexity is high, and the solving time increases exponentially with the system scale. It is difficult to apply to large-scale power grids; using the switch position in partitioning [12] can ensure that the partition results are still valid after the topology change, but it is highly dependent on the accuracy of the switch information. If the switch fails, the robustness of the partition scheme will be significantly reduced. Another distribution network partitioning method based on node degree search can also reduce the difficulty of solving the distribution network model [13]. The network is divided into radiating branch subnets, single ring networks, and complex ring networks to form multiple subregions, but the influence of electrical parameters on the partitioning results is not considered. At present, it is also a relatively common method to analyze network topology based on graph theory knowledge, establish a network adjacency matrix and assign weight to each branch [14], take the fewest connections between subregions as the objective function, and use the K-means algorithm to complete distribution network partitioning. However, weight definition relies on manual experience and lacks clear electrical significance. The methods adopted in these studies have certain limitations, and the partition scheme is easily affected by factors such as measurement or switch position, so it is difficult to obtain the optimal partition scheme. Therefore, the optimization model based on the parameters of the power system can be established to complete the grid partition by solving and avoid the influence of other factors in order to ensure the optimality of the partition scheme.
Research on the configuration of multi-source measurement equipment is mostly seen in transmission grids. With network observability as the constraint condition [15], the minimum number of PMUs as the first objective, and the lowest cost as the second objective, an imperial competitive optimization algorithm is used to optimize the configuration position of equipment, and the configuration scheme with the lowest cost and higher observability can be found. However, the effect of zero-injection nodes and dynamic load is ignored, and the reliability of the configuration results is insufficient in the distribution network. The integer programming method is used to study the optimal configuration of multi-source measurement equipment [16]. This method has high operational efficiency and strong applicability, but its approximate treatment of zero-injection nodes is not applicable to real systems. Considering that the difference between bus voltage values obtained from two different paths is a constraint [17], a binary two-layer optimization method is proposed. The upper layer’s purpose is to find the best solution in different matrices, and the lower layer’s purpose is to find the best PMU layout solution for each submatrix. However, the two-layer solution model is difficult to expand to large-scale systems due to its high complexity. The revised analytical hicrarchy process (RAHP) is adopted to make phased decisions on the PMU position [18], and a variety of observability indicators are comprehensively considered to sort the PMU bus bars and optimize the PMU configuration. However, it relies on expert experience to give weight, which is highly subjective. The improved bat algorithm is applied to seek the optimal position under the condition of a certain number of PMUs [19], which can improve the accuracy of state estimation, but the algorithm easily falls into local optimization and fails to consider the synergistic effect of multiple types of measurement equipment. The integer semi-definite programming model is used to optimize the PMU configuration [20], which not only considers the finiteness of the device channels in the network, but also the influence of the existing traditional measurement and synchronous phase measurement. However, the solution of semi-definite programming takes time.
Although many scholars have carried out a series of research works on the allocation scheme of multi-source measuring equipment in distribution networks [21,22], there are still some problems to be improved upon:
- The proposed allocation method of measuring equipment is a centralized solution with high model complexity and low efficiency;
- The data types and observability of the model of multi-type measurement data in the actual distribution network are ignored.
Combining the above problems, this paper considers the feasibility of state estimation after the configuration of multi-source measurement devices and proposes a framework of distributed optimal configuration of multi-source measurement data. Through the community discovery algorithm, the distribution network is reasonably divided into multiple subregions, and the PMUs are installed at the head nodes of the subregions, which can complete the information interaction of state quantities among the subregions; secondly, the optimal configuration of FTUs and SMs is determined within the subregions, considering the impact of zero-injection nodes and the viewability of the grid, which not only avoids the economic problems caused by the installation of all the PMUs, but also meets the system requirements such as fault isolation and other requirements; finally, the proposed method is validated in the IEEE33 node arithmetic example, which fully proves the feasibility and effectiveness of the method proposed in this paper.
2. Grid Optimization Partitioning Methods
2.1. Equivalent Electrical Distance Based on Sensitivity
Distribution network topology and spatial node distribution have a high degree of similarity; the nodes are not only connected to each other through the electrical lines, and their geographic location also affects the transmission of electrical energy, and the electrical distance is not able to accurately measure the degree of coupling between the nodes. Therefore, the “sensitivity electrical distance” is used to express the strength of the electrical connection between the nodes, which is different from the simple electrical distance, and takes into account the node voltage, current, line impedance, and so on. From the Jacobi matrix of the power system current calculation, the system satisfies the control model as
ΔP and ΔQ represent the changes in active power and reactive power injected into the node, respectively; H, N, J, and L are the elements in the Jacobi matrix; Δδ and ΔU represent the changes in the phase angle and amplitude of the node voltage. Matrix transformation is performed on the above equation:
SPδ and SQδ denote the changes in the phase angle of the node voltage by the node injected active power and reactive power, respectively, and SPU and SQU denote the changes in the node voltage amplitude by the node injected active power and reactive power, respectively.
From the above equation, the voltage variation of each node and the variation in active power and reactive power satisfy the following equation:
SPU and SQU denote active-voltage sensitivity and reactive-voltage sensitivity, respectively.
The traditional reactive-voltage sensitivity lacks the system’s consideration of correlation and connectivity between nodes; therefore, this paper introduces the concept of sensitivity electrical distance dQU,ij, which can be expressed as
SQU,ij node j injects unit reactive power with respect to the amount of voltage variation at node i.
dQU,ij is the electrical distance between two nodes based on the reactive-voltage sensitivity matrix, and a larger value indicates a smaller electrical distance between two nodes based on reactive-voltage sensitivity. Similarly the active-voltage sensitivity electrical distance dPU,ij can be obtained:
Therefore, the expression φij for the electrical distance based on the node reactive and active sensitivity matrices is
To ensure that each node has a subregion to which it belongs, and the sensitivity electrical distance has an inverse proportional relationship with the edge weights, the improved mathematical expression for the edge weights ωij is
2.2. Principle of PMU Optimization Allocation Based on Optimal Partitioning
Optimal partitioning of large-scale power grids can be achieved by defining the “equivalent electrical distance based on sensitivity” and combining it with the community discovery theory and the concept of modularity. Girvan et al. proposed the community discovery theory and the concept of modularity in order to solve the problem of cluster partitioning of complex networks [23], which is given by the following expression:
Q is the modularity index; Aij is the edge weights connecting node i to node j; S is the set of all nodes of the system; m is the sum of the weights of all edges of the system; aj is the sum of the weights of all edges connected to node j; δ(i, j) is the clustering judgment function; when node i is in the same cluster with node j, δ(i, j) = 1; otherwise, δ(i, j) = 0.
Combined with the improved edge weight case analysis above, the improved partition modularity function is as follows:
wij is the improved edge value; wij = wij; ki then denotes the sum of all the improved edge weight values connected to node i, ; mQ is the sum of the weights of all the edges of the system.
The modularity function Q is calculated based on the network topology, which divides the nodes with different degrees of coupling into optimal clusters, and the larger its value, the more closely connected the different communities are.
For a network structure with N nodes, the partitioning strategy is described below:
Step 1: Calculate Equation (9) by treating all nodes as a single cluster.
Step 2: For node i, randomly select node j from other connected nodes, combine them to form a new cluster, and calculate the modularity increment ΔQ at this time; when ΔQ is positive, combine node i and node j into a new cluster; otherwise, keep the original cluster unchanged.
Step 3: View the new cluster as an independent node and repeat the division step of step 2.
Step 4: Until all nodes are traversed and the value of the modularity function Q is not increased, the network partitioning result can be output.
Based on the above grid partitioning architecture, nodes can be partitioned into multiple cluster subregions. In existing cluster partitioning studies, the criteria for cluster partitioning are not unique, and considering that the boundary nodes of neighboring subregions are key measurement points and the number is related to the number of subregions partitioned, and their measurement information can be shared, more expensive PMU measurement devices are configured at all boundary nodes. Considering the existence of measurement blind spots within the subregions, the following optimized configuration of multi-source measurement devices for power grids considering viewability is proposed.
3. Optimization Configuration of Multi-Source Measurement Devices for Power Grid Considering Observability
As the increasing penetration of new energy will bring great challenges to the reliability of the power supply and operation safety of the power grid, thus putting forward higher requirements for the operation and monitoring of the power grid, PMUs, as high-precision, real-time, synchronous measurement devices with GPS calibration capable of long-distance data transmission, can obtain high-precision voltage and current information, which can provide a guarantee for the safety and stability of the distribution network. However, due to the cost of PMUs, it is not possible to install PMUs at each node for data acquisition. Therefore, on the basis of the above PMU optimization configuration based on optimal partitioning, this paper proposes a strategy for the deployment of multi-source measurement devices in the area, taking into account the viewability requirements of the grid and multiple application needs.
3.1. Observability
A node is called a zero-injection node (ZIB) if it is not connected to any load and both the injected current and power at the node are zero. The voltage vector at the node where the PMU or other gauging equipment is installed and the branch current vector flowing through the node, in combination with the nature of the gauging, give the following observability analysis rules:
- The node where the measurement device is configured and the nodes connected to it are observable;
- When the observable zero-injection node has only one connected node whose observability is unknown, the connected node is observable;
- When all connected nodes of a ZIB node with unknown observability are observable, the zero-injection node is also observable.
With the network topology known, A is used to denote the adjacency matrix of the grid, where
The installation of FTUs, SMs, etc., at node i can be expressed as
In order to represent the visibility of the system, we define f to denote the visibility of the system:
When f ≥ 1, the system is sizable.
3.2. Consider the Optimal Configuration of Zero-Injection Nodes
When configuring devices such as FTUs or SMs, while ensuring observability, the number of configurations should be minimized as much as possible to reduce the economic investment of the solution. Let the number of nodes in the grid be N. The objective function and constraints can be expressed as:
In order to further improve the viewability of the distribution network, the case of zero-injection nodes is considered, and the viewability of the nodes at zero-injection node i and its neighboring nodes j, k, and m satisfies the following equation:
If any three of nodes i, j, k, and m are sizable, the other node must be sizable.
We modify the observability objective function and constraints mentioned above, proposing the degree di of the node, and considering the case of ZIB, the model is obtained as follows:
At a certain fixed number of PMUs, FTUs, or SM units, there may exist multiple feasible solutions with the same number of sizable nodes. At this point, the concept of network measurement redundancy (NMR) is proposed as a measure of the merits of the solution.
where mi is the measurement redundancy of node i, i.e., the number of data being measured; R is the number of nodes considered by the measurement device.
lNMR can evaluate the observability and reliability of measurement systems, and the range of values may vary in different scenarios, as described below:
- When lNMR ≤ 1, each node only relies on 1 or less than 1 metrology device, and the system has no additional redundancy; when this metrology device fails, the viewability of the network will be affected, and therefore, the system lacks sufficient reliability and fault tolerance.
- When lNMR = 1–3, each node is covered by 2 or 3 measurement devices; the system has some redundancy, and when this measurement device fails, the state of the node can still be observed by other measurement devices.
- When lNMR > 3, each node is covered by 3 or more measurement devices, which is usually adopted in very critical systems to ensure that normal observation and control can be maintained even after the failure of multiple measurement devices.
- Excessive redundancy refers to a very high NMR, which can greatly improve the fault tolerance of the system but tends to bring greater cost and complexity, and is therefore not common in engineering.
In power systems, moderate redundancy (lNMR = 1–3) is a commonly adopted design that ensures system reliability and avoids excessive equipment investment.
4. Example Analysis
4.1. Overview of the Algorithms
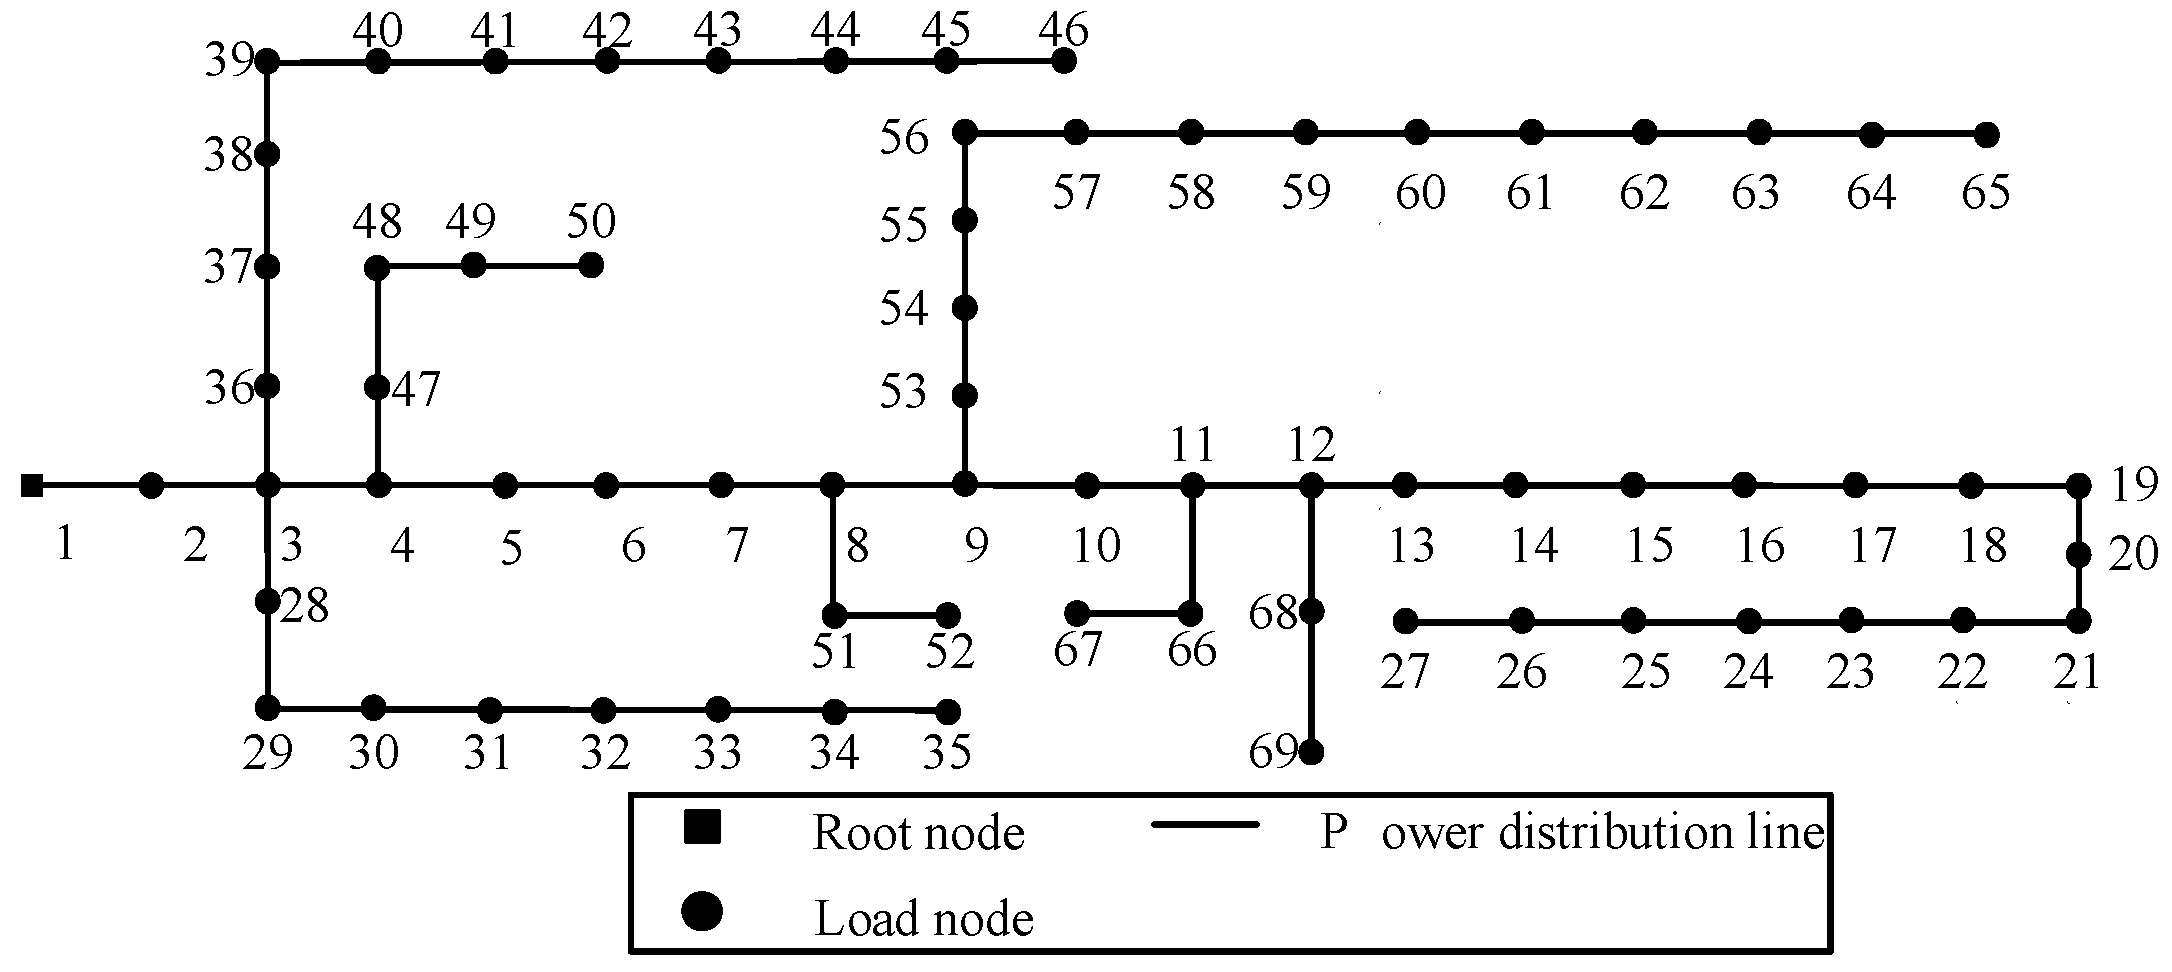
The proposed method for the optimal allocation of multi-source measuring devices considering observability is verified and analyzed by using the examples of IEEE33 nodes and IEEE69 nodes to prove its feasibility and effectiveness, and the electrical connection line of the IEEE33 node is shown in Figure 1. The system has a rated voltage of 12.66 kV, a total load capacity of 3.715 MW and 2.30 MVar, and contains 33 nodes, 32 feeder branches, and 5 contact switches, and its network rated branch parameters are detailed in the literature [24]. Figure 2 shows the electrical connection cables of IEEE69 nodes.
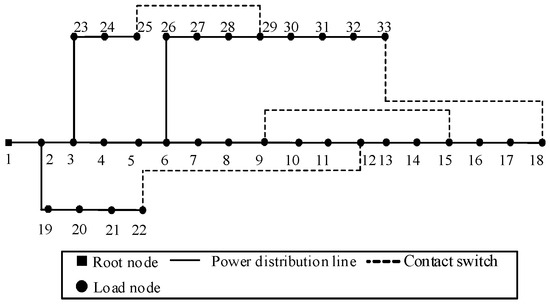
Figure 1.
Schematic diagram of IEEE33 node arithmetic example.
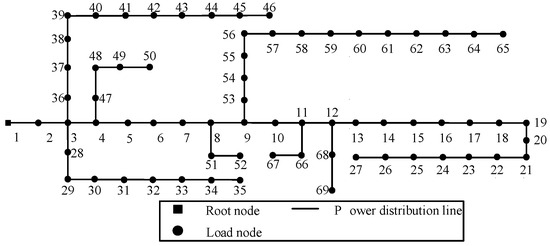
Figure 2.
Schematic diagram of IEEE69 nodes.
4.2. Example Results
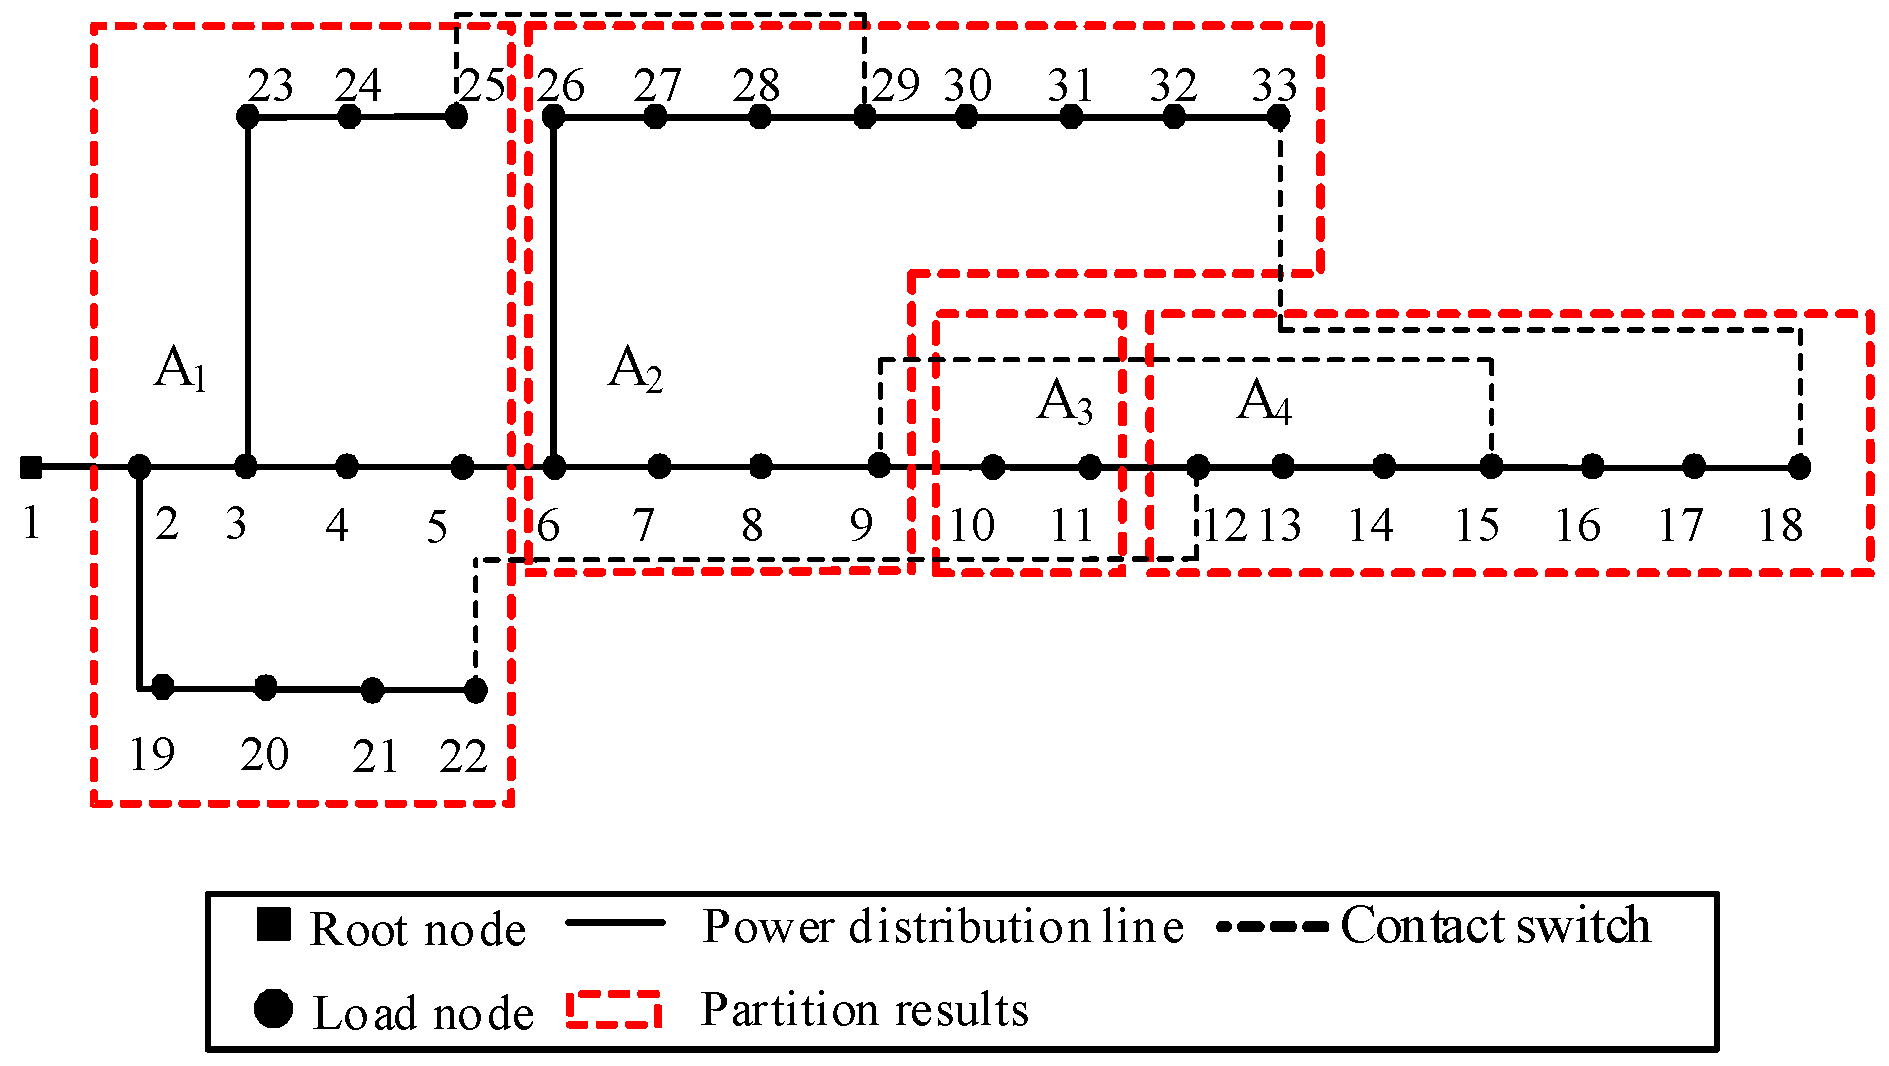
The equivalent electrical distance ω and modularity value Q of this network are calculated based on the proposed partitioning method, by which the IEEE33 node network can be partitioned into four subregions, as shown in Figure 3.
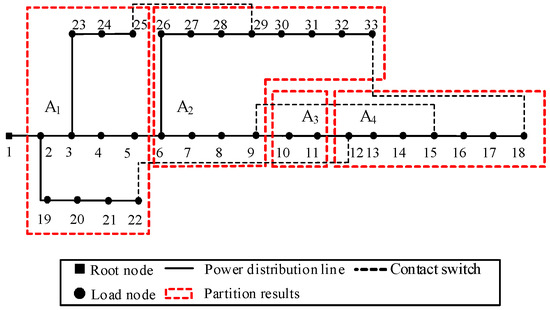
Figure 3.
IEEE33 node partitioning result map.
The partition to which each node belongs is shown in Table 1.

Table 1.
IEEE33 node partitioning result table.
The boundary nodes of subregions A1 and A2 are nodes 5 and 6; the boundary nodes of subregions A2 and A3 are nodes 9 and 10; and the boundary nodes of subregions A3 and A4 are nodes 11 and 12. These boundary nodes are tasked with exchanging electrical parameters and information between the subregions, and in consideration of the operational requirements of the power system and the interdependence between the subregions, the PMU device may be installed at node 5 or 6, node 9 or 10, and node 11 or 12.
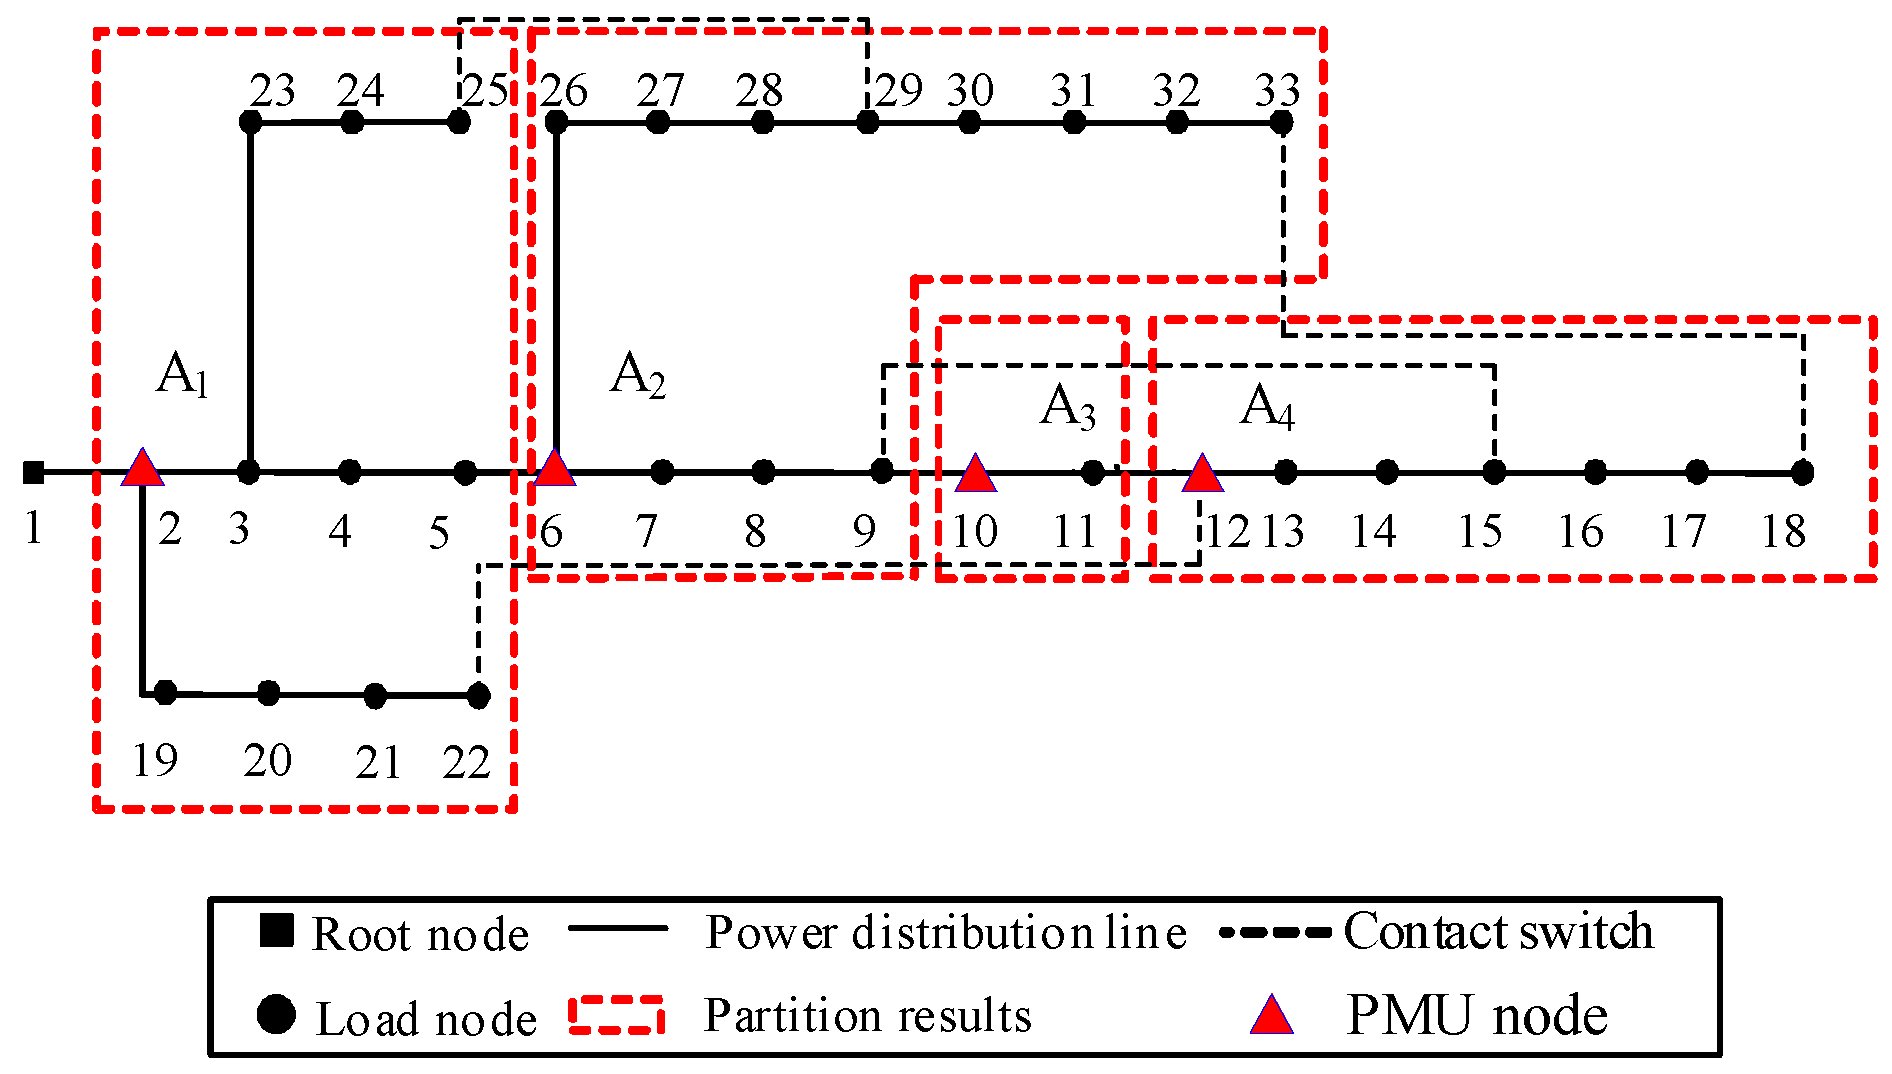
In order to further improve the monitoring accuracy of the voltage and current of each node in the subregion and maximize the utilization of the collection capability of the PMU device, the PMU is installed at the first node of the next subregion, i.e., at nodes 2, 6, 10, and 12, so that the main nodes of each subregion can be better covered to avoid the monitoring blind zones. An example of the IEEE33 node count after installing the PMU is shown in Figure 4.
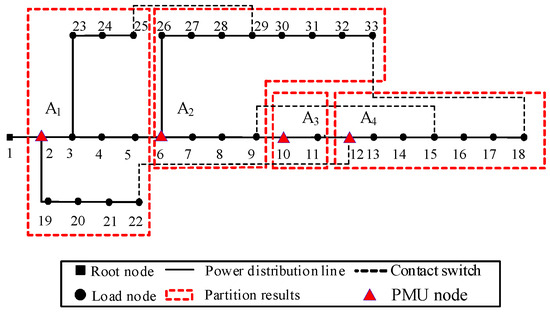
Figure 4.
Nodal diagram of PMU installation in the sub-district.
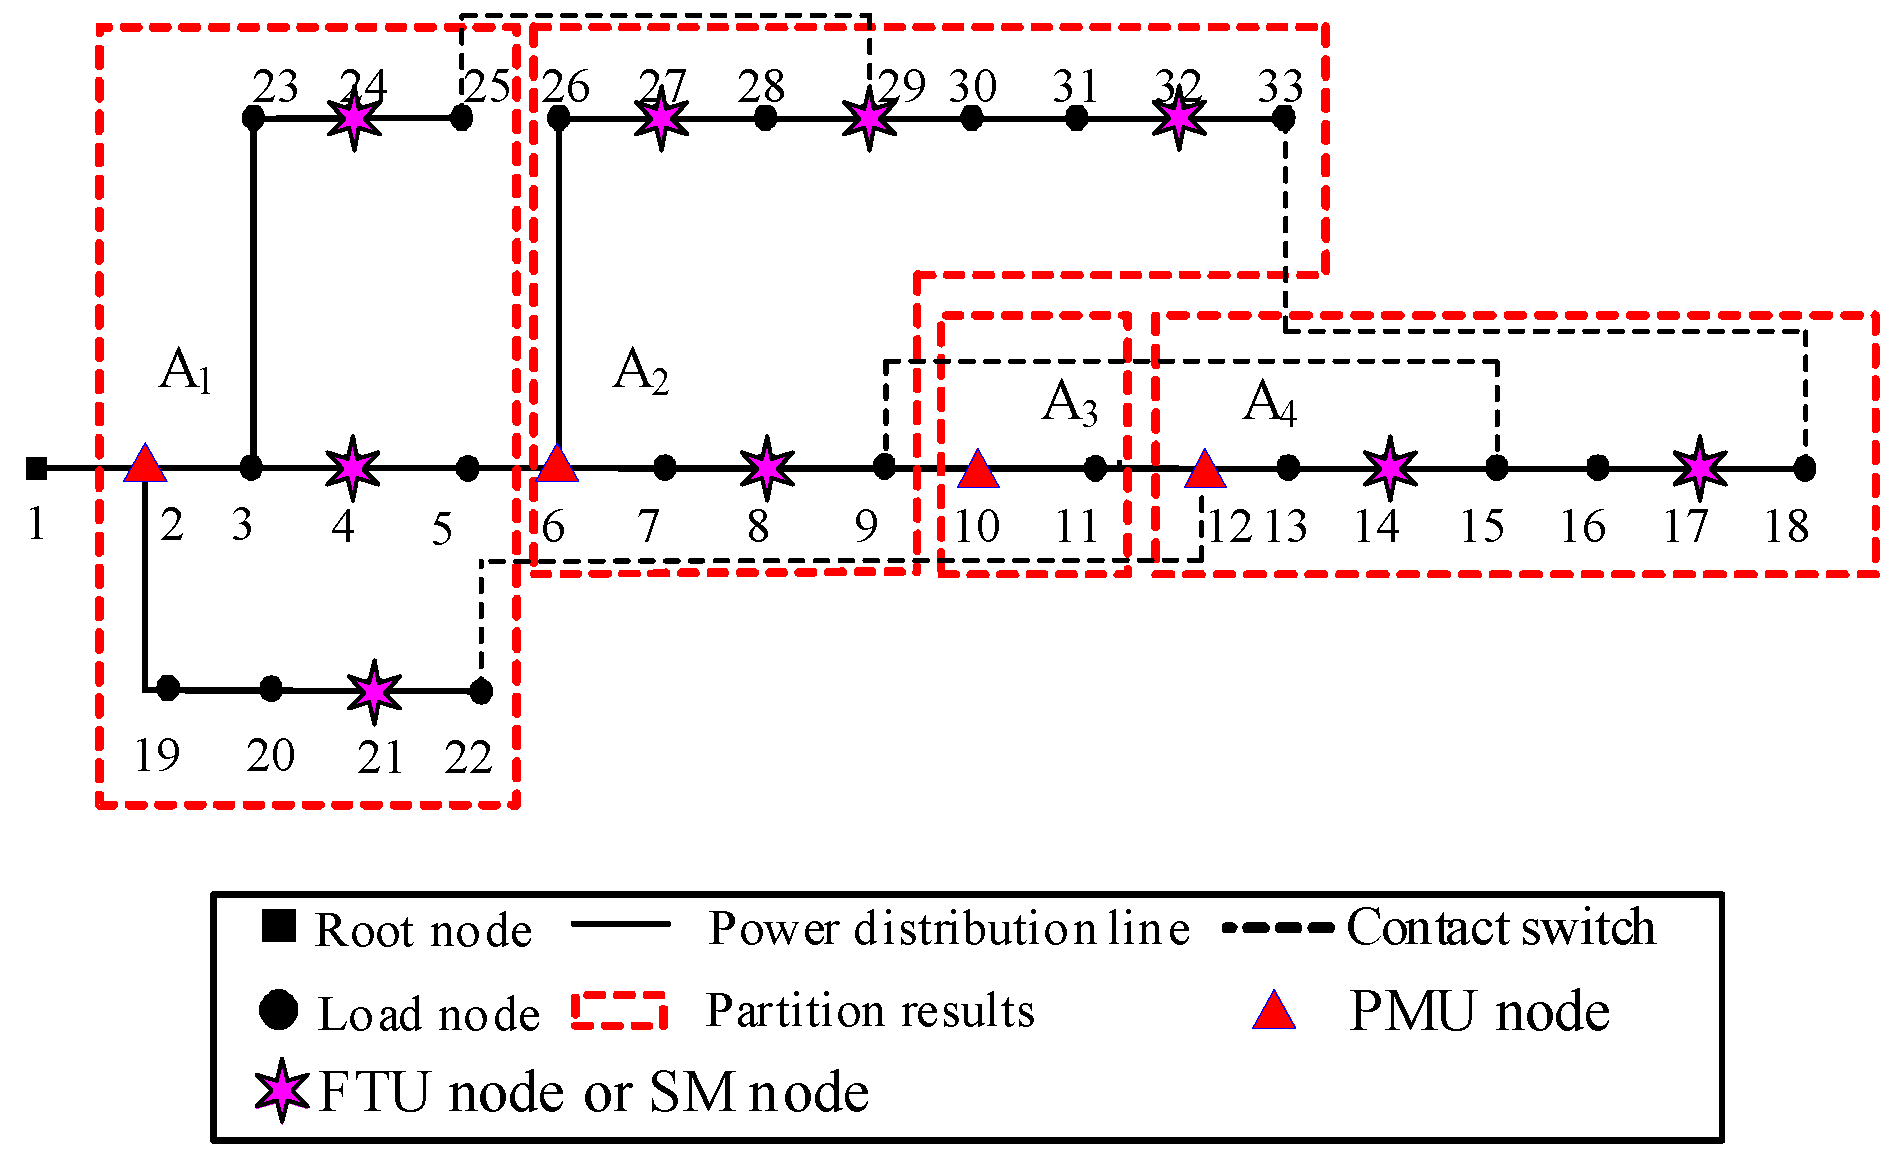
After completing the PMU installation in the aforementioned subregions, the FTU or SM installation nodes inside the subregions are determined. The optimal configuration method proposed in this paper considering zero-injection nodes is solved using the Cplex solver in each sub-area, A1, A2, A3, and A4, respectively, and nodes 2, 6, 10, and 12 and their upstream and downstream nodes are considered to be sizable. The results of the optimal configuration of the FTUs or SMs are shown in Figure 5.
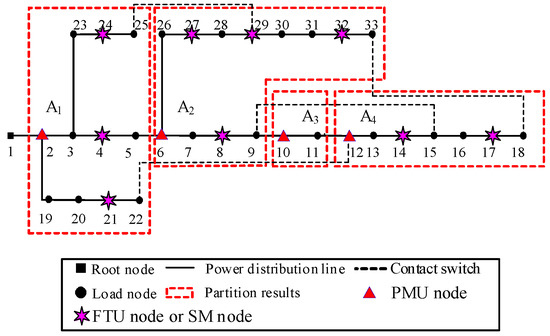
Figure 5.
Nodal diagram of FTU or SM installation in the sub-area.
The installation of nodes within each sub-district is shown in Table 2.
Table 2.
Table of nodes for FTU or SM installations in the sub-area.
In order to meet the observability of the system, FTU or SM units are installed at nodes 4, 21, and 24 in partition A1, nodes 8, 27, 29, and 32 in partition A2, and nodes 14 and 17 in partition A4.
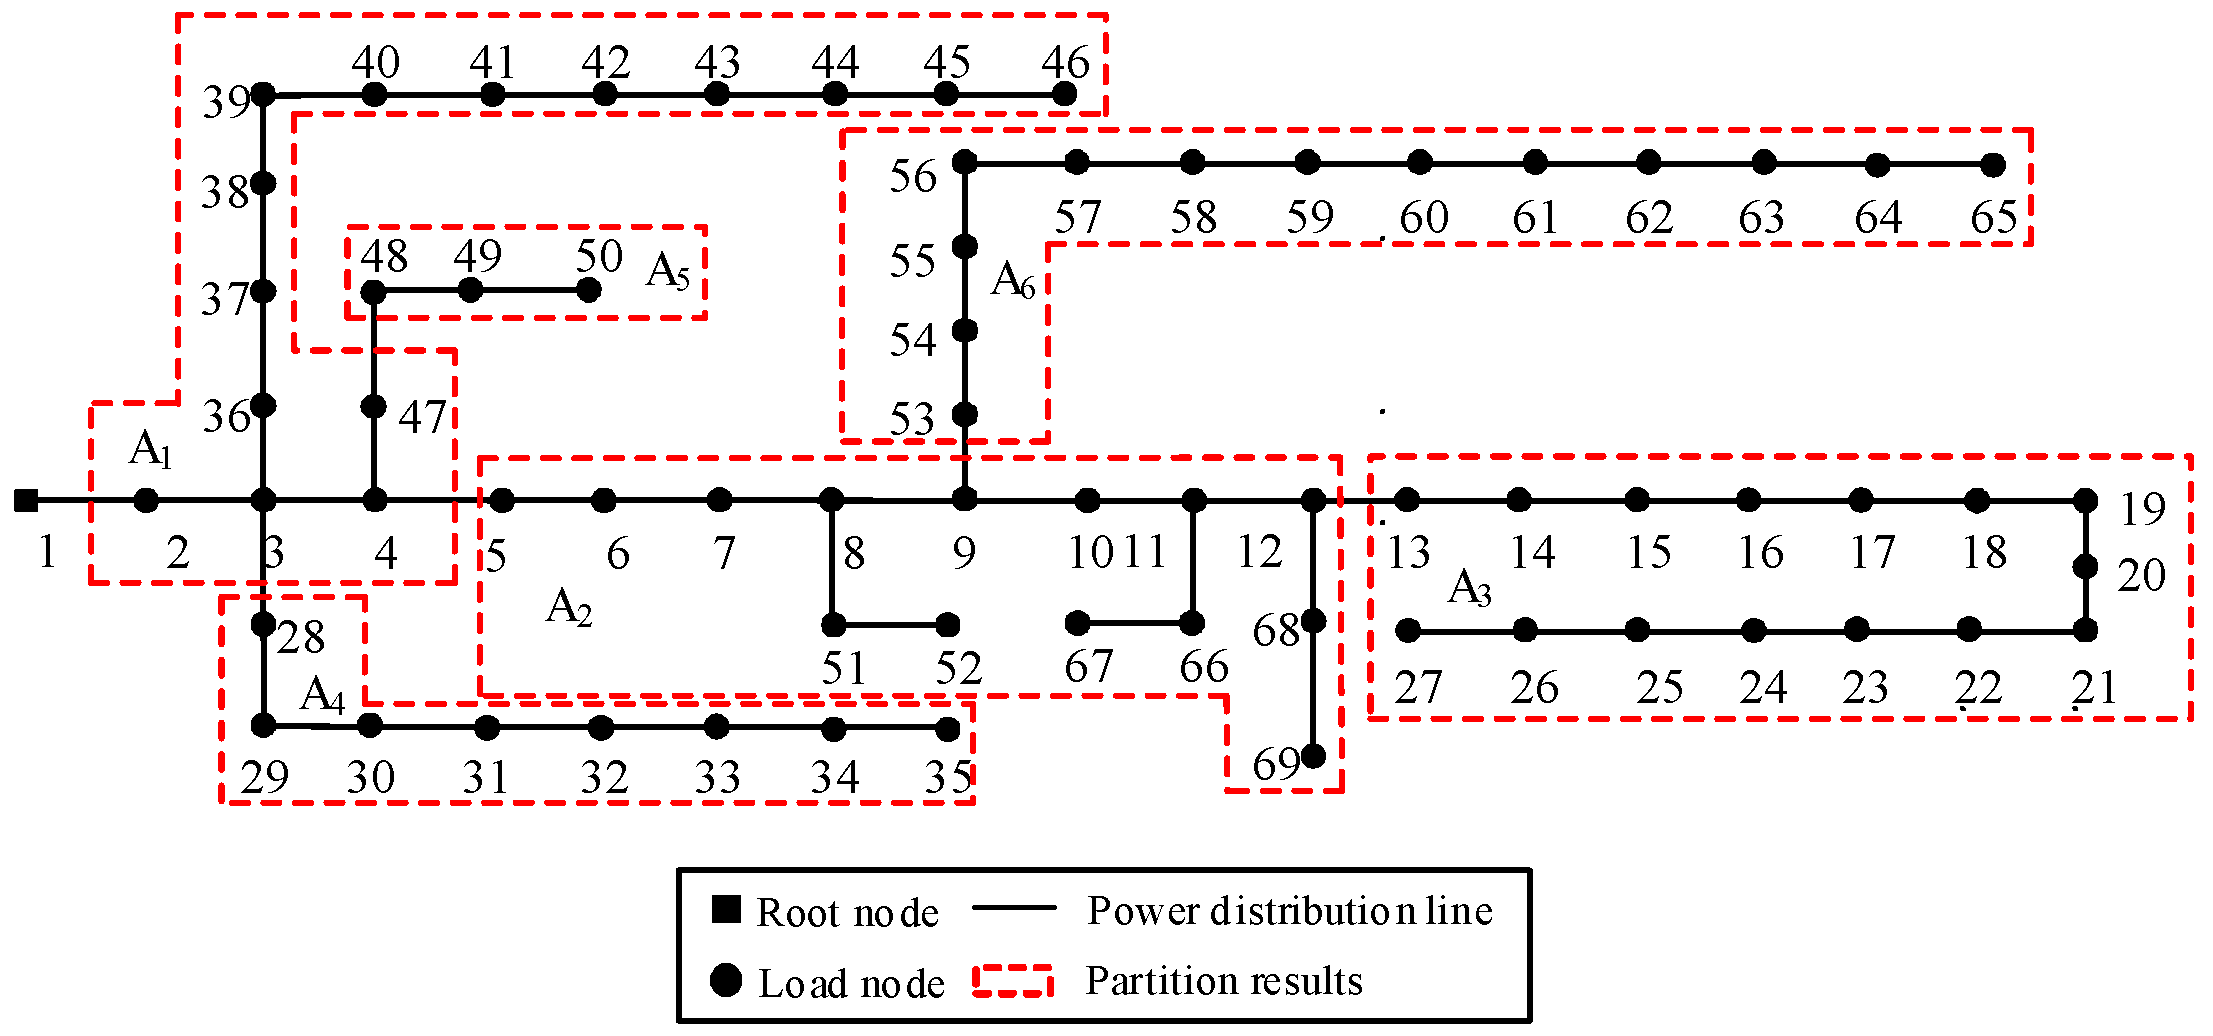
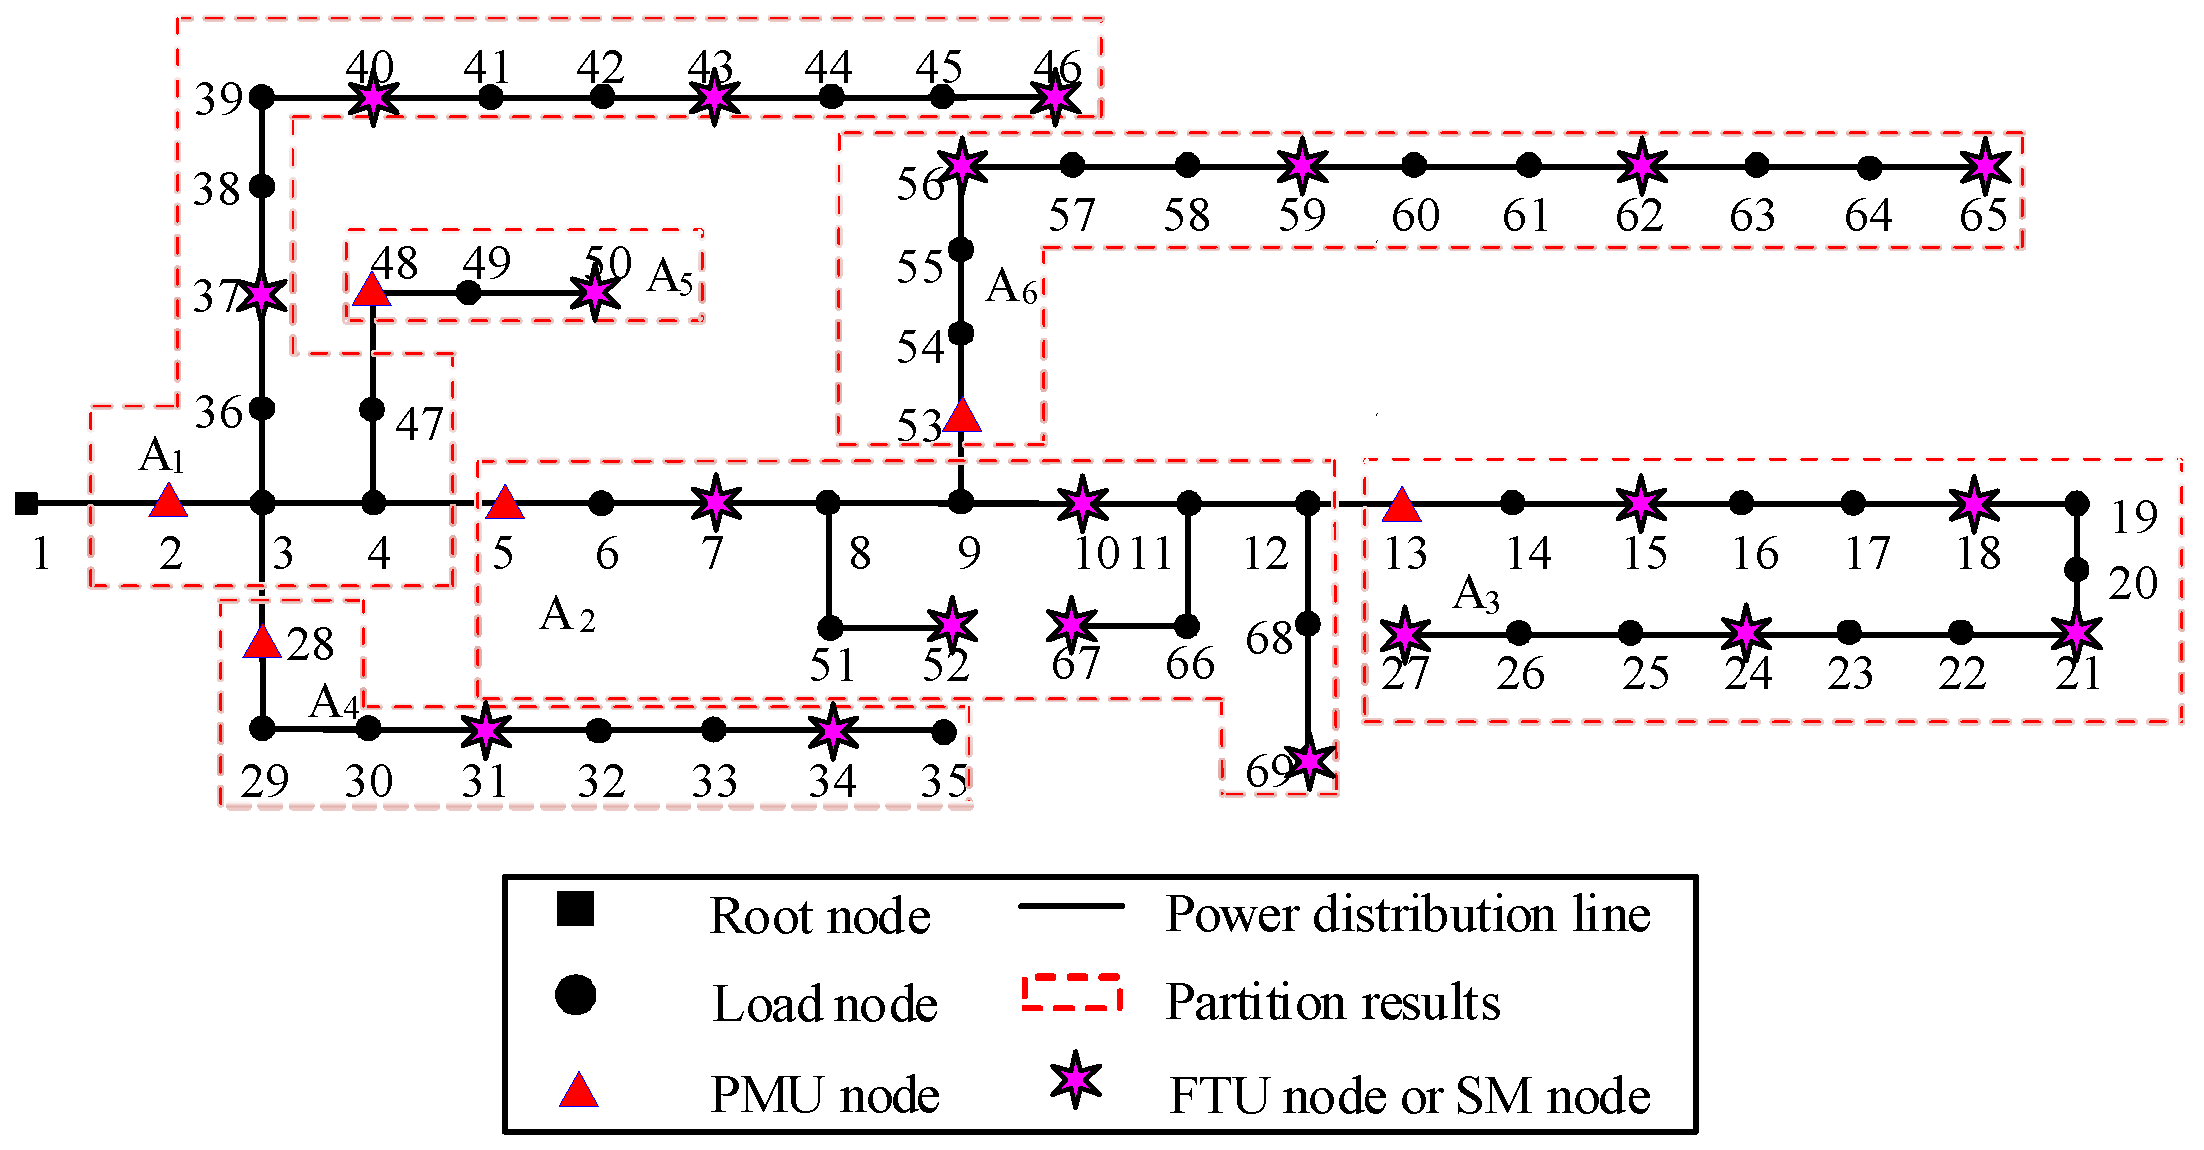
The method of this paper is verified by an example of IEEE69 nodes. The IEEE69 nodes can divide the network into regions, as shown in Figure 6.
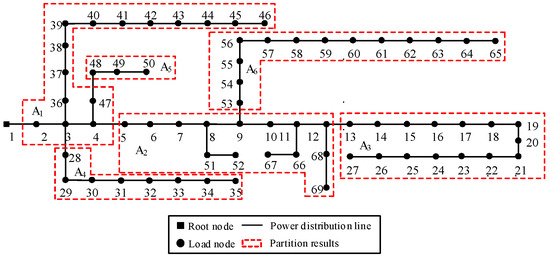
Figure 6.
IEEE69 node partition result.
Table 3 shows the zones to which each IEEE69 node belongs.
Table 3.
IEEE69 node partition result table.
The PMU and FTU or SM installation in the partition is shown in Figure 7.
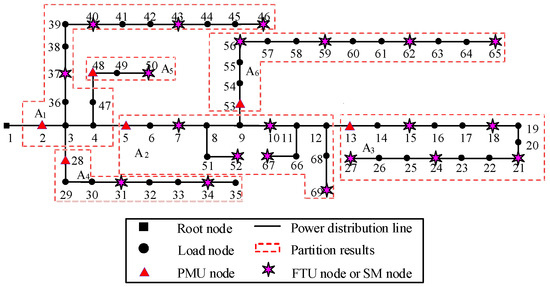
Figure 7.
IEEE69 node example: PMU and FTU or SM node installation diagram.
4.3. Algorithmic Comparison
The greedy algorithm described in the literature [25] and the method described in the literature [26] are used as a comparison, and the results of the comparison PMU configuration are shown in Table 4. The configuration cost of the PMU is set to $10,000, and the configuration cost of other devices such as FTU or SM is set to $1000.
Table 4.
Comparison of results of different methods of PMU placement.
As can be seen from Table 3, the total number of configurations of the multi-source metrology device configuration method proposed in this paper is smaller than that of the method proposed in the literature [25] and slightly larger than the number of configurations required in the literature [26]. However, the number of PMU configurations is smaller than the number of configurations in the literatures [25,26].
According to Table 3, the configuration scheme obtained by the method proposed in this paper can make all nodes in the network observable, that is, achieve complete observability of the network. Comparing the method proposed in this paper with the methods described in the literatures [25,26], both studies [25,26] are able to realize the network sizability, but their numbers of required PMUs are 14 and 11, respectively.
As can be seen from Table 3, the network measurement redundancy lNMR derived from this paper is 3, while that of [25] is 4.72 and that of [26] is 4.43. As can be seen from the range of values of lNMR, the proposed method in this paper has a moderate redundancy in lNMR, which can provide a certain degree of fault tolerance. While the lNMR of the method proposed in [25,26] has high redundancy and it can significantly improve the reliability of the system, its complexity increases significantly, and PMUs are expensive, and the monolithic installation of PMUs will only increase the cost. As shown in Table 3, the total cost of the proposed multi-source measurement device configuration method is $49,000, while the costs of the monolithic PMU configuration methods proposed in [25,26] are $140,000 and $110,000, respectively. In contrast, the proposed method is more economical and can effectively reduce the cost while maintaining moderate redundancy.
5. Conclusions
In this paper, a distributed optimal configuration framework based on multi-source measuring equipment is proposed. By combining sensitivity analysis and community discovery theory, an electrical coupling and topological connection method of power grid zoning is constructed, and the collaborative deployment of multi-source measuring equipment is realized on this basis. This paper proposes the sensitivity electrical distance, combined with the improved community partitioning algorithm, which effectively reduces the complexity of equipment configuration in large-scale distribution networks, significantly reduces the dependence on high-cost equipment while ensuring the global observability of the system, and improves the economy and fault tolerance. Compared with existing methods, the proposed framework shows significant advantages in reducing configuration cost and enhancing environmental adaptability. Future research will further explore the adaptive zoning strategy under dynamic scenarios, consider its application in high-voltage transmission networks or high-proportion renewable energy systems, and optimize real-time monitoring combined with edge computing technology to provide theoretical support for the reliable operation of smart grids.
Author Contributions
Y.X.: data curation; formal analysis; methodology; software; writing—original draft; writing—review and editing. J.Z. (Jiaqi Zhang): data curation; formal analysis; investigation; methodology; software; writing—review and editing. J.Z. (Jing Zhao): funding acquisition; supervision; writing—review and editing. X.Z.: funding acquisition; supervision; writing—review and editing. J.G.: data curation; formal analysis; investigation; methodology. All authors have read and agreed to the published version of the manuscript.
Funding
This work is supported by the technology project of State Grid Heilongjiang Electric Power Company, with project number SGHLJM00HLJS2400172.
Data Availability Statement
The original contributions presented in the study are included in the article; further inquiries can be directed to the corresponding author.
Acknowledgments
Thank State Grid Heilongjiang Jiamusi Power Supply Company for our strong support.
Conflicts of Interest
Authors Yuhao Xu, Jing Zhao and Xiaoyu Zhang were employed by the company Jiamusi Power Supply Company of State Grid Heilongjiang Electric Power Co., Ltd. The above authors have no financial relationship with the company or competitive interests to disclose.
References
- Tian, S.; Li, K.; Wei, S.; Fu, Y.; Li, Z.; Liu, S. Security situation awareness approach for distribution network based on synchronous phasor measurement unit. Proc. CSEE 2021, 41, 617–631. (In Chinese) [Google Scholar]
- Liu, Z.; Wang, C.; Li, P.; Yu, H.; Yu, L.; Li, P. State estimation of distribution networks based on multi-source measurement data and its applications. Proc. CSEE 2021, 41, 2605–2614. (In Chinese) [Google Scholar]
- Huang, M.Y.; Wei, Z.N.; Lin, Y.Z. Forecasting-aided state estimation based on deep learning for hybrid AC/DC distribution systems. Appl. Energy 2022, 306, 118119. [Google Scholar] [CrossRef]
- Wu, Z.; Xu, J.; Yu, X.; Hu, Q.; Dou, X.; Gu, W. Review on state estimation technique of active distribution network. Autom. Electr. Power Syst. 2017, 41, 182–191. (In Chinese) [Google Scholar]
- Shafiullah, M.; Rana, M.J.; Alam, M.S.; Uddin, M.A. Optimal placement of Phasor Measurement Units for transmission grid observability. In Proceedings of the 2016 International Conference on Innovations in Science, Engineering and Technology (ICISET), Dhaka, Bangladesh, 28–29 October 2016; pp. 1–4. [Google Scholar]
- Shafiullah, M.; Abido, M.A.; Hossain, M.I.; Mantawy, A.H. An Improved OPP Problem Formulation for Distribution Grid Observability. Energies 2018, 11, 3069. [Google Scholar] [CrossRef]
- Luo, S.Z. Multi-objective optimal configuration of PMUs based on probabilistic observability of nodes. Guangdong Electr. Power 2023, 36, 39–46. [Google Scholar]
- Yuan, H.; Li, G.; Long, T.; Hou, Z.; Zhang, H.; Bie, Z. Power system reliability assessment taking into account state estimation and sizability. Grid Technol. 2019, 43, 4274–4283. [Google Scholar]
- Muscas, C.; Pau, M.; Pegoraro, P.A.; Sulis, S.; Ponci, F.; Monti, A. Multiarea distribution system state estimation. IEEE Trans. Instrum. Meas. 2015, 64, 1140–1148. [Google Scholar] [CrossRef]
- Liu, M.; Zhou, S.X.; Deng, Y.M.; He, G.Y.; Chen, X.Q. An area-decoupled state estimation method for distribution systems. Autom. Electr. Power Syst. 2005, 29, 79–83. [Google Scholar]
- Liu, K.; Sheng, W.; He, K.; Meng, X.L.; Tang, W.; Ma, J. Distributed state estimation of complex active distribution networks based on Lagrangian relaxation technique. Power Syst. Prot. Control. 2017, 45, 125–132. [Google Scholar]
- Lopatka, P.; Salvini, S.; Nusrat, N.; De-Alvaro, L.; Wallom, D. Performance study of distributed state estimation algorithms on the HiPerDNO HPC platform. In Proceedings of the 47th International Universities Power Engineering Conference (UPEC), Uxbridge, UK, 4–7 September 2012; pp. 1–6. [Google Scholar]
- Tong, J.; Shen, C.; Xiang, B.; Yan, W. A two-stage state estimation method considering grid partitioning. Electr. Appl. 2012, 31, 54–58. (In Chinese) [Google Scholar]
- Du, D.; Li, X.; Li, W.; Chen, R.; Fei, M.; Wu, L. ADMM-based distributed state estimation of smart grid under data deception and denial of service attacks. IEEE Trans. Syst. Man Cybern. Syst. 2019, 49, 1698–1711. [Google Scholar] [CrossRef]
- Mohammadi, M.B.; Hooshmand, R.A.; Fesharaki, F.H. A new approach for optimal placement of PMUs and their required communication infrastructure in order to minimize the cost of the WAMS. IEEE Trans. Smart Grid 2015, 7, 84–93. [Google Scholar] [CrossRef]
- Xu, B.; Abur, A. Observability analysis and measurement placement for systems with PMUSIC. In Proceedings of the IEEE PES Power Systems Conference and Exposition (PSCE), New York, NY, USA, 10–13 October 2004; Volume 2, pp. 943–946. [Google Scholar]
- Koochi, M.; Dehghanian, P.; Esmaeili, S. PMU Placement with Channel Limitation for Faulty Line Detection in Transmission Systems. IEEE Trans. Power Deliv. 2020, 35, 819–827. [Google Scholar] [CrossRef]
- Xi, Y.; Yu, L.; Jiang, W.H.; Chen, B.; Zhou, B.; Liang, B.; Zhang, J.X. Optimal allocation of multi-stage PMUs based on modified hierarchical analysis. Guangdong Electr. Power 2022, 35, 87–93. (In Chinese) [Google Scholar]
- Hu, M.F. Research on High Resistance Fault Detection Method of Distribution Network Based on Limited Synchronous Measurement Data. Master‘s thesis, Shandong University of Technology, Zibo, China, 2022. (In Chinese). [Google Scholar]
- Vedik, B.; Chandel, A.K. Optimal PMU Placement for Power System Observability Using Taguchi Binary Bat Algorithm. Measurement 2017, 95, 8–20. [Google Scholar]
- Siddique, N.I.; Rana, J.; Shafiullah, M.; Mekhilef, S.; Pota, H. Automating distribution networks: Backtracking search algorithm for efficient and cost-effective fault management. Expert Syst. Appl. 2024, 247, 123275. [Google Scholar] [CrossRef]
- Shafiullah, M.; Hossain, M.I.; Abido, M.A.; Abdel-Fattah, T.; Mantawy, A.H. A modified optimal PMU placement problem formulation considering channel limits under various contingencies. Measurement 2019, 135, 875–885. [Google Scholar] [CrossRef]
- Girvan, M.; Newman, M.E. Community structure in social and biological networks. Proc. Natl. Acad. Sci. USA 2002, 99, 7821–7826. [Google Scholar] [CrossRef]
- Baran, M.E.; Wu, F.F. Network reconfiguration in distribution systems for loss reduction and load balancing. IEEE Trans. Power Deliv. 1989, 4, 1401–1407. [Google Scholar] [CrossRef]
- Abdelsalam, H.A.; Abdelaziz, A.Y.; Osama, R.A.; Salem, R.H. Impact of distribution system reconfiguration on optimal placement of phasor measurement units. In Proceedings of the 2014 Clemson University Power Systems Conference, Clemson, SC, USA, 11–14 March 2014; IEEE: Piscataway, NJ, USA, 2014; pp. 1–6. [Google Scholar]
- Kong, X.Y.; Wang, Y.T.; Yuan, X.X.; Yu, L. Optimal PMU configuration based on customized genetic algorithm considering multiple topological viewability of distribution network. Power Autom. Equip. 2020, 40, 66–72. (In Chinese) [Google Scholar]

Disclaimer/Publisher’s Note: The statements, opinions and data contained in all publications are solely those of the individual author(s) and contributor(s) and not of MDPI and/or the editor(s). MDPI and/or the editor(s) disclaim responsibility for any injury to people or property resulting from any ideas, methods, instructions or products referred to in the content. |
© 2025 by the authors. Licensee MDPI, Basel, Switzerland. This article is an open access article distributed under the terms and conditions of the Creative Commons Attribution (CC BY) license (https://creativecommons.org/licenses/by/4.0/).