Article

The Influence of Tri-Structural Isotropic Fuel on the Microstructure and Thermal Conductivity of SiC Tri-Structural Isotropic Composite Fuels

1
Shanghai Institute of Ceramics, Chinese Academy of Sciences, Shanghai 201899, China
2
Shanghai Nuclear Engineering Research and Design Institute, Shanghai 200233, China
*
Authors to whom correspondence should be addressed.
These authors contributed equally to this work.
Energies 2025, 18(5), 1216; https://doi.org/10.3390/en18051216
Submission received: 12 February 2025 / Revised: 26 February 2025 / Accepted: 28 February 2025 / Published: 2 March 2025
(This article belongs to the Section J: Thermal Management)

Abstract

:
Thermal conductivity is the key property of SiC-TRISO composite fuel. This study investigated the relationship between SiC phase transition, thermal conductivity, and microstructure across different temperatures. The physical phase, morphology, and microstructure of SiC and SiC-TRISO composite fuels were characterized by XRD and SEM. Meanwhile, EDS was employed to determine the chemical composition within SiC grains. The results showed the transformation of the β-SiC phase to α-SiC in the matrix with increasing sintering temperature, while Al, Y, and Ca concentrations within the SiC grains decreased. The highest λ value of SiC was achieved at a sintering temperature of 1750 °C, measuring 75.51 W m · K at room temperature and 43.36 W m · K at 500 °C. The incorporation of TRISO fuel lowered the λ value of SiC-TRISO composite fuel, yielding 57.96 and 34.51 W m · K at room temperature and 500 °C, respectively. The outermost carbon layer of TRISO fuel interacts with the silicon carbide matrix and liquid phase, facilitating the phase transition from 3C-SiC to 6H-SiC and, subsequently, to 4H-SiC. This process accelerates the depletion of Al, Y, and Ca within the silicon carbide grains, encourages grain growth, and raises the free-carbon content, thereby decreasing the λ of the composite fuel.

1. Introduction

TRISO (Tri-structural Isotropic) fuel is dispersed within the matrix and extensively used in HTGCRs (high-temperature gas-cooled reactors). Concurrently, theoretical and experimental studies have been conducted worldwide on TRISO fuel for water-cooled reactors [1,2,3,4,5,6,7]. In current reactors, TRISO particles are widely dispersed in an inert matrix, such as graphite or silicon carbide, to form a fully ceramic microencapsulated (FCM) structure [8,9,10,11]. The small size of TRISO particles has garnered significant attention for their loading in FCM composite fuels, with increasing the volume ratio of TRISO particles becoming a key area of research. Ang et al. [12] prepared SiC-TRISO composite fuels with a volume ratio of 34 vol.% TRISO particles using the NITE process. Liu. et al. [13] prepared SiC-TRISO composite fuels with a TRISO volume ratio of 50 vol.% by pre-treating the TRISO particles. Tan et al. [14] prepared a SiC-TRISO composite fuel with a TRISO particle volume ratio of up to 57 vol.% through sol–gel injection molding. As the TRISO particles were diffusely distributed within the matrix, all the aforementioned studies employed pressurization during the sintering process to produce FCM fuels. This resulted in the TRISO particles pressing against each other, leading to fractures and separation from the matrix. To reduce the occurrence of fractures, Kim et al. [15] prepared 37 vol.% SiC-TRISO composite fuels through pressureless sintering at 1850 °C. The high sintering temperature facilitated the phase transformation from β-SiC to α-SiC in the matrix, resulting in a SiC matrix with only 10.8 vol.% 3C content.
The key properties of FCM fuels are the volume ratio of TRISO particles and thermal conductivity. Liu et al. [16] prepared SiC-TRISO fuel with a 36 vol.% loading, achieving thermal conductivities of 43.9 and 25.8 W m · K at room temperature and 500 °C, respectively. Kim et al. [17] prepared a composite fuel with a TRISO particle volume ratio of 43.3 vol.%, finding that the λ of the SiC-TRISO composite fuel was 61.7 W m · K . Liu et al. [18] produced SiC-TRISO composite fuels using cast molding, and their findings showed an inverse correlation between the λ of the composite fuels and the TRISO particle content. Gong et al. [19] and Wei et al. [20] simulated the λ of SiC-TRISO composite fuels and concluded that the TRISO particle loading level is the primary factor influencing its behavior. The studies mentioned above emphasize that TRISO fuel significantly impacts the λ of SiC-TRISO composite fuels; however, the precise influence pattern and underlying mechanism have yet to be thoroughly investigated.
Hence, the objective of this study is to evaluate the λ and microstructure of both TRISO-particle-free silicon carbide matrices and SiC-TRISO composite fuels. This can be achieved through the characterization of elemental diffusion within the silicon carbide matrix and by investigating the mechanisms through which TRISO fuel influences the λ of SiC-TRISO composite fuels. As we know, the key factors influencing the λ of silicon carbide include temperature [21,22], porosity [23], crystal structure [24], and the presence of a second phase [25]. For FCM fuels, TRISO fuel would also affect the sequential phase transitions 3C-SiC → 6H-SiC → 4H-SiC of the SiC matrix by influencing the crystal type, content, and distribution on the λ of SiC. In summary, the present research can help advance the design of SiC-TRISO composite fuels with higher loading capacities and improved thermal conductivity, providing a base for future innovations in nuclear fuel technology.

2. Experiments

In this paper, β-SiC (Xi’an BOERNM New Materials Co., Ltd., Xi’an, China, average particle size 1.0 μm) was used as the raw material, while Al2O3 (Shanghai Yingcheng New Materials Co., Ltd., Shanghai, China, purity ≥ 99.99%), Y2O3 (Shanghai Diyang Chemical Co., Ltd., Shanghai, China, purity ≥ 99.999%), and CaO (Aladdin Scientific Corp., Shanghai, China, purity ≥ 98.0%) were used as sintering additives. The mass ratio of Al2O3, Y2O3, and CaO was 7:2:1, with the total solid content of the additives set at 10%. PVB was used as the binder. The raw materials, sintering additives, and binder were placed in a polyurethane ball-milling jar with zirconia grinding balls at a 3:1 ratio and anhydrous ethanol. The resulting mixture was then ball-milled for 12 h, then dried and sieved. Slabs with dimensions of 50   m m × 50   m m × 5   m m were produced through dry-press molding, positioned in graphite molds, and subjected to vacuum hot-press sintering. The sintering process was conducted at temperatures of 1650 °C (Sample A), 1750 °C (Sample B), and 1850 °C (Sample C) under a pressure of 40 MPa. The samples were maintained at the target temperature for 1 h in an argon atmosphere, with a controlled heating rate of 10 m i n . The physical phases of the samples were measured using high-resolution XRD (Bruker, Germany, D8 ADVANCE). The silicon carbide content with different structures was calculated using the Rietveld method, which was also employed to determine the sintering temperature, resulting in the highest cubic phase content.
The TRISO particles were sequentially implanted into a 50   m m × 50   m m × 5   m m SiC slab-like billet using a homemade mold (Patent No. CN118658649B), which was then placed in a graphite mold and sintered by hot pressing in a vacuum hot-press furnace. The temperature with the highest cubic phase content was selected for sintering the SiC-TRISO composite fuel (Sample D). The sintering process was conducted at a pressure of 40 MPa, with the temperature maintained for 1 h in an argon environment, and with a controlled heating rate of 10 m i n .
After hot pressing and sintering at different temperatures, the samples were processed into disks of Φ 10 mm × 2 mm in size. Cp was then measured using a high-temperature calorimeter (Setaram, France, MHTC96, temperature sensitivity of 0.1 °C). The samples were processed into round bars of Φ 4.9 mm × 18 mm with a centerless grinder. The thermal diffusion coefficient, α (cm²/s), was measured using a thermal conductivity tester (Netzsch, Germany, LFA467HT, temperature sensitivity of 0.1 °C), and λ was subsequently calculated through the following expression:
λ = ρ α C p
The microstructure of the samples was analyzed utilizing field emission scanning electron microscopy (SEM) (Hitachi, Japan, SU8220, Tokyo, Japan) through the BSE and SE imaging techniques. Elemental distribution and content were determined using Energy-disperseive spectroscopy (EDS). The average particle size of the samples was calculated using Nano Measurer 1.2 software.

3. Results and Discussion

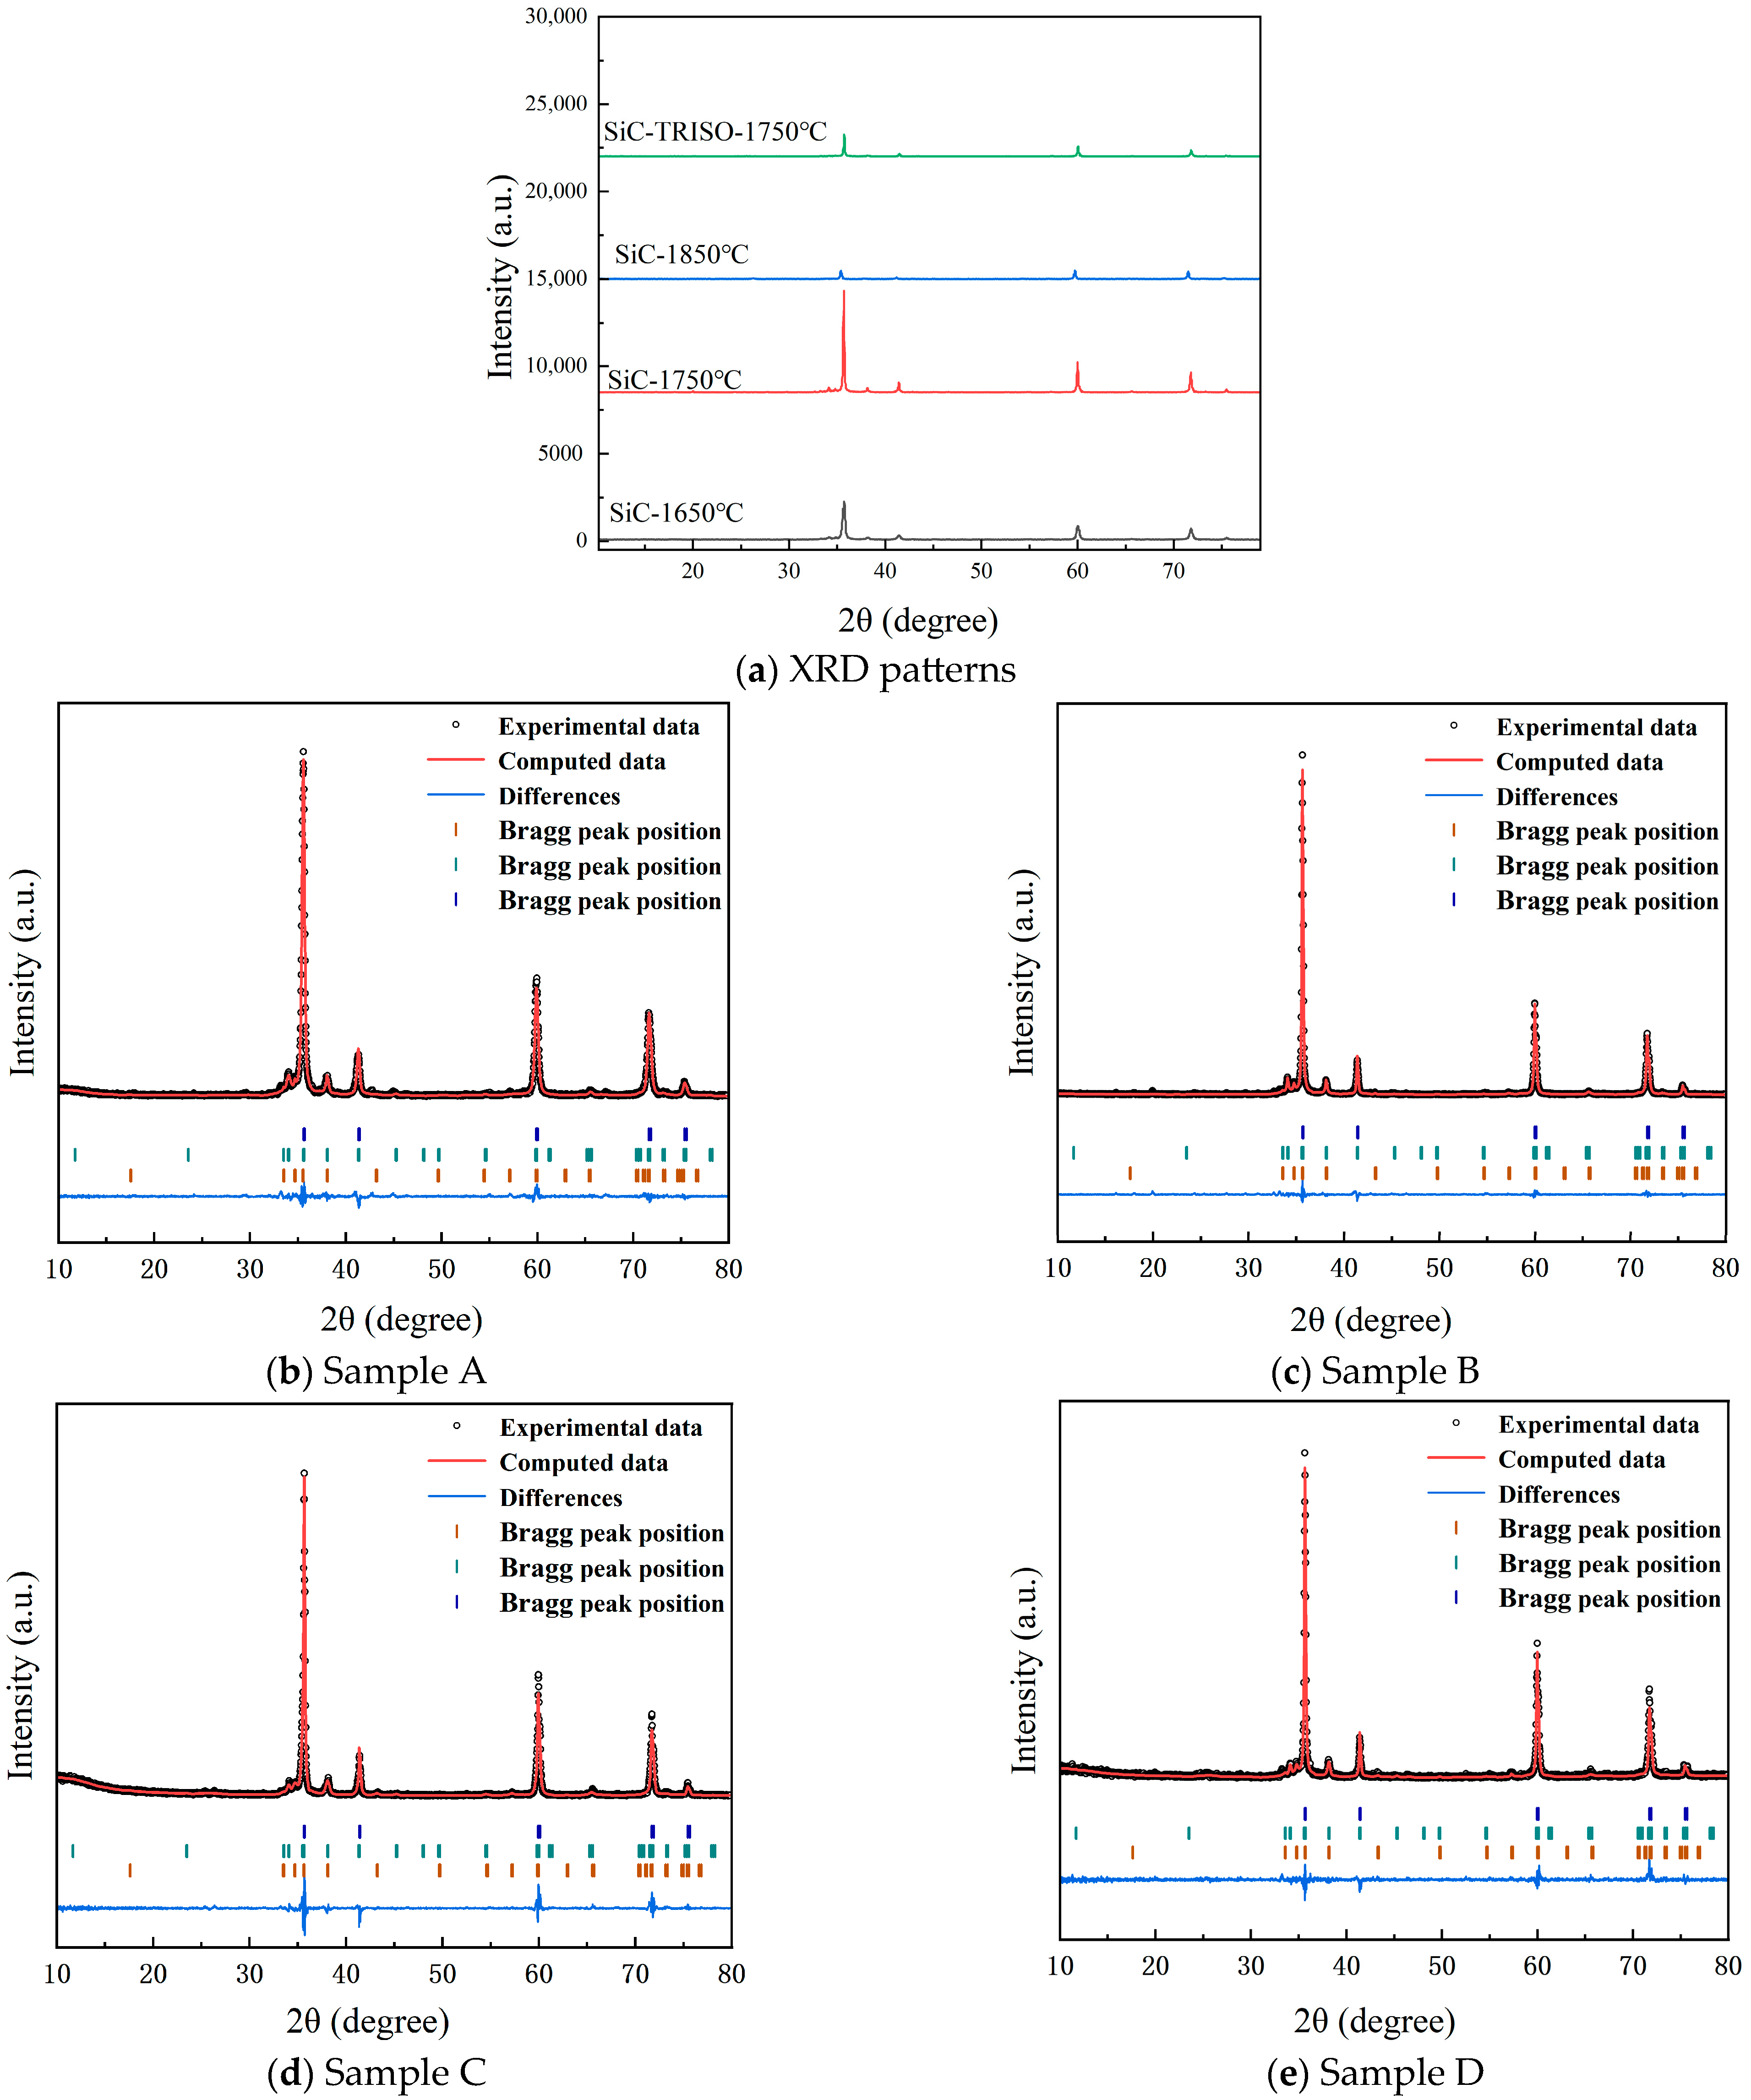
3.1. Phase Transition of SiC at Different Sintering Temperatures

Figure 1 illustrates the X-ray diffraction (XRD) spectra of silicon carbide after hot-press sintering. The contents of 3C-SiC, 6H-SiC, and 4H-SiC in the samples were calculated from these XRD spectra, as shown in Table 1. After the hot-press sintering at 1650 °C (Sample A), the β-SiC phase began transforming into the α-SiC phase. The sample contained 91.1% of the 3C-SiC phase, while 6H-SiC, the main transformed α-SiC phase, accounted for 8.2%, and the 4H-SiC phase was only 0.7%. After sintering at 1750 °C (Sample B), the dominant phase remained 3C-SiC, with a content of 90.3%. Although the content of the α-SiC phase after sintering at 1750 °C was similar to that observed at 1650 °C, the 6H-SiC content decreased to 3.9%, while the 4H-SiC phase increased to 5.8%. Therefore, the dominant phase transitioned from 6H-SiC to 4H-SiC. This transformation occurred because the sequence of the silicon carbide phase changes from β-SiC to α-SiC following the path 3C-SiC → 6H-SiC → 4H-SiC. With an increasing temperature, 3C-SiC first transformed to 6H-SiC and then gradually to 4H-SiC. With further increases in the sintering temperature, the transformation of the β-SiC phase to the α-SiC phase accelerated, consistent with the results from reference [26]. This phenomenon resulted in a significant amount of 3C-SiC transformation into 6H-SiC. As the sintering temperature rose to 1850 °C (Sample C), the proportion of 3C-SiC in the sample declined to 52.2%, while the contents of 6H-SiC and 4H-SiC in the α-SiC phase were determined to be 37.8% and 10%, respectively. The main phase in the α-SiC phase transitioned from 4H-SiC at 1750 °C to 6H-SiC, similar to the phase observed at 1650 °C during hot pressing.

3.2. λ of SiC at Various Sintering Temperatures

Figure 2a illustrates the thermal diffusion as a function of temperature for silicon carbide after hot-press sintering. The thermal diffusion coefficients for Samples A, B, and C were 0.12, 0.29, and 0.26 c m 2 s , respectively. A decreasing trend was observed as the test temperature increased, and Sample A displayed the lowest values compared to Samples B and C. At a test temperature of 500 °C, the thermal diffusion coefficients of Sample A, Sample B, and Sample C were 0.06, 0.12, and 0.13 c m 2 s , respectively. As the test temperature reached 1000 °C, the thermal diffusion coefficients for the three samples decreased further, with values of 0.04, 0.08, and 0.08 c m 2 s , respectively.
Figure 2b presents the variation in the heat capacity of silicon carbide with temperature after hot-press sintering. It was found that the heat capacities of the samples at room temperature after hot-press sintering were 0.69, 0.90, and 0.82 J g · K for Samples A, B, and C, respectively. With an increase in the test temperature, the heat capacities increased. Similarly to the thermal diffusion coefficient trend, Sample A displayed the lowest heat capacities compared to Samples B and C. However, unlike the thermal diffusion coefficient, Sample B consistently had a higher heat capacity than Samples A and C. When the test temperature reached 500 °C, the heat capacities of Samples A, B, and C increased to 1.12, 1.22, and 1.12 J g · K , respectively.
Figure 2c presents the λ-temperature curves of silicon carbide following hot-press sintering, computed using Equation (1). The λ values at room temperature for Samples A, B, and C were 18.66, 75.51, and 61.59 W m · K , respectively. With a rise in test temperature, λ declined. Sample A demonstrated lower λ compared to Samples B and C. Additionally, similar to Cp, Sample B consistently maintained higher λ than the other two samples. At 500 °C, the λ values of Samples A, B, and C dropped to 15.75, 43.36, and 40.57 W m · K , respectively.

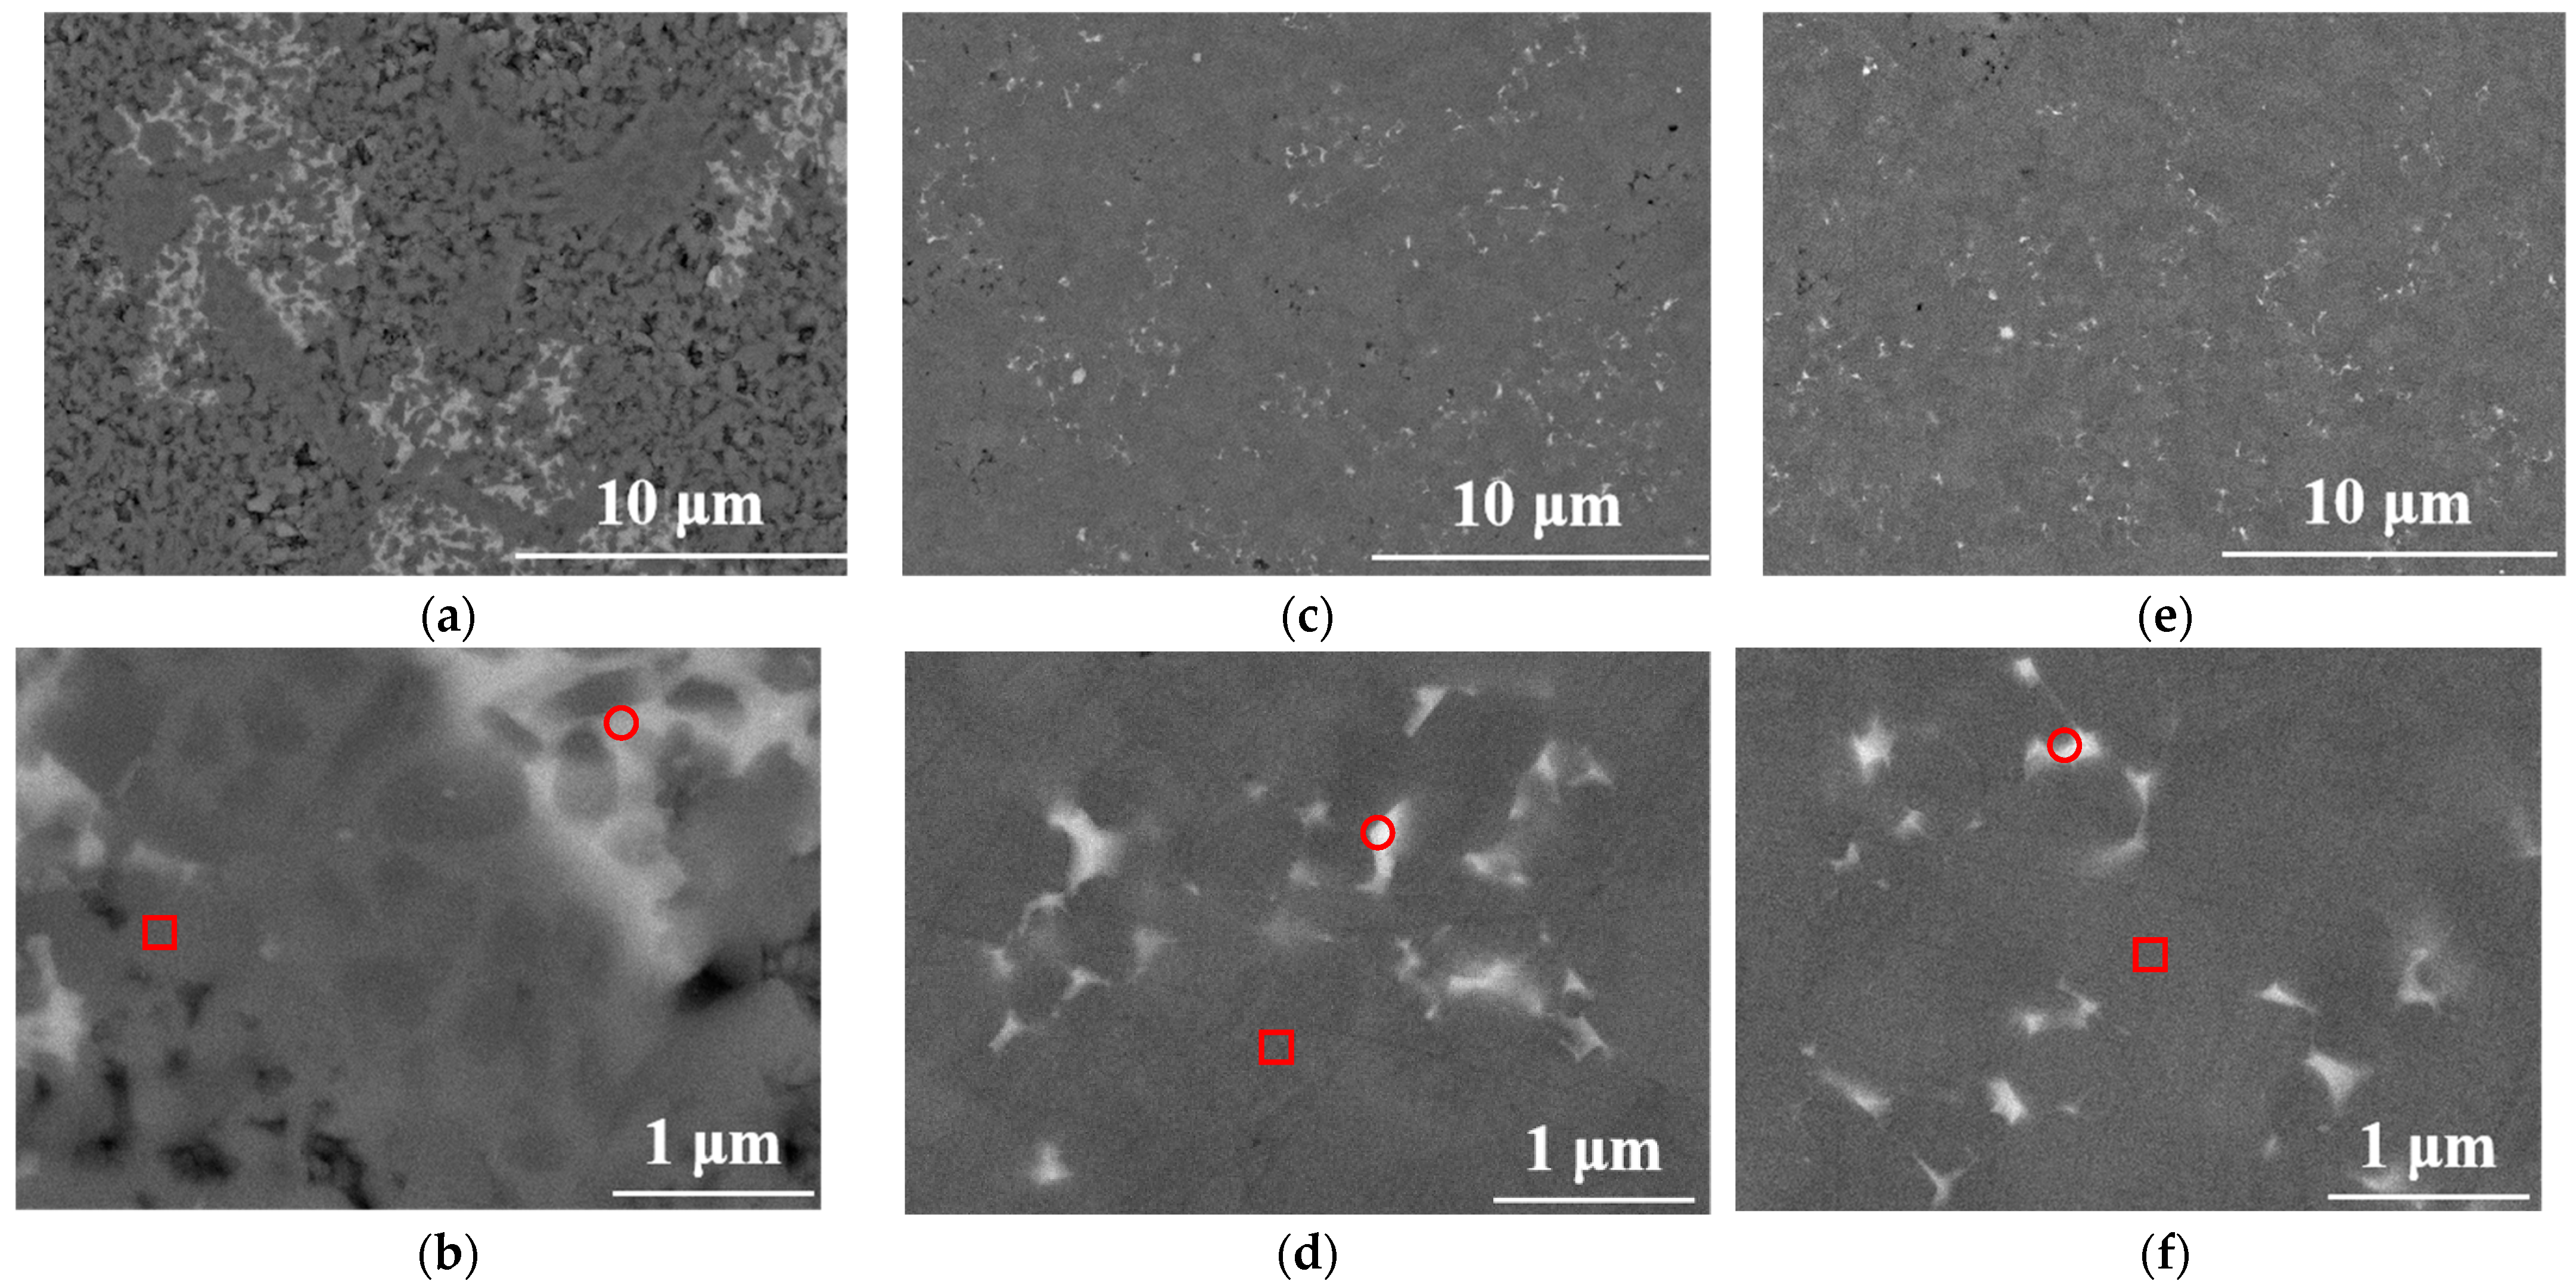
3.3. Microstructure of SiC at Different Sintering Temperatures

Figure 3 illustrates the BSE patterns of the polished surface of the silicon carbide samples after hot-press sintering. It is found that the liquid phase was primarily distributed at the grain boundaries of the silicon carbide. Table 2 provides the element contents in the silicon carbide grains (square markers) and liquid-phase regions (circular markers) as measured by EDS. It is inferred that the Al content inside the silicon carbide grains of Sample A was measured at 2.09 ± 0.08 at.%, while the Al content in the liquid-phase region was 14.90 ± 0.17 at.%. Upon increasing the sintering temperature to 1850 °C for Sample C, the Al content within the silicon carbide grains decreased to 0.64 ± 0.09 at.%, representing a 69% reduction compared to Sample A. Similarly, the Al content in the liquid-phase region of Sample C decreased to 5.01 ± 0.09 at.%, a 66% decrease relative to Sample A.
No traces of Y were found within the silicon carbide grains in Samples A, B, and C. This suggests that in the liquid-phase sintered silicon carbide system, Y primarily resided at the grain boundaries rather than within the grains themselves. Furthermore, the content of Y inside the liquid-phase region of the three samples decreased from 9.53 ± 0.43 at.% (Sample A) to 3.12 ± 0.31 at.% (Sample C), representing a 67% reduction.
The Ca content within the SiC grains in Sample A was determined to be 0.21 ± 0.09 at.%. When the sintering temperature rose to 1750 °C (Sample B), the Ca content within the SiC grains was found to be 0.52 ± 0.09 at.%, and as the temperature continued to increase, Ca was not detected within the SiC grains in Sample C. As the sintering temperature increased, the Ca content in the liquid-phase region decreased from 0.45 ± 0.10 at.% in Sample A to 0.13 ± 0.06 at.% in Sample C, representing a 71% reduction.
In liquid-phase sintered SiC, Al2O3-Y2O3-CaO was mainly distributed in the form of compounds at the grain boundaries of silicon carbide to form the liquid phase. A small amount of Al2O3-CaO diffused into the silicon carbide grains, and with increasing sintering temperature, the contents of Al, Y, and Ca displayed a decreasing trend, both within the silicon carbide grains and in the liquid-phase region. The observed phenomenon was attributed to the reaction between silicon carbide and alumina during the hot-pressing sintering process, as shown in Equations (2) and (3), leading to the volatilization of Al2O gas [27,28]. Furthermore, Al, Y, and Ca combined into compounds, and their contents decreased at a similar rate of approximately 70%. The volatilization of Al carried Y and Ca along, resulting in a corresponding decrease in their content.
S i C + A l 2 O 3 S i O ( g ) + A l 2 O ( g ) + C O ( g )
2 S i C + A l 2 O 3 2 S i ( l ) + A l 2 O ( g ) + 2 C O ( g )

3.4. Effect of TRISO Fuel on the Phase Transition of the SiC Matrix

Figure 4a illustrates the microstructure of TRISO fuel in the sample cutout after the hot-press sintering of Sample D (SiC-TRISO-1750 °C), indicating that the TRISO particles maintained their morphology without significant deformation, and there was no evident fracture at the interface between the TRISO particles and the matrix. The single-layer Si-TRISO composite fuel had a TRISO particle loading of 27 vol.%. The particles were distributed in an orderly fashion in the matrix to avoid high local thermal resistance and improve the thermal conductivity. Figure 1 shows the XRD spectra of the SiC-TRISO composite fuel after hot-press sintering at 1750 °C (Sample D), while Figure 4b illustrates the calculated contents of 3C-SiC, 6H-SiC, and 4H-SiC within the silicon carbide matrix. The latter figure revealed that after hot-press sintering at 1750 °C, the main phase of the SiC-TRISO composite fuel was 3C-SiC, comprising 87.7%. The observed value was 3% lower than the content in Sample B (SiC-1750 °C), suggesting that the inclusion of TRISO particles promotes the transformation of β-SiC to α-SiC. The primary transformed α-SiC phase in Sample D was based on 4H-SiC, similar to that observed in Sample B. The content of 4H-SiC in Sample D was 8.1%, a 40% increase compared to Sample B, while the content of 6H-SiC was 4.2%, showing an 8% increase.
The observed finding indicates that the incorporation of TRISO fuel enhanced the transformation of 3C-SiC into 6H-SiC and further accelerated the conversion from 6H-SiC to 4H-SiC. 3C-SiC has a hexagonal crystal system structure, which is an ordered atomic arrangement, and has a regular lattice vibration mode, which caused higher phonon transmission efficiency.

3.5. Thermal Conductivity of SiC-TRISO Composite Fuel

Figure 5a shows the variation in thermal diffusion with temperature after the hot-press sintering of Sample D (SiC-TRISO-1750 °C). The figure indicates that Sample D had a thermal diffusion coefficient of 0.25 c m 2 s at room temperature, which progressively declined as the test temperature increased. The thermal diffusion coefficient of Sample D was found to be 0.10 c m 2 s at 500 °C and decreased to 0.07 c m 2 s at 1000 °C, showing a continuous decline with increasing temperature. The thermal diffusion coefficient of Sample D was nearly identical to that of Sample B (SiC-1750 °C). According to Equation (4) [29], where D represents the thermal diffusion, D0 is the reaction constant, E is the diffusion activation energy, R denotes the gas constant, and T is the sintering temperature, the thermal diffusion coefficient depends solely on temperature. Therefore, adding TRISO fuel to the silicon carbide matrix does not significantly alter its thermal diffusion coefficient when sintered under the same conditions.
D = D 0 exp E R T
Figure 5b shows the variation in heat capacity with temperature for Sample D (SiC-TRISO-1750 °C) after hot-press sintering, demonstrating that the heat capacity of Sample D at room temperature was 0.75 J g · K . As the test temperature increased, the heat capacity of Sample D reached 1.11 J g · K at 500 °C, which was 9% lower than that of Sample B. When the temperature rose to 1000 °C, the heat capacity of Sample D increased to 1.20 J g · K , nearly matching the heat capacity of Sample B at 500 °C. The observed reduction in heat capacity may originate from changes in phase composition and microstructure. Furthermore, the presence of TRISO particles lowered the 3C-SiC content in the silicon carbide matrix compared to Sample B while increasing the proportions of 6H-SiC and 4H-SiC, thereby reducing the overall heat capacity.
Figure 5c shows a plot of thermal conductivity versus temperature after the hot-press sintering of Sample D (SiC-TRISO-1750 °C), calculated according to Equation (1). The figure reveals that the thermal conductivity of Sample D at room temperature after hot-press sintering was 57.96 W m · K , representing a 23% reduction compared to Sample B. Temperature exhibited a negative correlation with thermal conductivity. At 500 °C, the λ of Sample D was 34.51 W m · K , reflecting a 20% reduction compared to Sample B. When the temperature reached 1000 °C, the λ of Sample D further decreased to 25.10 W m · K .

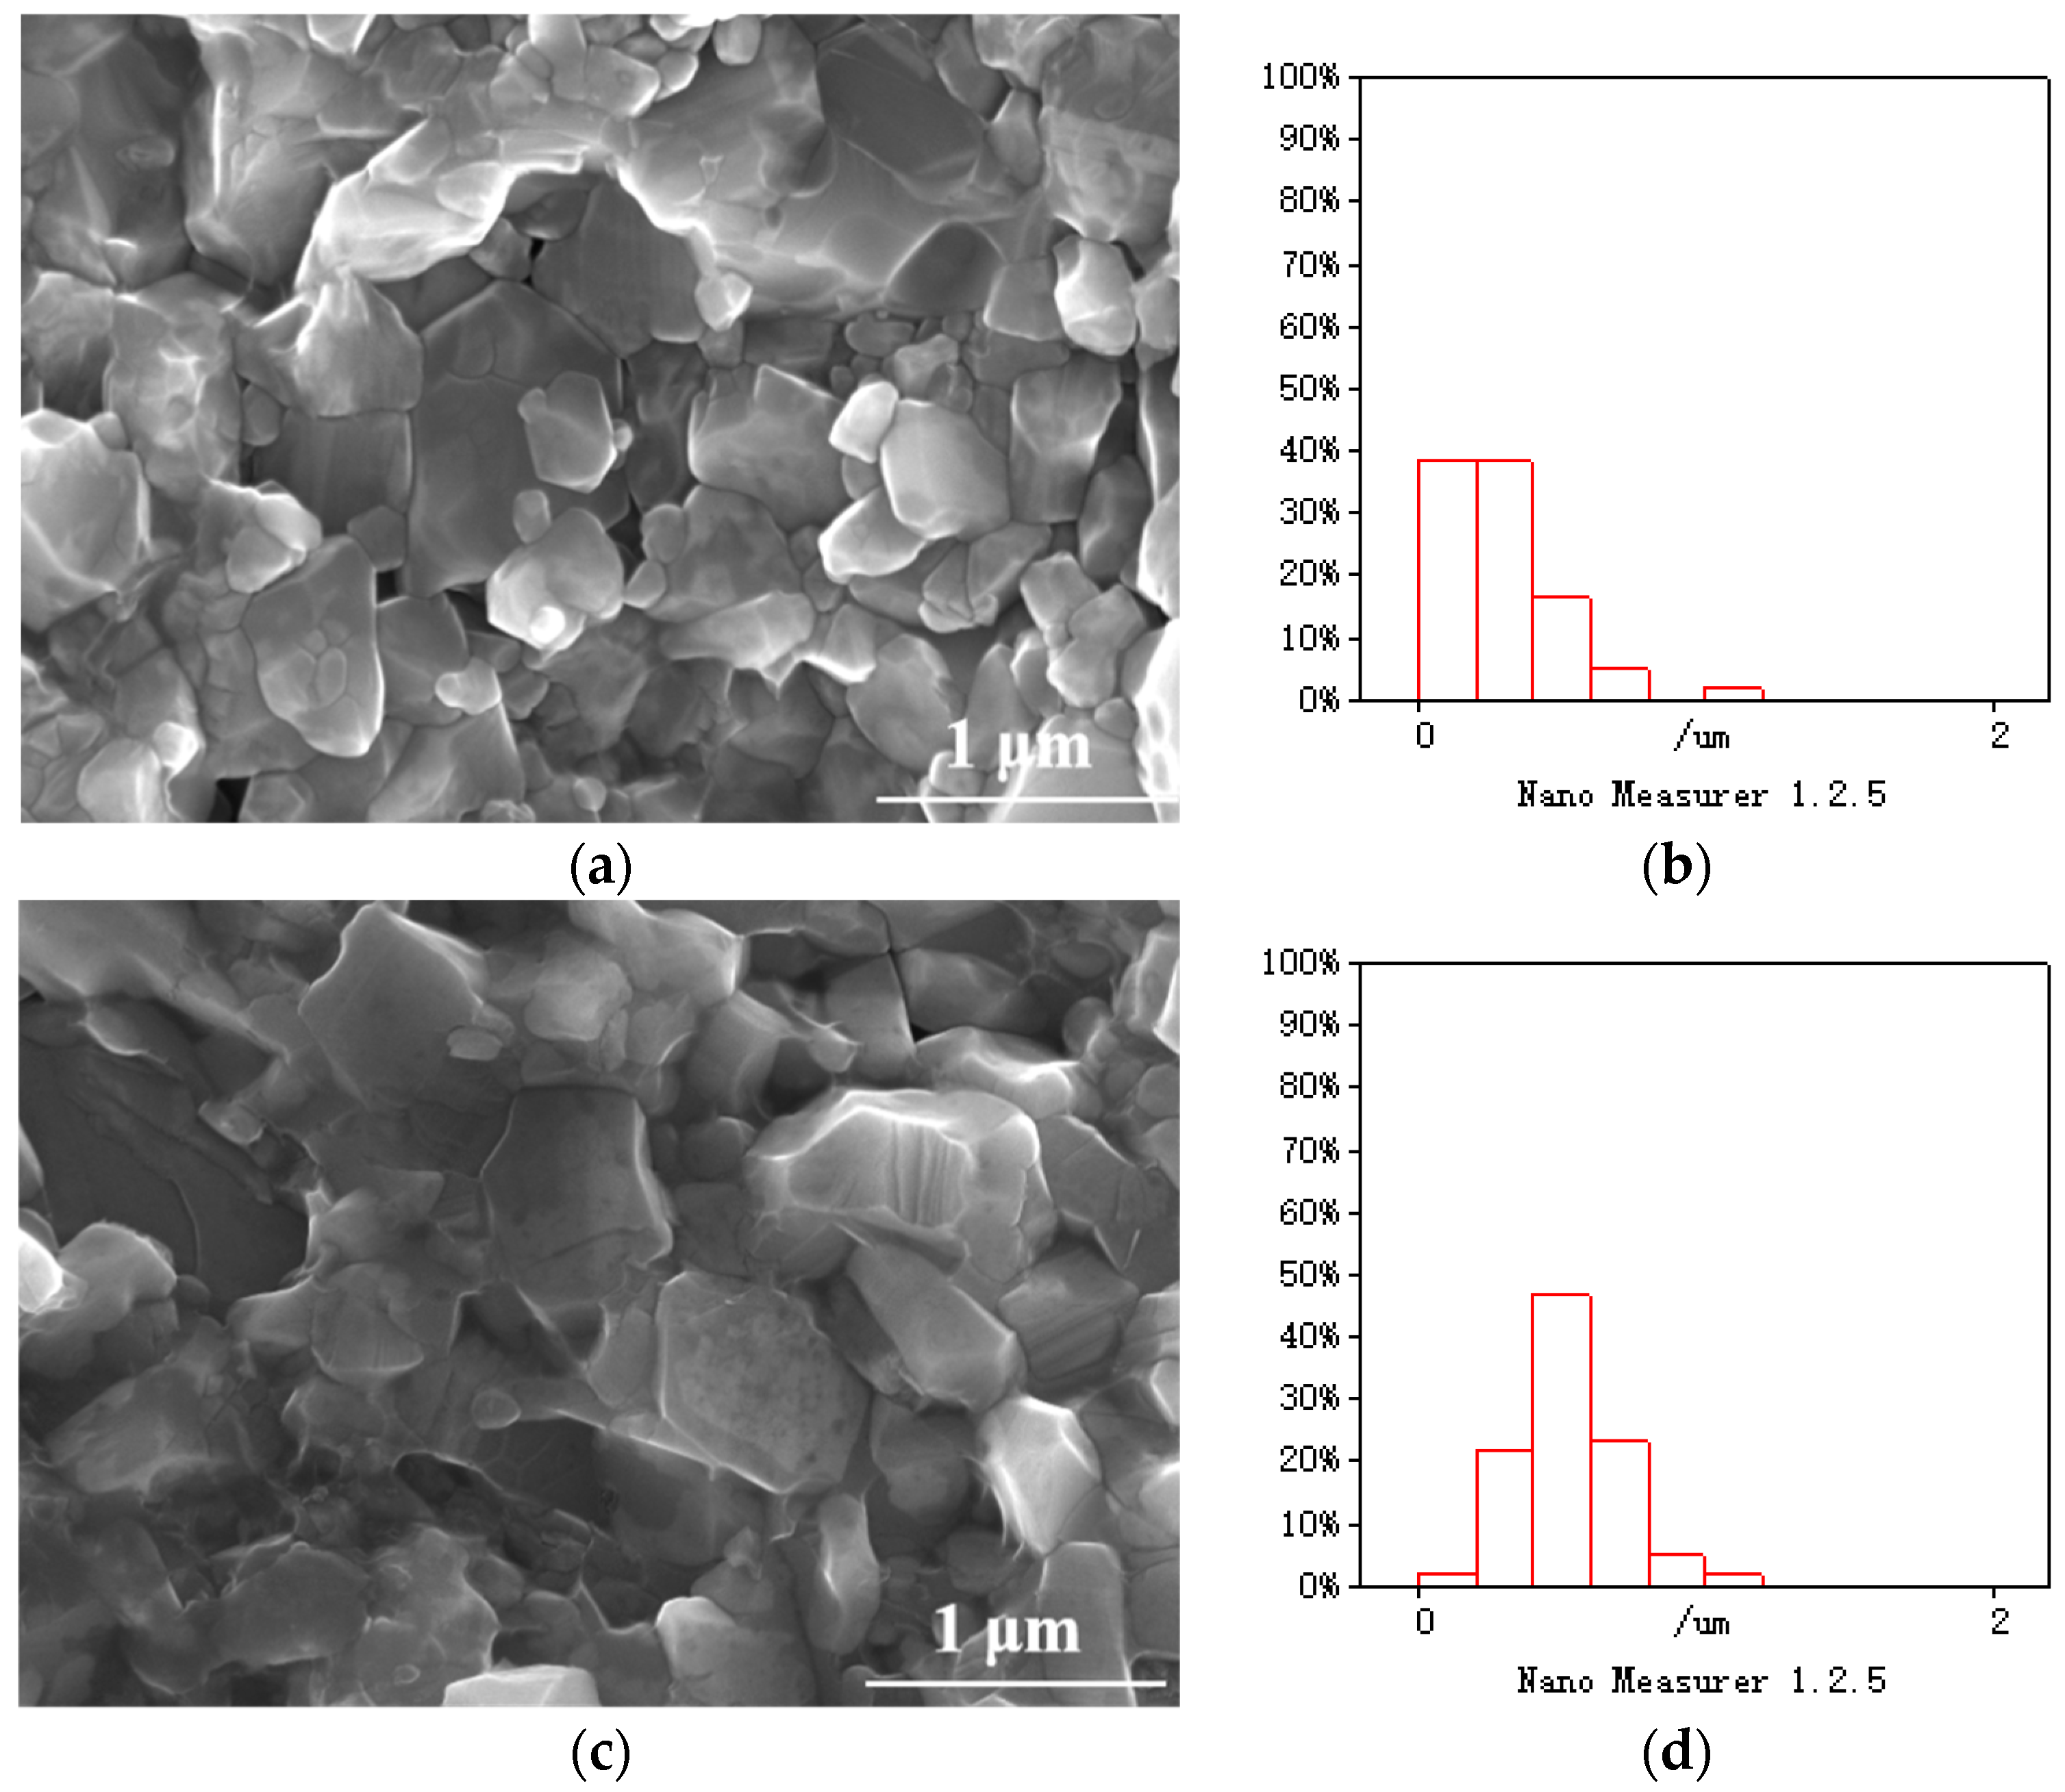
3.6. The Effect of TRISO Fuel on the Microstructure of the Silicon Carbide Matrix

Figure 6a,c show the secondary electron (SE) images of the cross-sections of silicon carbide samples after hot-press sintering, with Sample B (SiC-1750 °C) shown in Figure 6a and Sample D (SiC-TRISO-1750 °C) in Figure 6c. Figure 6b,d show the grain size distributions of Sample B and Sample D, determined by Nano Measurer software. As shown in the figures, the grain size of Sample B was primarily concentrated between 0.2 μm and 0.4 μm, with an average grain size of 0.28 μm. In comparison, the grain size of Sample D was primarily in the range of 0.4 μm to 0.6 μm, with an average grain size of 0.52 μm, nearly twice the size of Sample B. This observation suggests that the presence of TRISO particles facilitates the growth of silicon carbide grains. With the increase in grain size, the number of grain boundaries decreases, which reduces phonon scattering, so the thermal conductivity increases.
Figure 7a,b show the surface distribution of major elements in the cross-section of the silicon carbide samples after the hot-press sintering of Sample B (SiC-1750 °C) and Sample D (SiC-TRISO-1750 °C). Table 3 shows the statistics of major elements within the silicon carbide grains shown in Figure 7. From the data, it can be concluded that the carbon (C) content inside the silicon carbide grains of Sample D was 59.63 ± 0.52 at.%, while the silicon (Si) content was found to be 30.64 ± 0.61 at.%, with a C:Si ratio of approximately 2:1. This effect can be interpreted as the presence of a dense carbon layer on the outermost surface of the TRISO grains [30,31]. When numerous TRISO grains are systematically arranged within the silicon carbide matrix, this leads to the orderly incorporation of a significant amount of carbon into the matrix. During the hot-press sintering process, the reaction between SiC and the liquid phase generated gaseous SiO (Equation (2)) and liquid Si (Equation (3)), which reacted with the C layer on the surface of the TRISO grains (Equation (5)), thereby introducing C into the SiC grains and promoting their growth, as observed in Figure 6d.
S i O 2 + 3 C S i C + 2 C O ( g )
The Al content inside the silicon carbide grains of Sample D was found to be 1.85 ± 0.13 at.%, which was almost 34% lower than that of Sample B. Y and Ca were not detected inside the SiC grains of Sample D, demonstrating that the addition of TRISO particles promoted the diffusion and volatilization of the liquid phase during the hot-press sintering process. This, in turn, accelerated the reactions in Equations (2) and (3), further promoting the growth of the SiC grains. While the incorporation of TRISO particles resulted in larger silicon carbide grains, it also elevated the free-carbon content, leading to a greater number of grain boundaries. Simultaneously, the presence of TRISO particles decreased the content of 3C-SiC in the silicon carbide matrix (Figure 4), ultimately resulting in the λ of the SiC-TRISO composite fuel being lower than that of the silicon carbide without TRISO particles.

4. Conclusions

(1)
After the hot-press sintering of silicon carbide at 1650 °C, 1750 °C, and 1850 °C, the volume fractions of 3C-SiC in the matrix were 91.1%, 90.3%, and 52.2%, respectively. The λ values at room temperature were 18.66, 75.51, and 61.59 W m · K , which declined to 15.75, 43.36, and 40.57 W m · K at 500 °C.
(2)
As the sintering temperature increased, the concentrations of Al, Y, and Ca in both the silicon carbide grains and the liquid-phase region declined, with each element exhibiting a similar reduction of approximately 70%. The observed decrease was attributed to the reaction between silicon carbide and sintering aids, leading to the volatilization of Al, Y, and Ca in gaseous form.
(3)
The content of 3C-SiC in the SiC-TRISO composite fuel was determined to be 87.7%, which was 3% lower than that of the SiC sample. The λ values of the SiC-TRISO composite fuel were 57.96 and 34.51 W m · K at room temperature and 500 °C, respectively, approximately 20% lower than that of Sample B. The average silicon carbide grain size in the SiC-TRISO composite fuel was twice that of the SiC sample without TRISO particles. Furthermore, TRISO particles facilitated the 3C-SiC→6H-SiC→4H-SiC transformation. Moreover, the carbon layer on the outermost TRISO grains reacted with the liquid phase, promoting grain growth and increasing the free-carbon content. Simultaneously, the diffusion and volatilization of Al, Y, and Ca within the silicon carbide grains were enhanced, thereby reducing the thermal conductivity of the composite fuels.

Author Contributions

Conceptualization, methodology, and investigation, L.Z.; data curation and writing—original draft preparation, X.W.; writing—review and editing, Z.Z.; formal analysis and validation, Y.Y. All authors have read and agreed to the published version of the manuscript.

Funding

This research received no external funding.

Data Availability Statement

The data that support the findings of this study are available from the corresponding author, upon reasonable request.

Conflicts of Interest

The authors declare no conflicts of interest.

Nomenclature

SI
TRISOTri-structural Isotropic XRDX-ray diffraction
HTGCRHigh-temperature gas-cooled reactor SEMScanning electron microscopy
CpHeat capacity J k g · K EDSEnergy-dispersive spectroscopy
ρDensity k g m 3 BSEBack-scattered electron
λThermal conductivity W m · K SESecondary electron

References

  1. Fu, Z.; He, L.; van Rooyen, I.J.; Yang, Y. Comparison of microstructural and micro-chemical evolutions in the irradiated fuel kernels of AGR-1 and AGR-2 TRISO fuel particles. Prog. Nucl. Energy 2024, 176, 105361. [Google Scholar] [CrossRef]
  2. Feng, K.; Song, Q.; Shen, Y.; Lou, L.; Xiao, Y.; Guo, H.; Gu, H. Development and verification of an MC/MOC two-step scheme for neutronic analysis of FCM-fueled micro gas-cooled reactor. Ann. Nucl. Energy 2025, 211, 110940. [Google Scholar] [CrossRef]
  3. Recuero, A.M.; Singh, G.; Jiang, W. Fracture mechanics approach to TRISO fuel particle failure analysis. J. Nucl. Mater. 2024, 596, 155083. [Google Scholar] [CrossRef]
  4. Wu, C.; Yang, G.; Zhang, W.; Guo, X.; Liu, M. Numerical study of TRISO particles with random size and location distribution in cuboid and cylindrical matrix: A validation for two-regime heat conduction model. Nucl. Eng. Des. 2024, 423, 113193. [Google Scholar] [CrossRef]
  5. Zhang, C.; Wang, Y.; Wu, Y.; Liu, S.; Chen, P.; He, Y.; Yin, C.; Zhang, J.; Tian, W.; Su, G.; et al. Preliminary numerical investigation of TRISO-matrix interface debonding characteristics in fully ceramic microencapsulated fuel. Ann. Nucl. Energy 2021, 159, 108338. [Google Scholar] [CrossRef]
  6. Fang, M.; Di Fulvio, A. Rotation-invariant rapid TRISO-fueled pebble identification based on feature matching and point cloud registration. Ann. Nucl. Energy 2024, 203, 110527. [Google Scholar] [CrossRef]
  7. Hales, J.D.; Jiang, W. Versatile TRISO fuel particle modeling in Bison. Nucl. Eng. Des. 2024, 428, 113515. [Google Scholar] [CrossRef]
  8. Wei, H.; Zhang, J.; Zhang, Y.; Li, L.; Ding, S.; Ren, Q. Modeling of irradiation-induced thermo-mechanical coupling and multi-scale behavior in a fully ceramic-microencapsulated fuel pellet. J. Nucl. Mater. 2020, 544, 152673. [Google Scholar] [CrossRef]
  9. Al-Zahrani, Y.A.; Mehboob, K.; Mohamad, D.; Alhawsawi, A.; Abolaban, F.A. Neutronic performance of fully ceramic microencapsulated of uranium oxycarbide and uranium nitride composite fuel in SMR. Ann. Nucl. Energy 2021, 155, 108152. [Google Scholar] [CrossRef]
  10. Choi, J.Y.; Hong, S.G.; Kwon, H. Conceptual design of a long cycle small modular reactor core with annular UO2 and FCM (TRU) fuels. Int. J. Energy Res. 2020, 45, 11957–11975. [Google Scholar] [CrossRef]
  11. Jalan, V.; Bratten, A.; Shi, M.; Gerczak, T.; Zhao, H.; Poplawsky, J.D.; He, X.; Helmreich, G.; Wen, H. Influence of temperature, oxygen partial pressure, and microstructure on the high-temperature oxidation behavior of the SiC Layer of TRISO particles. J. Eur. Ceram. Soc. 2025, 45, 116913. [Google Scholar] [CrossRef]
  12. Ang, C.; Snead, L.; Kato, Y. A logical approach for zero-rupture Fully Ceramic Microencapsulated (FCM) fuels via pressure-assisted sintering route. J. Nucl. Mater. 2020, 531, 151987. [Google Scholar] [CrossRef]
  13. Lee, H.-G.; Kim, D.; Lee, S.J.; Park, J.Y.; Kim, W.-J. Distribution Analysis of TRISO-Coated Particles in Fully Ceramic Microencapsulated Fuel Composites. J. Korean Ceram. Soc. 2018, 55, 400–405. [Google Scholar] [CrossRef]
  14. Tan, J.; Huang, R.; Lin, H.-T.; Liu, M.; Liu, B.; Liu, R. Fully ceramic microencapsulated fuels with high TRISO particles loading capacity fabricated by gel-casting. J. Nucl. Mater. 2023, 581, 154449. [Google Scholar] [CrossRef]
  15. Kim, H.-M.; Kim, H.-M.; Kim, Y.-W.; Kim, Y.-W.; Lim, K.-Y.; Lim, K.-Y. Pressureless sintered silicon carbide matrix with a new quaternary additive for fully ceramic microencapsulated fuels. J. Eur. Ceram. Soc. 2019, 39, 3971–3980. [Google Scholar] [CrossRef]
  16. Kang, E.S.; Kim, Y.-W.; Lim, K.-Y.; Lee, S.-J. New quaternary additive for processing fully ceramic microencapsulated fuels without applied pressure. J. Eur. Ceram. Soc. 2022, 42, 1238–1248. [Google Scholar] [CrossRef]
  17. Kim, G.-D.; Kim, Y.-W. Processing of fully ceramic microencapsulated fuels with a small amount of additives by hot-pressing. J. Eur. Ceram. Soc. 2021, 41, 3980–3990. [Google Scholar] [CrossRef]
  18. Liu, C.; Huang, R.; Tan, J.; Lin, H.-T.; Liu, M.; Liu, B.; Liu, R. Fully ceramic microencapsulated fuels fabricated by tape casting. J. Nucl. Mater. 2022, 564, 153675. [Google Scholar] [CrossRef]
  19. Gong, J.; Yuan, R.; Song, X.; Wang, Y.; Liu, B.; Liu, M. Numerical analysis of effective thermal conductivity of FCM with multilayer TRISO particle. Nucl. Mater. Energy 2023, 36, 101501. [Google Scholar] [CrossRef]
  20. Wei, H.; Zhang, J.; Jian, X.; Zhang, Y.; Li, L.; Ding, S.; Ren, Q. Effects of the mesostructures and irradiation conditions on the ther-mo-mechanical coupling behaviors in LWR-used fully ceramic-microencapsulated fuel pellets. Nucl. Mater. Energy 2023, 34, 101387. [Google Scholar] [CrossRef]
  21. Kostanovskiy, A.V.; Zeodinov, M.G.; Kostanovskaya, M.E.; Pronkin, A.A. Thermal Conductivity of Silicicated Silicon Carbide at 1400−2200 K. High Temp. 2019, 57, 122–123. [Google Scholar] [CrossRef]
  22. Nakano, H.; Watari, K.; Hayashi, H.; Urabe, K. Microstructural Characterization of High-Thermal-Conductivity Aluminum Nitride Ceramic. J. Food Qual. 2002, 85, 3093–3095. [Google Scholar] [CrossRef]
  23. Martin, A.G.; Orihuela, M.; Ramirez-Rico, J.; Chacartegui, R.; Martínez-Fernández, J. Thermal conductivity of porous biomorphic SiC derived from wood precursors. Ceram. Int. 2016, 42, 16220–16229. [Google Scholar] [CrossRef]
  24. Wang, T.; Gui, Z.; Janotti, A.; Ni, C.; Karandikar, P. Strong effect of electron-phonon interaction on the lattice thermal conductivity in 3C-SiC. Phys. Rev. Mater. 2017, 1, 034601. [Google Scholar] [CrossRef]
  25. Kim, K.J.; Cho, T.-Y.; Kim, Y.-W.; Nishimura, T.; Narimatsu, E. Electrical and thermal properties of silicon carbide–boron nitride composites prepared without sintering additives. J. Eur. Ceram. Soc. 2015, 35, 4423–4429. [Google Scholar] [CrossRef]
  26. Zhan, G.; Xie, R.; Mitomo, M.; Kim, Y. Effect of β-to-α Phase Transformation on the Microstructural Development and Mechanical Properties of Fine-Grained Silicon Carbide Ceramics. J. Am. Ceram. Soc. 2001, 84, 945–950. [Google Scholar] [CrossRef]
  27. Kim, Y.; Mitomo, M.; Hirotsuru, H. Microstructural Development of Silicon Carbide Containing Large Seed Grains. J. Am. Ceram. Soc. 2010, 80, 99–105. [Google Scholar] [CrossRef]
  28. Mulla, M.A.; Krstic, V.D. Low-temperature pressureless sintering of silicon carbide with aluminum oxide and yttrium oxide additions. Am. Ceram. Soc. Bull. 1991, 70, 439–443. [Google Scholar]
  29. Liu, J.; Tian, C.; Xiao, H.; Guo, W.; Gao, P.; Liang, J. Effect of B4C on co-sintering of SiC ceramic membrane. Ceram. Int. 2019, 45, 3921–3929. [Google Scholar] [CrossRef]
  30. Gerczak, T.J.; Hunn, J.D.; Lowden, R.A.; Allen, T.R. SiC layer microstructure in AGR-1 and AGR-2 TRISO fuel particles and the influence of its variation on the effective diffusion of key fission products. J. Nucl. Mater. 2016, 480, 257–270. [Google Scholar] [CrossRef]
  31. Powers, J.J.; Wirth, B.D. A review of TRISO fuel performance models. J. Nucl. Mater. 2010, 405, 74–82. [Google Scholar] [CrossRef]
Figure 1. (a) XRD patterns of hot-press-sintered silicon carbide at 1650 °C, 1750 °C, and 1850 °C and hot-press-sintered SiC-TRISO composite fuel at 1750 °C. Graphs of Rietveld refinement: (b) Sample A, (c) Sample B, (d) Sample C, (e) Sample D.
Energies 18 01216 g001
Figure 2. Thermal properties versus temperature curves of hot-press-sintered silicon carbide samples for Sample A (1650 °C), Sample B (1650 °C), and Sample C (1650 °C). (a) Thermal diffusion, (b) thermal capacity, (c) thermal conductivity.
Energies 18 01216 g002
Figure 3. BSE images of polished surfaces of silicon carbide subjected to hot-press sintering: (a,b) Sample A, captured at magnifications of 5 K and 30 K; (c,d) Sample B at 5 K and 30 K magnifications; (e,f) Sample C with magnifications of 5 K and 30 K. (square markers are for silicon carbide grains and circular markers are for liquid-phase regions).
Energies 18 01216 g003
Figure 4. (a,b) Percentage of 3C, 6H, and 4H in samples of SiC and SiC-TRISO composite fuels after sintering by hot pressing at 1750 °C.
Energies 18 01216 g004
Figure 5. Thermal property versus temperature curves of 1750 °C hot-press-sintered SiC-TRISO samples: (a) thermal diffusion, (b) thermal capacity, (c) thermal conductivity.
Energies 18 01216 g005
Figure 6. (a,c) SE patterns of cross-sections of hot-press-sintered silicon carbide samples (Sample B (1750 °C) and Sample D (SiC-TRISO-1750 °C)); (b,d) size distributions of grains of Sample B (1750 °C) and Sample D (SiC-TRISO-1750 °C).
Energies 18 01216 g006
Figure 7. Faceted distribution of major elements within silicon carbide grains after hot-press sintering of (a) Sample B (1750 °C) and (b) Sample D (SiC-TRISO-1750 °C).
Energies 18 01216 g007
Table 1. Percentage of 3C, 6H, and 4H in sintered SiC samples at different temperatures.
Sample No.Sample DesignationSintering TemperaturePolytype Content (%)
3C6H4H
ASiC1650 °C919<1
BSiC1750 °C9046
CSiC1850 °C523810
Table 2. Content of major elements within SiC grains and in the liquid phase (at.%). (“–” is for not detected).
ElementSample A (1650 °C)Sample B (1750 °C)Sample C (1850 °C)
SiC GrainLiquid PhaseSiC GrainLiquid PhaseSiC GrainLiquid Phase
C47.89 ± 0.4617.05 ± 0.3849.50 ± 0.4037.59 ± 0.4151.68 ± 0.6444.74 ± 0.37
Si45.24 ± 0.4419.02 ± 0.2242.67 ± 0.3833.62 ± 0.3247.68 ± 0.6331.44 ± 0.29
Al2.09 ± 0.0814.90 ± 0.172.80 ± 0.085.79 ± 0.100.64 ± 0.095.01 ± 0.09
Y9.53 ± 0.433.86 ± 0.363.12 ± 0.31
Ca0.21 ± 0.090.45 ± 0.100.52 ± 0.090.28 ± 0.080.13 ± 0.06
O4.57 ± 0.1539.05 ± 0.284.51 ± 0.1418.86 ± 0.2015.55 ± 0.17
Table 3. Elemental composition (at.%) within SiC grains after hot-press sintering of Sample B (1750 °C) and Sample D (SiC-TRISO-1750 °C).
No.CSiAlYCaO
Sample B49.50 ± 0.4042.67 ± 0.382.80 ± 0.080.52 ± 0.094.51 ± 0.14
Sample D59.63 ± 0.5230.64 ± 0.611.85 ± 0.137.88 ± 0.27
Disclaimer/Publisher’s Note: The statements, opinions and data contained in all publications are solely those of the individual author(s) and contributor(s) and not of MDPI and/or the editor(s). MDPI and/or the editor(s) disclaim responsibility for any injury to people or property resulting from any ideas, methods, instructions or products referred to in the content.

