Article

Deep Reinforcement Learning-Based Distribution Network Planning Method Considering Renewable Energy

1
State Grid Economic and Technological Research Institute Co., Ltd., Beijing 102209, China
2
School of Electrical and Information Engineering, Tianjin University, Tianjin 300072, China
*
Author to whom correspondence should be addressed.
Energies 2025, 18(5), 1254; https://doi.org/10.3390/en18051254
Submission received: 2 January 2025 / Revised: 10 February 2025 / Accepted: 19 February 2025 / Published: 4 March 2025

Abstract

:
Distribution networks are an indispensable component of modern economic societies. Against the background of building new power systems, the rapid growth of distributed renewable energy sources, such as photovoltaic and wind power, has introduced many challenges for distribution network planning (DNP), including different source-load compositions, complex network topologies, and varied application scenarios. Traditional heuristic algorithms are limited in scalability and struggle to address the increasingly complex optimization problems of DNP. The emergence of new artificial intelligence provides a new way to solve this problem. Based on the above discussion, this paper proposes a DNP method based on deep reinforcement learning (DRL). By defining state space and action space, a Markov decision process model tailored for DNP is formulated. Then, a multi-objective optimization function and a corresponding reward function including construction costs, voltage deviation, renewable energy penetration, and electricity purchase costs are designed to guide the generation of network topology schemes. Based on the proximal policy optimization algorithm, an actor-critic-based autonomous generation and adaptive adjustment model for DNP is constructed. Finally, the representative test case is selected to verify the effectiveness of the proposed method, which indicates that the proposed method can improve the efficiency of DNP and promote the digital transformation of DNP.

1. Introduction

As an important component of modern power systems, distribution networks play a crucial role in promoting economic development, improving livelihoods, and facilitating energy transitions [1,2,3]. With the development of distributed renewable energy sources (such as photovoltaics (PVs) [4] and wind turbine generators (WTGs) [5]) and the emergence of new load types (such as electric vehicle), distribution systems are characterized by diverse source-load configurations and a complex grid structure. In addition, the variability of solar irradiance and wind speed in different regions brings uncertainties, which present new challenges for the task of distribution network planning (DNP). However, traditional planning methods primarily rely on human experience, which are influenced by planners’ expertise. These methods have the drawbacks of low efficiency and suboptimal quality. Therefore, how to choose appropriate methods to achieve efficient DNP schemes generation is a worthy issue.
As an effective tool, heuristic algorithms [6,7,8] (such as the simulated annealing algorithm (SAA), genetic algorithm (GA), ant colony optimization (ACO), and particle swarm optimization (PSO)) are widely used in the field of distribution networks. By integrating the steepest descent method with the SAA, ref. [9] proposed a DNP approach in which the capital recovery, energy loss, and undelivered energy costs were considered simultaneously. By combining a GA with the k-nearest neighbors structure, a hybrid GA-based radial distribution network reconfiguration method was displayed in [10] which reduced the search space while enhancing planning performance. Ref. [11] employed fuzzy logic systems to process the objective function and further utilized ACO to determine the optimal solution, which solved the optimal configuration of switching devices in the distribution network. A two-stage heuristic structure was constructed in [12] to choose the switches, and the reconfiguration of radial distribution networks was solved. By employing heuristic algorithms to determine the service areas of substations, ref. [13] addressed the substation planning problem for large-scale distribution networks. Additionally, the unreliability of feeders and substations was studied simultaneously. Ref. [14] proposed a new hybrid optimization approach combining PSO and Tabu Search to deal with the expansion planning of large-scale electric distribution networks. Ref. [15] solved the multi-objective reconfiguration of distribution networks with distributed power sources, in which an improved binary PSO algorithm was designed to enhance global search ability and accelerate convergence. By combining binary PPO for network investment decisions and inner optimization for flexibility procurement, cost-effective and adaptable distribution network expansion planning was achieved in [16]. A GA and PSO were combined in [17] to determine the best locations and sizes of distributed generation units, which reduced power losses and enhance voltage stability while respecting safe constraints. Based on PSO, an enhanced fault-recovery reconfiguration method for DC distribution networks was proposed in [18] which ensured that power can be quickly restored after a fault occurs. However, heuristic algorithms have limited solving capabilities, and the solutions generated by heuristic algorithms exhibit low generalization, which makes it difficult to address the increasingly complex optimization problems of DNP. Nowadays, artificial intelligence technologies have been applied in the entire spectrum of power systems, including generation, transmission, substations, distribution, and consumption. Moreover, many complex tasks, such as load forecasting [19], voltage stability control [20], and emergency control [21], have been implemented by utilizing artificial intelligence technologies.
In recent years, the artificial intelligence technologies represented by deep reinforcement learning (DRL) have experienced rapid development [22]. By combining deep learning and reinforcement learning, DRL can effectively deal with complex decision problems. The main idea of DRL is that agents continuously interact with their environment to obtain optimal policies. Recently, DRL has been extensively applied in the field of power systems, such as voltage control [23], frequency control [24], and load shedding control [25]. In [23], uncertainties in operating conditions and system physical parameters were considered, and a DRL-based voltage control approach was proposed for maintaining voltage within a safe range. Based on multi-agent DRL, a data-driven frequency control method for multi-area power systems was proposed in [24] which effectively reduced the frequency fluctuations caused by load variations and renewable energy sources. By designing a novel voltage-based reward function, the deep deterministic policy gradient (DDPG) algorithm was utilized to achieve load shedding control in [25], improving the ability of anti-disturbance. Refs. [26,27,28] utilized soft actor-critic to solve issues in electric vehicle charging, dynamic network reconfiguration, and volt-VAR control, respectively. By utilizing the DDPG to distribute torque between two motors to enhance energy efficiency, a hierarchical energy management strategy structure was constructed in [29]. In [30], a multi-agent DRL approach was developed which combined discrete DQN and continuous DDPG on different time scales to optimize long-term voltage deviations. In [31], risk sensitivity and the uncertainties of renewable generation were integrated in TRPO, and a systematic way for multiple microgrids to cooperate was proposed. Proximal policy optimization (PPO) [32] was proposed by OpenAI in 2017, which is a reinforcement learning method based on the actor-critic (AC) architecture. By integrating trust region policy optimization with the advantage AC, the PPO algorithm prevents performance degradation caused by excessively large policy updates. In [33], a two-level planning model based on PPO was developed, and a grid structure optimization algorithm based on electrical coupling degree was proposed which reduced the search space and alleviated the difficulty of acquiring splitting sections. In [34], a multi-agent PPO was introduced to construct the multi-layer energy management system to deal with challenges in mechanism modeling and supply-demand uncertainty. PPO was introduced to learn the optimal policy for flexible battery energy storage systems in [35], in which the working time and the balancing performance were optimized simultaneously. Ref. [36] presented a PPO-based decentralized framework for the voltage control of microgrids. Ref. [37] took cyber contingencies into consideration, designing a graph-based DRL framework in which the graph information was embedded into the PPO algorithm to alleviate the impact of cyber contingencies. Stackelberg–Nash PPO was constructed in [38] to deal with the influence of neglecting consumers’ interests and temporal relationships between participant actions. Based on the above discussion, DRL has been applied in multiple fields such as voltage control, reactive power dispatch, load shaping, demand response, and energy storage optimization. However, there are still some issues that need to be resolved; for example, few DNP studies consider the topology structure of distribution networks, while some DRL frameworks only focus on one main objective and neglect other factors. Thus, we propose a DRL-based DNP method considering renewable energy in this paper. The contribution of this paper is as follows:
(1)
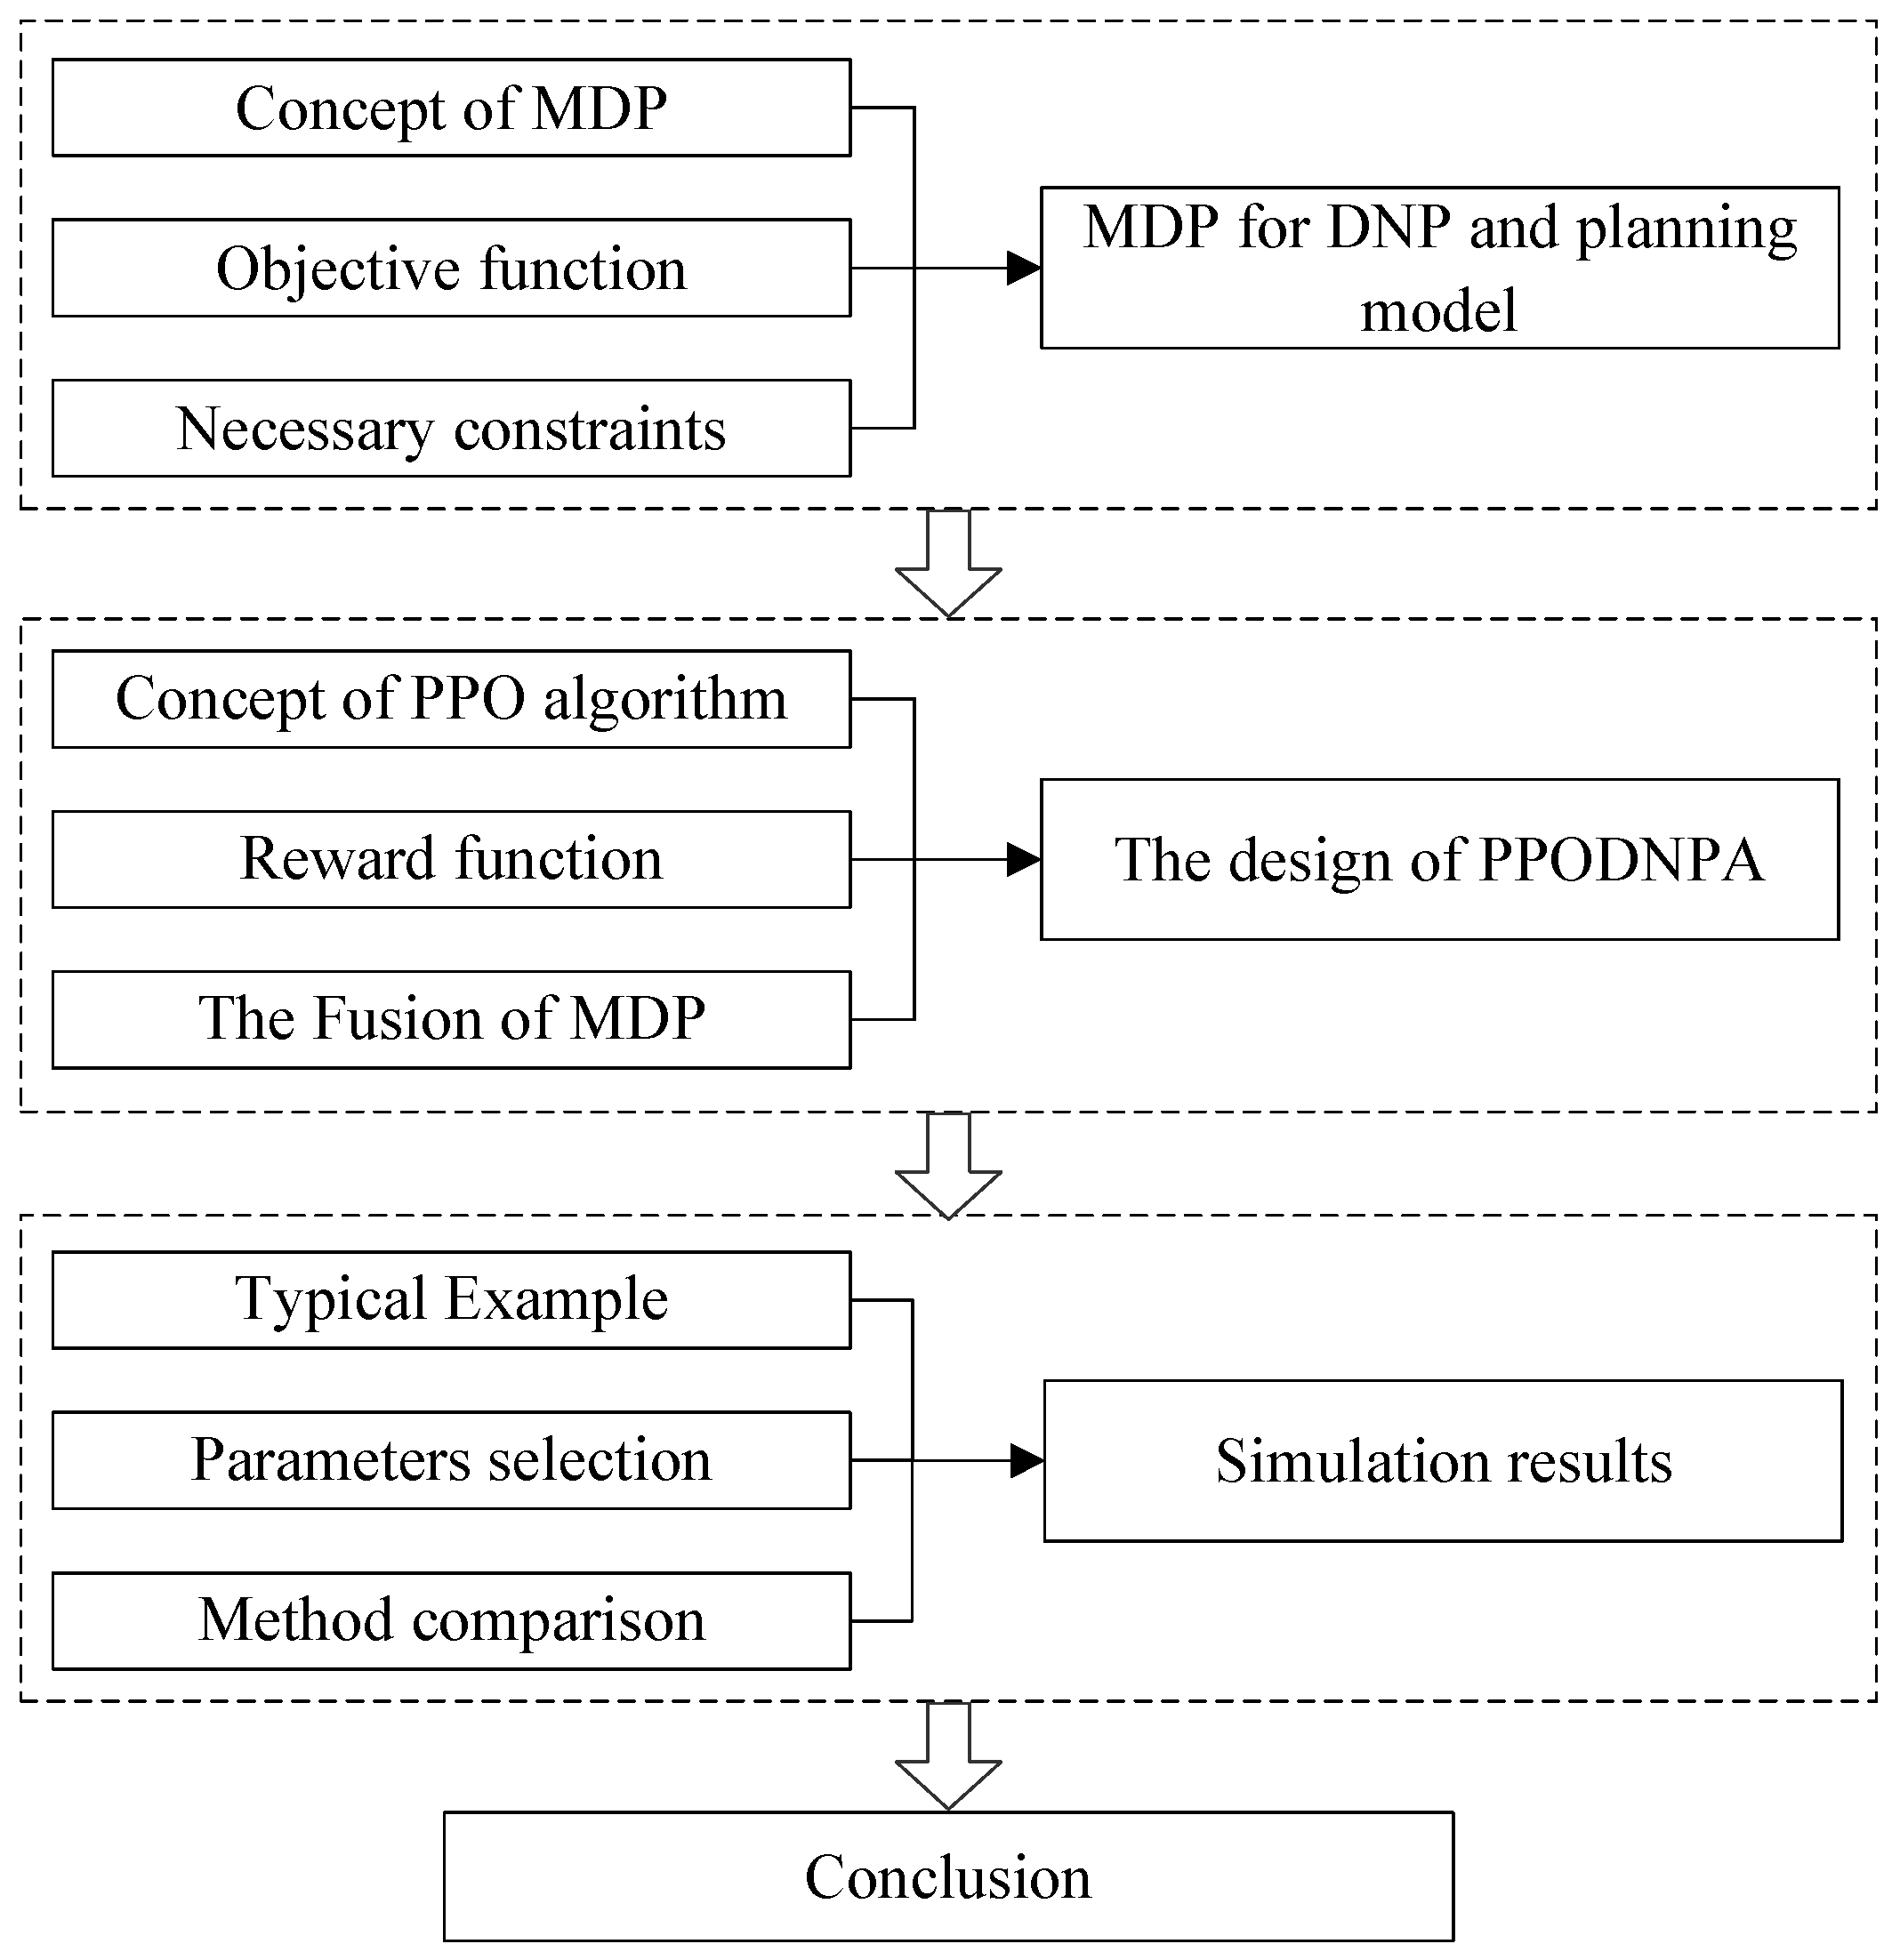
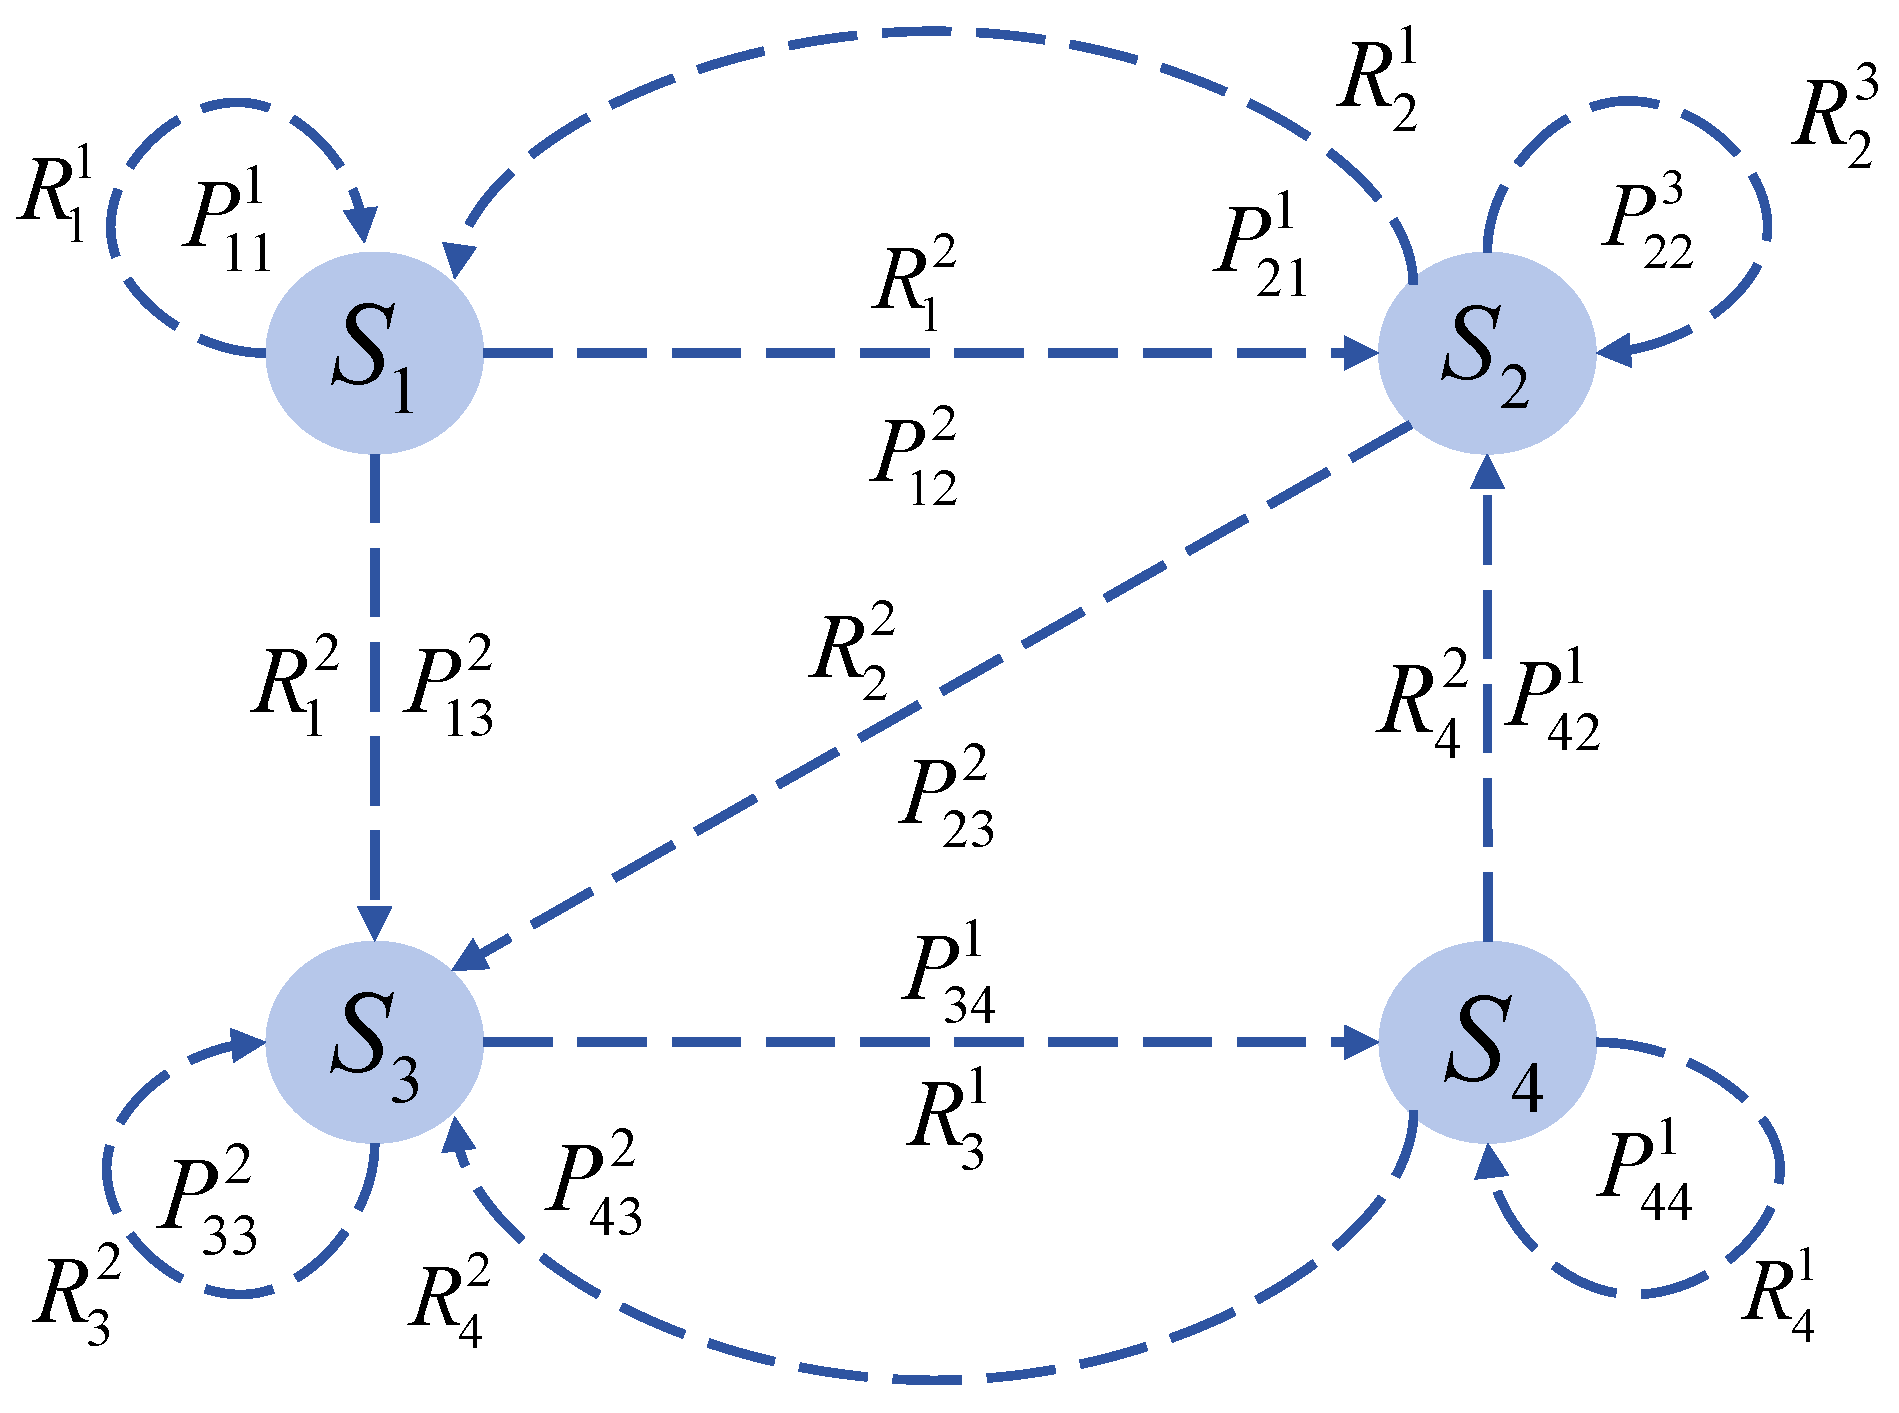
By designing the action space and state space, we construct a Markov decision process (MDP) for DNP. Through this transformation, the problem of DNP can thus be integrated into the DRL framework.
(2)
Considering line construction costs, voltage deviation, renewable energy subsidies, and electricity purchasing costs, a multi-objective optimization function is designed. Additionally, a multi-reward function is developed to guide the agent to learn the optimal policy. After sufficient training, the agent can generate optimized planning schemes.
(3)
Based on the AC architecture, a PPO-based DNP algorithm (PPODNPA) is designed. The actor network (AN) generates planning schemes upon receiving reward signals and environmental states, while the critic network (CN) further evaluates these schemes to optimize the AN, which achieves the autonomous generation and adaptive tuning of the planning scheme. Simulation results validate the superiority of the proposed algorithm.
The remaining part of the paper is as follows: In Section 2, the MDP for DNP and planning model is defined. In Section 3, the PPODNPA is designed, which achieves the autonomous generation and adaptive tuning of the DNP scheme. In Section 4, the simulation results are displayed and heuristic algorithms are introduced to demonstrate the superiority of PPODNPA. A flow chart of this paper is displayed in Figure 1.

2. MDP for DNP and Planning Model

2.1. MDP for DNP

In general, MDP can be represented by a quintuple ( S , A , P , R , γ )  [39], where S denotes the set of states, A denotes the set of actions, P represents the state transition probabilities, and R is the reward. The diagram of the MDP is illustrated in Figure 2, where S i corresponds to the ith state, P i j k denotes the probability of transitioning from state s i to state s j after taking action a k , and R i k indicates the immediate reward generated by taking action a k in state s i .
Considering the characteristics of DNP tasks, we assign physical meanings to various parameters of the MDP model. First, we define the state space as
S = P W T G , Q W T G , P P V , Q P V , L m , U i , I i j , D W T G , D P V , S i j
where P W T G and Q W T G represent the active power and reactive power of WTG, P P V and Q P V represent the active power and reactive power of PV, L m represents the construction status of the lines, U i represents the node voltage, I i j represents the line current, D W T G and D P V represent the installation status of PV and WTG, and S i j represents the result of load flow calculation. Then, we define the action space:
A = a l , a W T G , a P V
where a l represents the construction of lines, a W T G represents the construction of WTG, and a P V represents the construction of PV.
Remark 1.
It should be noted that load fluctuations, uncertainties in solar irradiance, and regional variations in wind power are factors that need to be considered. In this study, we use normal distribution to simulate uncertainties in PV output and load, and use Weibull distribution to simulate uncertainties in WTG output.
After defining the state space and action space, we establish the transition of the distribution network framework: By applying an action to the initial network, both its topology and the installation status of renewable energy sources will be changed. Due to the inherent uncertainties associated with renewable energy, state variables such as power, line current, and node voltage will be converted into other states with certain probabilities. This definition will be utilized in the subsequent algorithm design. In the next section, the planning model will be further proposed, which includes the objective function and some necessary constraints.

2.2. Planning Model

The objective function is the economic cost of DNP considering renewable energy, which includes investment cost, electricity purchase cost, and renewable energy subsidies. It is defined as follows:
min : C total = N cost k ( 1 + k ) y ( 1 + k ) y 1 + β 1 E buy β 2 E sub
where N cost represents the initial investment cost of the grid structure, k is the discount rate, y is the service life, the overhead line is taken as 30 years, the cable is taken as 40 years, and the factor k ( 1 + k ) y ( 1 + k ) y 1 can convert the initial investment into the equivalent year cost. β 1 = 0.394 CNY/kW · h represents the purchase price for purchasing electricity from the external grid, E buy is the amount of electricity purchased from the external grid to satisfy local demand. β 2 = 0.2 CNY/kW · h represents the subsidy unit price of renewable energy, and E sub represents the amount of renewable energy generation.
To ensure safe, reliable, and efficient operation of the DNP, the following constraints are incorporated:
(1)
Power balance constraints [40]
U i , t ac = U i , t ac r i i ac H i i , t ac + x i i ac G i i , t ac / U 0 ac , i , i , t : β i i , t ac P i , t de L i , t ac + j 1 Ω i 1 l L P i 1 j 1 , l , t ac P i 1 j 1 , l , t acdc = i π ( i ) H i i , t ac i δ ( i ) H i i , t ac P i , t w ρ i , t w , i , t : β i , t ac 2 Q i , t de Q i , t ac = i π ( i ) G i i , t ac i δ ( i ) G i i , t ac , i , t : β i , t ac 3
where U i , t ac is the voltage magnitude, r i i ac and x i i ac are the resistance and reactance, respectively. H i i , t ac and G i i , t ac are the active and reactive power flow, respectively. P i , t de and L i , t ac are the output of the distributed generation and active load, respectively. P i , t w and ρ i , t w are the predicted wind power and curtailed wind power, respectively. Q i , t de and Q i , t ac are the reactive power of diesel engines and the reactive load, respectively. Equation (4) ensures that the power flowing into each node balances the load, generation, and line losses, which reflects Kirchhoff’s current and voltage laws.
(2)
The line current constraint and voltage constraint are calculated as follows:
I j min I j I j max U i min U i U i max
where I j max and I j min are the maximum and minimum values of the current, respectively, which reflect the thermal limits of the overhead line and cable. U i max and U i min are the maximum and minimum values of the voltage, respectively, which ensure power quality. Considering Equation (5) can prevent the overheating of lines and maintain the node voltage within safe ranges.
(3)
The active power constraint is calculated as follows:
P i P i max
where P i is the active power of the line and P i max is the maximum active power. This constraint ensures that no line is influenced by real-power flows beyond its rated capability.
(4)
Line flow constraints
S i j S i j max
where S i j is the line flow, and S i j max is the maximum value of the line flow. Considering Equation (7) can limit the power flow to safe levels considering both real power and reactive power.
(5)
Radial grid constraint
n = m + 1
where n is the number of nodes in the distribution network, and m is the sum of the original and future lines. This constraint ensures a radial topology of grid structure, which is a common structural requirement in DNP.
The investment cost, electricity purchase cost from external sources, and the subsidy income generated by renewable energy generation are comprehensively considered in the planning model. The objective is to minimize the total cost under the power balance constraints, line current and voltage constraints, active power constraints, line flow constraints, and radial grid constraints. By obtaining an equilibrium solution between economic viability and renewable energy utilization, this planning model provides a systematic framework for DNP, and the resulting solution can give a more sustainable, cost-effective, and reliable DNP scheme.

3. The Design of the PPODNPA

3.1. PPO Algorithm

PPO algorithm is an actor-critic method which includes CN and AN. As illustrated in Figure 3, AN is responsible for generating action probability distributions, and CN provides evaluated reward values. Consequently, the AN does not need to compute cumulative rewards for each episode. Instead, it learns from the reward evaluations supplied by the CN, which enables single-step updates and enhances training efficiency. The CN fits more accurate value functions through temporal difference (TD) errors to help the AN in selecting actions.
The basic principle of the PPO algorithm is to use policy gradient for updating, and the update objective and rule of policy gradient are displayed as follows:
L P G ( θ ) = E ^ t log π θ a t s t A ^ t
g ^ = E ^ t θ log π θ a t s t A ^ t
where π θ is a stochastic policy and A ^ t is the estimated value of advantage function. However, the policy gradient algorithm relies on the update step size. Therefore, the trust domain method (TRPO) measures the distribution difference between new and old policies through KL divergence and constrains it. Then, the objective optimization function is modified to
maximize θ E ^ t π θ a t s t π θ o l d a t s t A ^ t
E ^ K L π θ old a t s t , π θ · s t δ
where θ old is the parameter of old policy. Directly solving the TRPO constraint problem will bring significant computational complexity. In order to improve computational efficiency, PPO has further simplified the TRPO objective function. By defining the probability ratio of the distribution of new and old strategies r t ( θ ) = π θ a t s t π θ old a t s t , the object function can be written as
L ( θ ) = E ^ t π θ a t s t π θ old a t s t A ^ t = E ^ t r t ( θ ) A ^ t .
In addition, PPO prunes the probability distribution ratio to limit its policy updates:
L C L I P ( θ ) = E ^ t min r t ( θ ) A ^ t , clip r t ( θ ) , 1 ε , 1 + ε A ^ t .
For a complete turn trajectory T = s 0 , a 0 , r 0 ; s 1 , a 1 , r 1 ; s 2 , , a n 1 , r n 1 , s n and strategy network π θ a t s t , use state action function Q π s t , a t as the evaluation value of state action pairs, and use state value function V π s t as the evaluation baseline; then, the following advantage function is defined
A π s t , a t = r + γ V π s t + 1 V π s t .
The loss function of AN is
L ( θ ) = E min r t ( θ ) A ^ t , clip r t ( θ ) , 1 ε , 1 + ε A ^ t
And the loss function of CN is
L ( ω ) = E r t + γ V s t + 1 V s t 2 .
In order to prevent overfitting caused by the strategy network being too fast, which leads to premature convergence of the agent and inability to effectively explore environmental information, regularization entropy is added as a penalty term in the final loss function. Therefore, the loss function of the AC PPO algorithm framework can be expressed as follows:
Loss = a L ( θ ) + b L ( ω ) c ENT π θ
where a = 1 , b = 0.5 , c = 0.01 are the loss proportion coefficients.
Overall, PPO has the following advantages: By modifying the objective function to penalize large deviations between new and old policies, the trust region of the policy update can be ensured, which can achieve more stable training. Unlike TRPO, the second-order derivatives and large matrix inversions are not needed, which is relatively easy to implement. The hyperparameters of PPO are relatively robust, which makes PPO perform outstandingly in various complex tasks.

3.2. PPODNPA

By integrating the MDP of DNP into the AC-based PPO algorithmic framework, we propose the PPODNPA algorithm, which is illustrated in Figure 4. In this approach, the DNP environment is first initialized with a set of states. Based on these initial states, the AN generates a series of actions, such as building lines and installing renewable energy sources in the power grid. Influenced by these actions, the environment states transition to a next set of states according to a probabilistic distribution and an immediate reward is produced. The CN receives the reward and states, evaluates the quality of the actions, and then provides the action advantage function back to AN, thereby further training the AN. After sufficient training, the actions generated by the agent (which dictate the configuration of the grid) are optimized to meet the specified planning objectives. The reward function in the PPODNPA is designed as
R total = α 1 C line α 2 C vol α 3 C buy + α 4 C sub + R 5
where the parameters α 1 , α 2 , α 3 , α 4 serve as the respective weighting factors. These factors can be adaptively adjusted to accommodate various practical requirements. Notably, the parameter R 5 plays a critical role: if no renewable energy resources are installed in the resulting grid configuration, R 5 will impose a penalty. This mechanism ensures a certain level of renewable energy penetration in the final plan.
In the PPODNPA, the distribution network planning environment (DNPE) represents the distribution network prior to the construction of lines and the integration of renewable energy sources. When agent actions are applied to the DNPE, it performs power flow calculations to calculate the node voltages, line currents, and power flows. In addition, the DNPE also calculates line construction costs, distributed renewable energy subsidies, and the costs of purchasing electricity from the up-level grid. These calculated parameters are then transmitted back to the CN, which can guide the AN updates. The procedure of the PPODNPA is displayed in Algorithm 1.
Algorithm 1 PPODNPA Algorithm Procedure
  1:
Algorithm Output: Actor policy network π θ which can output optimized actions of line construction and renewable energy installation, Critic value network Q ω which can approximate the state value function V π s t .
  2:
Randomly initialize the policy network parameters and the value network parameters.
  3:
for episode = 1, 2, … do
  4:
     (a) Data Collection:
  5:
     Use the old policy π θ old to interact with the DNP environment.
  6:
     In each time step t, sample action a t π θ old ( a s t ) , update the grid/renewable configuration, run power flow calculation, and obtain next state s t + 1 and immediate reward r t .
  7:
     Continue until reaching the episode end or a terminal condition.
  8:
     (b) Advantage Computation:
  9:
     For each transition ( s t , a t , r t , s t + 1 ) , compute the TD advantage function A t using
A t = r t + γ V π ( s t + 1 ) V π ( s t ) ,
10:
   (c) PPO Loss Calculation:
11:
   According to Equation (18), compute the loss function.
12:
   (d) Update Actor:
13:
   Perform gradient descent on the actor parameters θ .
14:
   (e) Update Critic:
15:
   Perform gradient descent on the critic parameters ω .
16:
   After the updates, set  θ old θ {Update old policy}
17:
end for
In this paper, the proposed PPO-based distribution network planning algorithm (PPODNPA) includes the following important processes: environment simulation, action selection, power flow computation and reward evaluation, and PPO strategy updating. First, the environment simulation builds and updates the system state space (which includes node voltages, line currents, and network topology) in response to different agent actions (which include constructing new lines and installing renewable energy). Second, the AN gives a probability distribution of possible actions. By sampling the probability distribution, the local optima phenomenon can be avoided. Third, the power flow computations and reward evaluations can measure system constraints and evaluate economic factors, and generate reward signals for AN and CN. Finally, the PPO strategy updates via advantage functions and the clipping mechanism, and the AN and CN are iteratively refined through backpropagation. The main computational burdens emerge from repeated power flow analyses, and parallel or distributed computation can help maintain computational overhead. Repeated episodes allow the PPODNPA to converge to the near-optimal solutions which balance investment cost, purchase price for purchasing electricity from the external grid, and renewable utilization subsidies within acceptable training times. Overall, environment simulation, neural network training, iterative power flow, and multi-round updates collectively illustrate the execution flow and resource requirements scale of the PPODNPA and provide guidance for actual applications.

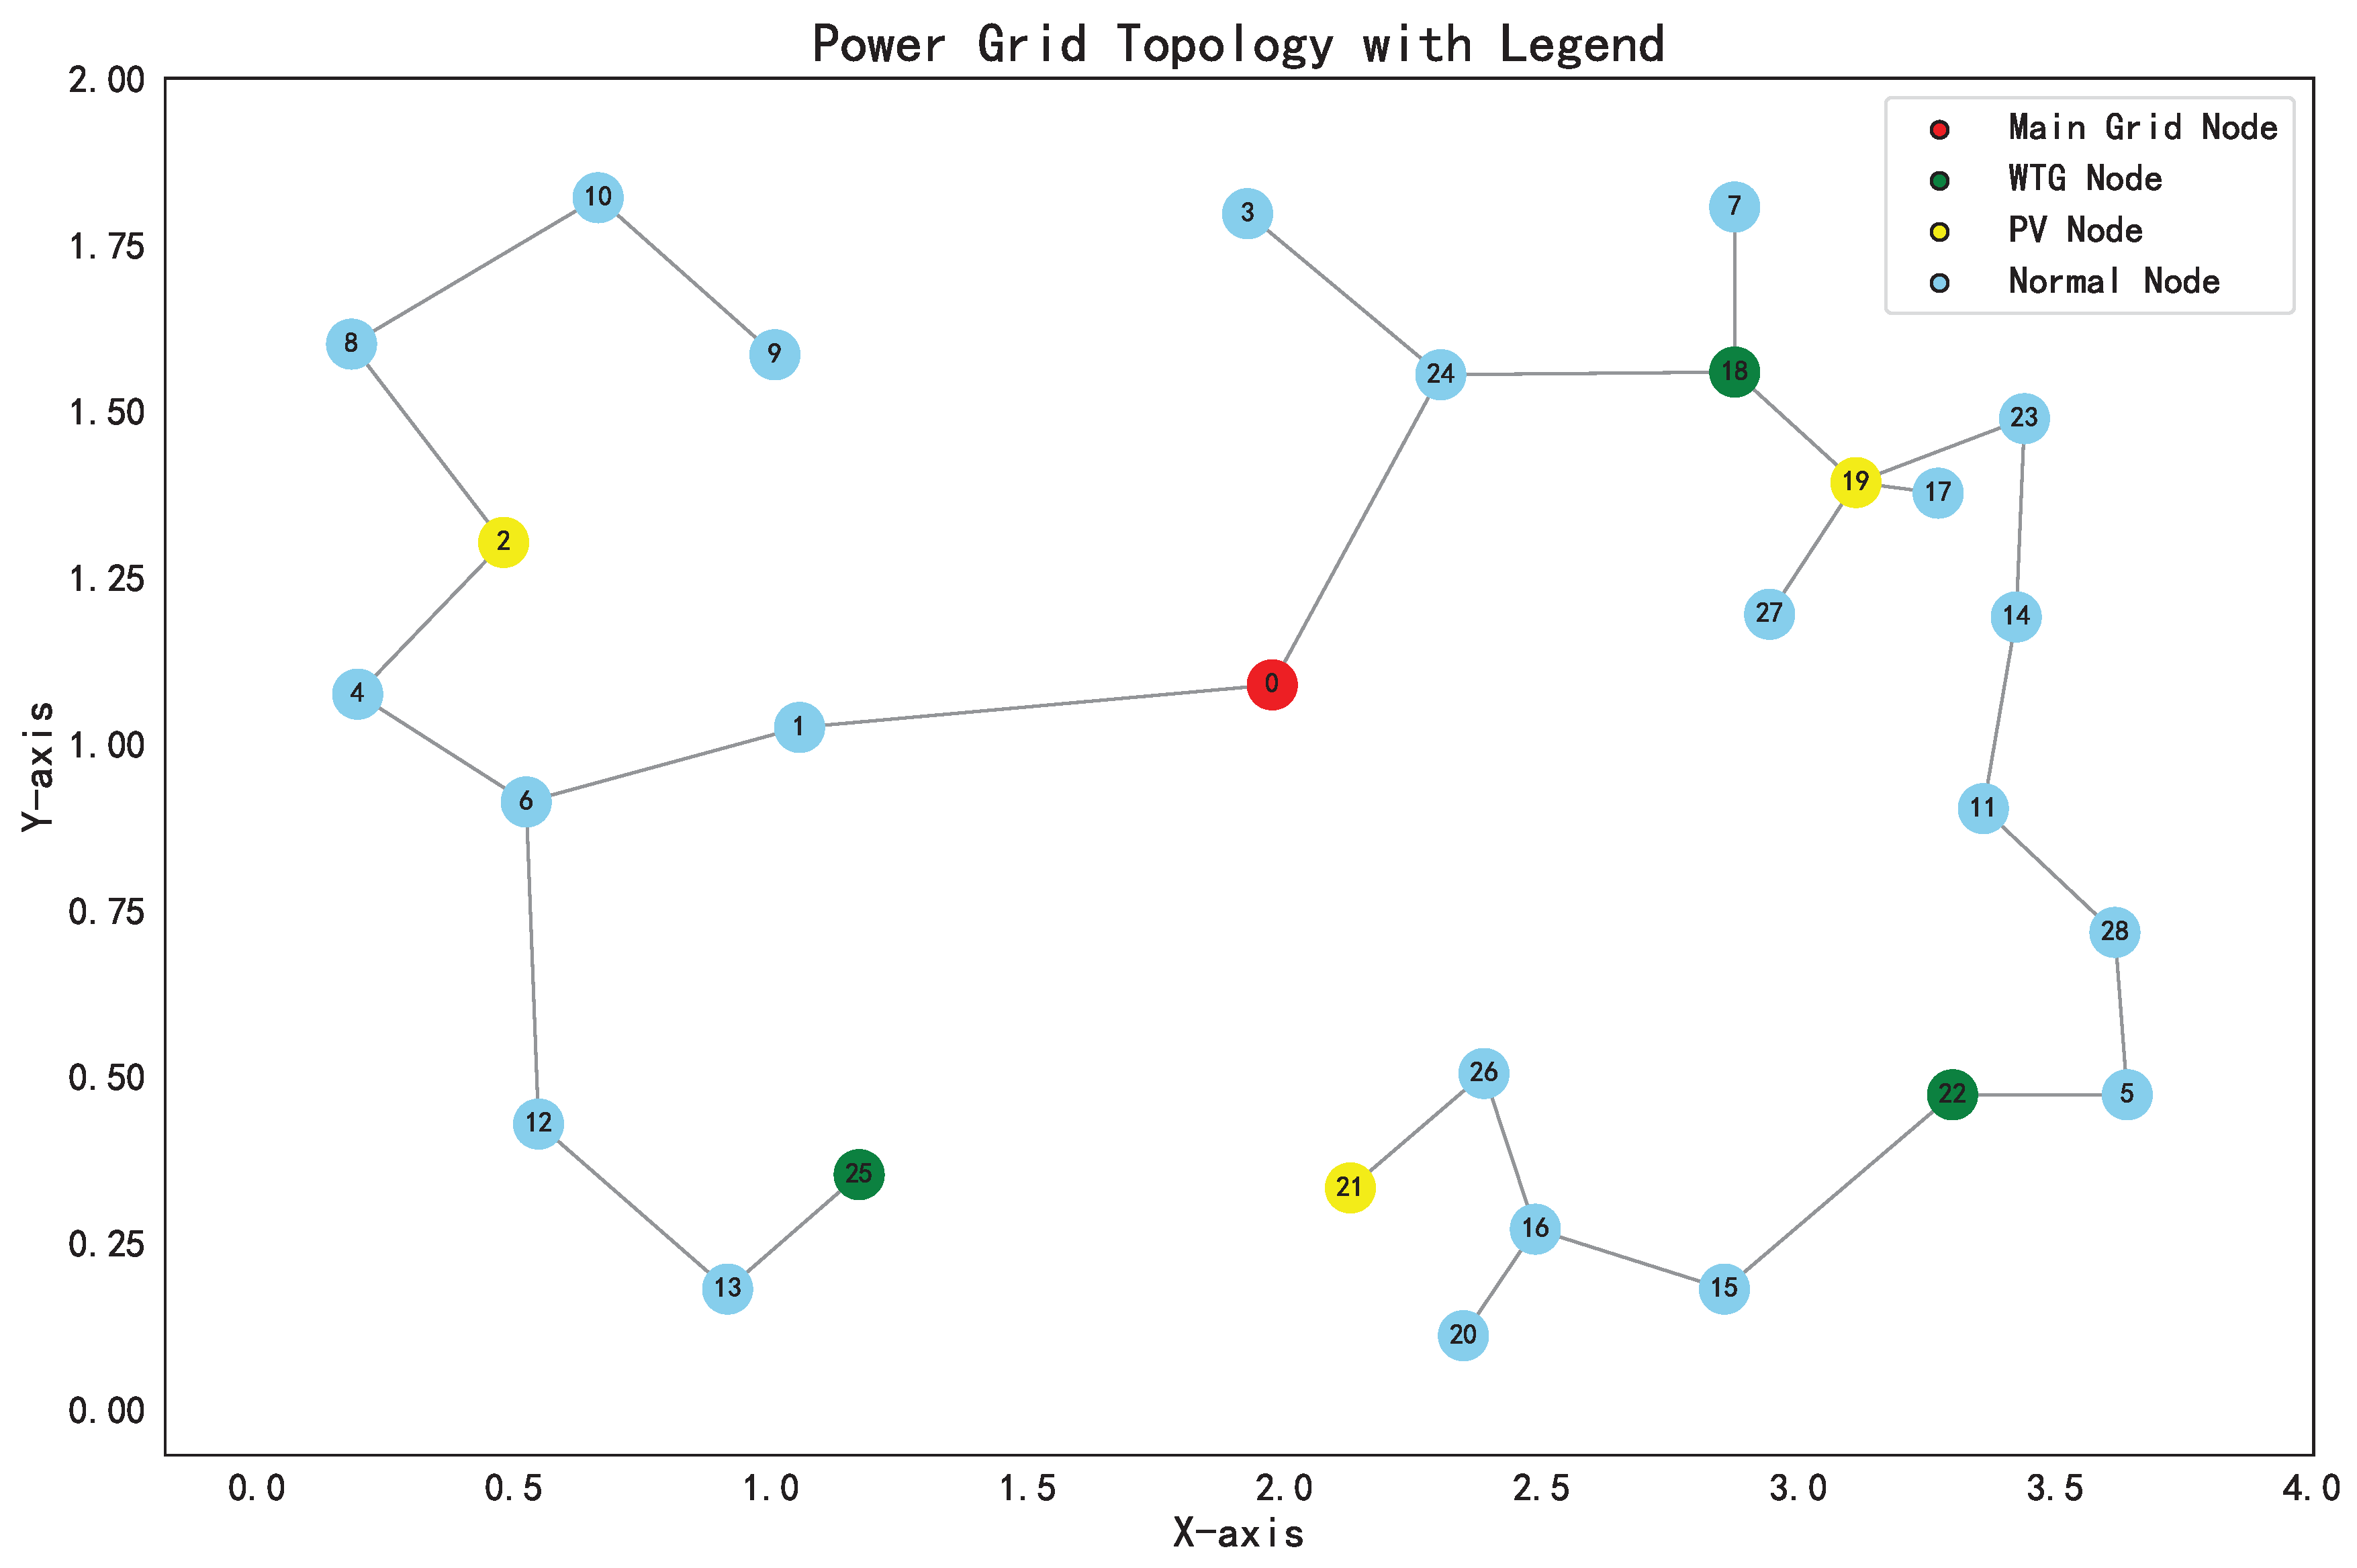
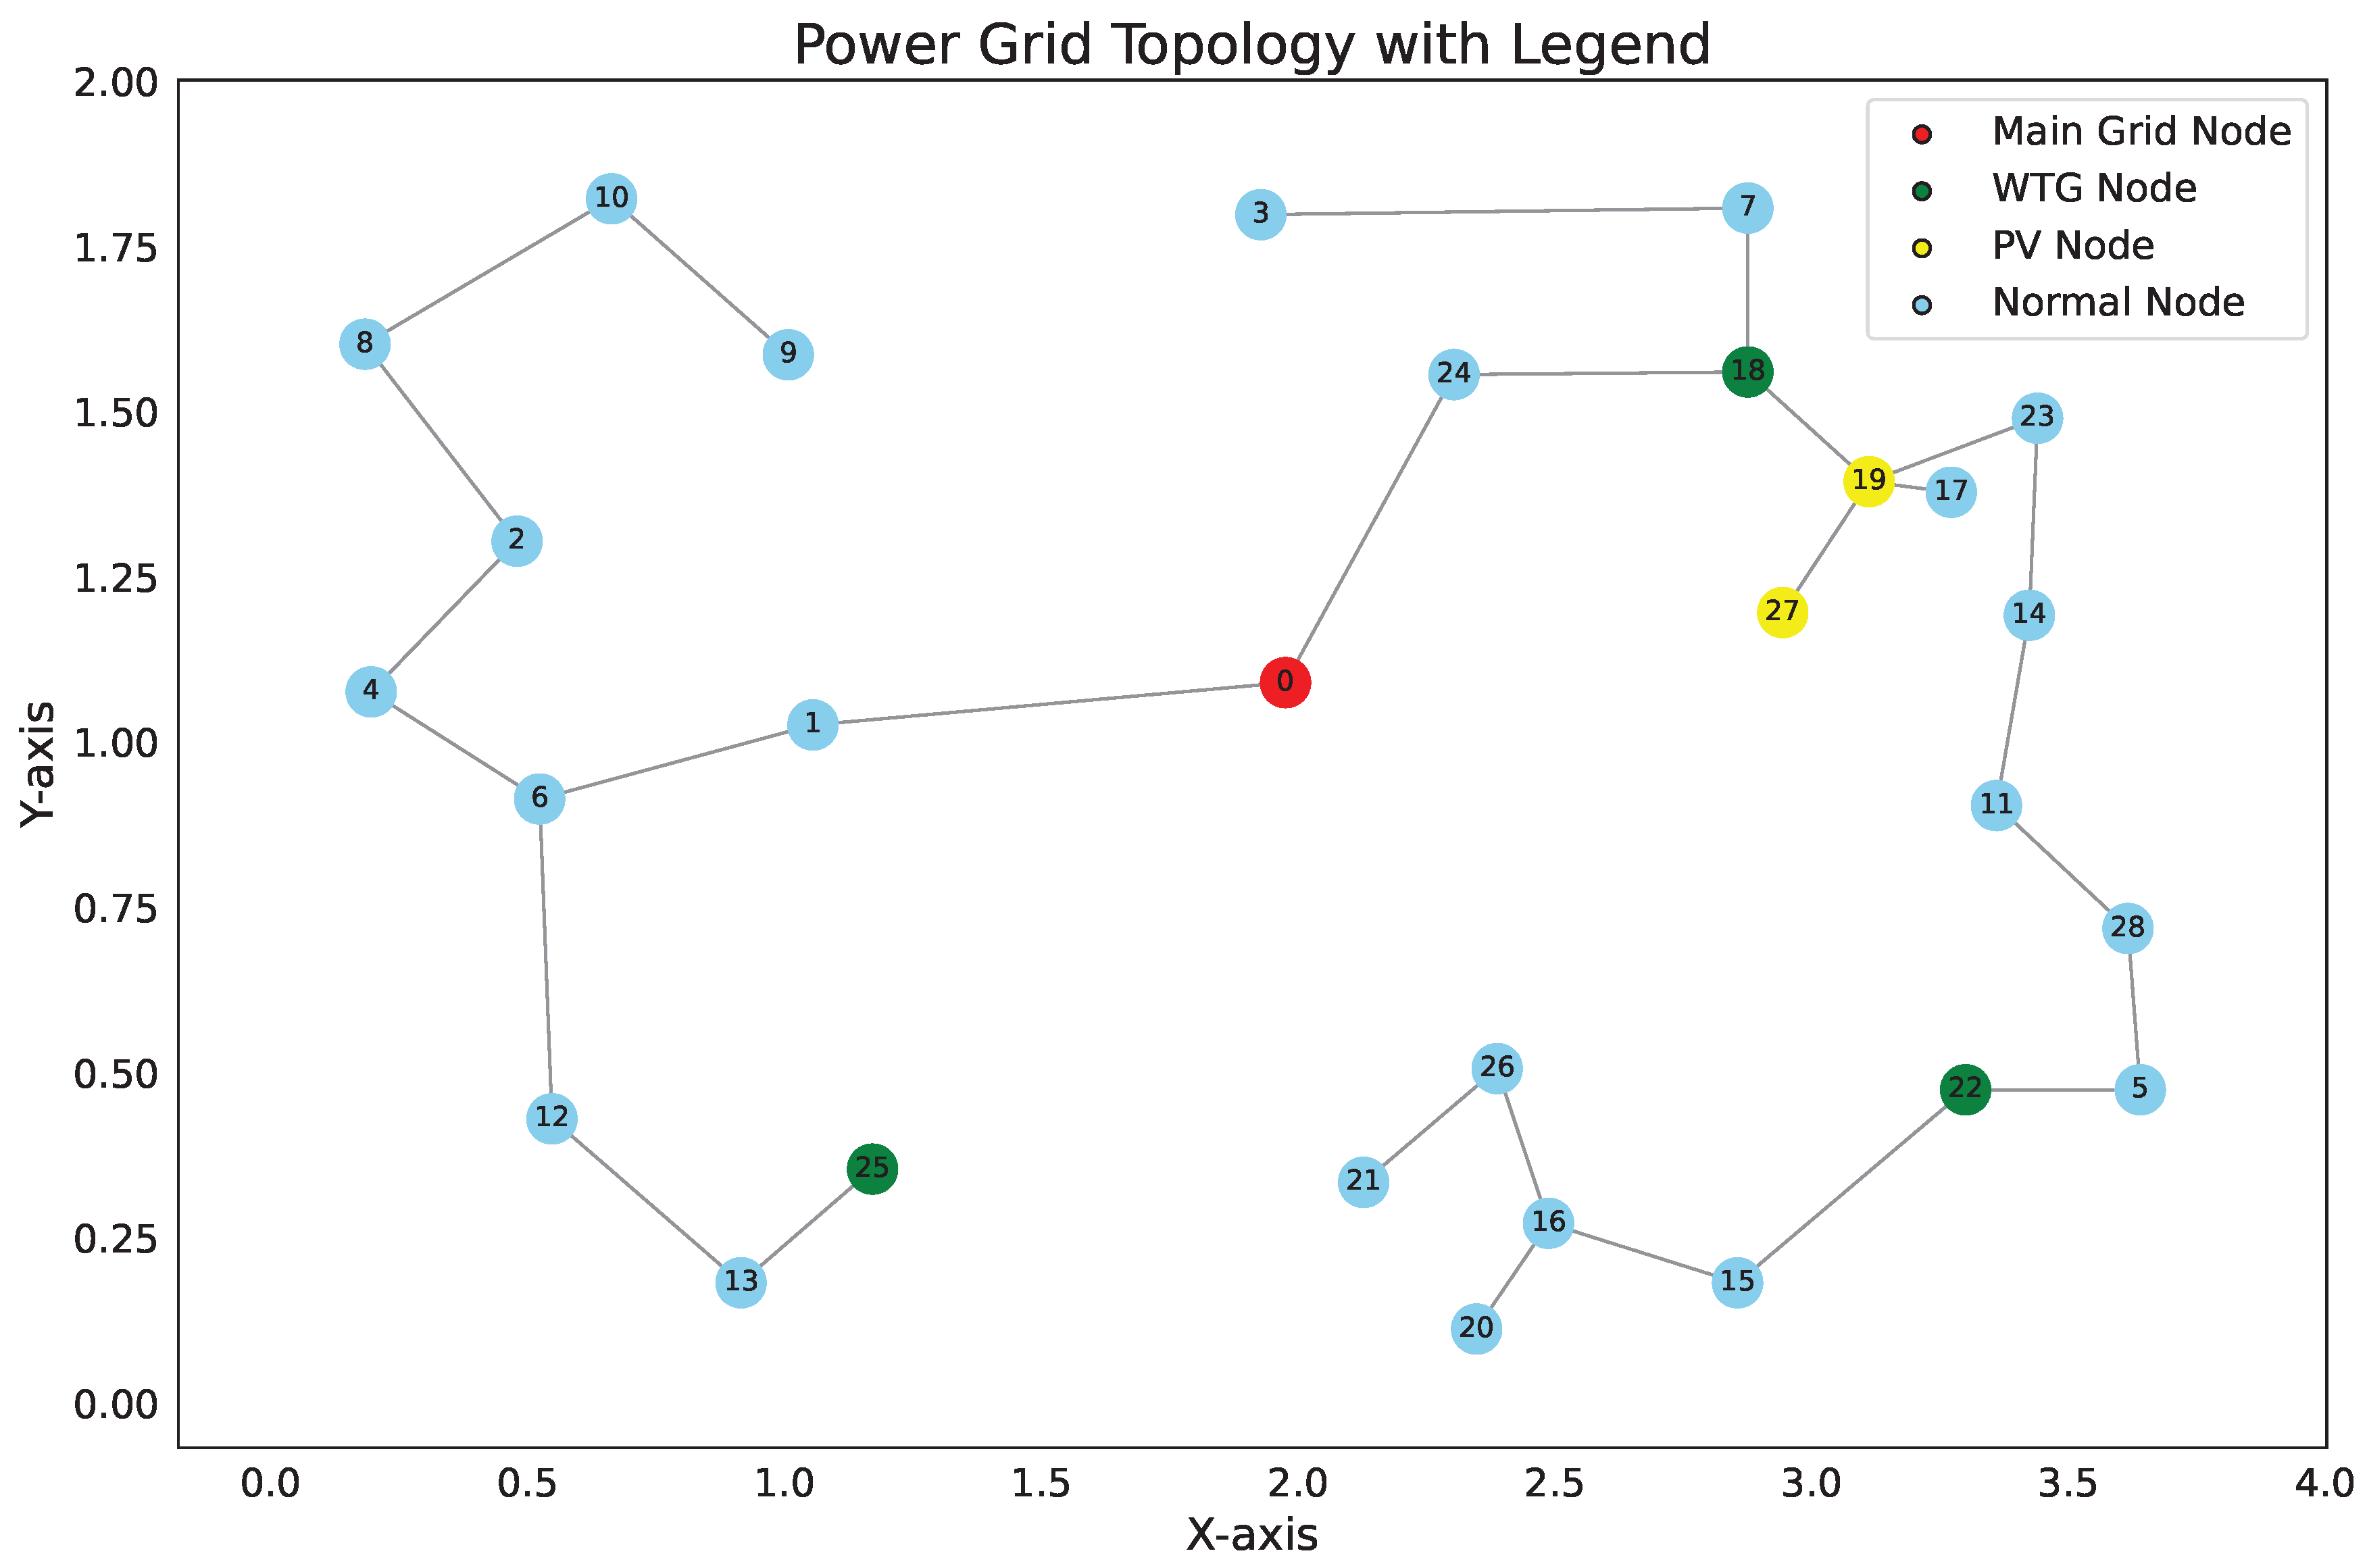
4. Simulation Results

In this section, the simulation results will be presented. A typical DNP case is selected to verify the effectiveness of the PPODNPA, and the relevant parameters are listed in Table 1. The first column of Table 1 displays the node number, the second column shows each node’s coordinates (in kilometers), the third and fourth columns show the active and reactive power of the nodes, respectively (in kW and KVAR). The hidden layer size of the AN and CN was selected as 512. Larger hidden layers can help the neural network learn the complex relationships between state and action. However, larger hidden layers may also lead to higher computational costs and increase the risk of overfitting with limited training data. The learning rate of AN is selected as 0.001 and the learning rate of CN is selected as 0.001. A higher learning rate may cause the policy to oscillate, and a lower rate can slow convergence. Therefore, we select the learning rates for both AN and CN as 0.001 to achieve a balance between convergence speed and stability. The discount factor is chosen as 0.9. The discount factor can balance the short-term and long-term rewards; selecting the discount factor as 0.9 can ensure that cumulative returns are sufficiently reflected, even in relatively shorter training sequences. The clipping parameter is set to 0.1. The clipping parameter is a common hyperparameter in the PPO algorithm that restricts the policy’s deviation from the old policy. Selecting the clipping parameter as 0.9 can maintain enough policy improvement while avoiding overly large policy updates. After collecting each trajectory, 20 optimization steps are performed. The number of total episodes is 20,000, and each episode includes 10 steps, which ensures that the information gathered from each sample is effectively leveraged. The DNP lines are selected as LGJ-185 and the construction cost is 1 million Chinese Yuan (CNY)/kilometer. The PV installation capacities are 600 kW, 900 kW, 400 kW, and 700 kW, while the WTG are 500 kW, 600 kW, and 400 kW. Moreover, we select PSO [41], GA [42], ACO [43], and SAA [44] for comparison, which demonstrates the superiority of the proposed algorithm.
The simulation results are presented in Figure 5, Figure 6, Figure 7, Figure 8, Figure 9, Figure 10, Figure 11 and Figure 12. Figure 5 illustrates the training process curve of the PPODNPA, which includes the instantaneous rewards for each episode and the average rewards (calculated every 200 episodes). From Figure 5, we can conclude that after sufficient training, the agent’s rewards approach convergence. Figure 6 depicts the grid topology structure generated under the PPODNPA, in which the red nodes represent the node connected to the main grid, the blue nodes are load nodes, the yellow nodes are PV nodes, and the green nodes are WTG nodes. Additionally, we select PSO, GA, ACO, and SAA for comparison, and the line construction costs (LLC), renewable energy subsidies (RES), and electricity purchasing costs (EPC) from the upper-level grid as comparative indicators. The grid topology structures generated under PSO, GA, ACO, and SAA are shown in Figure 7, Figure 8, Figure 9 and Figure 10. In addition, we also use DQN as the comparative algorithm; Figure 11 illustrates the training process curve of DQN and Figure 12 depicts the grid topology structure generated under DQN. The relevant indicators are shown in Table 2. As shown in Table 2, the PPODNPA effectively reduces the costs of construction and electricity purchasing while achieving higher subsidies for renewable energy sources. It should be noted that, as the number of loads and power sources on a single branch increases, higher currents can lead to more pronounced voltage drops along that branch. This problem will be one of our future research directions.

5. Conclusions

In this paper, a PPODNPA has been proposed and the MDP for the task of DNP has been constructed. The objective function and reward function have been formulated, and the PPO algorithm has been employed to train the agent. Furthermore, PSO, GA, ASO, and SAA algorithms have been utilized to validate the effectiveness of the proposed method. In future work, we will investigate the application of DRL in high-voltage DNP, and more factors such as voltage deviation and station location corridors will be considered. Moreover, we will consider further improving DRL algorithms such as SAC and DDPG to further optimize planning performance.

Author Contributions

Conceptualization, L.M.; methodology, L.M., S.J. and Y.S.; software, C.S. and Y.S.; validation, S.J.; formal analysis, K.W. and J.L.; investigation, C.S. and J.L.; resources, J.L.; data curation, C.S.; writing—original draft preparation, C.S. and S.J.; writing—review and editing, K.W.; visualization, K.W.; supervision, Y.S.; project administration, L.M.; funding acquisition, L.M., S.J., Y.S. and J.L. All authors have read and agreed to the published version of the manuscript.

Funding

This work is supported by the Science and Technology Project of the State Grid Corporation of China (5400-202456175A-1-1-ZN).

Data Availability Statement

The original contributions presented in the study are included in the article, further inquiries can be directed to the corresponding author.

Conflicts of Interest

Authors Liang Ma, Jinshan Luo, Shigong Jiang and Yi Song were employed by the company State Grid Economic and Technological Research Institute Co., Ltd. The remaining authors declare that the research was conducted in the absence of any commercial or financial relationships that could be construed as a potential conflict of interest.

References

  1. Wang, P.; Yi, J.; Zangiabadi, M.; Lyons, P.; Taylor, P. Evaluation of voltage control approaches for future smart distribution networks. Energies 2017, 10, 1138. [Google Scholar] [CrossRef]
  2. Liao, H. Review on distribution network optimization under uncertainty. Energies 2019, 12, 3369. [Google Scholar] [CrossRef]
  3. Shen, X.; Shahidehpour, M.; Zhu, S.; Han, Y.; Zheng, J. Multi-stage planning of active distribution networks considering the co-optimization of operation strategies. IEEE Trans. Smart Grid 2018, 9, 1425–1433. [Google Scholar] [CrossRef]
  4. Zhang, L.; Liu, Y.; Liang, D.; Kou, P.; Wang, Y.; Gao, Y. Local and remote cooperative control of hybrid distribution transformers integrating photovoltaics in active distribution networks. IEEE Trans. Sustain. Energy 2022, 13, 2012–2026. [Google Scholar] [CrossRef]
  5. Ding, T.; Liu, S.; Yuan, W.; Bie, Z.; Zeng, B. A two-stage robust reactive power optimization considering uncertain wind power integration in active distribution networks. IEEE Trans. Sustain. Energy 2015, 7, 301–311. [Google Scholar] [CrossRef]
  6. Pucuhuayla, F.; Correa, C.; Huatuco, D.; Rodriguez, Y. Optimal reconfiguration of electrical distribution networks using the improved simulated annealing algorithm with hybrid cooling (ISA-HC). Energies 2024, 17, 4477. [Google Scholar] [CrossRef]
  7. Cadenovic, R.; Jakus, D.; Sarajcev, P.; Vasilj, J. Optimal distribution network reconfiguration through integration of cycle-break and genetic algorithms. Energies 2018, 11, 1278. [Google Scholar] [CrossRef]
  8. Valderrama, D.; Alonso, J.; de Mora, C.; Robba, M. Scenario generation based on ant colony optimization for modelling stochastic variables in power systems. Energies 2024, 17, 5293. [Google Scholar] [CrossRef]
  9. Nahman, J.; Peric, D. Optimal planning of radial distribution networks by simulated annealing technique. IEEE Trans. Power Syst. 2008, 23, 790–795. [Google Scholar] [CrossRef]
  10. Jo, S.; Oh, J.; Lee, J.; Oh, S.; Moon, H.; Zhang, C.; Gadh, R.; Yoon, Y. Hybrid genetic algorithm with k-nearest neighbors for radial distribution network reconfiguration. IEEE Trans. Smart Grid 2024, 15, 2614–2624. [Google Scholar] [CrossRef]
  11. Falaghi, H.; Haghifam, M.; Singh, C. Ant colony optimization-based method for placement of sectionalizing switches in distribution networks using a fuzzy multiobjective approach. IEEE Trans. Power Del. 2009, 24, 268–276. [Google Scholar] [CrossRef]
  12. Harsh, P.; Das, D. A simple and fast heuristic approach for the reconfiguration of radial distribution networks. IEEE Trans. Power Syst. 2023, 38, 2939–2942. [Google Scholar] [CrossRef]
  13. Mazhari, S.; Monsef, H.; Romero, R. A hybrid heuristic and evolutionary algorithm for distribution substation planning. IEEE Syst. J. 2015, 9, 1396–1408. [Google Scholar] [CrossRef]
  14. Ahmadian, A.; Elkamel, A.; Mazouz, A. An improved hybrid particle swarm optimization and tabu search algorithm for expansion planning of large dimension electric distribution network. Energies 2019, 12, 3052. [Google Scholar] [CrossRef]
  15. Lu, D.; Li, W.; Zhang, L.; Fu, Q.; Jiao, Q.; Wang, K. Multi-objective optimization and reconstruction of distribution networks with distributed power sources based on an improved BPSO algorithm. Energies 2024, 17, 4877. [Google Scholar] [CrossRef]
  16. Martinez, M.; Mateo, C.; Gomez, T.; Alonso, B.; Frias, P. A hybrid particle swarm optimization approach for explicit flexibility procurement in distribution network planning. Int. J. Electr. Power Energy Syst. 2024, 161, 110215. [Google Scholar] [CrossRef]
  17. Moradi, M.; Abedini, M. A combination of genetic algorithm and particle swarm optimization for optimal DG location and sizing in distribution systems. Int. J. Electr. Power Energy Syst. 2012, 34, 66–74. [Google Scholar] [CrossRef]
  18. Yang, M.; Li, J.; Li, J.; Yuan, X.; Xu, J. Reconfiguration strategy for DC distribution network fault recovery based on hybrid particle swarm optimization. Energies 2021, 14, 7145. [Google Scholar] [CrossRef]
  19. Huang, C.; Bu, S.; Chen, W.; Wang, H.; Zhang, Y. Deep reinforcement learning-assisted federated learning for robust short-term load forecasting in electricity wholesale markets. IEEE Trans. Netw. Sci. Eng. 2024, 11, 5073–5086. [Google Scholar] [CrossRef]
  20. Hossain, R.; Huang, Q.; Huang, R. Graph convolutional network-based topology embedded deep reinforcement learning for voltage stability control. IEEE Trans. Power Syst. 2021, 36, 4848–4851. [Google Scholar] [CrossRef]
  21. Chen, Y.; Zhu, J.; Liu, Y.; Zhang, L.; Zhou, J. Distributed hierarchical deep reinforcement learning for large-scale grid emergency control. IEEE Trans. Power Syst. 2023, 39, 4446–4458. [Google Scholar] [CrossRef]
  22. Al-Ani, O.; Das, S. Reinforcement learning: Theory and applications in HEMS. Energies 2022, 15, 6392. [Google Scholar] [CrossRef]
  23. Toubeau, J.; Zad, B.; Hupez, M.; De Greve, Z.; Vallee, F. Deep reinforcement learning-based voltage control to deal with model uncertainties in distribution networks. Energies 2020, 13, 3928. [Google Scholar] [CrossRef]
  24. Yan, Z.; Xu, Y. A multi-agent deep reinforcement learning method for cooperative load frequency control of a multi-area power system. IEEE Trans. Power Syst. 2020, 35, 4599–4608. [Google Scholar] [CrossRef]
  25. Li, J.; Chen, S.; Wang, X.; Pu, T. Load shedding control strategy in power grid emergency state based on deep reinforcement learning. CSEE J. Power Energy 2021, 8, 1175–1182. [Google Scholar]
  26. Jin, J.; Xu, Y. Optimal policy characterization enhanced actor-critic approach for electric vehicle charging scheduling in a power distribution network. IEEE Trans. Smart Grid 2021, 12, 1416–1428. [Google Scholar] [CrossRef]
  27. Wang, R.; Bi, X.; Bu, S. Real-time coordination of dynamic network reconfiguration and volt-VAR control in active distribution network: A graph-aware deep reinforcement learning approach. IEEE Trans. Smart Grid 2024, 15, 3288–3302. [Google Scholar] [CrossRef]
  28. Wang, W.; Yu, N.; Gao, Y.; Shi, J. Safe off-policy deep reinforcement learning algorithm for volt-VAR control in power distribution systems. IEEE Trans. Smart Grid 2020, 11, 3008–3018. [Google Scholar] [CrossRef]
  29. Ruan, J.; Wu, C.; Liang, Z.; Liu, K.; Li, B.; Li, W.; Li, T. The application of machine learning-based energy management strategy in a multi-mode plug-in hybrid electric vehicle, part II: Deep deterministic policy gradient algorithm design for electric mode. Energy 2023, 269, 126972. [Google Scholar] [CrossRef]
  30. Zhang, J.; Li, Y.; Wu, Z.; Rong, C.; Wang, T.; Zhang, Z.; Zhou, S. Deep-reinforcement-learning-based two-timescale voltage control for distribution systems. Energies 2021, 14, 3540. [Google Scholar] [CrossRef]
  31. Zhu, Z.; Gao, X.; Bu, S.; Chan, K.; Zhou, B.; Xia, S. Cooperative dispatch of renewable-penetrated microgrids alliances using risk-sensitive reinforcement learning. IEEE Trans. Sustain. Energy 2024, 15, 2194–2208. [Google Scholar] [CrossRef]
  32. Qi, T.; Ye, C.; Zhao, Y.; Li, L.; Ding, Y. Deep reinforcement learning based charging scheduling for household electric vehicles in active distribution network. J. Mod. Power Syst. Clean Energy 2023, 11, 1890–1901. [Google Scholar] [CrossRef]
  33. Sun, X.; Han, S.; Wang, Y.; Shi, Y.; Liao, J.; Zheng, Z.; Wang, X.; Shi, P. Proximal policy optimization-based power grid structure optimization for reliable splitting. Energies 2024, 17, 834. [Google Scholar] [CrossRef]
  34. Fang, X.; Hong, P.; He, S.; Zhang, Y.; Tan, D. Multi-layer energy management and strategy learning for microgrids: A proximal policy optimization approach. Energies 2024, 17, 3990. [Google Scholar] [CrossRef]
  35. Meng, J.; Yang, F.; Peng, J.; Gao, F. A proximal policy optimization based control framework for flexible battery energy storage system. IEEE Trans. Energy Convers. 2024, 39, 1183–1191. [Google Scholar] [CrossRef]
  36. Wang, Y.; Qiu, D.; Wang, Y.; Sun, M.; Strbac, G. Graph learning-based voltage regulation in distribution networks with multi-microgrids. IEEE Trans. Power Syst. 2024, 39, 1881–1895. [Google Scholar] [CrossRef]
  37. Zhao, Y.; Liu, J.; Liu, X.; Yuan, K.; Ding, T. Enhancing the tolerance of voltage regulation to cyber contingencies via graph-based deep reinforcement learning. IEEE Trans. Power Syst. 2024, 39, 4661–4673. [Google Scholar] [CrossRef]
  38. Nie, Y.; Liu, J.; Liu, X.; Zhao, Y.; Ren, K.; Chen, C. Asynchronous multi-agent reinforcement learning-based framework for bi-level noncooperative game-theoretic demand response. IEEE Trans. Smart Grid 2024, 15, 5622–5637. [Google Scholar] [CrossRef]
  39. Tahir, I.; Nasir, A.; Algethami, A. Optimal control policergy management of a commercial bank. Energies 2022, 15, 2112. [Google Scholar] [CrossRef]
  40. Liang, Z.; Chung, C.; Zhang, W.; Wang, Q.; Lin, W.; Wang, C. Enabling high-efficiency economic dispatch of hybrid AC/DC networked microgrids: Steady-state convex bi-directional converter models. IEEE Trans. Smart Grid 2025, 16, 45–61. [Google Scholar] [CrossRef]
  41. Vlachogiannis, J.; Lee, K. A comparative study on particle swarm optimization for optimal steady-state performance of power systems. IEEE Trans. Power Syst. 2006, 21, 1718–1728. [Google Scholar] [CrossRef]
  42. Mohamed, A.; Berzoy, A.; Mohammed, O. Design and hardware implementation of FL-MPPT control of PV systems based on GA and small-signal analysis. IEEE Trans. Sustain. Energy 2017, 8, 279–290. [Google Scholar] [CrossRef]
  43. Priyadarshi, N.; Ramachandaramurthy, V.; Padmanaban, S.; Azam, F. An ant colony optimized MPPT for standalone hybrid PV-Wind power system with single cuk converter. Energies 2019, 12, 167. [Google Scholar] [CrossRef]
  44. Ye, H. Surrogate affine approximation based co-optimization of transactive flexibility, uncertainty, and energy. IEEE Trans. Power Syst. 2018, 33, 4084–4096. [Google Scholar] [CrossRef]
Figure 1. Flow chart.
Energies 18 01254 g001
Figure 2. Diagram of MDP.
Energies 18 01254 g002
Figure 3. AC framework.
Energies 18 01254 g003
Figure 4. Diagram of PPODNPA.
Energies 18 01254 g004
Figure 5. Instant rewards and average rewards of PPODNPA.
Energies 18 01254 g005
Figure 6. Grid topology diagram under PPODNPA.
Energies 18 01254 g006
Figure 7. Grid topology diagram under PSO.
Energies 18 01254 g007
Figure 8. Grid topology diagram under GA.
Energies 18 01254 g008
Figure 9. Grid topology diagram under ACO.
Energies 18 01254 g009
Figure 10. Grid topology diagram under SAA.
Energies 18 01254 g010
Figure 11. Instant rewards and average rewards of DQN.
Energies 18 01254 g011
Figure 12. Grid topology diagram under DQN.
Energies 18 01254 g012
Table 1. The parameters of the DNP case.
Node NumberNode Coordinates/kmActive Load/kWReactive Load/kvar
1(1.976, 1.090)00
2(1.056, 1.026)439.92273.78
3(0.480, 1.304)421.20262.08
4(1.928, 1.798)318.24196.56
5(0.196, 1.076)430.56266.76
6(3.640, 0.474)374.40231.66
7(0.524, 0.914)402.48250.38
8(2.876, 1.808)383.76238.68
9(0.184, 1.602)570.96353.34
10(1.008, 1.586)589.68365.04
11(0.664, 1.822)421.20262.08
12(3.360, 0.904)477.36231.66
13(0.548, 0.430)580.32360.36
14(0.916, 0.182)374.40231.66
15(3.424, 1.192)458.64285.48
16(2.856, 0.182)336.96208.26
17(2.488, 0.272)402.48250.38
18(3.272, 1.738)439.92273.78
19(2.876, 1.560)402.48250.38
20(3.112, 1.394)683.28423.54
21(2.348, 0.112)449.28278.46
22(2.128, 0.334)486.72301.86
23(3.300, 0.474)318.24196.56
24(3.440, 1.490)393.12243.36
25(2.304, 1.556)276.12170.82
26(1.172, 0.354)159.1298.28
27(2.388, 0.506)313.56194.22
28(2.944, 1.196)480.18402.32
29(3.616, 0.718)159.1298.28
Table 2. Comparative indicators.
MethodLCC/million CNYVDEPC/CNYRES/CNY
PPODNPA10.872.074478,85716,320
PSO11.372.335283,29814,880
GA11.830.589785,18414,400
ACO11.790.510577,62015,840
SAA12.050.300381,69913,920
DQN11.592.636496,2419120
Disclaimer/Publisher’s Note: The statements, opinions and data contained in all publications are solely those of the individual author(s) and contributor(s) and not of MDPI and/or the editor(s). MDPI and/or the editor(s) disclaim responsibility for any injury to people or property resulting from any ideas, methods, instructions or products referred to in the content.

