Article

Insulation Aging Evaluation Method of High Voltage Cable Based on Dielectric Loss Characteristics

School of Electrical and Information Engineering, Tianjin University, Tianjin 300072, China
*
Author to whom correspondence should be addressed.
Energies 2025, 18(5), 1267; https://doi.org/10.3390/en18051267
Submission received: 7 February 2025 / Revised: 27 February 2025 / Accepted: 1 March 2025 / Published: 5 March 2025
(This article belongs to the Section F6: High Voltage)

Abstract

:
Health assessments of high-voltage power cables are important for stable operations of power grids; however, most current health assessment model parameters lack whole cable test data, making them unable to effectively characterize the insulation aging state of whole cables. In this paper, a dielectric loss measurement device for high-voltage cables is developed. Using a high-voltage amplifier and high-precision dielectric loss measurement algorithm, the dielectric loss values of whole cables at different aging stages are measured, and the physicochemical and electrical characteristics of XLPE slice samples at each aging stage are analyzed. Through the analysis of high-voltage dielectric loss, crystallinity, carbonyl index, AC breakdown field strength, and elongation at break, aging correlation parameters are determined. The characteristic high voltage frequency domain dielectric response and delamination degree are proposed to characterize the aging state of cable insulation. The correlation between the high voltage frequency domain dielectric characteristics and cable insulation aging state is established. Finally, an assessment method of the insulation aging state of high-voltage cable is developed, providing a reference for the diagnosis and assessment of the insulation state of high-voltage XLPE cable on site.

1. Introduction

High voltage power cables are key electrical equipment for ensuring the safety and stability of power systems; they are of great significance in the transmission of clean energy and improving the reliability of the power supply in a power system [1,2,3,4]. Cross linked polyethylene (XLPE) is the main insulation material for power cables, and its insulation performance directly affects the reliability of power grids. In operating environments, XLPE will gradually age due to various stresses (electrical, thermal, mechanical, etc.), resulting in a gradual decrease in insulation performance until failure [5,6,7,8]. Among these stresses, thermal aging caused by high temperature during long-term overload operations of the cable is one of the most common factors [9,10,11,12]. The long-term overload operation of the cable may cause the core temperature of the cable to be too high, resulting in the thermal breakdown of the cable insulation and ultimately causing significant damage to the power grid [3,13,14,15]. Therefore, it is very important to detect the insulation condition of cables regularly.
Some scholars have studied and analyzed changes in the physical and chemical properties of XLPE, such as functional groups and crystallinity, as well as the dielectric properties of samples with different degrees of aging by preparing sliced samples of the main insulation layer of high-voltage cables, revealing the mechanisms of their performance evolution [16,17]. Research on aging evaluation methods for insulation materials at different temperatures, using differential scanning calorimetry (DSC) to reveal the effect of thermal aging on the crystallinity of XLPE insulated cables, can quickly complete aging evaluations of cable insulation [16,18]. By establishing the relationship between the elongation at break and breakdown field strength of XLPE sliced samples, the elongation at break can be effectively used to characterize the aging state of cables [19]. Some researchers have also sliced cables with different operating durations and measured the ultra-low frequency (ULF) loss tangent, proposing that the degree of material performance degradation is not only reflected in the voltage stability of the dielectric loss value, but also in the performance differences of different parts of the cable insulation [20,21]. However, current assessments of cable insulation aging status are mainly carried out by testing the physical and chemical properties of insulation slice samples; the measured dielectric response parameters cannot effectively characterize the insulation performance of the whole cable.
This study develops a high-voltage cable dielectric loss measurement device and conducts dielectric loss testing on real high-voltage cables. Combined with the high voltage dielectric properties, a high-voltage frequency domain dielectric response characteristic quantity is proposed, thus constructing a cable insulation health status evaluation method and improving the effectiveness of cable insulation status evaluation.

2. Sample Preparation

2.1. Cable Sample Preparation

The preparation of the whole cable specimen consisted of excising the outer sheath, lead jacket, and outer semiconducting layer from a 2 m long 220 kV cable specimen with an insulation thickness of 28 mm. The cable specimen was wrapped uniformly with XLPE insulation around the heating tape on the outer surface. This was intended to prevent breakdown along the surface during the experimental process. The thermal aging test of the cable is shown in Figure 1. The cable was heated to a thermal aging temperature of 135 °C every 14 d for a total of 70 d.

2.2. Cable Slice Sample Preparation

XLPE samples were sliced from non-aged 220 kV cable insulation using a slicer. The dimensions of the samples were 50 mm in width and 0.5 mm in thickness; the process is illustrated in Figure 2. The cable slice was cut into a sample with a length of 20 cm, which was placed into an aging box for thermal aging treatment, as demonstrated in Figure 2b. The thermal aging temperature was set at 135 °C, and samples were taken every 14 d for a total duration of 70 d.

3. Experiment Platform

3.1. High-Voltage Dielectric Property Test

Ultra-low frequency testing systems designed by traditional methods cannot test the dielectric loss of short cables, and their output signal accuracy is low and the waveform distortion rate is high. These defects make it difficult to evaluate cable aging. Consequently, this paper proposes a high-precision, ultra-low frequency dielectric loss measurement system to effectively evaluate the insulation state of cables.

3.1.1. Power Supply Circuit

The flyback switching power supply had been demonstrated to offer a number of advantages, including light weight and reliability, and the fact that it is capable of facilitating multi-channel output with ease. This makes it especially suitable for equipment that requires multiple groups of isolated power output. Consequently, this paper employs a flyback switching power supply as the power supply circuit. The secondary and primary sides of the flyback switching power supply share a magnetic core, with the same end being opposite. The working mode of the switching power supply was divided into Current continuous mode (CCM) and Discontinuous current mode (DCM), with the DCM mode mainly being used for high voltage power applications. The configuration of a standard flyback switching power supply is illustrated in Figure 3.

3.1.2. High-Voltage Linear Amplifier Circuit

In our research, a new type of high voltage linear amplifier was designed. The linear amplification of the input signal was achieved through the cascading of multiple modules, and the magnification was controllable by the number of cascades. Figure 4 shows a circuit diagram of the amplification circuit, which was composed of an OPA454 operational amplifier with a supply voltage of 100 V.
As shown in Figure 4, the operational amplifier constituted a voltage series negative feedback circuit. The calculation formula of its amplification factor was as follows:
A u = 1 + R 2 R 1
Operational amplifier 2 was responsible for amplifying input signal U1. The voltage follower composed of amplifiers 1 and 3 was used to supply power to 2. Since the output voltage difference between amplifiers 1 and 3 was constant at 100 V, it was not affected by the input signal. Through the following measures, this amplifier circuit could output a higher voltage amplitude (U2).
The matching process for the power supply circuit and high-voltage linear amplifier circuit is shown in Figure 5. The power supply circuit used an external DC source to supply power to the multi-channel amplifier circuit.

3.1.3. System Structure

The overall workflow of the ultra-low frequency high-voltage generator is shown in Figure 6.
The ultra-low frequency power supply was used to generate ultra-low frequency voltage, with a maximum output voltage of 28 kV and a frequency range of 0.01–0.1 Hz. However, there was high-frequency noise in the power supply, which could cause significant errors in the measurement of dielectric loss. Therefore, a filtering circuit was needed to filter out high-frequency interference. In the experiment, a low-pass filter was used to filter out high-frequency noise.
The PC end controlled the amplitude and frequency of the ultra-low frequency voltage and the output of the corresponding high voltage signal at the high voltage end, as well as completing the dielectric loss calculation while realizing the control function.

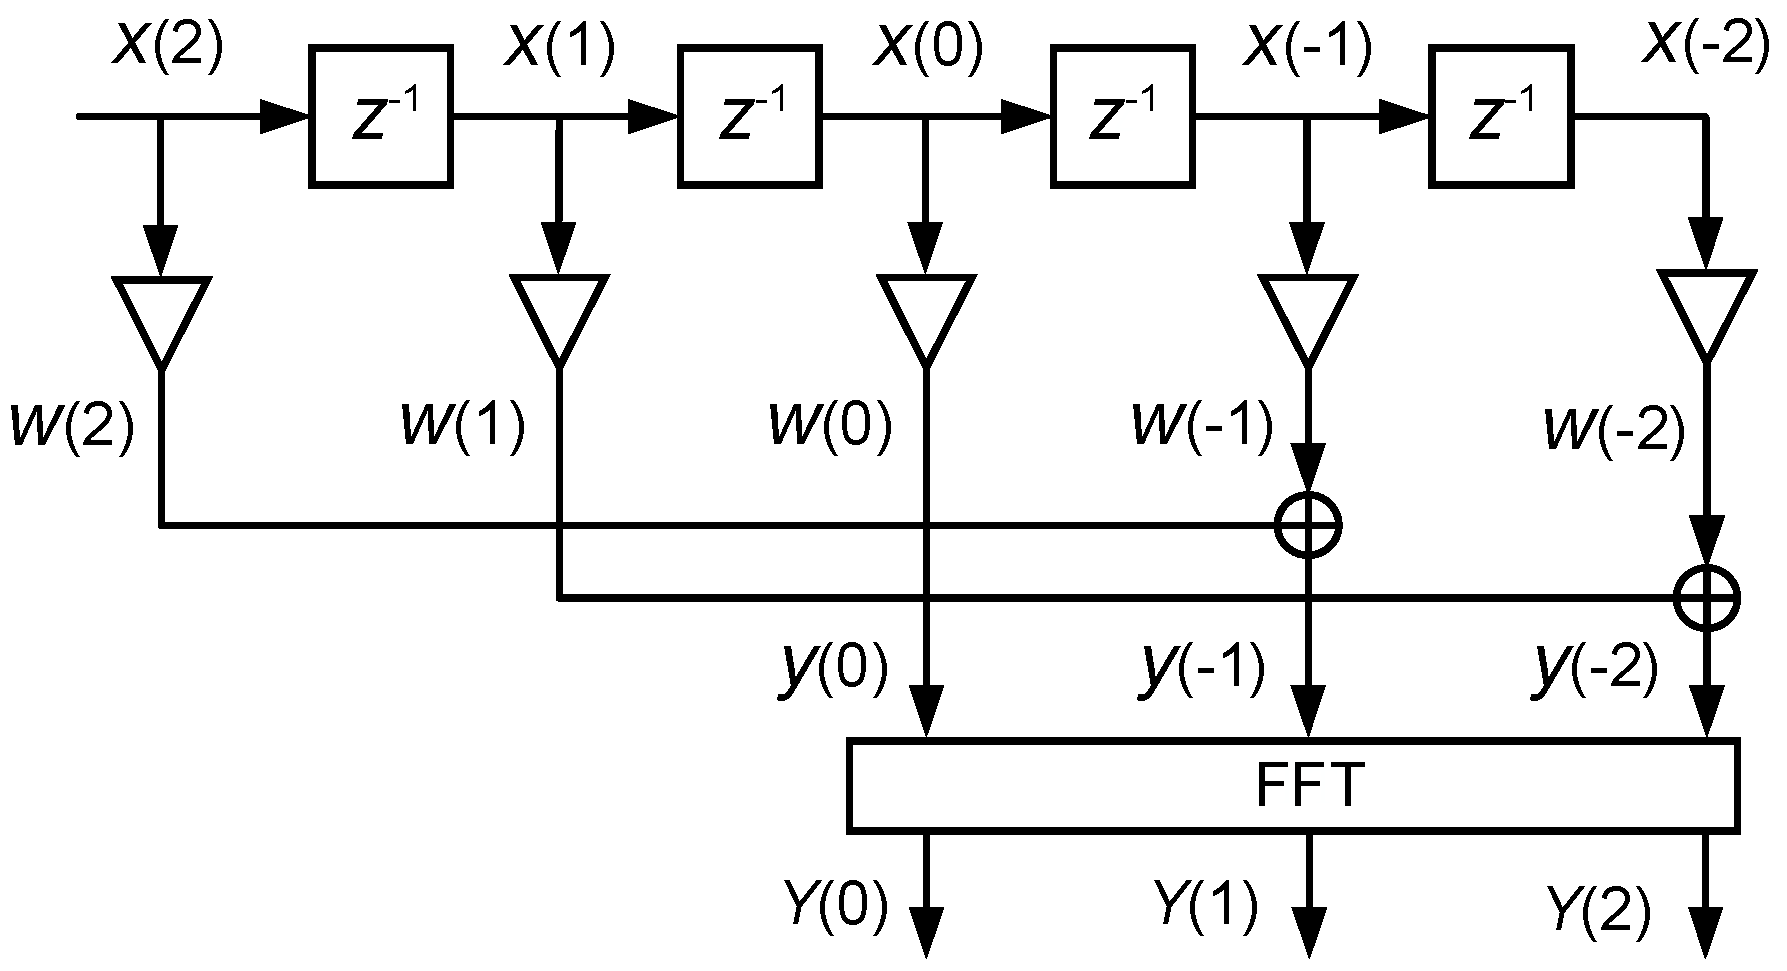
3.1.4. Dielectric Loss Calculation Method

This article used an all phase FFT (apFFT) spectral analysis method to process the original signal. Compared with traditional FFT, apFFT has phase invariance and can accurately calculate the phase information of an original signal without the need for other correction measures during asynchronous sampling of a system. The basic processing procedure of apFFT spectrum analysis is shown in Figure 7.
Using a signal acquisition system to sample analog signals at a certain sampling frequency, a discrete sampling signal x(n) was obtained, where n = 1 − N, ⋯, −1, 0, 1, ⋯, N − 1. There was a total of 2N − 1 sampling points. All phase processing was equivalent to weighting 2N − 1 data points centered around x(0) using a convolution window w(n) and then shifting and adding them.
In the traditional FFT phase measurement process, the frequency must be estimated first to obtain the estimated phase value. During this process, the phase measurement results were affected by frequency deviations. However, the apFFT phase measurement method removed the need for frequency estimation and spectrum correction measures, and the error of the frequency estimations was not carried into the phase measurements, improving the accuracy of phase calculations.
From the above analysis, it can be seen that the signal phase information could be accurately calculated using the apFFT phase measurement method. ApFFT had to be performed on the voltage and current sampling signals individually. It was then necessary to obtain the phase spectrum and the peak spectral lines of the identified voltage and current. The phase angles of the voltage and current signals were obtained as φ1 and φ2, respectively, and the dielectric loss angle could be obtained by calculating complementary angle δ of the angle between them. Then, the dielectric loss value could be calculated; the calculation formula was as follows.
tan δ = tan 90 ° φ 1 φ 2

3.2. Fourier Transform Infrared Spectroscopy Test

A comparative analysis of functional group changes in the XLPE samples was conducted using Fourier transform infrared spectroscopy (FTIR). We selected 500–4000 cm−1 as the scanning wavenumber for the FTIR spectra of the XLPE cable slice samples. In this way, we could quantitatively describe the variation in the carbonyl content with aging time at different aging temperatures using a carbonyl index. The carbonyl index was defined as the ratio of the carbonyl absorption peak intensity at wave number 1720 cm−1 to the absorption peak intensity at wave number 2010 cm−1. The calculation formula was as follows:
I = I a / I b
where I is the index of the official energy group; Ia represents the peak intensity at the carbonyl position at 1720 cm−1; and Ib is the intensity of the absorption peak near 2010 cm−1.

3.3. Differential Scanning Calorimetry Test

Differential scanning calorimetry (DSC) was used to perform a thermodynamic analysis of the XLPE slice samples with different degrees of aging. A compensator was used to measure the relationship between the heating rate and the temperature required for the samples and reference materials to reach the same temperature. We took 6–8 mg XLPE slice samples and placed them in a crucible, using the new sample as a reference. The testing temperature range was 40–160 °C, and the temperature change rate was 10 °C/min. The crystallinity of the XLPE slice samples of cables under different thermal stresses was calculated using Equation (4).
X c = Δ H / Δ H o × 100 %
where Xc is the crystallinity of XLPE insulation samples; ΔH is the enthalpy of melting; and ΔHo is the melting enthalpy at 100% crystallinity, taken as 287.3 J/g.

3.4. Mechanical Test

Elongation at break was used as the basis for judging the aging degree of the samples. XLPE samples were made into dumbbell-shaped samples. Tensile tests of cable XLPE samples under different thermal stresses were carried out using an electronic universal tensile machine. The samples of each aging degree were tested five times repeatedly, and the average value of the test data was used as the experimental result of the aged samples.

3.5. AC Breakdown Field Strength Test

An AC voltage breakdown tester was used to conduct breakdown tests on the XLPE slice specimens. Each XLPE sample was placed in insulating oil, and a ball plate electrode was used as the test electrode to conduct an AC breakdown test at a boost speed of 1 kV/s. Weibull distribution was commonly used for statistical analyses of the dispersed data, reflecting the probability of dielectric breakdown under a certain electric field. The formula was as follows:
F ( E ) = 1 exp E / E o β
where E is the breakdown field strength of the sample; Eo is the scale parameter, corresponding to the breakdown field strength at a breakdown probability of 63.2%; and β is a shape parameter that characterizes the degree of dispersion of data.

4. Results and Discussions

4.1. Experimental Test Results

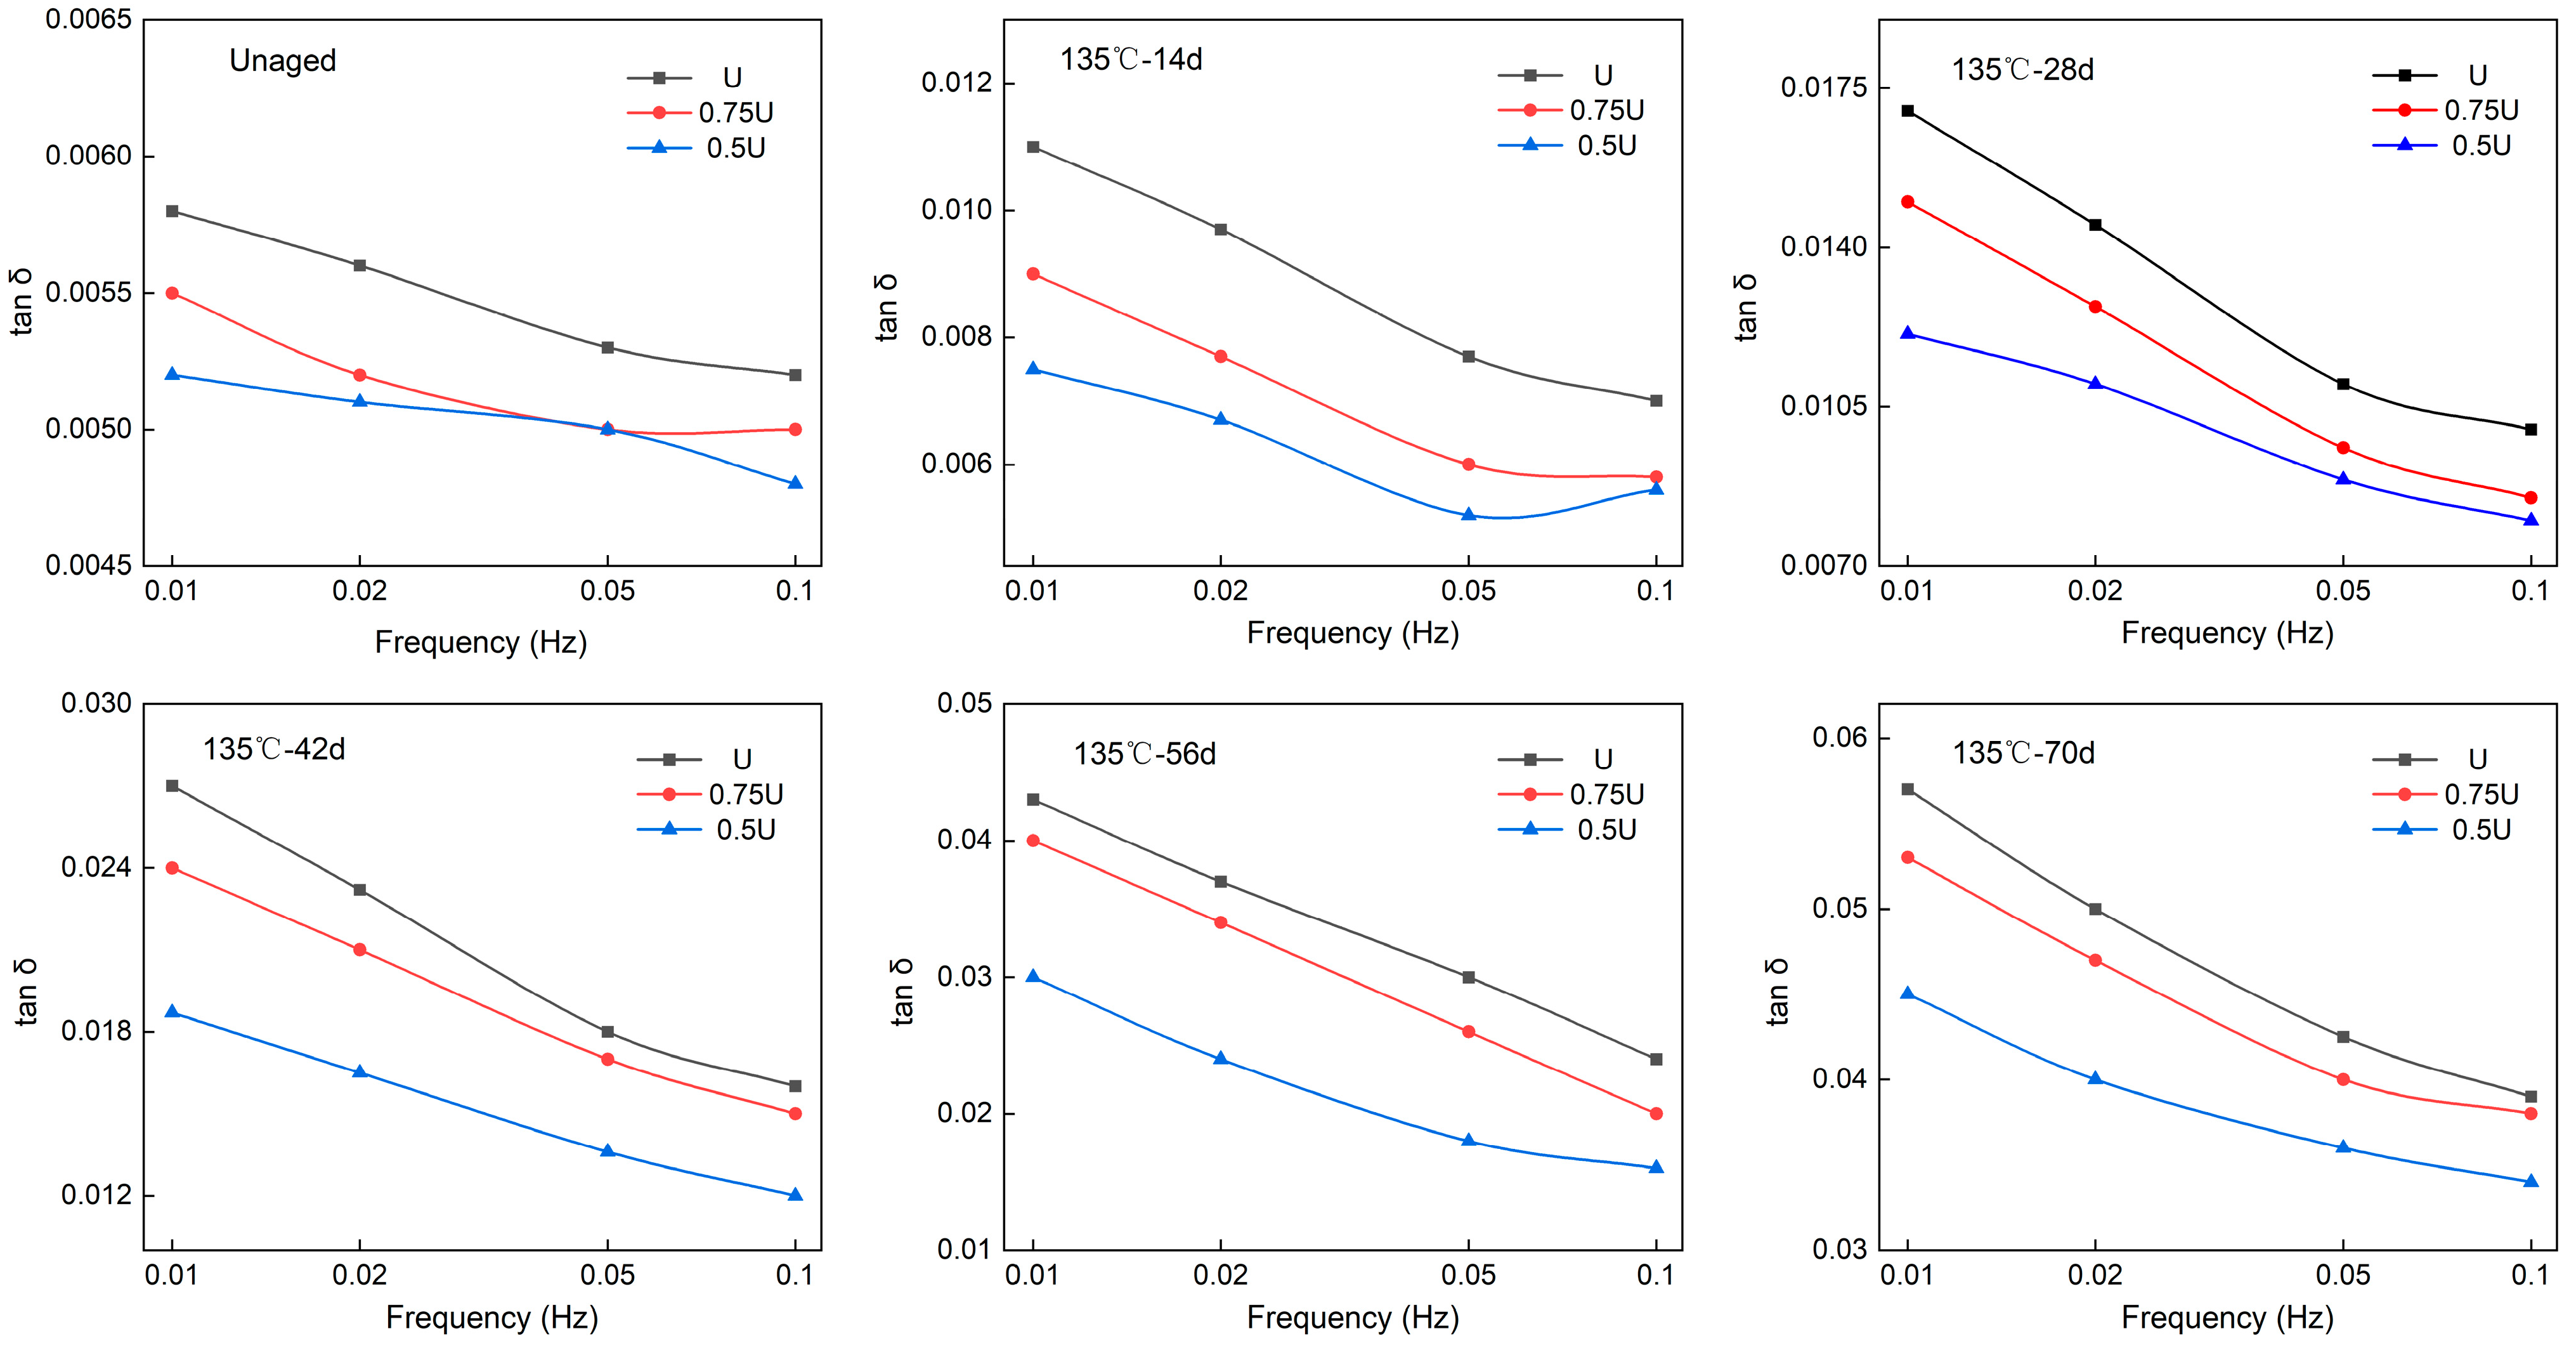
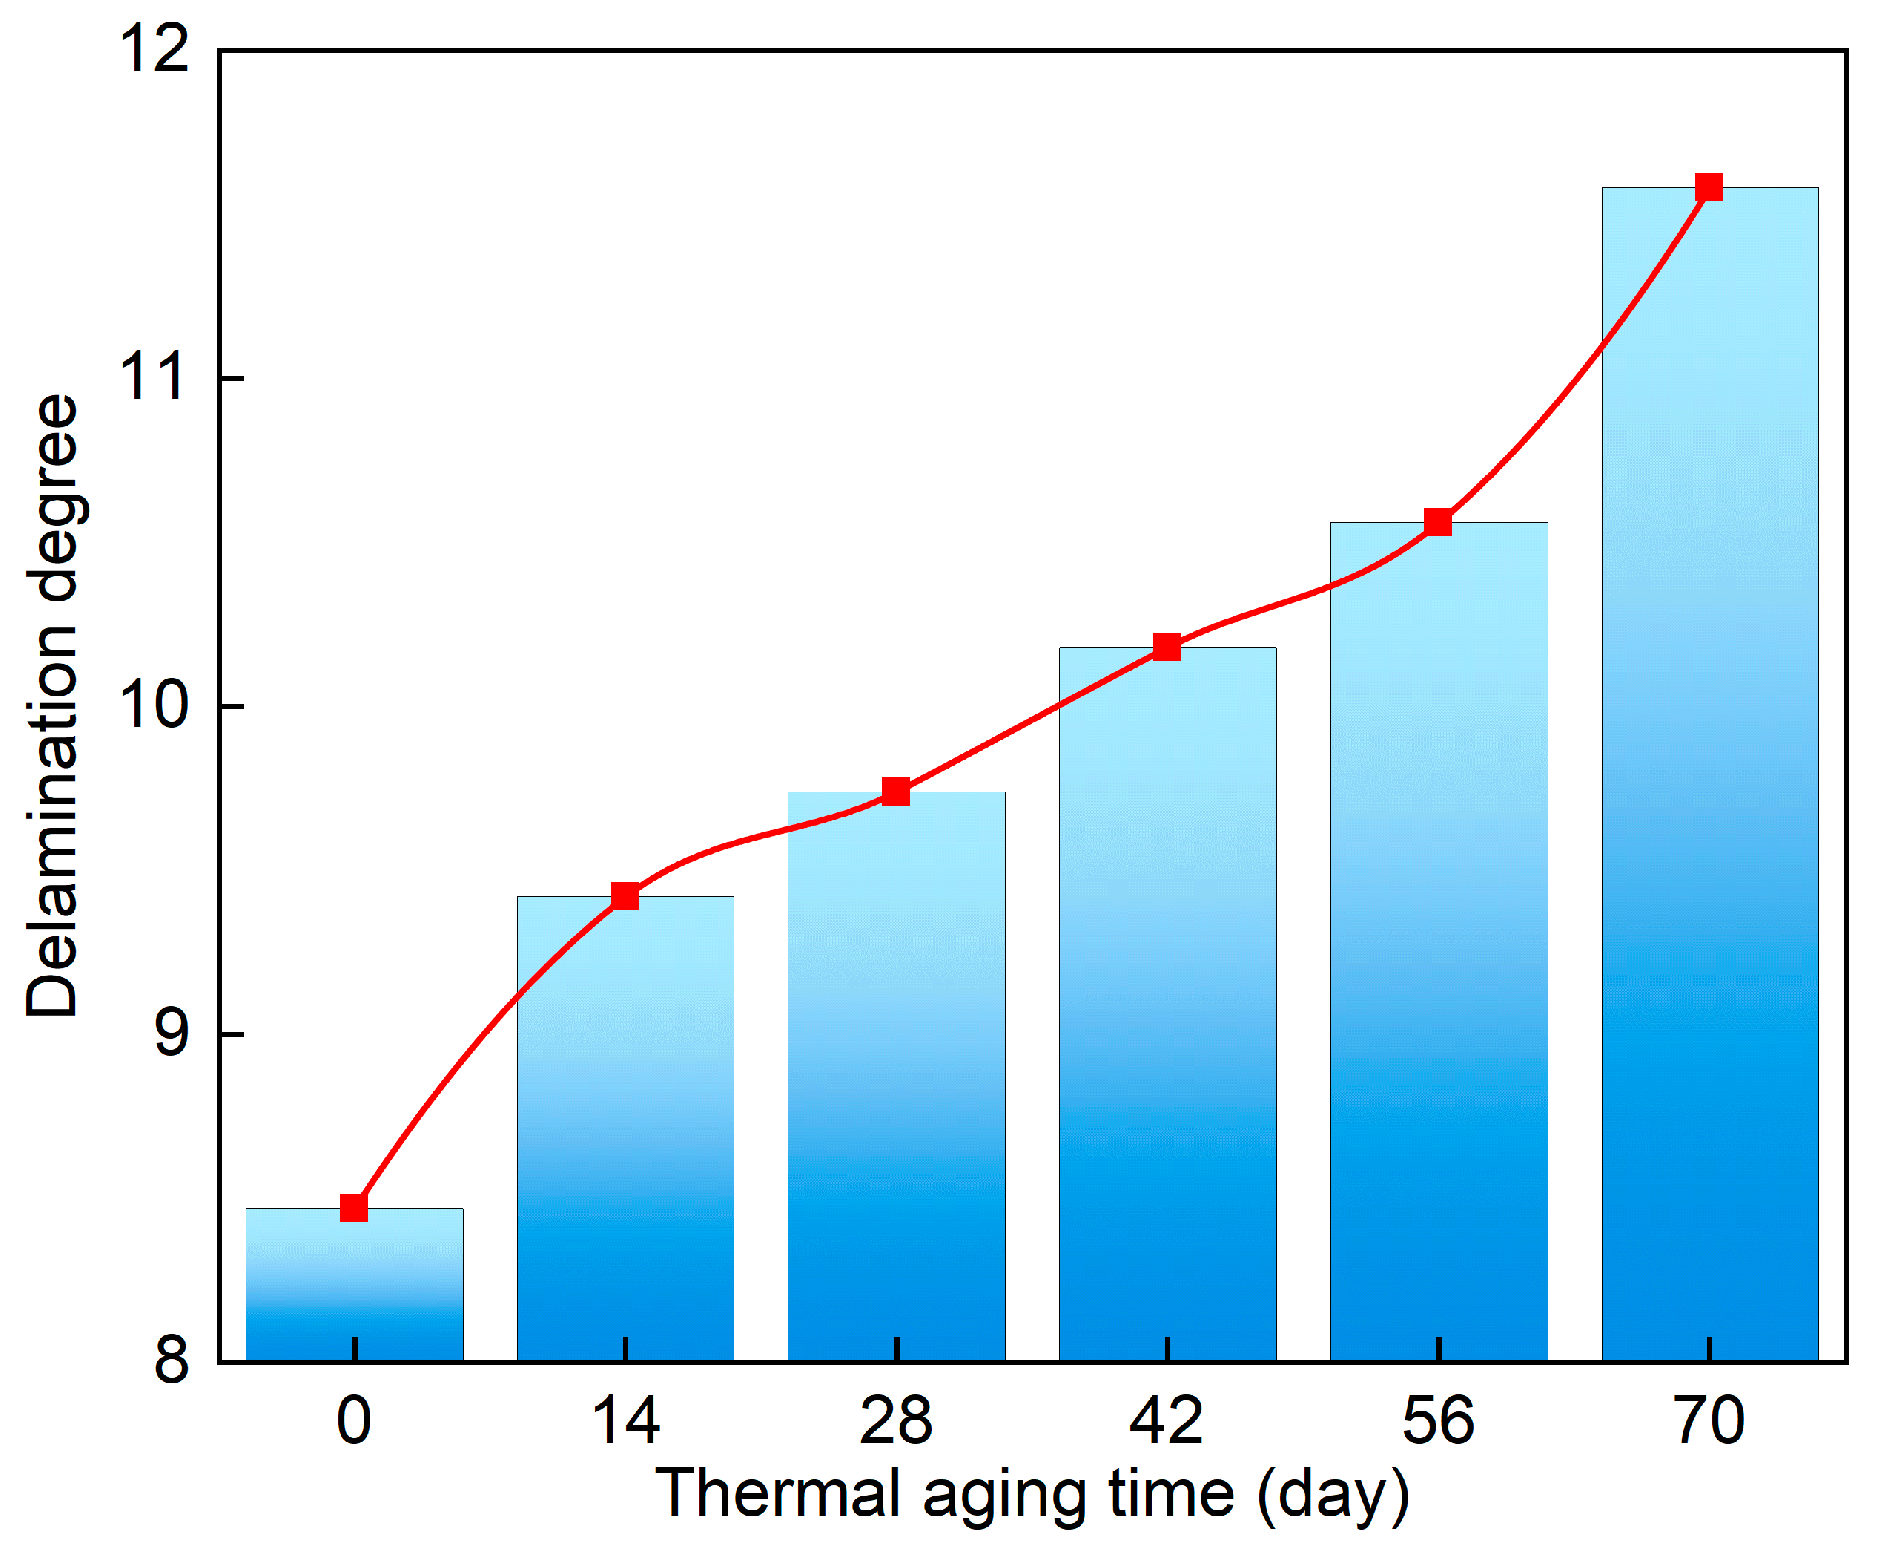
4.1.1. Dielectric Property Analysis

An ultra-low frequency dielectric loss measurement device was used to measure the dielectric loss of cable samples with different aging degrees. The results are shown in Figure 8, where U is the output voltage of the ultra-low frequency power supply; 28 kV was selected for this experiment.
As shown in Figure 8, when the cable was unaged, the dielectric loss was not sensitive to the change of frequency. With the decrease of frequency, the dielectric loss had no obvious changing trend, and the two curves were intertwined. This showed that when the cable was unaged, frequency was not a factor in the significant change of dielectric loss.
With an increase in aging time, the changing trend in dielectric loss was more obvious. The dielectric loss increased with the decrease of frequency or the increase of voltage amplitude. At the same time, the interval between the dielectric loss curves increased and the slope became larger. From the dielectric loss test results, it was found that for aging cable, the change of frequency and voltage amplitude considerably changed the dielectric loss value. As aging became more severe, more polar products were generated in the XLPE insulation. As the voltage amplitude increased, the polarization process became more complete, resulting in greater losses.

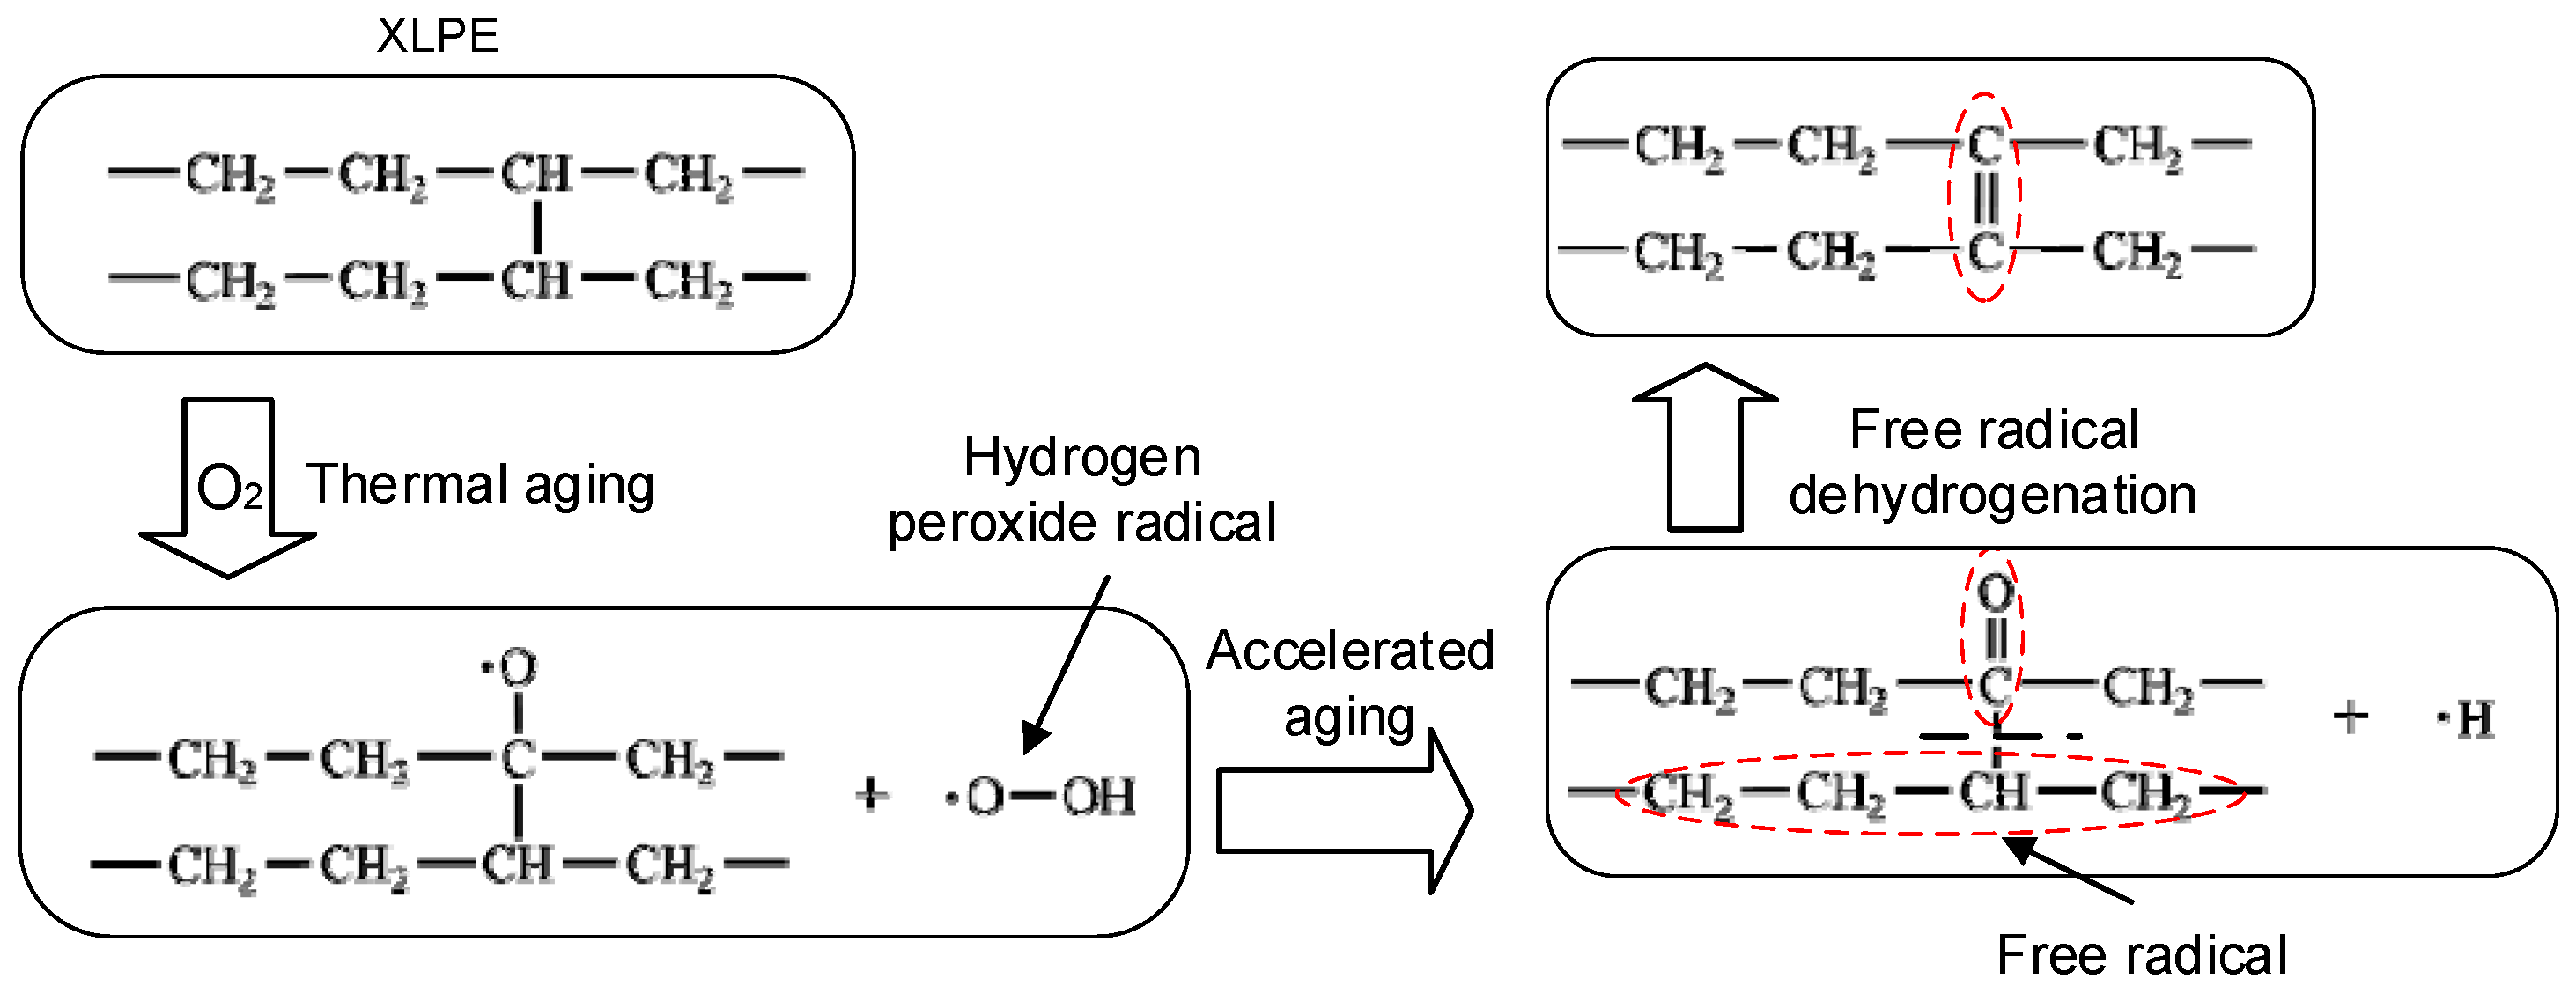
4.1.2. Fourier Transform Infrared Spectroscopy Analysis

Infrared spectroscopy was used to test the cable slice samples with different thermal aging cycles. Changes in the oxidation degree of the cable during thermal aging were assessed based on the carbonyl peak. The test results are shown in Figure 9. The functional groups of unaged XLPE samples were mainly concentrated in the region with a wave number of 2750–3000 cm−1, corresponding to the absorption bands of hydrocarbon bonds, i.e., methylene and methyl. After accelerated thermal aging treatment, the main functional groups in the XLPE samples were carbonyl and carbon carbon double bonds, which were around 1725–1735 cm−1 and 1595–1600 cm−1, respectively.
A schematic diagram of the XLPE thermal oxidative aging reaction is shown in Figure 10. It can seen from Figure 10 that the XLPE molecular chain had broken the hydrocarbon bond under the action of oxygen, the oxygen atom combined with the carbon atom to form a carbon–oxygen single bond, and the free hydrogen atom combined with the oxygen atom to form a hydrogen peroxide free radical. With aging, the carbon–oxygen single bond formed a carbon–oxygen double bond, forming a carbonyl group. At the same time, some carbon–carbon bonds also broke, forming free radicals at the carbon–carbon bond break, and a dehydrogenation reaction occurred between some free radicals, forming carbon–carbon double bonds.
The carbonyl index was used to quantitatively describe variations in the carbonyl content with aging time at different aging temperatures. The calculation results are shown in Table 1. It can seen from Table 1 that the carbonyl index increased gradually with the extension of aging time. This was because with an increase in aging time, the hydrocarbon bonds were oxidized to carbon–oxygen double bonds, and carbonyl compounds were gradually generated, resulting in a rapid increase in the content of polar groups and a decline in cable insulation performance.

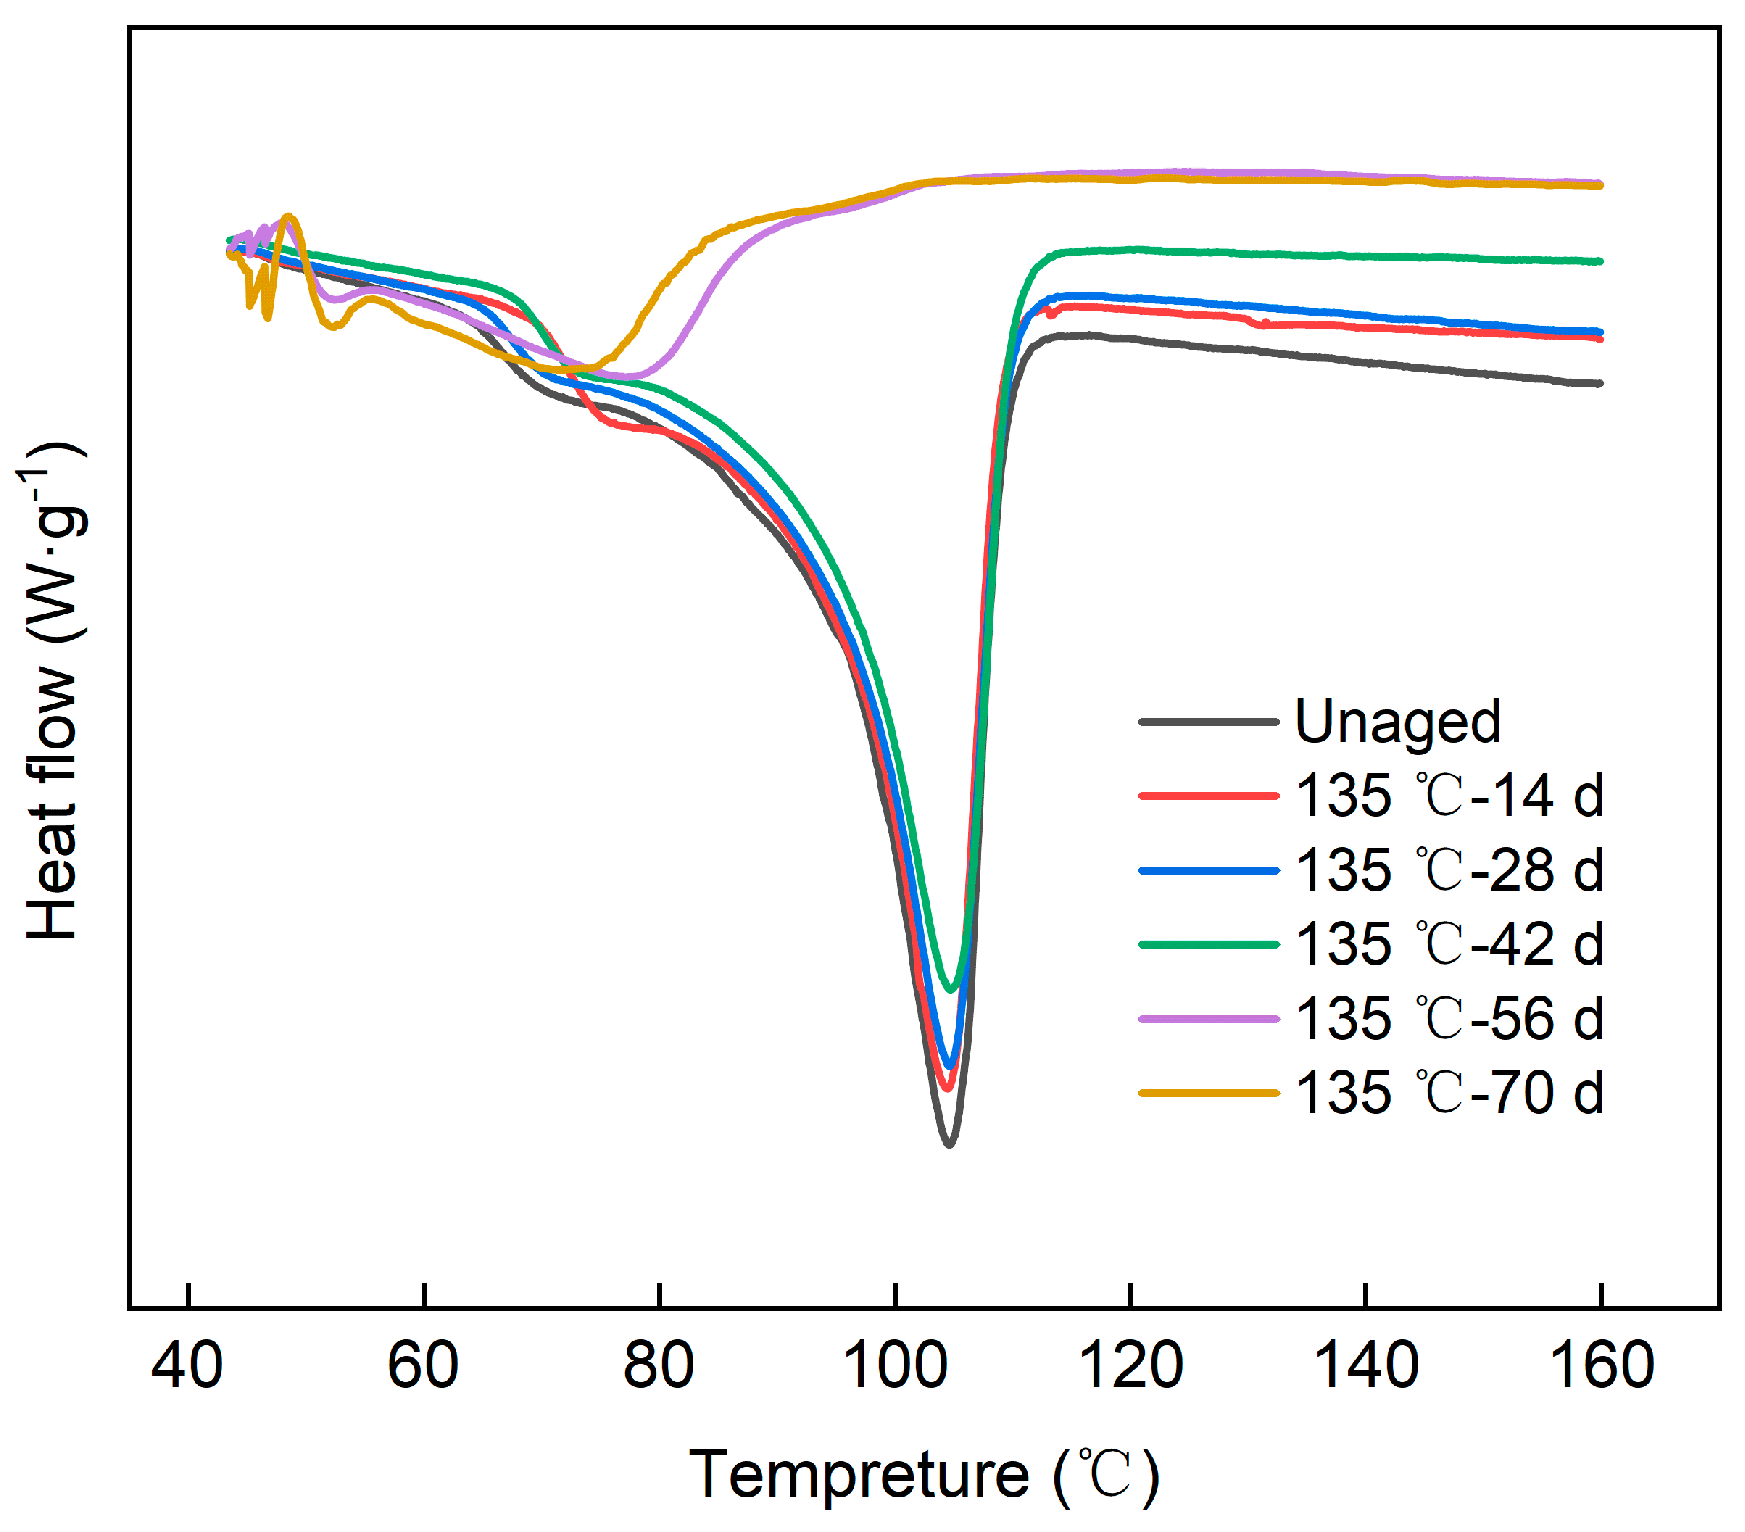
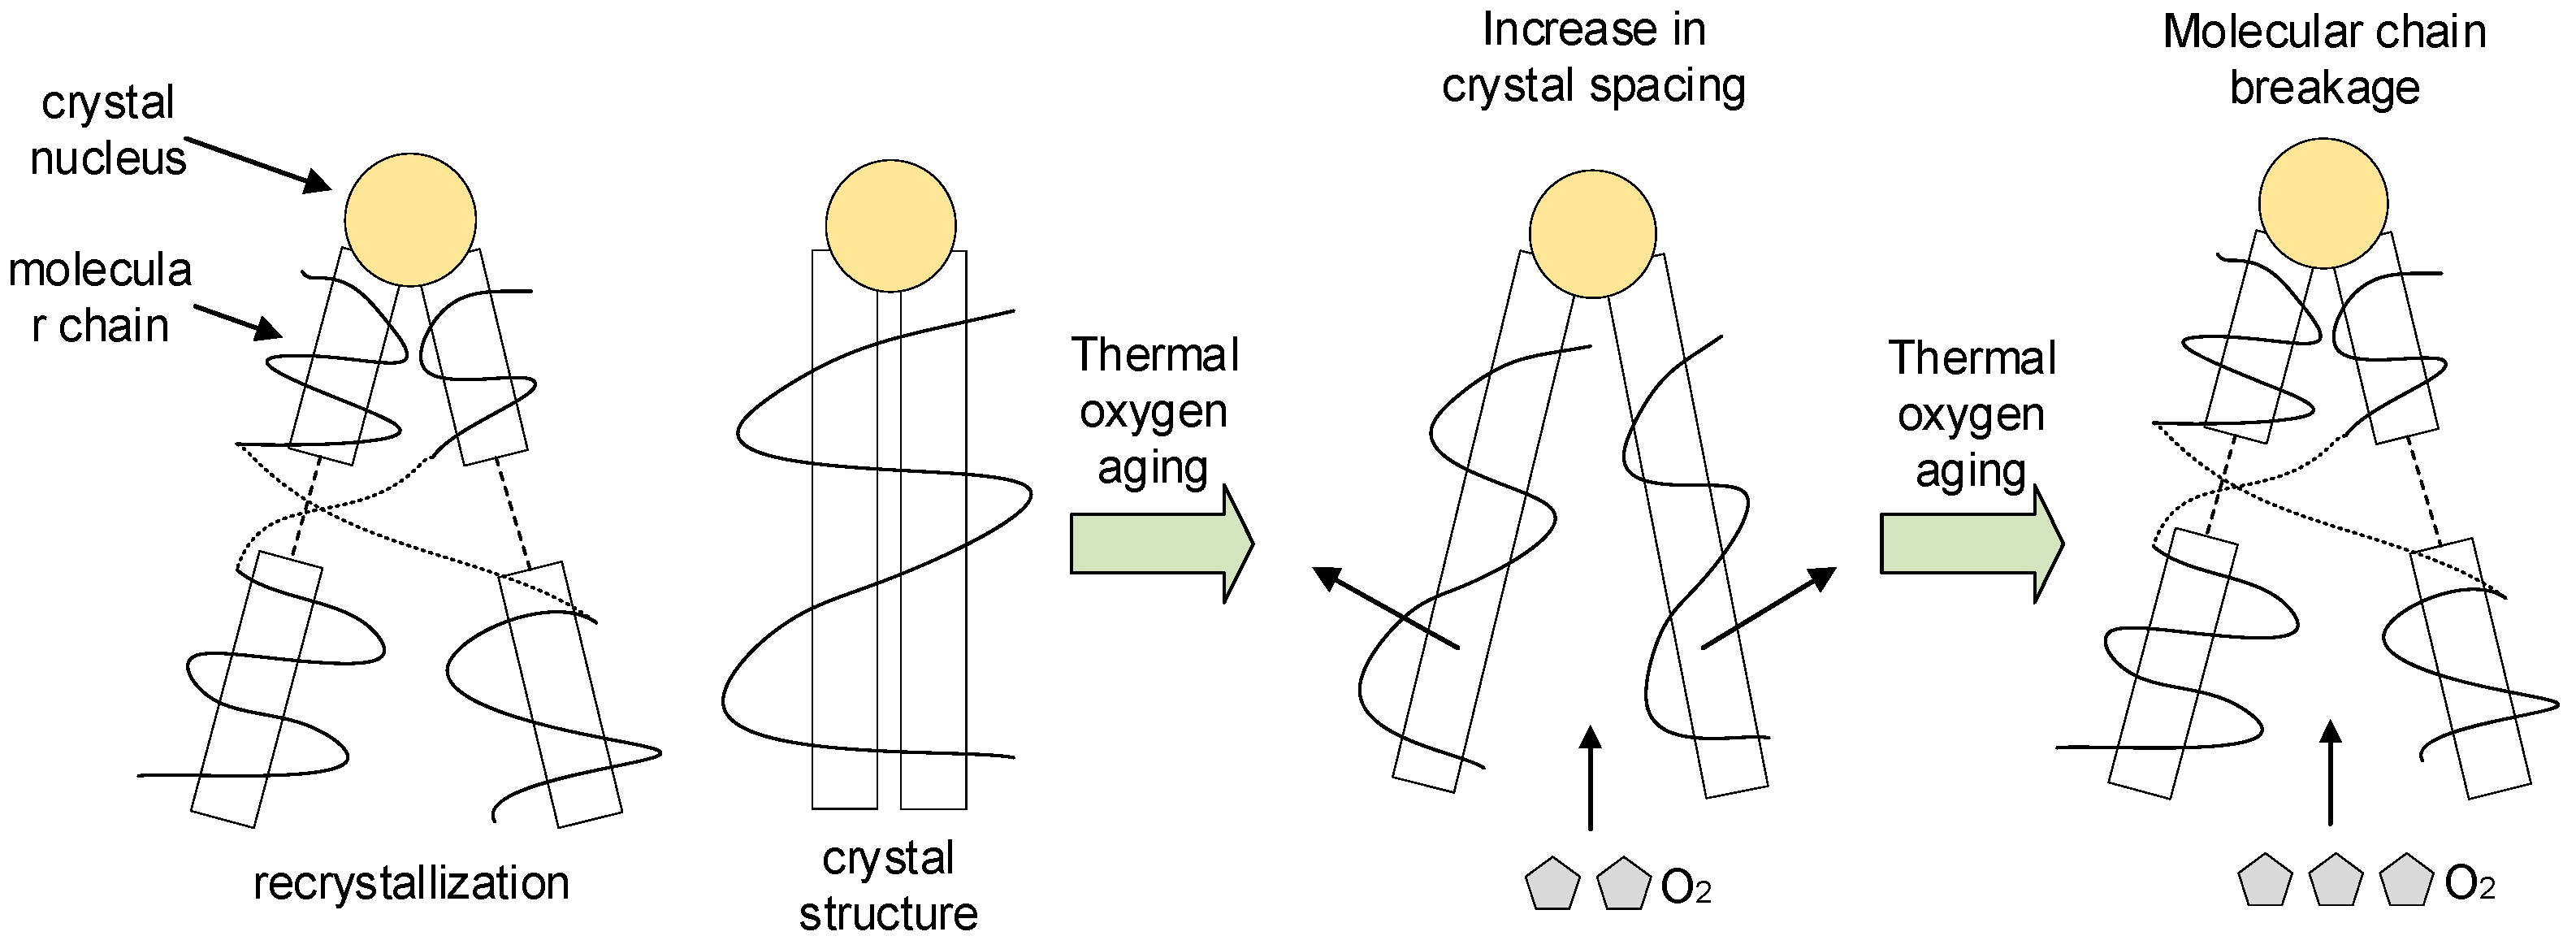
4.1.3. Differential Scanning Calorimetry Analysis

The differential scanning calorimetry curves of samples with different aging times at a thermal aging temperature of 135 °C are shown in Figure 11.
According to Figure 11, in the early stage of aging, the melting peak temperature of XLPE insulation material was large, and the melting peak area was also large. With the aging process, the melting peak temperature gradually decreased, and the main peak of the curve gradually disappeared.
XLPE is a semi crystalline polymer, and the degree of crystallization has an extremely important impact on its electrical properties. A schematic diagram of the effect of thermal aging on the microstructure of XLPE molecules is shown in Figure 12.
At the initial stage of aging, due to the thermal aging temperature being higher than the melting temperature of XLPE, a portion of the amorphous region underwent remelting and recrystallization. The molecular chains in the amorphous region underwent rearrangement, and the amorphous region transformed into a crystalline region. Therefore, the crystallinity of XLPE increased in the initial stage of aging. Under the effect of the recrystallization stage, the tightly arranged crystalline region had a certain inhibitory effect on the invasion of oxygen. As the aging time increased, the antioxidants in XLPE were consumed; meanwhile, the high temperature promoted an increase in the degree of movement of the molecular chains, resulting in a thermal expansion force between the molecular chains and the lamellar crystals, which led to an increase in the inter-crystal spacing between the lamellar crystals and accelerated the oxidation reaction.
Table 2 shows the crystallinity of samples in different aging states calculated according to the melting crystallization curve. The melting enthalpy of XLPE samples aged at 135 °C decreased significantly with an increase in aging time, and the crystallinity decreased significantly after aging for 70 d.

4.1.4. Mechanical Performance Analysis

The elongation at break of standard dumbbell shaped samples made of XLPE cable was tested, as shown in Figure 13.
At 135 °C, the elongation at break and the maximum tensile strength of the XLPE samples decreased rapidly. At 56 d, the elongation at break decreased to 370%, which was close to the end of life when the elongation at break decreased by 50%. After aging for 70 d, the elongation at break was 210%, which was only 28.7% that of the unaged sample.

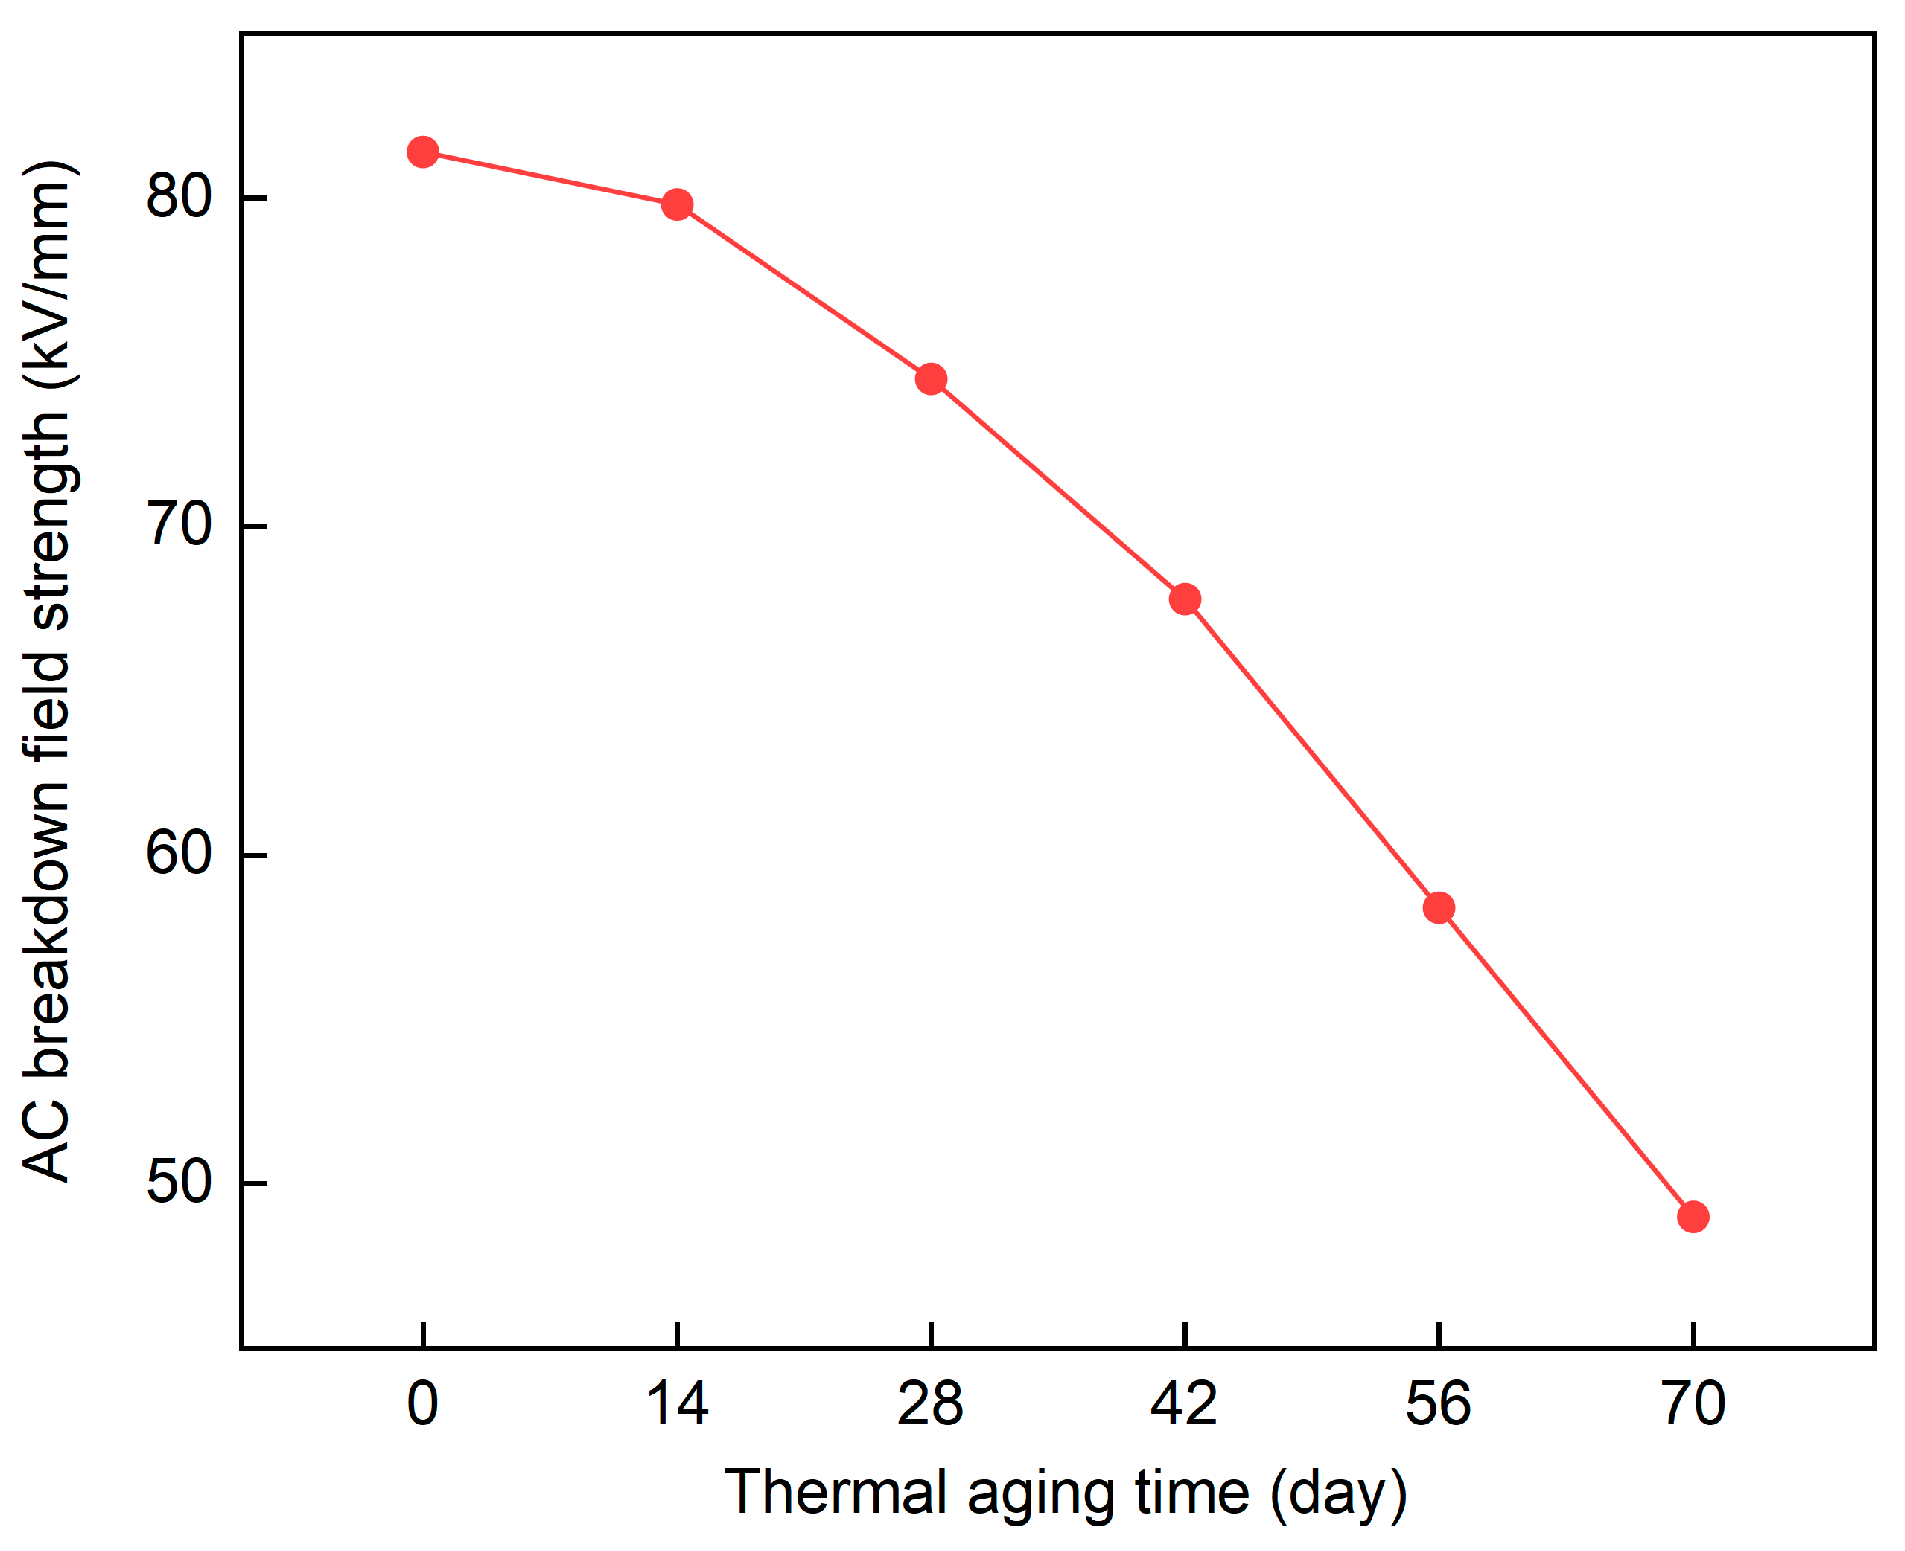
4.1.5. AC Breakdown Field Strength Analysis

The test results of the AC breakdown field strength at different aging times are shown in Figure 14. When the XLPE insulation was aged for 70 d, the AC breakdown field strength decreased to 49 kV/mm, which did not reach the end point of 50% reduction in the breakdown field strength.

4.2. Analysis of Dielectric Characteristic Parameters in Frequency Domain

In the early stage of thermal aging, the number of aging products in XLPE increased with an increase in aging time, and its content was relatively small compared with that in the late stage of aging. At the same time, the spherulites in XLPE were closely arranged and the crystallization area was wide. Under the action of an ultra-low frequency voltage signal, the particles in the XLPE samples were more inclined to complete the polarization process, and the dielectric loss value increased slowly.
At the later stage of thermal aging, the aggregation structure of the XLPE cable changed significantly, and the crystalline morphology gradually changed to an amorphous morphology, which increased the number of internal interfaces in the insulation. The molecular chain of XLPE broke during aging. Under the action of oxygen, the broken molecular chain combined with oxygen to form polar carbonyl and other functional groups, which improved the polarization ability of XLPE and made the dielectric properties voltage-dependent.
It can be seen from the above analysis that with an increase in voltage level, the polarization degree of the particles in the XLPE insulation was greater, and the loss was greater. Therefore, an increase in voltage would accumulate more losses, which would lead to the delamination of the frequency domain dielectric response curve of the cable under different test voltages. Based on the delamination phenomenon, we then extracted the delamination degree of the frequency domain dielectric loss curve as the quantity with which to characterize the dielectric loss change of XLPE cable, as shown in Equation (6).
S k = n = 1 4 tan 0.75 U δ ( f n ) + tan U δ ( f n ) tan 0.5 U δ ( f n )
where Sk is the stratification degree of dielectric loss curve after aging for k d, and n is the nth test frequency point.
The dielectric loss curve delamination degree on different aging days could be calculated using Equation (6), with the results displayed in Figure 15. It can be seen from Figure 15 that there was a significant difference in the delamination degree of the dielectric loss curve on different aging days, which had a good corresponding relationship with the insulation state of the cable.
With continuous aging, more polar products appeared inside the XLPE insulation. At low frequency, the greater the extent of polarization, the greater the dielectric loss. In this paper, a dielectric loss value at a voltage level of U and a frequency of 0.1 Hz were selected as the characteristic values. The relationship between the selected dielectric loss value tanδ and aging time is shown in Table 3. By studying the relationship between frequency domain dielectric loss and insulation aging, a more comprehensive schematic for cable insulation condition assessments could be elaborated.

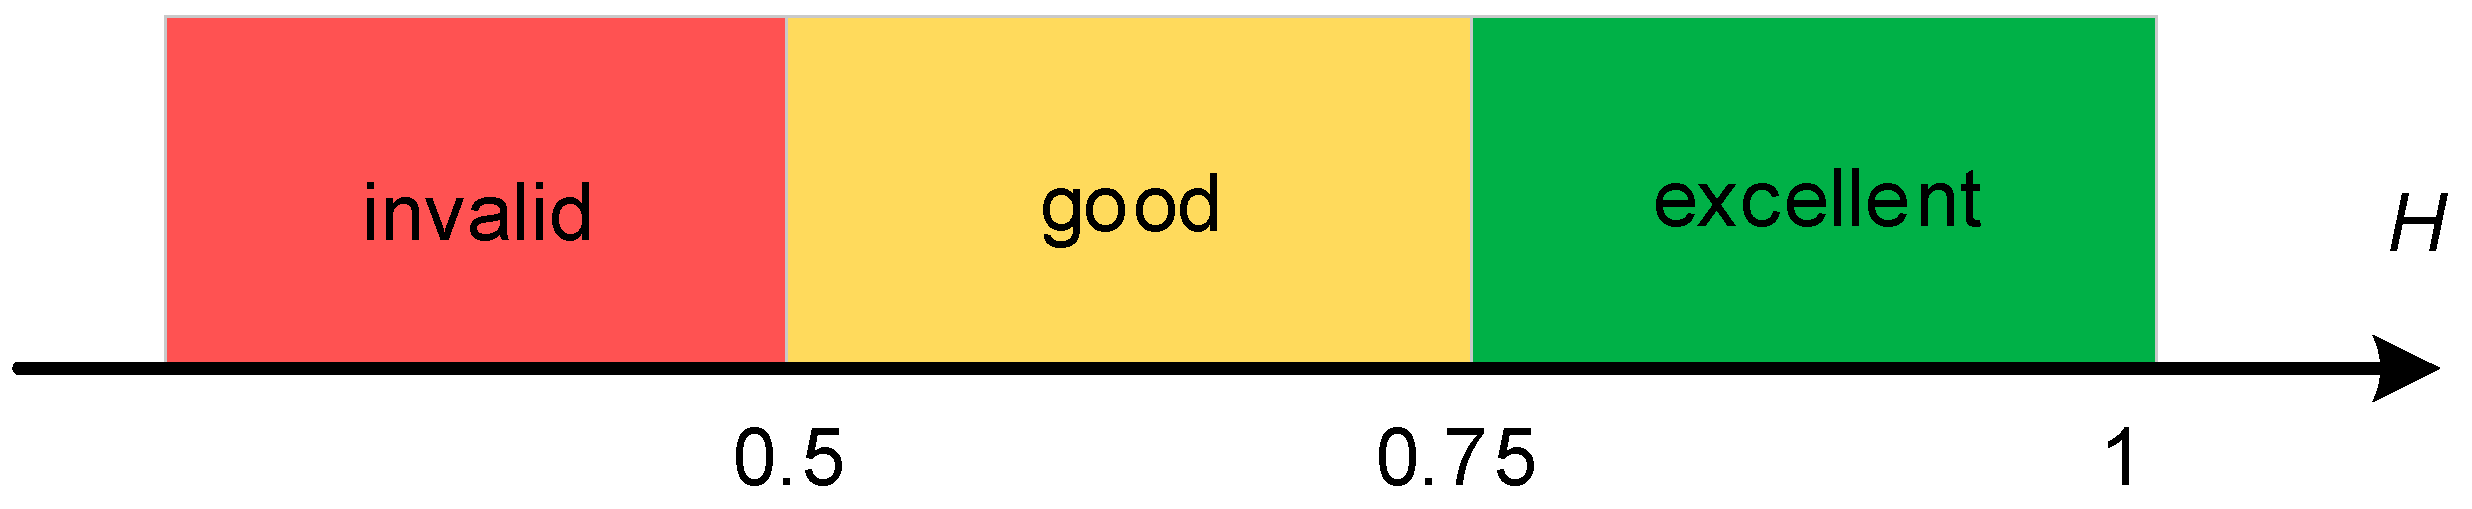
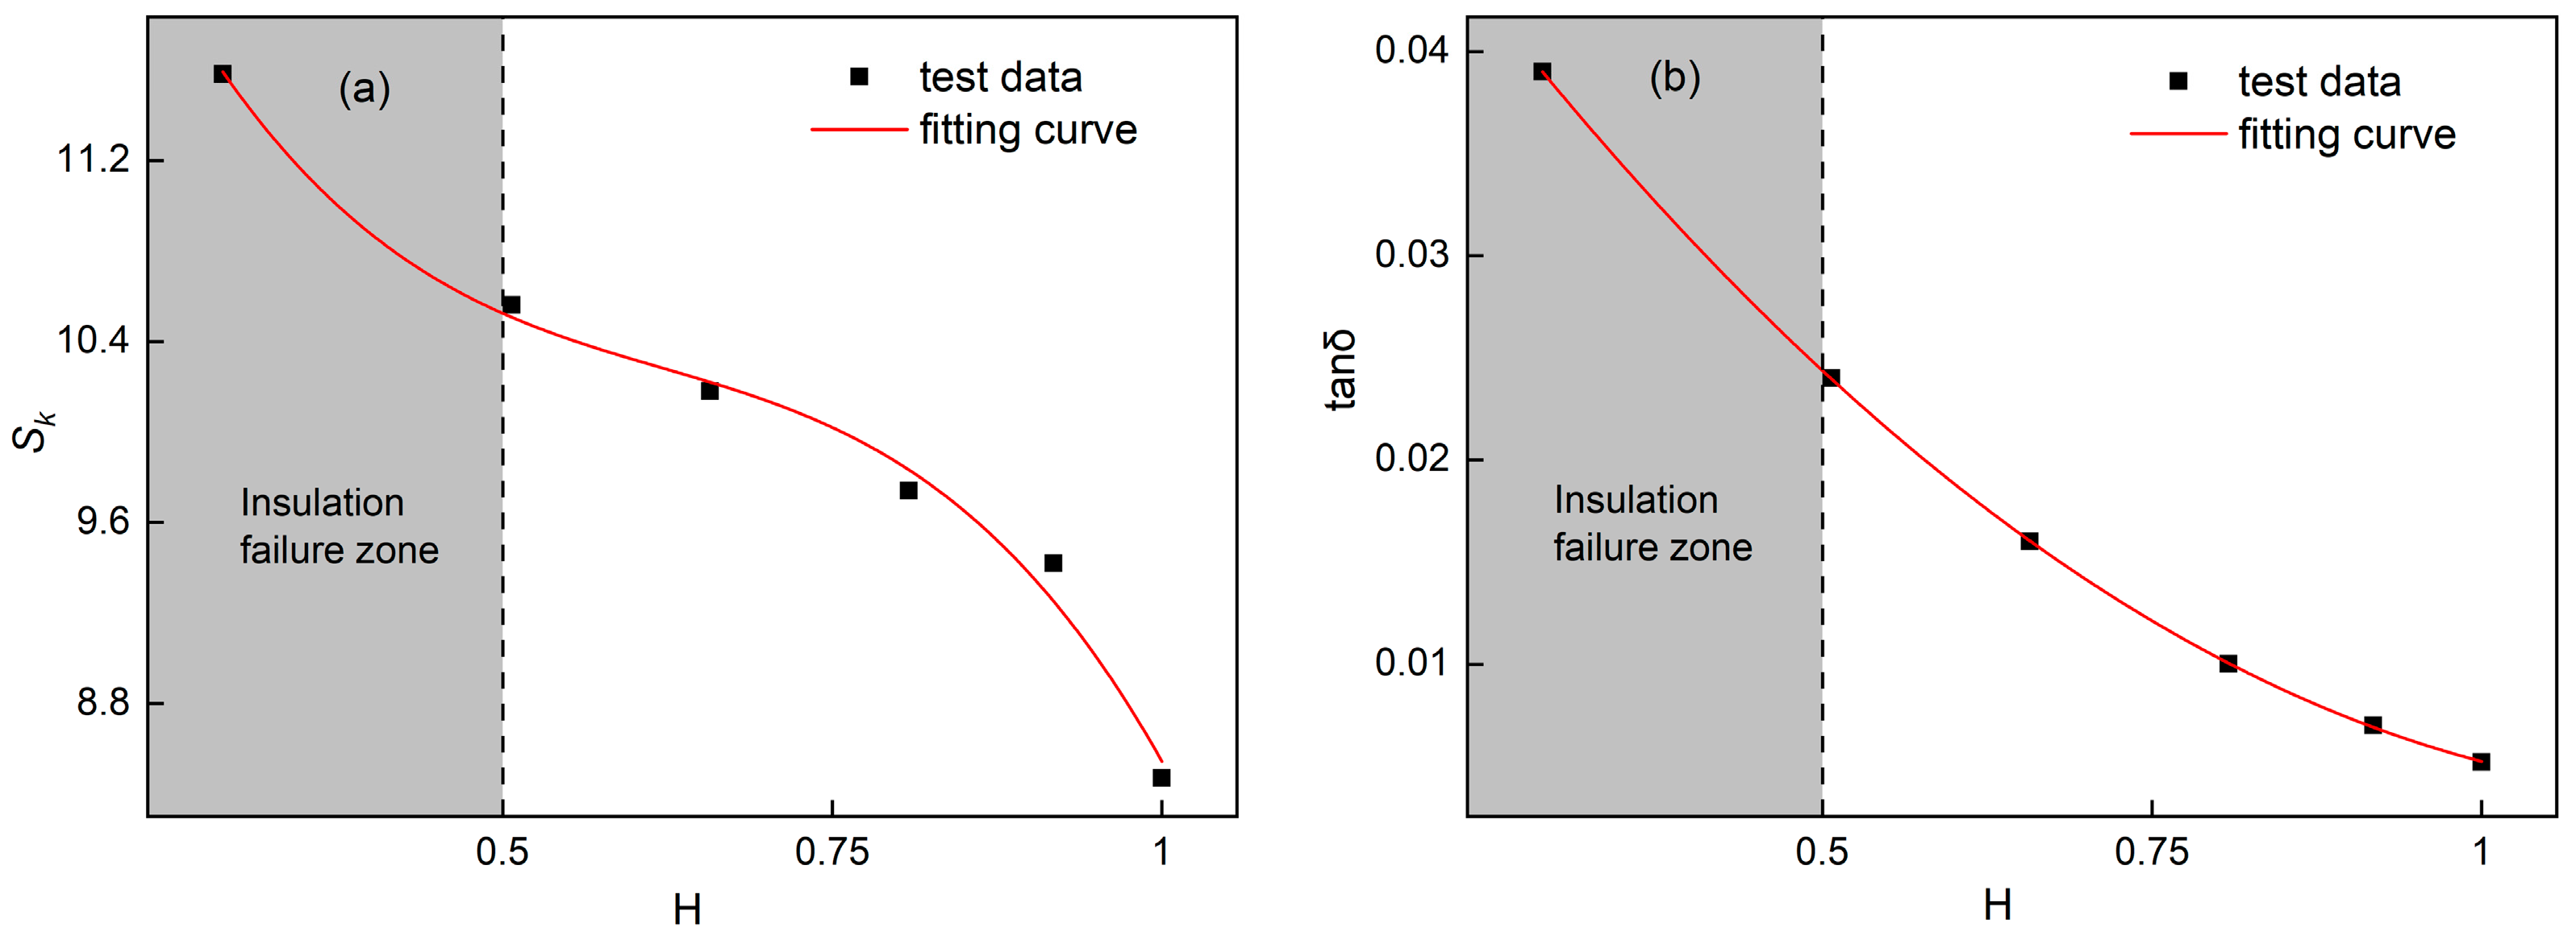
4.3. Determination of Aging Evaluation Criteria

At an aging time of 56 d, the elongation at break decreased to 50%, while the AC breakdown field strength at each aging stage did not decrease to 50%. When the elongation at break was taken as the index, the insulation reached the failure point faster. Therefore, we took the mechanical performance evaluation standard of cable insulation as the criterion. The elongation at break was normalized and defined as parameter H. The division criteria were shown in Figure 16:
When 0.75 ≤ H < 1, the performance was excellent; when 0.5 ≤ H < 0.75, the performance was good; and when H < 0.5, the performance was invalid.
According to the above proposed classification standard of cable insulation state, the correlation among dielectric loss curve delamination degree Sk, dielectric loss value tanδ, and normalized elongation at break H at different aging stages was evaluated, as shown in Figure 17.
The delamination degree and normalized elongation at break were numerically fitted, and the fitting formula was obtained as follows. The fitting coefficient of the fitting result was 0.99, indicating that the data fitting effect was excellent. Through the fitting function, a cable aging evaluation interval corresponding to Sk was calculated.
S k = 16.13 24.86 H + 37.3 H 2 20 H 3
The dielectric loss value and the normalized elongation at break were numerically fitted, and the fitting formula was obtained as follows. The fitting coefficient of the fitting result was 0.99, indicating that the data fitting effect was excellent. Through the fitting function, a cable aging evaluation interval corresponding to tanδ was calculated.
tan δ = 0.065 0.1 H + 0.04 H 2 0.0002 H 3
According to the fitting results of the frequency domain dielectric characteristic quantity, the evaluation interval of cable insulation state is shown in Table 4. The delamination degree was taken as the evaluation standard: when Sk ≥ 10.56, the performance was invalid. The dielectric loss value was taken as the evaluation standard: when tanδ ≥ 0.024, the performance was invalid. After the frequency domain dielectric characteristic quantity had been measured, corresponding to the cable insulation evaluation interval, the aging state of cable insulation could be judged.
The assessment process of cable insulation condition based on the delamination degree of the dielectric loss curve was as follows: Firstly, an ultra-low frequency dielectric loss measurement device was used to test the frequency domain dielectric response characteristics of the cable. The voltage level was set to 0.5 U–0.75 U-U, and the frequency was set to 0.01–0.1 Hz. Then, based on Equation (6), the delamination degree of the frequency domain dielectric characteristic curve was calculated. Finally, according to the corresponding relationship between delamination degree Sk, dielectric loss value tanδ, and the evaluation interval of the cable insulation state, the evaluation results of cable insulation state were obtained.

5. Conclusions

In this paper, an ultra-low frequency dielectric loss measurement system was designed. The frequency domain dielectric properties of XLPE cable were tested by setting the output voltage and frequency of the system. At the same time, XLPE slice samples were prepared and the carbonyl index, crystallinity, AC breakdown field strength, and elongation at break were measured. The evolution rules of the functional group content, aggregation structure, and mechanical properties of the XLPE cable insulation were studied and analyzed. The correlation mechanism between the microscopic behavior of XLPE cable insulation and frequency domain dielectric properties was clarified. By analyzing the influence of the test voltage and frequency on the frequency domain dielectric curve, the characteristic extent of cable insulation was determined. Based on existing diagnostic and evaluation criteria of mechanical properties, the correlation between the frequency domain dielectric characteristics of cables and their aging status was constructed. Finally, according to the frequency domain dielectric characteristics, an evaluation method of cable insulation aging state was formulated.

Author Contributions

Conceptualization, T.H. and W.L.; methodology, T.H. and W.L.; software, W.L. and C.H.; validation, Z.Z.; formal analysis, J.C. and Y.L.; investigation, Z.Z., J.C. and Y.L.; resources, T.H. and W.L.; data curation, Z.Z. and T.H.; writing—original draft preparation, T.H., W.L. and Z.Z.; writing—review and editing, T.H. and Z.Z.; funding acquisition, T.H. All authors have read and agreed to the published version of the manuscript.

Funding

This research received no external funding.

Data Availability Statement

Data available upon request from the authors.

Conflicts of Interest

The authors declare no conflicts of interest.

References

  1. Zhou, K.; Yuan, H.; Li, Y.; Li, M.; Li, Z.; Lin, S. Assessing Aging Status and Type of XLPE Cable Insulation with a Graphic Approach Based on PDC Measurement. IEEE Trans. Power Deliv. 2022, 37, 5114–5123. [Google Scholar] [CrossRef]
  2. Sebbane, Y.; Boubakeur, A.; Mekhaledi, A. Influence of Thermal Aging and Water Adsorption on XLPE Cables Insulation Mechanical and Physico-chemical Properties. IEEE Trans. Dielectr. Electr. Insul. 2021, 28, 1694–1702. [Google Scholar] [CrossRef]
  3. Zhu, W.; Zhao, Y.; Han, Z.; Wang, X.; Wang, Y.; Liu, G.; Xie, Y.; Zhu, N. Thermal Effect of Different Laying Modes on Cross-Linked Polyethylene (XLPE) Insulation and a New Estimation on Cable Ampacity. Energies 2019, 12, 2994. [Google Scholar] [CrossRef]
  4. Li, C.; Tan, X.; Liu, L.; Zhang, W.; Yang, Q.; Cao, J.; Zhou, E.; Li, M.; Song, Z. Investigation of Near-Infrared Spectroscopy for Assessing the Macroscopic Mechanical Properties of Cross-Linked Polyethylene During Thermal Aging. Materials 2025, 18, 504. [Google Scholar] [CrossRef] [PubMed]
  5. Chen, C.; Cheng, C.; Wang, X.; Wu, K. Space Charge Characteristics for XLPE Coaxial Cable Insulation under Electrothermal Accelerated Aging. IEEE Trans. Dielectr. Electr. Insul. 2022, 29, 727–736. [Google Scholar]
  6. Wang, Y.; Zhao, A.; Zhang, X.; Shen, Y.; Yang, F.; Deng, J.; Zhang, G. Study of Dielectric Response Characteristics for Thermal Aging of XLPE Cable Insulation. In Proceedings of the 2016 International Conference on Condition Monitoring and Diagnosis (CMD), Xi’an, China, 25–28 September 2016; pp. 602–605. [Google Scholar]
  7. Jahromi, A.N.; Pattabi, P.; Densley, J.; Lamarre, L. Medium Voltage XLPE Cable Condition Assessment Using Frequency Domain Spectroscopy. IEEE Electr. Insul. Mag. 2020, 32, 9–18. [Google Scholar] [CrossRef]
  8. Zhu, X.; Yin, Y.; Wu, J.; Wang, X. Study on Aging Characteristics of XLPE Cable Insulation Based on Quantum Chemical Calculation. IEEE Trans. Dielectr. Electr. Insul. 2020, 27, 1942–1950. [Google Scholar] [CrossRef]
  9. Pan, L.; Luo, Y.; Wang, X.; Lei, D.; Wang, J.; Zhang, H.; Yang, Z.; Wei, W. Simulation Research on the Effects of Air Gaps and Ambient Temperature on a 27.5 kV Power Cable. Appl. Sci. 2025, 15, 1028. [Google Scholar] [CrossRef]
  10. Yang, J.; Li, R.; Hu, L.; Wang, W. Influence of Thermal Aging on Space Charge Characteristics and Electrical Conduction Behavior of Cross-Linked Polyethylene Cable Insulation. Polymers 2024, 16, 1600. [Google Scholar] [CrossRef] [PubMed]
  11. Boukezzi, L.; Rondot, S.; Jbara, O.; Ghoneim, S.S.M.; Boubakeur, A.; Abdelwahab, S.A.M. Effect of Isothermal Conditions on the Charge Trapping/Detrapping Parameters in e-Beam Irradiated Thermally Aged XLPE Insulation in SEM. Materials 2022, 15, 1918. [Google Scholar] [CrossRef]
  12. Quercio, M.; Del Pino Lopez, J.C.; Grasso, S.; Canova, A. Numerical and experimental analysis of thermal behaviour of high voltage power cable in unfilled ducts. Sci. Rep. 2024, 14, 20599. [Google Scholar] [CrossRef]
  13. Sahoo, R.; Karmakar, S. Impact of Accelerated Thermal Aging on Electrical Tree Structure and Physicochemical Characteristics of XLPE Insulation. IEEE Trans. Dielectr. Electr. Insul. 2024, 31, 429–438. [Google Scholar] [CrossRef]
  14. Wang, X.; Liu, E.; Zhang, B. Reflectometry Based Cable Insulation Aging Diagnosis and Prognosis. IEEE Trans. Ind. Electron. 2021, 69, 4148–4157. [Google Scholar] [CrossRef]
  15. Wang, H.; Tan, G.; Tan, Y.; Zhou, L.; Lu, Y. Analysis of Thermal Aging Life and Physicochemical Properties of Crosslinked Polyethylene Seabed Cable Insulation. Polym. Mater. Sci. Eng. 2015, 31, 71–75. [Google Scholar]
  16. Kemari, Y.; Mekhaldi, A.; Teyssèdre, G.; Teguar, M. Correlations Between Structural Changes and Dielectric Behavior of Thermally Aged XLPE. IEEE Trans. Dielectr. Electr. Insul. 2019, 26, 1859–1866. [Google Scholar] [CrossRef]
  17. Boukezzi, L.; Boubakeur, A. Effect of Thermal Aging on the Electrical Characteristics of XLPE for HV Cables. Trans. Electr. Electron. Mater. 2018, 19, 344–351. [Google Scholar] [CrossRef]
  18. Boukezzi, L.; Boubakeur, A.; Laurent, C.; Lallouani, M. DSC Study of Artificial Thermal Aging of XLPE Insulation Cables. 2007 IEEE Int. Conf. Solid Dielectr. 2007, 1, 146–149. [Google Scholar]
  19. Sandelin, M.; Gedde, U. Long-term Performance of Cables Based on Chlorosulphonated Polyethylene. Polym. Degrad. Stab. 2004, 86, 331–338. [Google Scholar] [CrossRef]
  20. Liu, Y.; Cao, X. Insulation Performance Evaluation of HV AC/DC XLPE Cables by 0.1 Hz tan δ Test on Circumferentially Peeled Samples. IEEE Trans. Dielectr. Electr. Insul. 2017, 24, 3941–3950. [Google Scholar] [CrossRef]
  21. Afia, R.S.A.; Mustafa, E.; Tamus, Z.Á. Comparison of Mechanical and Low-Frequency Dielectric Properties of Thermally and Thermo-Mechanically Aged Low Voltage CSPE/XLPE Nuclear Power Plant Cables. Electronics 2021, 10, 2728. [Google Scholar] [CrossRef]
Figure 1. Preparation and treatment of cable samples.
Energies 18 01267 g001
Figure 2. Preparation and treatment of cable slice sample. (a) Preparation of XLPE slice specimens; (b) heat aging treatment.
Energies 18 01267 g002
Figure 3. Flyback switching power supply.
Energies 18 01267 g003
Figure 4. Signal amplification circuit.
Energies 18 01267 g004
Figure 5. System power supply and signal amplification.
Energies 18 01267 g005
Figure 6. Ultra-low frequency dielectric loss measurement platform.
Energies 18 01267 g006
Figure 7. Calculation process of apFFT.
Energies 18 01267 g007
Figure 8. Test results of cable dielectric loss.
Energies 18 01267 g008
Figure 9. Test results of FTIR.
Energies 18 01267 g009
Figure 10. Schematic diagram of thermal oxygen aging reaction.
Energies 18 01267 g010
Figure 11. Test results of DSC.
Energies 18 01267 g011
Figure 12. Schematic diagram of XLPE molecular microstructure.
Energies 18 01267 g012
Figure 13. Test results of elongation at break.
Energies 18 01267 g013
Figure 14. Test results of AC breakdown field strength.
Energies 18 01267 g014
Figure 15. Calculation results of delamination degree.
Energies 18 01267 g015
Figure 16. Classification standard of cable insulation state.
Energies 18 01267 g016
Figure 17. Fitting results of test data. (a) Fitting results of delamination degree Sk; (b) fitting results of dielectric loss value tanδ.
Energies 18 01267 g017
Table 1. Calculation results of carbonyl index.
Thermal aging time (day)01428425670
Carbonyl index1.31.451.632.072.653.62
Table 2. Calculation results of crystallinity.
Thermal aging time (day)01428425670
Crystallinity (%)32.425.523.415.17.15.3
Table 3. The results of dielectric loss value.
Thermal aging time (day)01428425670
tanδ0.00520.0070.010.0160.0240.039
Table 4. Evaluation interval of cable insulation state.
Characteristic ParameterValue 1Value 2Value 3
H10.750.5
Sk8.4710.0110.56
tanδ0.00520.0120.024
Disclaimer/Publisher’s Note: The statements, opinions and data contained in all publications are solely those of the individual author(s) and contributor(s) and not of MDPI and/or the editor(s). MDPI and/or the editor(s) disclaim responsibility for any injury to people or property resulting from any ideas, methods, instructions or products referred to in the content.

