Abstract
This study conducts a numerical analysis to understand the effect of flow through the impeller–diffuser side gap on the performance and internal flow of a centrifugal pump. Three-dimensional steady-state Reynolds-averaged Navier–Stokes simulations are performed, employing the shear stress transport turbulence model for turbulence closure. To analyze the effects of side-gap flow on the main passage flow, a simplified fluid domain for the side gap is constructed and applied with a one-dimensional loss model for the leakage flow. The numerical results are validated with experimental data for performance curves and velocity components at the diffuser inlet. For a detailed analysis of the leakage flow, flow simulations are carried out for three cases: flow absence, inflow, and outflow (leakage) in the impeller–diffuser gap. Significant performance deviations are observed according to the flow direction in the gap, and the detailed fluid flow structures are examined to assess its impact on the performance.
1. Introduction
The vaned diffuser is designed to convert the velocity energy imparted by the impeller into static pressure with the primary goal of maximizing static pressure recovery. Due to their superior pressure recovery performance, vaned diffusers are widely used in pumps handling high-energy fluids, such as multi-stage centrifugal pumps for industrial processes and turbo pumps for oxidizers and fuel [1,2,3]. The demand for the enhanced reliability of turbomachinery has grown and the importance of designing for high efficiency and a broad operating range has increased. However, because the flow in vaned diffusers inherently involves an adverse pressure gradient, it is prone to flow separation, leading to various phenomena that limit the operating range. Consequently, careful attention must be given to the design of vaned diffusers to ensure efficiency as well as an operating range for centrifugal turbomachines.
The performance and flow characteristics of diffusers are highly sensitive to their geometric properties; as such, comprehensive research on this topic has been conducted, as follows. Inoue and Cumpsty [4] experimentally measured unsteady data for the velocity and wall static pressure in diffusers with various radius ratios (1.04, 1.1, and 1.2) and vane counts (10, 20, and 30). They observed that as the flow rate decreased, strong backflow appeared at the diffuser vane’s leading edge, initially near the shroud and later near the hub as the flow rate further decreased. They found that this phenomenon weakened as the number of diffuser vanes increased. Tamaki [5] experimentally evaluated the effects of geometric parameters, such as the number of diffuser vanes, installation angle, radius ratio, and throat area, on the performance of centrifugal compressors. He reported that the diffuser throat area was a critical factor affecting the pressure ratio, efficiency, and choking flow rate of the compressor. Gao et al. [6] proposed a design method to adjust the area of the semi-vaneless region between the inlet and the throat by varying the vane thickness of centrifugal compressor diffusers and successfully derived a geometry with a high-pressure recovery coefficient. Recently, Shim et al. [7] proposed staggered partial diffuser vanes, combining the advantages of vaneless and vaned diffusers, to extend the operating range. They also conducted surrogate model-based optimization to derive geometries that simultaneously increased the efficiency and operating range.
In centrifugal machines, the relative motions between the impeller and diffuser induce time-dependent fluid fluctuations via rotor–stator interaction. Arndt et al. [8] investigated unsteady flow characteristics due to the interaction between impeller blades and diffuser vanes in centrifugal pumps. They found that smaller gaps between the impeller and diffuser increased pressure pulsations, which were comparable in magnitude to the overall pump pressure rise. Notably, strong pressure pulsations occurred at the leading edge of the diffuser vane’s suction side and the impeller blade’s trailing edge which were identified as primary causes of cavitation damage. Shum et al. [9] analyzed the effects of impeller–diffuser interaction on the stage-wide static pressure ratio in centrifugal compressors. They reported that the interaction significantly influenced impeller tip leakage flow, losses, blockage, slip, and pressure rise, while axial distortion at the diffuser inlet and impeller outlet had minimal effects on diffuser pressure recovery. Zemp and Abhari [10] studied the effects of impeller–diffuser interaction on the forced vibration of impeller blades in high-speed centrifugal compressors. They found that smaller radial gaps increased the magnitude of unsteady forced blade responses due to potential field effects at the leading edge of diffuser vanes.
Due to the geometric characteristics of rotating turbomachinery, a gap must exist between the rotor and stator, through which leakage flow occurs. Examples include tip clearance in axial turbomachines [11,12,13], turbine rotor–stator disk clearance in gas turbines [14,15,16], and side-chamber flow in centrifugal turbomachines [17,18,19,20,21,22,23]. Kye et al. [19] performed large eddy analysis using an immersed boundary method to investigate the flow characteristics of centrifugal pumps. They reported that strong interactions between the impeller and volute in off-design conditions significantly increased the leakage flow and associated flow losses. Zhai et al. [20] investigated the flow structures of a 10-stage centrifugal pump using large eddy simulations. They showed that vortical flow clusters affected the pressure fluctuations as well as unsteady flow inside side chambers. Babayigit et al. [21] conducted numerical analyses on the effects of balance holes and gaps on the performance of multistage pumps, concluding that considering these factors in CFD analyses yields more accurate results. Guinzburg et al. [22] simulated simple leakage flow geometries for various whirl frequencies, eccentricities, clearances, and flow rates. They noted that leakage flow in centrifugal pumps could significantly contribute to rotor-dynamic forces in turbomachines and found that dimensionless rotor-dynamic forces generally decreased with increasing clearance. Recently, Zhou et al. [23] examined the coupled vibrations in low-specific-speed centrifugal pumps through a two-way solid–fluid interaction approach. Their findings indicated that a low flow rate, narrow wear-ring clearance, and axial displacement contribute to an increase in the rotor system’s vibration acceleration.
As mentioned earlier, extensive research has been conducted on impeller–diffuser interactions and the leakage flow through the gap. Most of the research has focused on these phenomena individually, but there is limited research on their combined or integrated effects. Obviously, it is well known that the leakage flow significantly impacts pump performance [24]. On the other hand, integrated modeling of the main and secondary flow paths requires substantial computational resources due to the different scales involved [20,23]. However, in the preliminary design stage of a turbomachine, it is important to focus on understanding the overall performance of the system rather than demonstrating all the details. Simplifying the gap flow provides a useful preliminary analysis in the early design phase, allowing for quick performance evaluation and helping to suggest reasonable directions. Therefore, in this study, analysis on the effects of the flow in the impeller–diffuser gap on the performance and the flow characteristics was performed using a simplified leakage flow model.
This study aimed to explore the combined effects of the impeller–diffuser side-gap flow on performance and flow characteristics of a centrifugal pump using Reynolds-averaged Navier–Stokes (RANS) analysis. For a simple approach for side-gap flow, a one-dimensional leakage loss model was applied as a boundary condition. This study consists of three main stages. First, the numerical results using a simplified domain and the empirical equation were validated by comparing them with experimental data for centrifugal pumps equipped with vaned diffusers where inflow occurred through the gap. Second, three different conditions—no flow at the impeller–diffuser gap, inflow, and outflow (leakage)—were analyzed to compare pump performance curves and diffuser internal flow structures, examining the impact of leakage flow. Finally, a detailed analysis under varying side clearances was conducted for the cases with leakage flow.
2. Centrifugal Pump and Leakage Flow Model
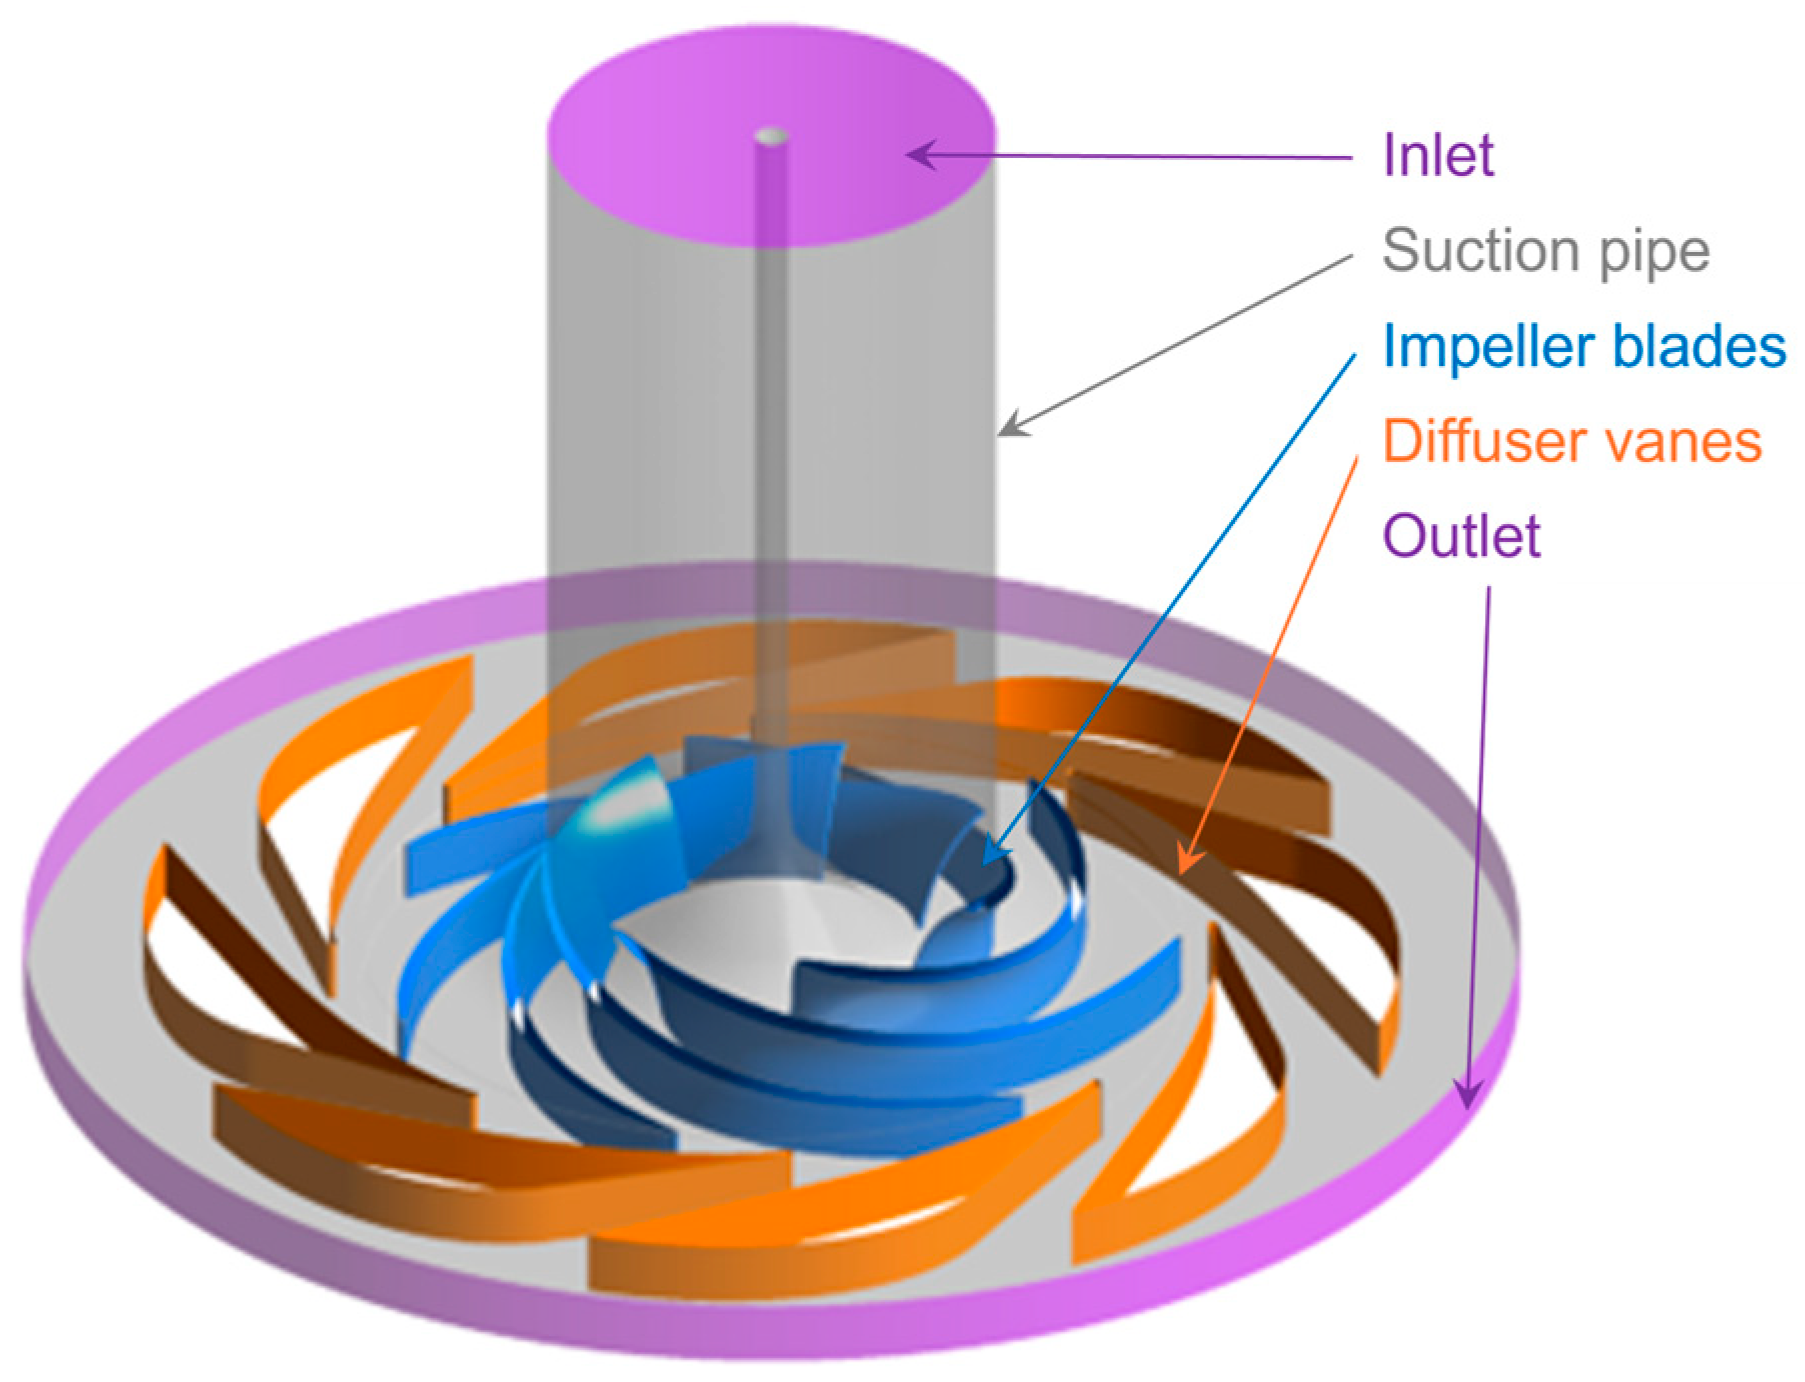
In this study, three-dimensional incompressible flow analysis was conducted on a centrifugal pump equipped with a Société Hydrotechnique de France (SHF) impeller and an island-type diffuser to simulate the impeller–diffuser gap flow (Figure 1). The impeller and diffuser vanes consist of seven and eight blades, respectively, with the impeller rotating clockwise when viewed from above. Detailed specifications are listed in Table 1 [25].

Figure 1.
Société Hydrotechnique de France (SHF) (Paris, France) centrifugal pump model.

Table 1.
Specifications of Société Hydrotechnique de France (SHF) centrifugal pump [25].
Since Si et al. [25] does not provide detailed geometric information on the leakage path in their study, it is challenging to simulate the three-dimensional leakage flow through the side gap. Therefore, a loss model commonly used in meanline analysis was applied to approximate the leakage flow without implementing specific geometric details. Liu et al. [26] empirically defined the leakage flow rate in the side gap between the impeller and casing of a centrifugal pump (ΔQlk) as follows:
where ηlk is the round coefficient at the entrance of the ring gap with the range of 0.5~0.9. λlk is the hydraulic resistance coefficient with the range of 0.04~0.06. X and Y are the axial and radial clearances of the wear ring. D and U are the diameter and blade velocity of the impeller, respectively. The subscript 0, 1, and 2 indicate the impeller inlet, impeller blade inlet, and impeller blade outlet, respectively.
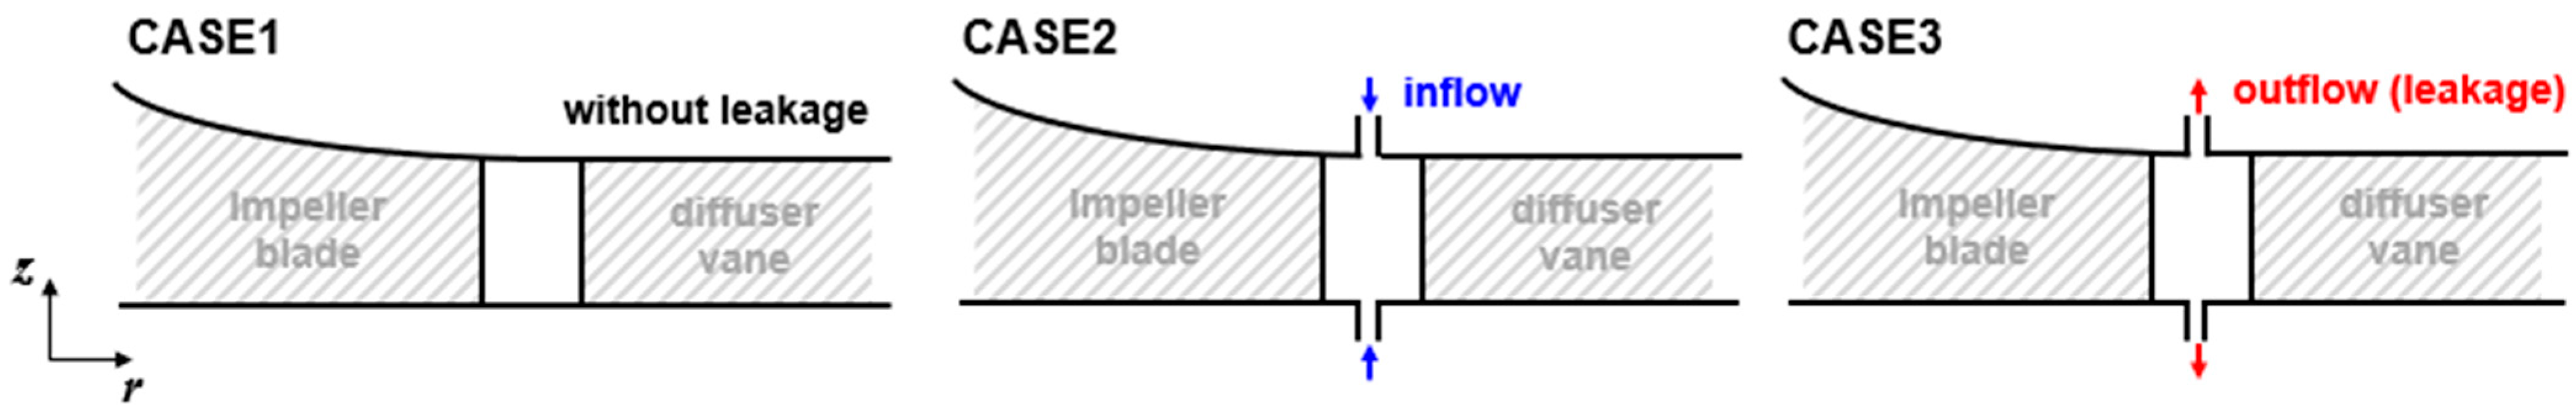
To analyze the influence of the flow through side gap, three cases were considered as shown in Figure 2. First, a domain consisting solely of the impeller and diffuser without gap was defined as CASE1. In the experimental setup of Si et al. [25], the external fluid moves inside through the impeller–diffuser gap due to negative pressure inside the pump. To simulate this phenomenon, the leakage flow rate from Equation (3) was imposed as an inlet condition at the simplified gap region, which was defined as CASE2. The simulation results were compared with experimental data for performance curves and flow characteristics to validate the numerical method. Finally, CASE3 set the leakage flow rate obtained by Equation (1) as an outlet condition, representing typical leakage flow direction through the impeller–diffuser side gap.

Figure 2.
Tested cases for flow configurations through impeller–diffuser side gap.
3. Numerical Methods
The three-dimensional flow field and hydraulic performance of the centrifugal pump were analyzed using ANSYS CFX-15.0 [27]. Numerical analysis was performed using the element-based finite volume method, where the spatial domain was discretized using meshes and all fluid properties were stored at the mesh vertices. The mass and momentum equations are expressed as follows:
Here, ui, ρ, p, μ, and μt are the ensemble-averaged velocity component, density, pressure, and the absolute and turbulent viscosities, respectively.
A second-order accurate high-resolution scheme [28] was employed to discretize the convective terms of the governing equations. The k-ω shear stress transport (SST) two-equation turbulence model [29] was adopted as the turbulence closure model. The k-ω SST model applies to the k-ω model near walls and the k-ε model in the bulk flow, blending the two using a blending function to calculate the turbulent eddy viscosity. This model is known to be more effective than other two-equation turbulence models in predicting flow separation under adverse pressure gradients [30].
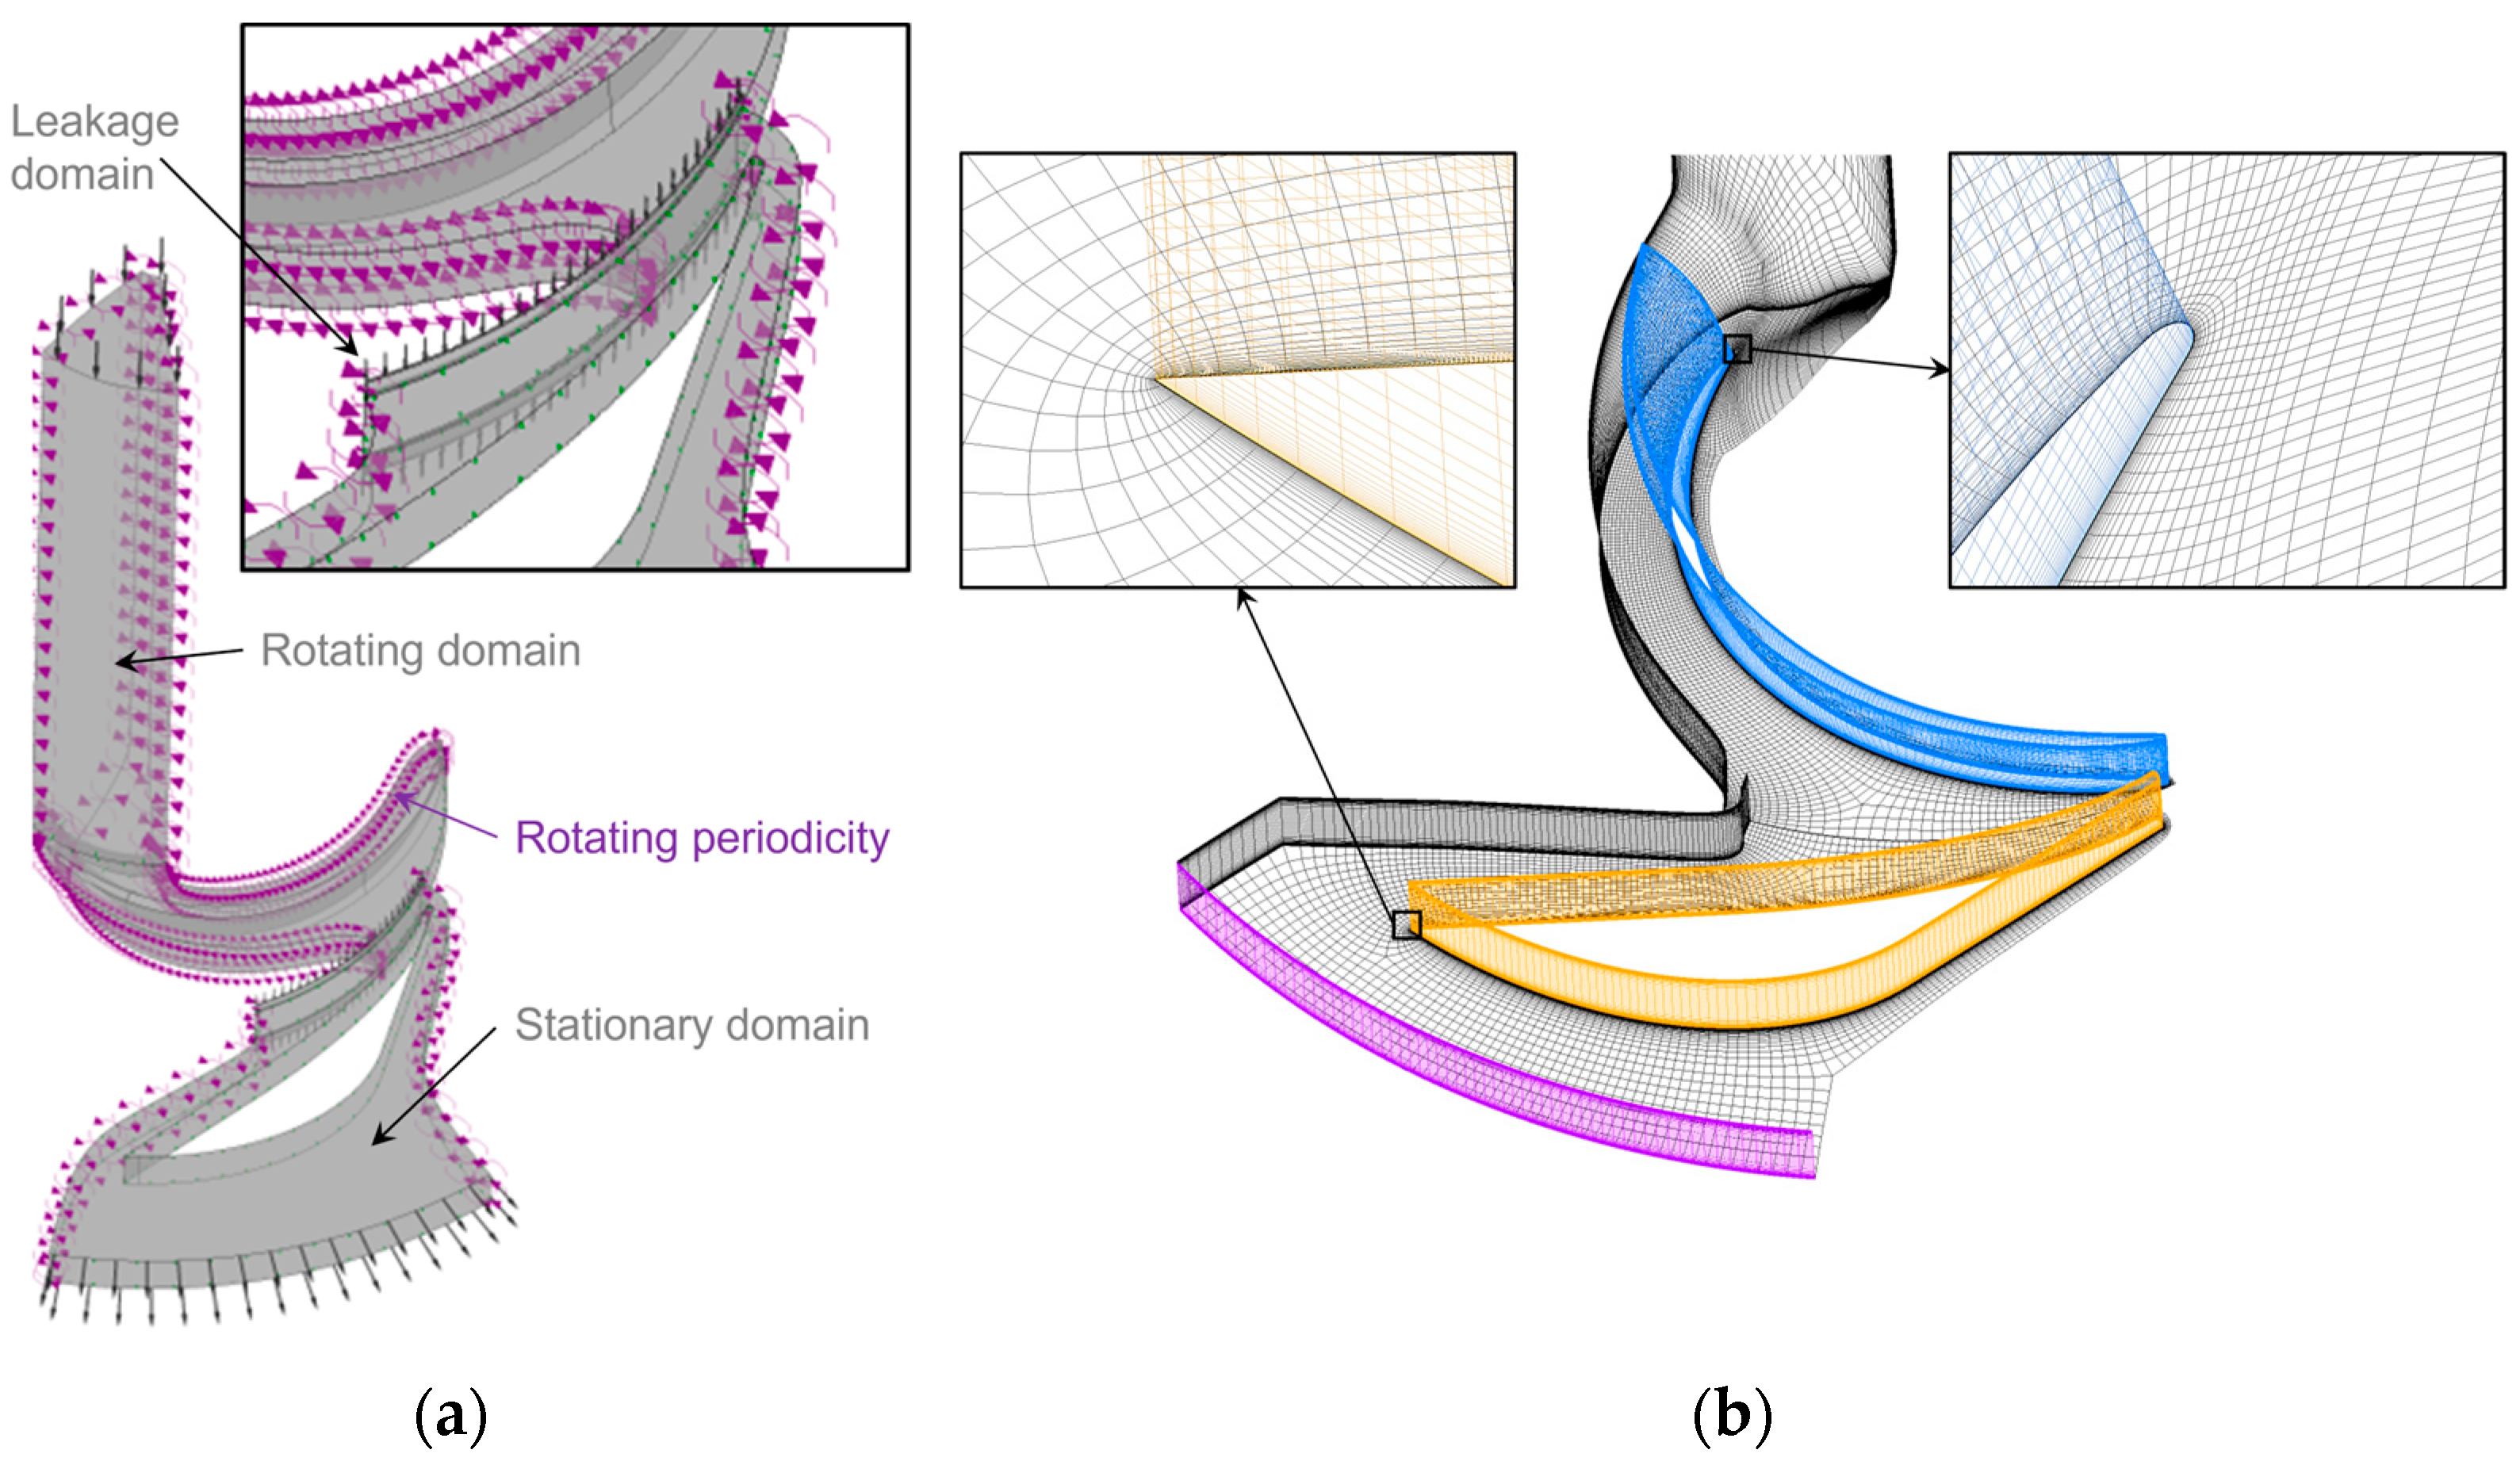
Figure 3a shows an example of the computational domain, boundary conditions, and grid system. The computational domain consisted of a 1/7 section of the inlet pipe, the impeller, and a 1/8 section of the vaned diffuser. Si et al. [25] conducted experiments to analyze the internal flow structure of centrifugal pumps by applying hydrodynamic similarity using air as the working fluid. The same conditions were adopted in this study. The working fluid was an air at 20 °C and the impeller rotated at 1710 rpm. Mass flow and static pressure were applied as boundary conditions at the inlet and outlet, respectively, while no-slip conditions were applied at the solid walls. The stage model, which circumferentially averages rotor outlet flow to transfer properties, was applied at the rotor–stator interface. Additionally, as shown in the figure, a simplified annular domain with 1 mm of radial clearance was used as the side gap passage and the leakage flow rate obtained from the loss model was imposed as a boundary condition at the end of the passage.
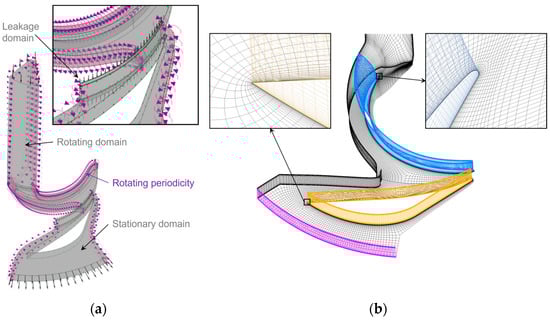
Figure 3.
Examples of (a) computational domain and (b) grid system.
Figure 3b illustrates an example of the grid system used in this study. The inlet pipe, impeller, and diffuser regions were discretized with hexahedral meshes and the first grid point near the solid wall was maintained at a y+ value between 20 and 200. To estimate discretization errors, the grid convergence index (GCI) [31] was analyzed based on Richardson extrapolation. Table 2 presents the calculated discretization errors for the efficiency and pressure recovery coefficient of CASE1 at ϕ/ϕd = 0.983 across three grid systems. As shown in Table 2, the Richardson extrapolation method used grid refinement factors of 1.3. The calculated values for the head coefficient and diffuser loss coefficient showed monotonic convergence as the number of cells increased. The extrapolated relative errors for the head coefficient and diffuser loss coefficient were 0.296% and 0.548%, respectively, with numerical uncertainties of 0.368% and 0.689%, indicating very small values. Based on these results, the N1 grid system was selected for further simulations.
Table 2.
Grid uncertainty quantification by grid convergence index (GCI).
The convergence criteria were defined as residual values of all governing equations below 10−4, mass and momentum imbalances within 0.01%, and performance function variations under 0.1% per 100 iterations. For the severe low-flow conditions, a moderate convergence criterion was applied, with a mass imbalance value under 0.5%. Steady-state simulation was performed with 1/ω of physical time-step corresponding to 0.00562 s. Parallel computations were executed with a workstation equipped with an Intel Xeon Platinum 8562Y + 2.80 GHz CPU and with data transfer performed using a local parallel method subdivided into 40 tasks. The times required to obtain an operating point and performance curve were approximately 40 min and 5.3 h, respectively.
4. Performance Parameters
To quantitatively evaluate the hydraulic performance of the centrifugal pump, this study selected the head coefficient (ψ) and hydraulic efficiency (η). Leakage flow in the gap between the impeller and diffuser was expected to significantly affect the performance of the vane diffuser. For a quantitative analysis of the diffuser performance, the diffuser pressure recovery coefficient (Cp,d) and diffuser loss coefficient (ζ) were introduced in this work. Marsan et al. [32] indicated that a positive CP,d slope can be an successful indicator for the prediction of the diffuser’s unstable flow. Similarly, Deniz et al. [33] observed that the highest Cp,d for the diffuser is achieved just before the onset of rotating stall. Sano et al. [34] also used these parameters to investigate the relationship between the diffuser performance curve and onset of rotating stall inside the pump. The performance parameters are defined as follows:
where p, pT, Q, T, and ω represent static pressure, total pressure, flow rate, torque, and angular velocity, respectively. The subscripts 3 and 4 correspond to the diffuser inlet and diffuser outlet, respectively.
5. Results and Discussion
5.1. Validation
To validate the numerical method set in this work, the calculated results for CASE1 and CASE2 were compared with experimental data. As mentioned in Section 3, the detailed geometry of the impeller–diffuser gap was not provided, so assumptions for the clearance were required. Accordingly, the radial clearances on the shroud and hub sides were initially assumed to be 0.5 mm, 1.0 mm, and 1.5 mm. The leakage flow rate was calculated using these values by substituting the Y value of Equation (1). Additionally, D0 in the original equation was replaced with D3 because leakage flow occurred in the interface between the impeller and diffuser in the case of this work. Finally, the obtained values were used as inputs for the inlet conditions.
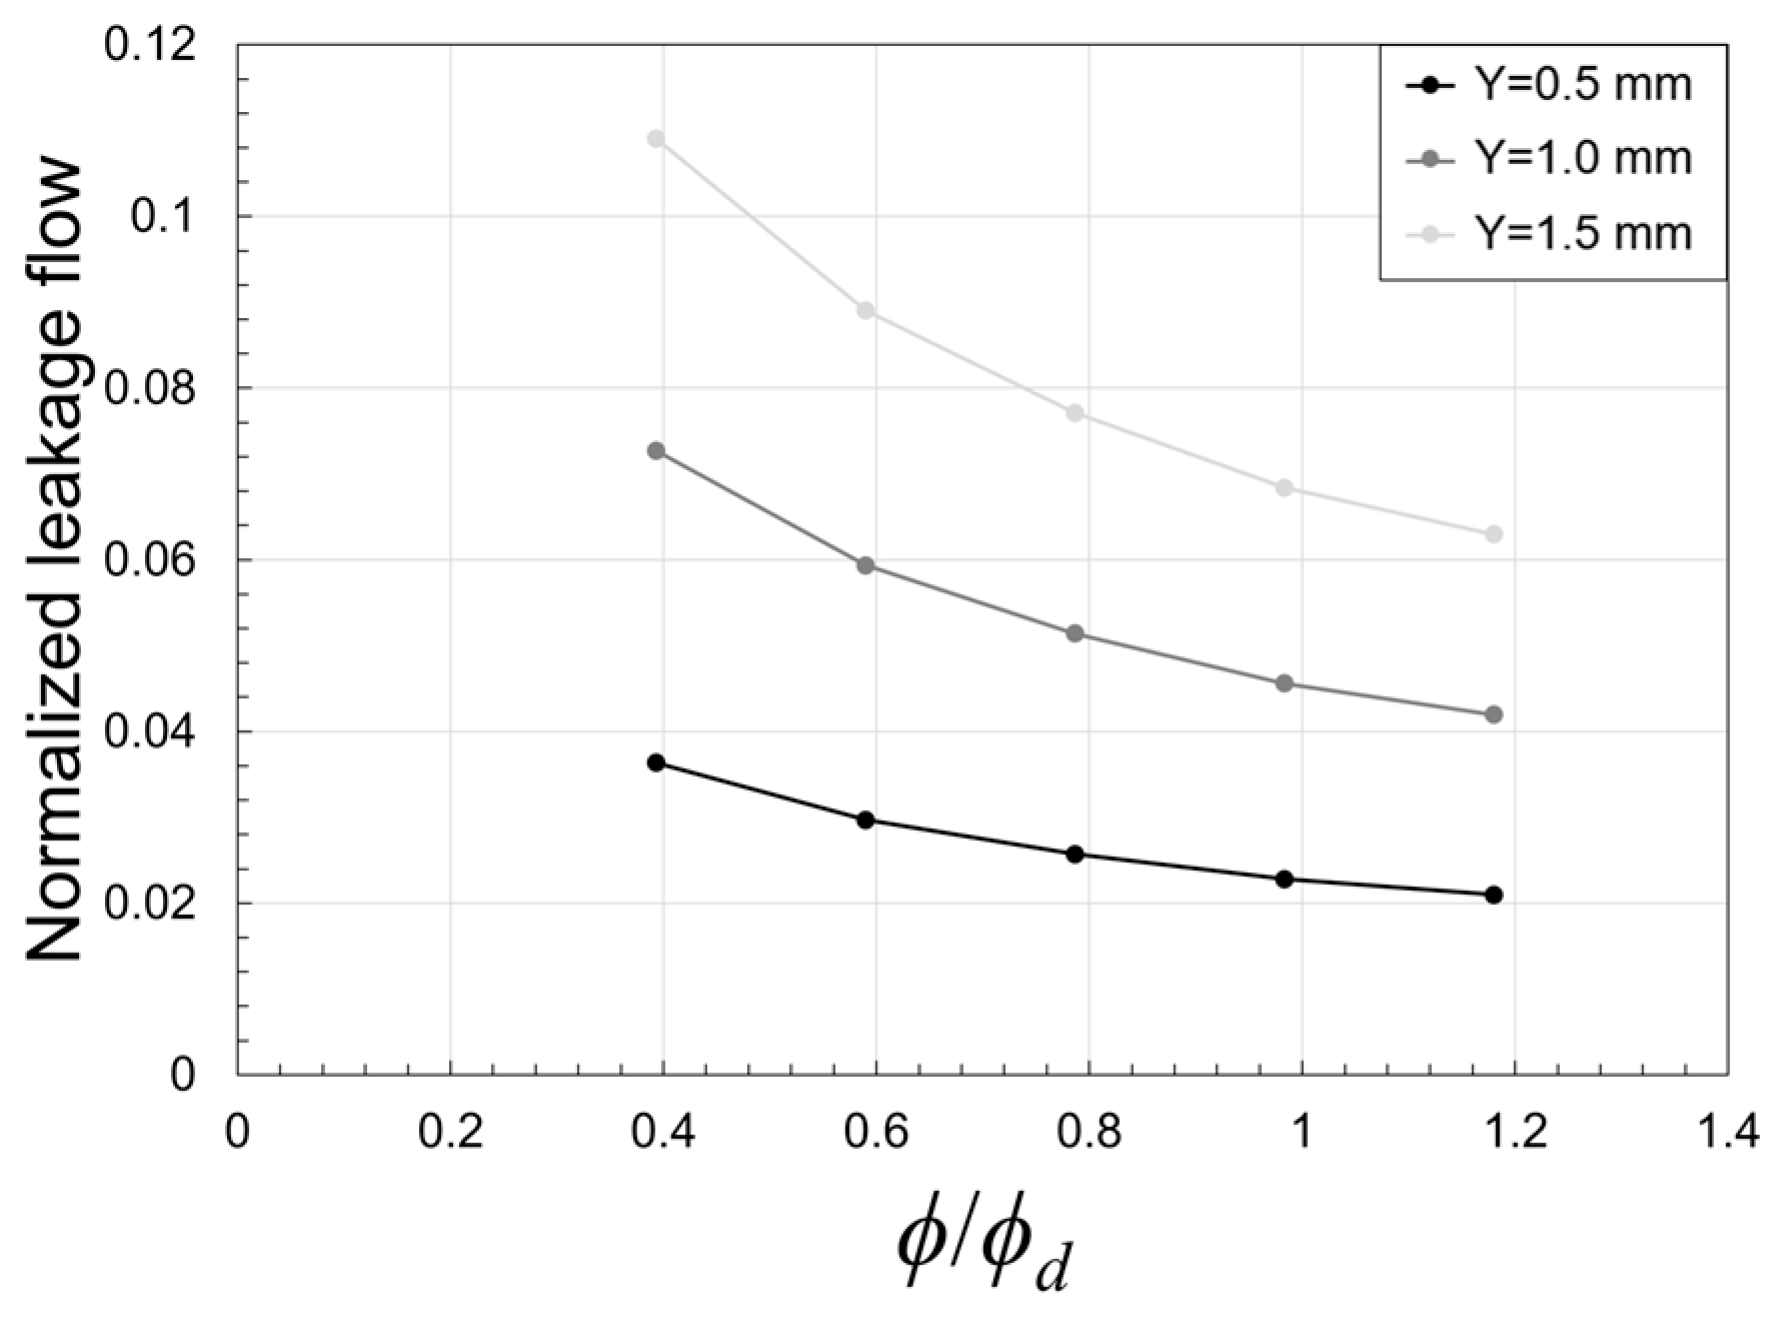
Figure 4 illustrates the normalized flow rate calculated using Liu’s equation [26] for different clearances. The results for the three different gaps show a consistent trend: the normalized leakage flow increases as the total pump flow rate decreases. This phenomenon is mainly present since the rise of the pressure difference between the pump inlet and outlet promotes leakage flow at low flow rates. Furthermore, the result shows that the leakage flow increases with larger clearances. This is likely due to reduced flow resistance caused by the larger annular cross-sectional area. Indeed, Si et al. [25] also showed that the leakage flow rate predicted by a simple geometry increases as the pump flow rate decreases. Therefore, our assumption is suitable for the prediction of the leakage flow in the impeller–diffuser gap.

Figure 4.
Variations of normalized leakage flow values with various clearances.
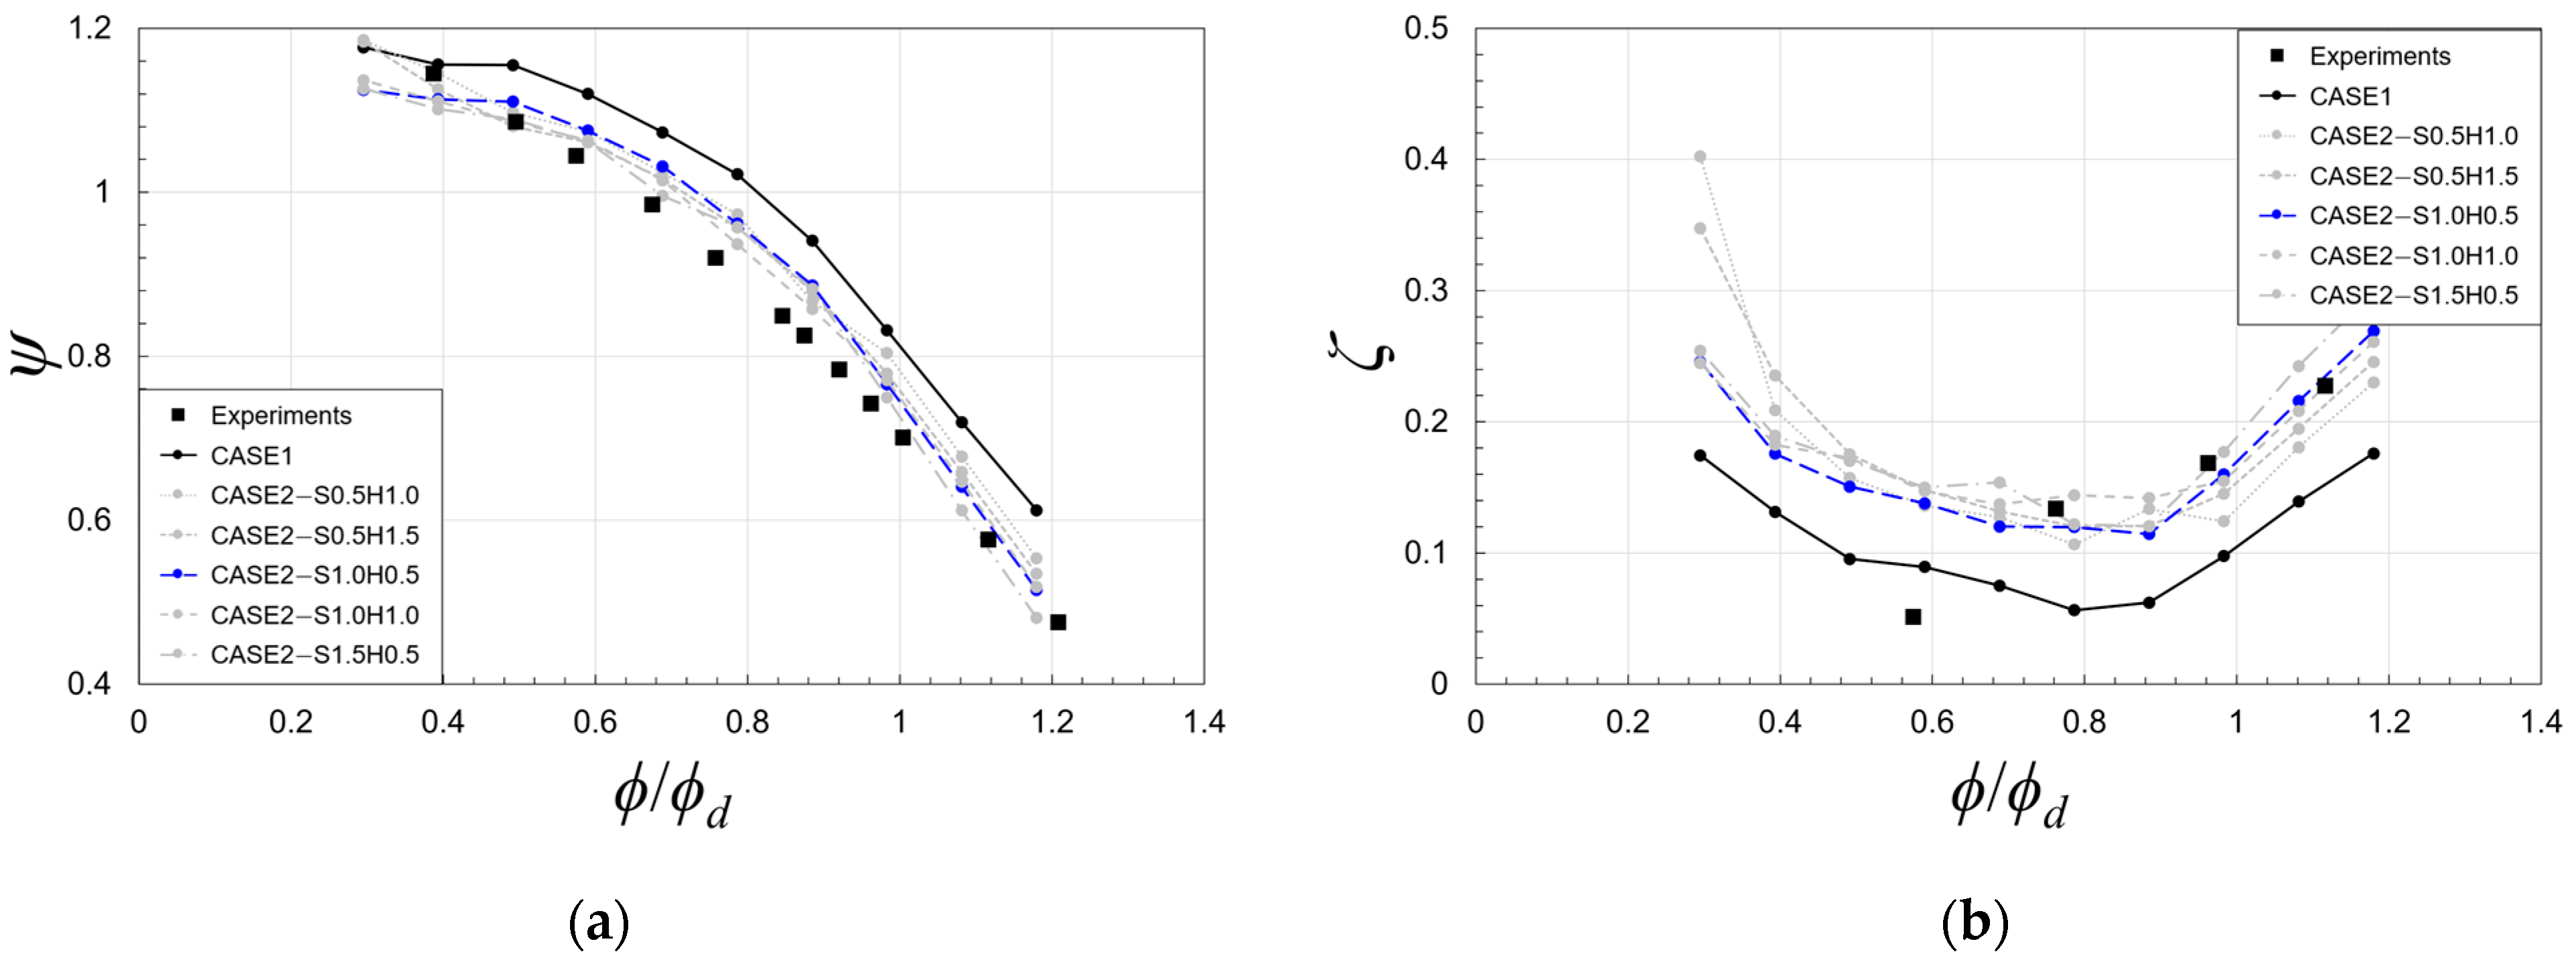
Figure 5 compares the normalized flow rate versus head coefficient (ϕ/ϕd−ψ) and diffuser loss coefficient (ϕ/ϕd−ζ) curves for CASE1 and CASE2. For the ϕ/ϕd−ψ curve, CASE1 highly overestimates ψ values compared to the experimental data. Meanwhile, the predicted ψ values of CASE2 models align more closely with the experimental data. It is seen that the predictions of CASE2−S1.0H0.5 show reasonable agreements with the experimental data, especially at ϕ/ϕd > 0.9. Similarly, for the ϕ/ϕd−ζ curve, while CASE1 underestimates ζ values compared to the experimental data, PCASE2 models provide closely matched predictions for both the quantitative values and qualitative trends. As with the ϕ/ϕd−ψ curve, CASE2−S1.0H0.5 demonstrates the best agreement to the experimental results. These findings suggest that inflow modeling with proper clearance can contribute to improving the accuracy of performance curve predictions.
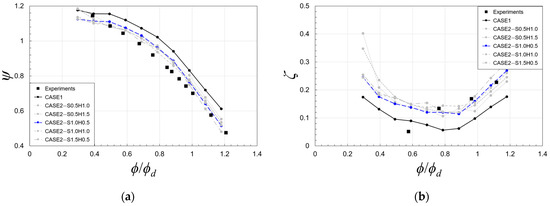
Figure 5.
Validation of performance curves of CASE 1 and CASE2 for different clearances [25]: (a) ϕ/ϕd−ψ, and (b) ϕ/ϕd−ζ.
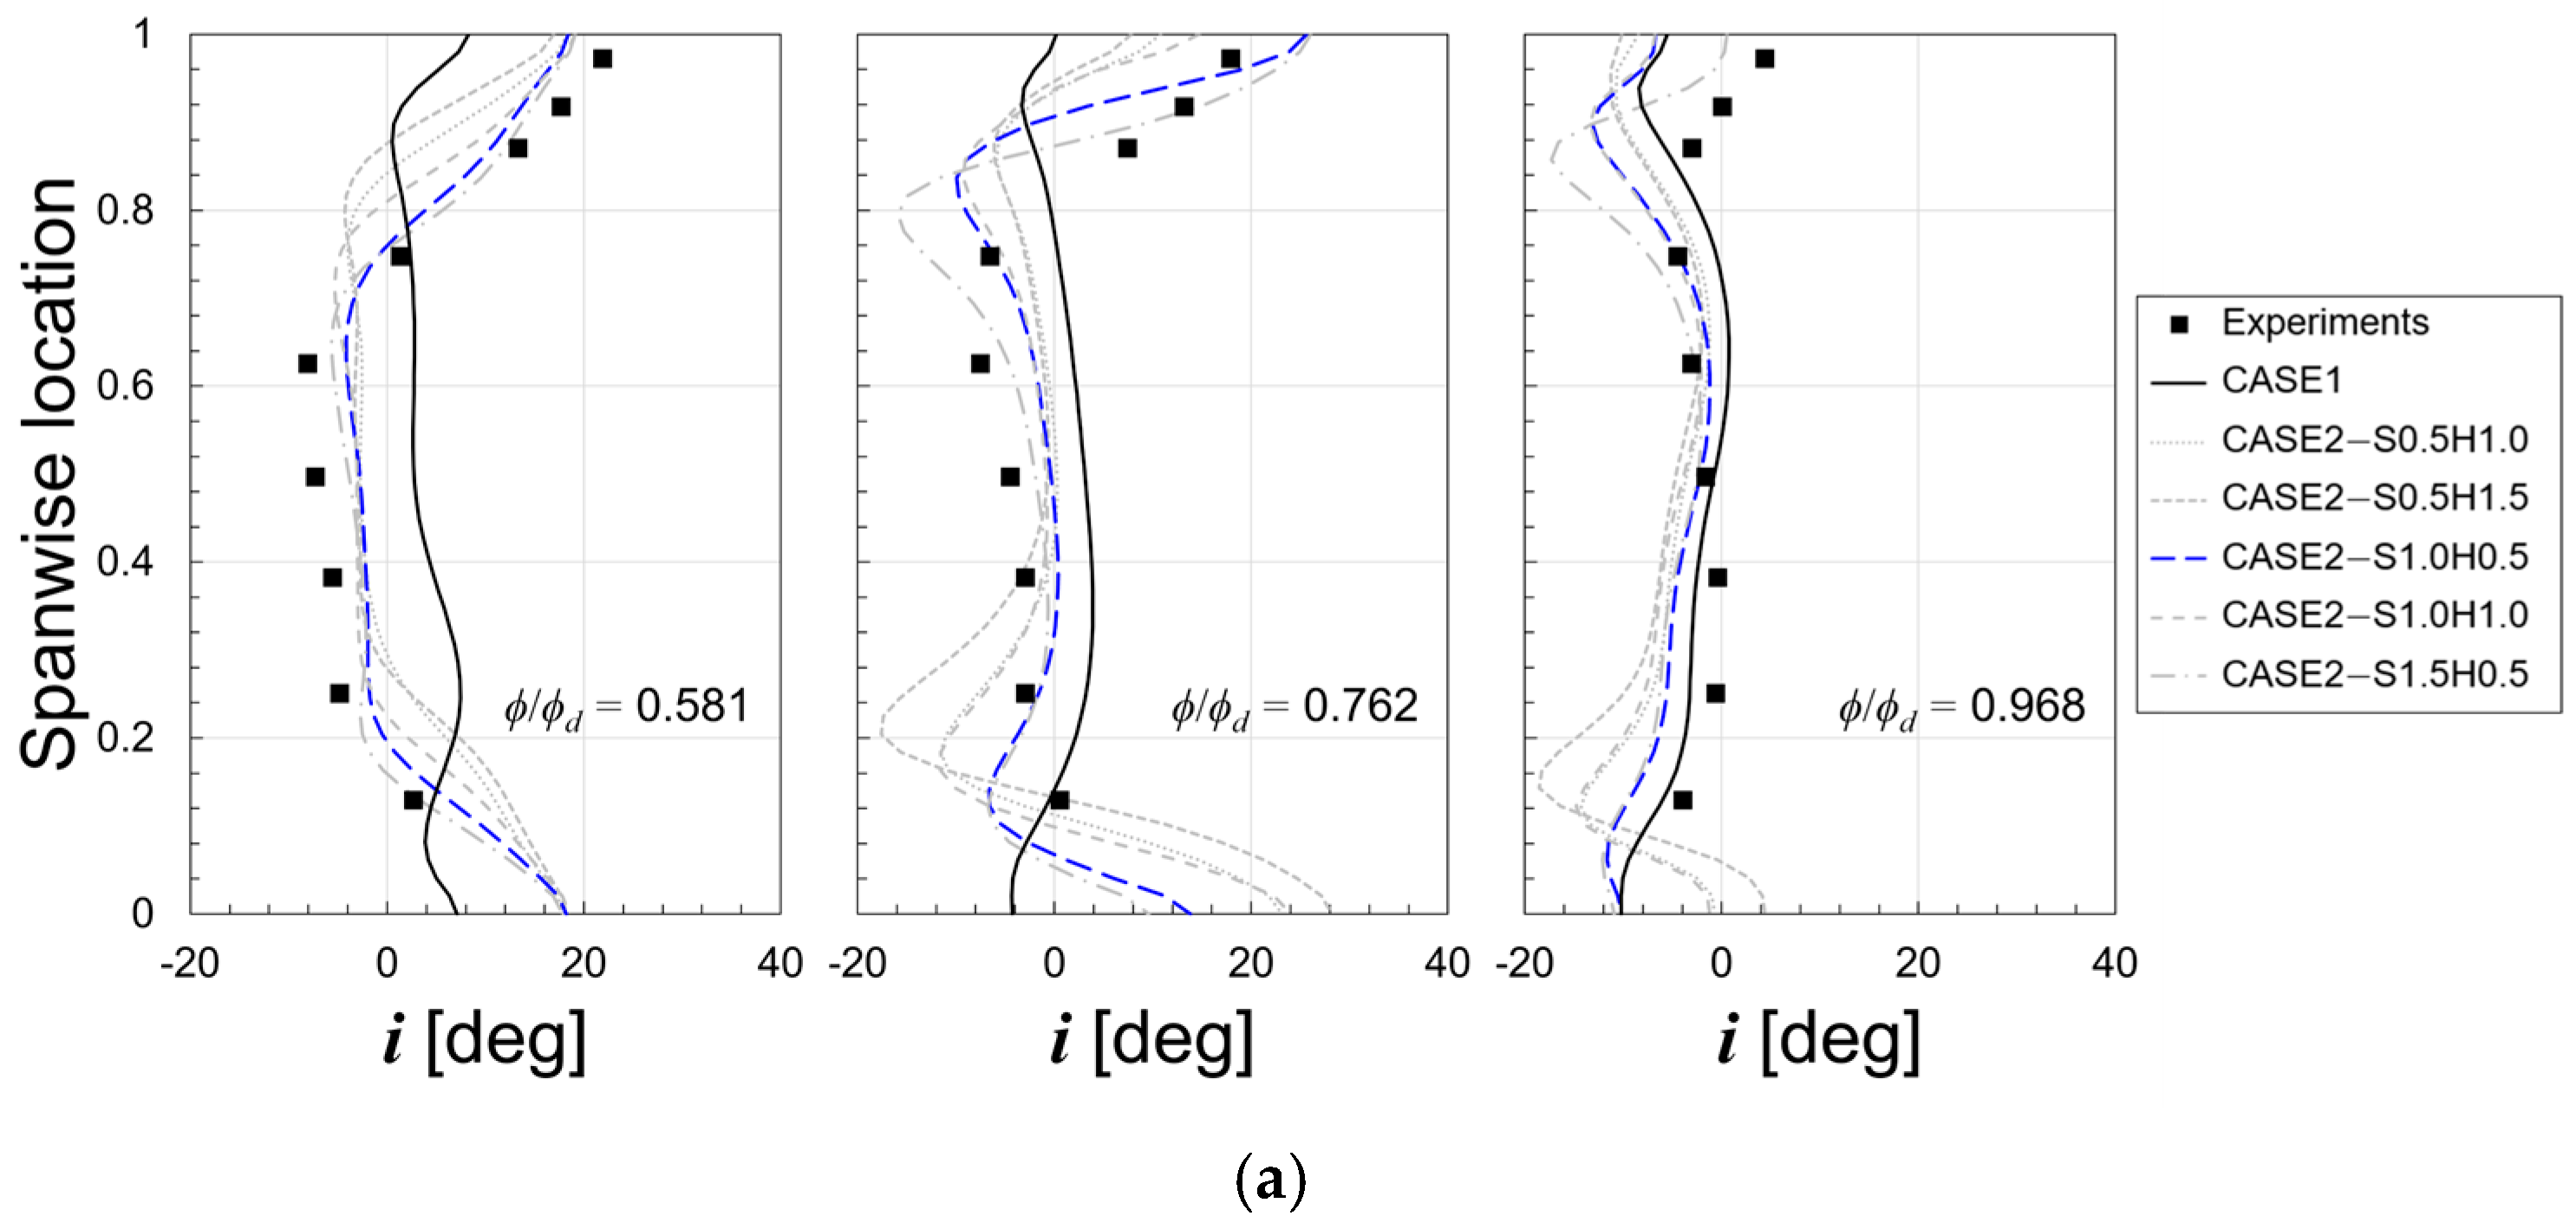
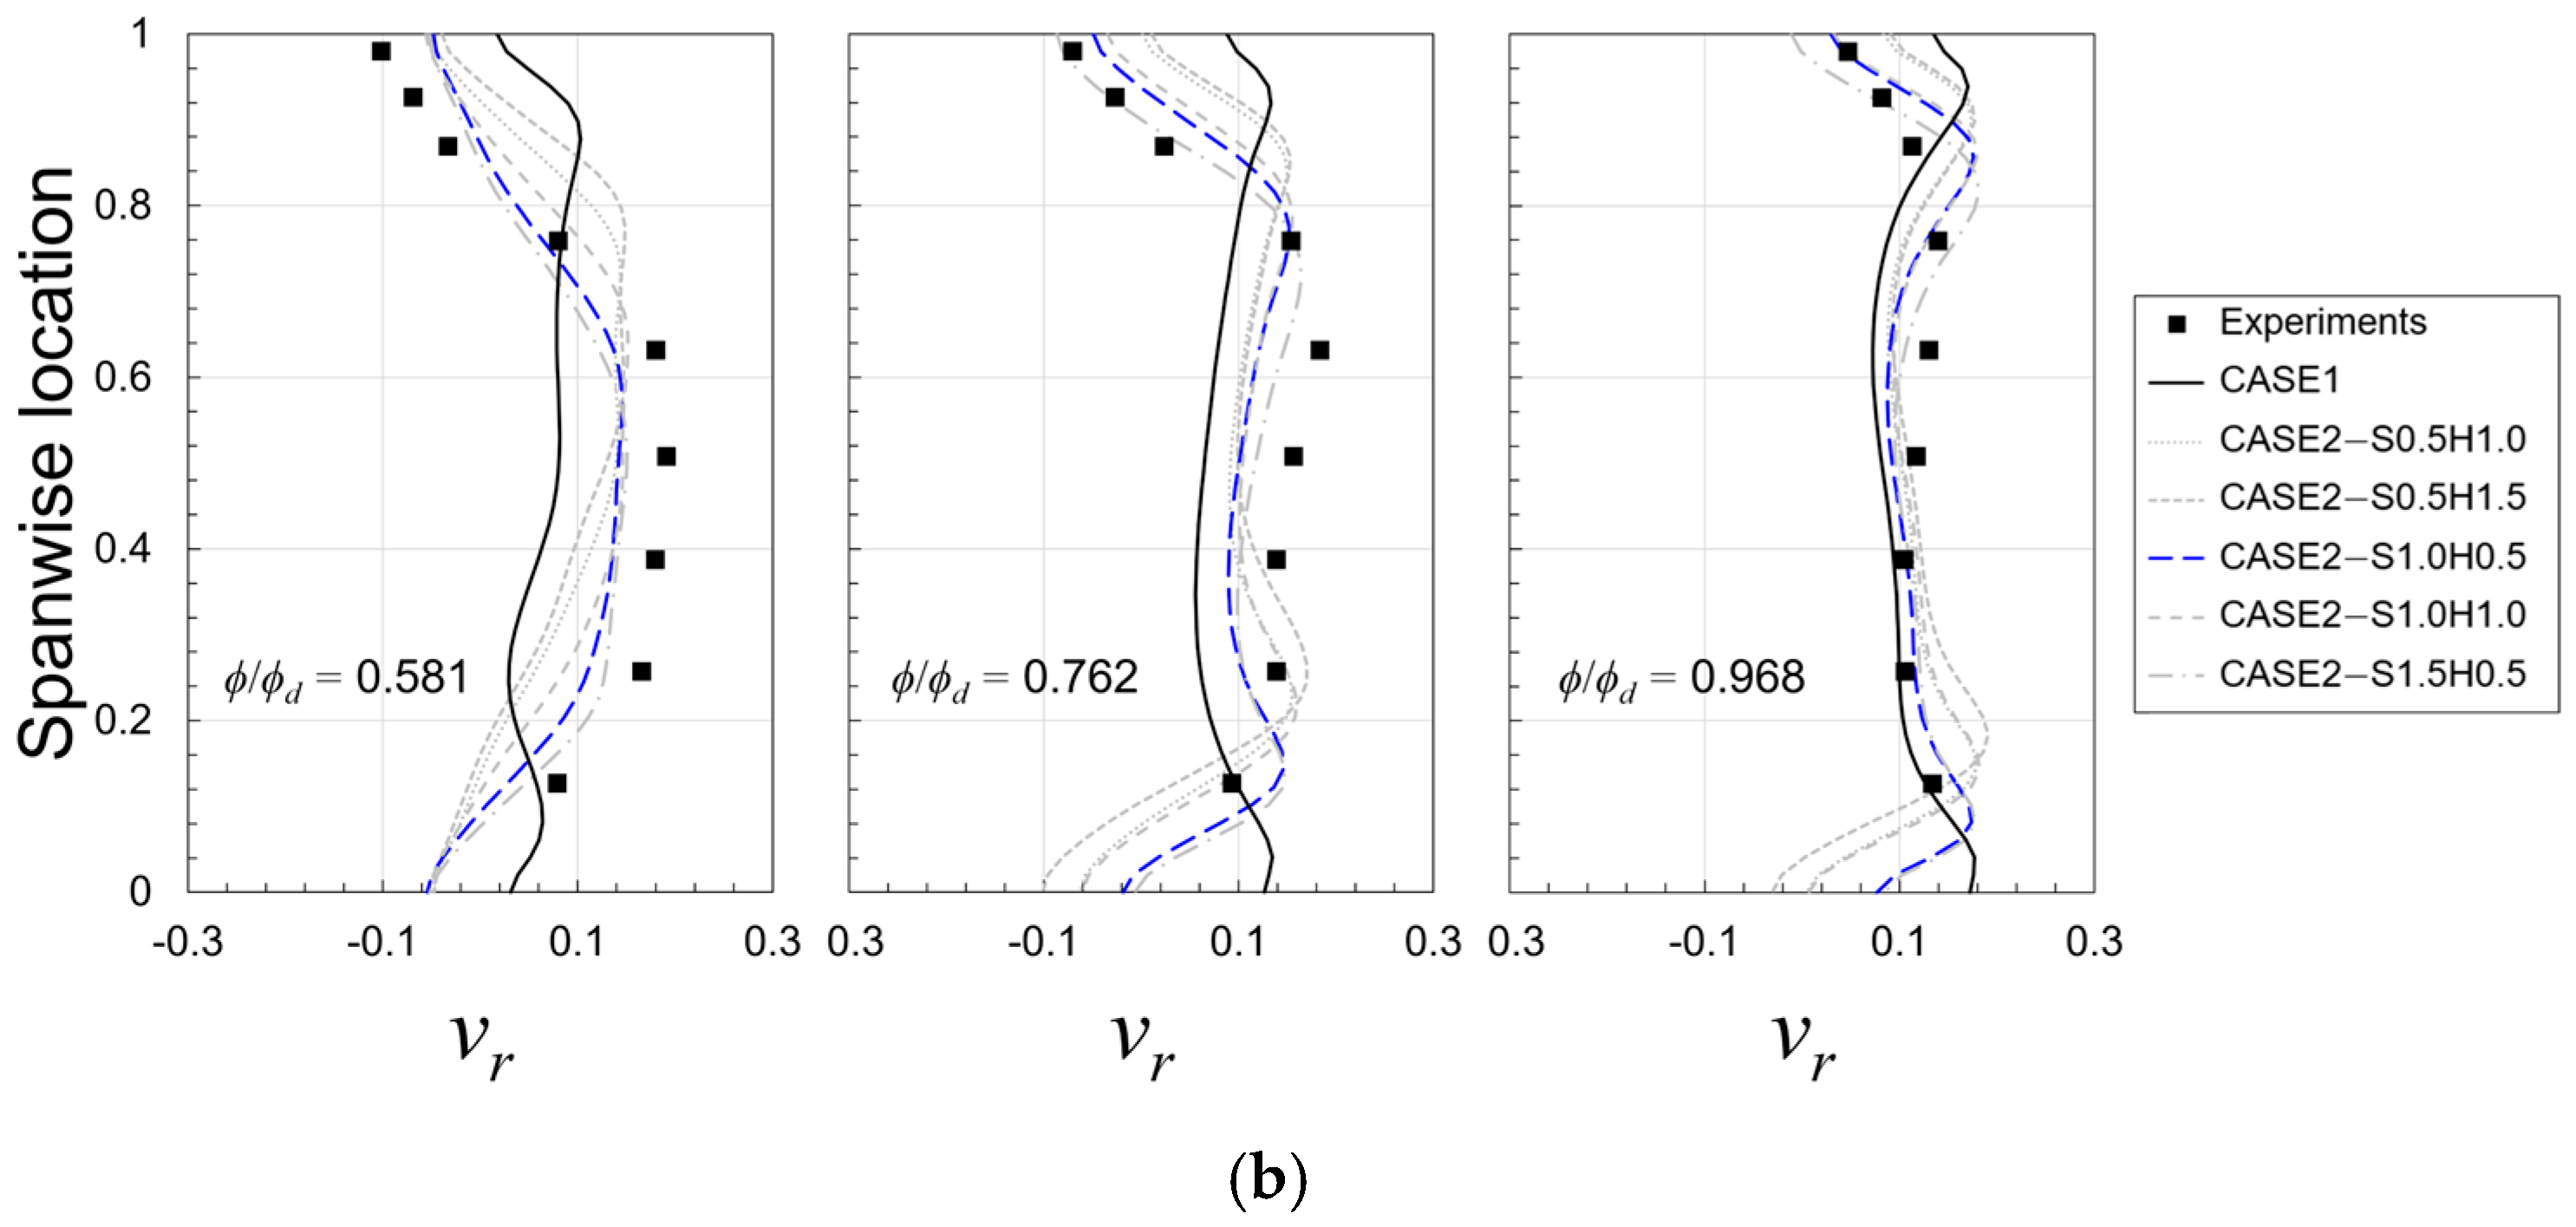
Figure 6 presents the pitch wise-averaged incidence angle and radial velocity distributions at the diffuser inlet (r/r2 = 1.04). According to Si et al. [25], the incidence angle increases and the radial velocity decreases at the diffuser inlet as the flow rate decreases. Consistent with these findings, the results of this study also show similar trends in incidence angles and radial velocity distributions. On the other hand, it is noted that CASE2 models accurately capture the velocity gradient near the shroud and hub regions, while CASE1 fails. Among the various clearance assumptions, CASE2−S1.0H0.5 provides the best accurate predictions for the incidence angle as well as the radial velocity distributions. According to these results, CASE2−S1.0H0.5 is the most appropriate model to validate the numerical results with experimental data.
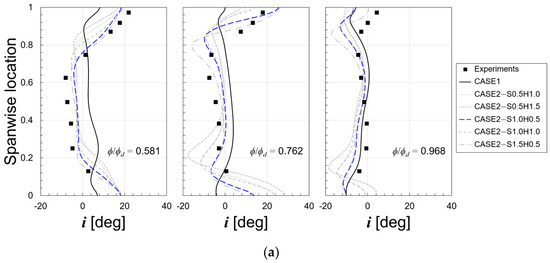
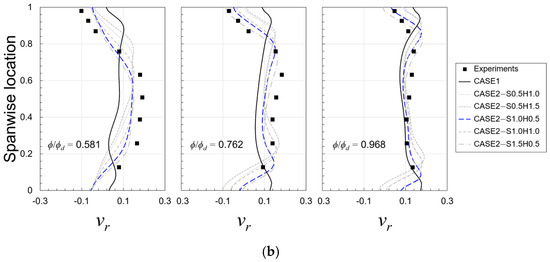
Figure 6.
Variations of velocity component profiles along spanwise location for CASE 1 and CASE2 with different clearances [25]: (a) incidence angle (i), and (b) normalized radial velocity (vr).
5.2. Effects of Flow Through Impeller–Diffuser Side Gap
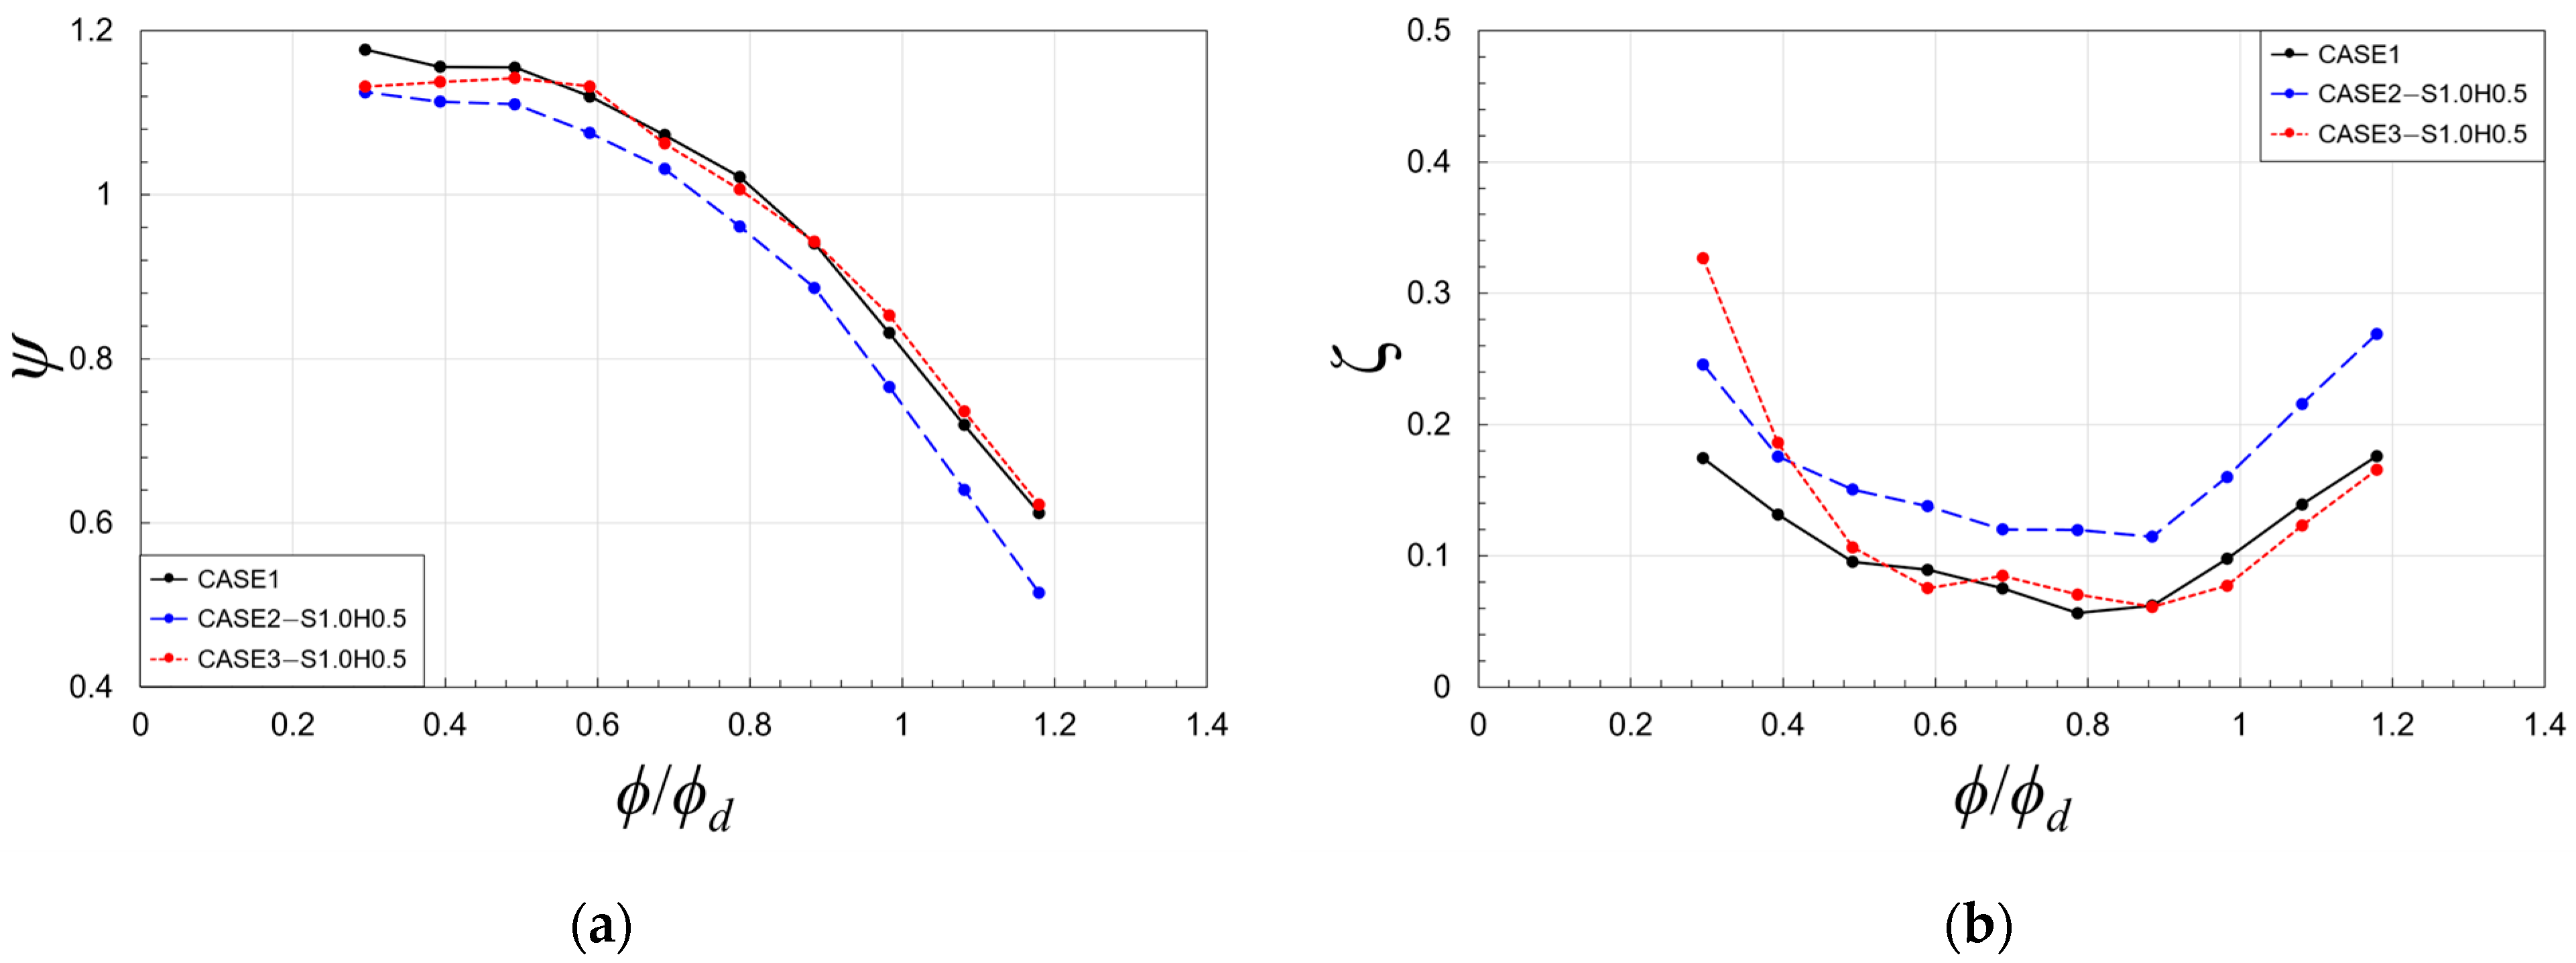
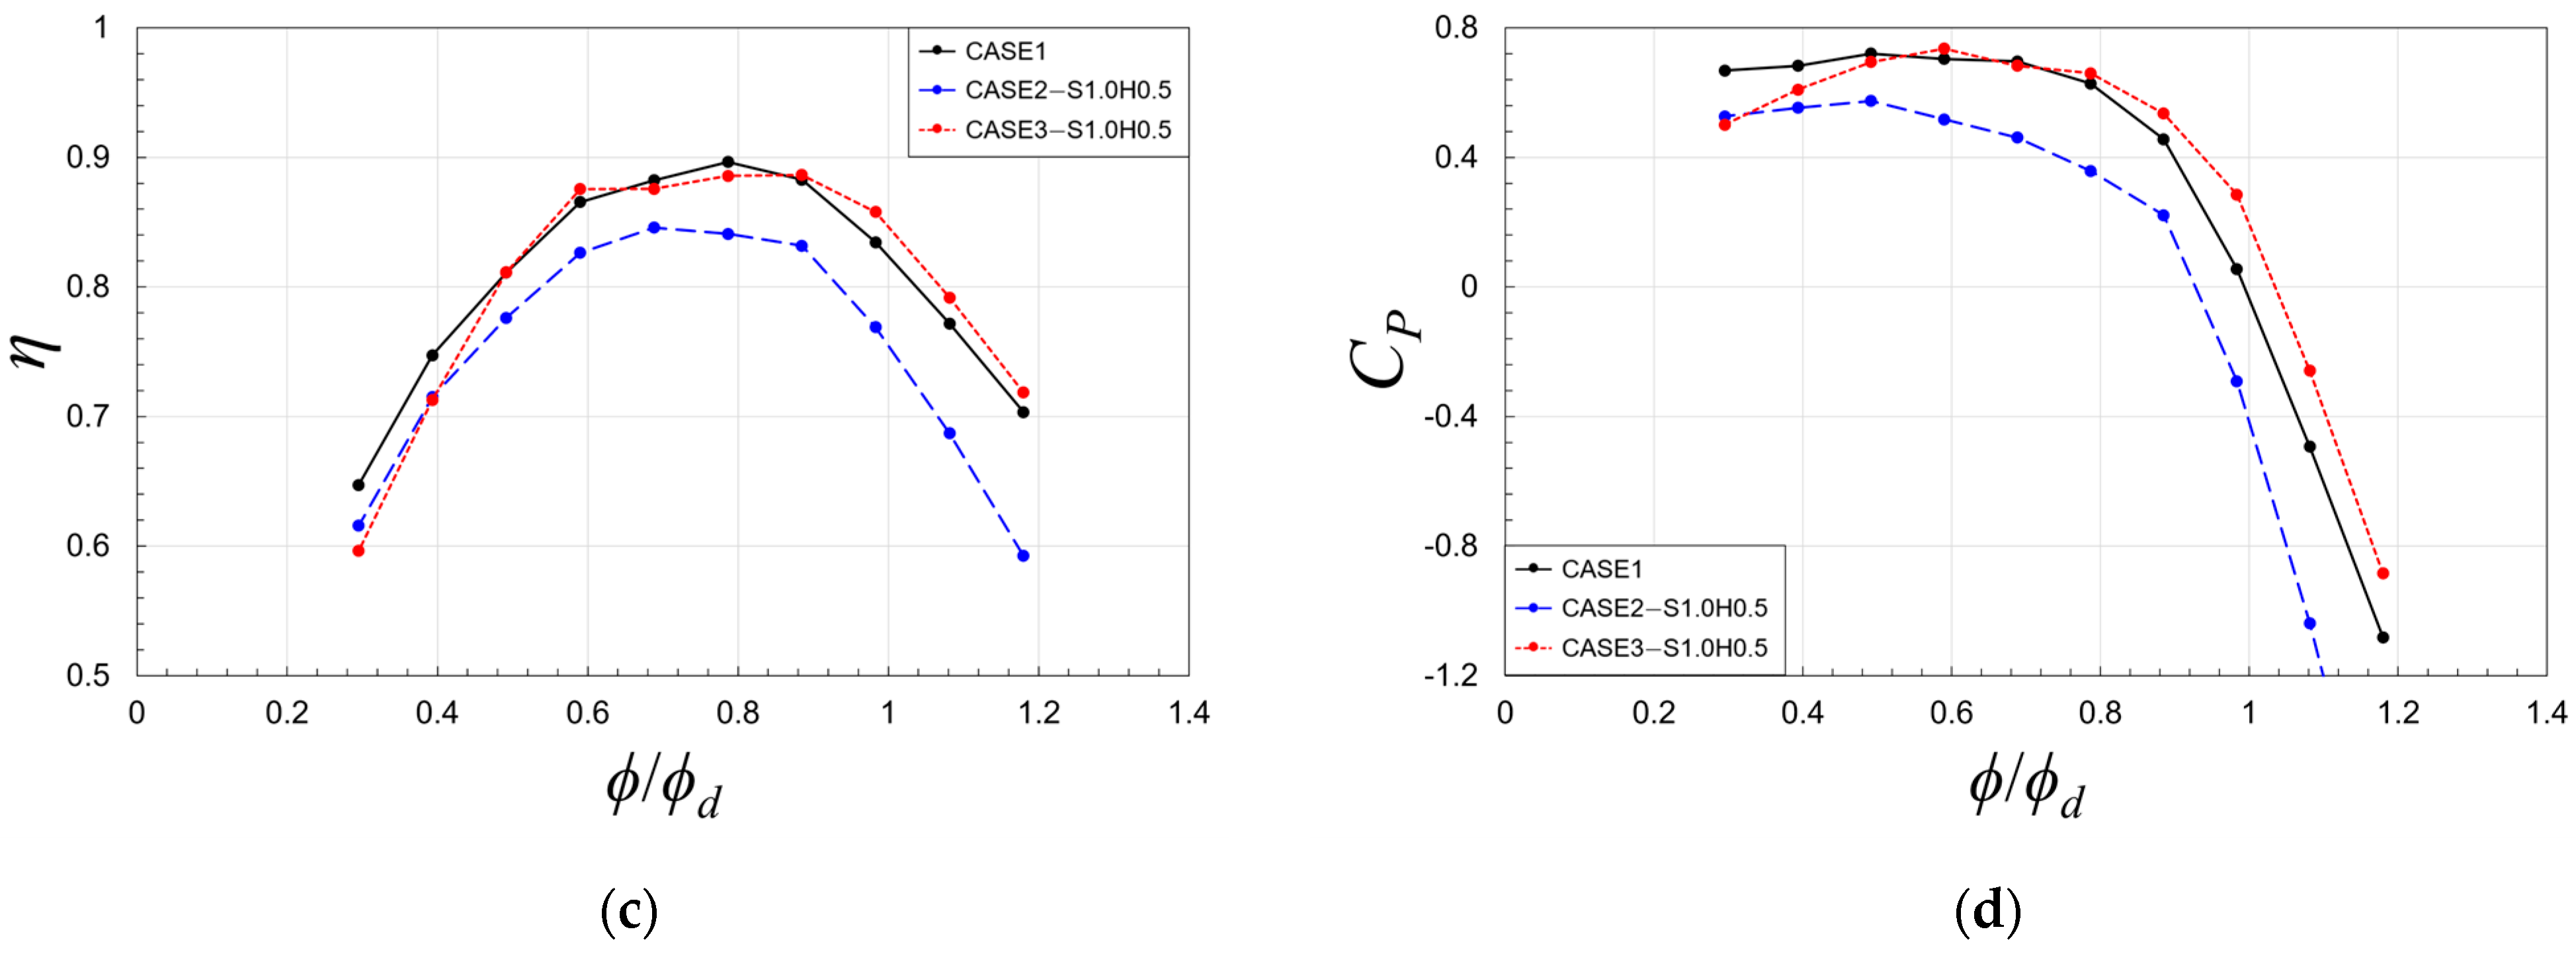
Adopting the previous results, CASE3 also assumed a clearance of 1.0 mm (shroud) −0.5 mm (hub) in this chapter and different impeller–diffuser side-gap flow configurations were investigated, as represented in Figure 4. Figure 7 compares the performance curves for different impeller–diffuser gap flow configurations (CASE1, CASE2, and CASE3). As shown in Figure 7a,b, CASE2 predicts lower ψ and higher ζ values than others in most ranges of ϕ/ϕd. This also leads to a decrease in η values, as depicted in Figure 7c. On the other hand, CASE1 and CASE3 exhibit similar qualitative trends and quantitative values for all the performance parameters, especially in ϕ/ϕd > 0.6. This suggests that the outflow through the impeller–diffuser side gap has a minimal impact on the overall performance in that region. However, CASE3 shows a sharp increase in ζ values in ϕ/ϕd < 0.6, resulting in a change in the sign of slope of ψ. Concurrently, η values in that region also decrease significantly.
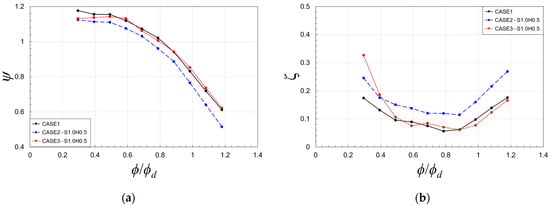
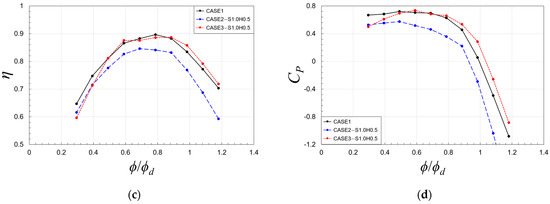
Figure 7.
Performance curves for various impeller–diffuser side-gap flow configurations (CASE1, CASE2 and CASE3): (a) ϕ/ϕd−ψ, (b) ϕ/ϕd−ζ, (c) ϕ/ϕd−η, and (d) ϕ/ϕd−Cp,d.
Figure 7d compares the ϕ/ϕd−Cp,d curves for different impeller–diffuser side-gap flow configurations. It is seen that CASE3 predicts Cp,d values similar with CASE1 for ϕ/ϕd > 0.6. Notably, the Cp,d value of CASE3 reaches its maximum at ϕ/ϕd = 0.6 and then decreases sharply as ϕ/ϕd < 0.6, with a positive slope of the curve. Sano et al. [34] noted that a positive slope in the ϕ/ϕd−Cp,d curve could serve as indirect evidence of the onset of the unstable flow, such as rotating stall within the diffuser. Similarly, Shim and Kim [35] reported that in centrifugal pumps equipped with volutes, flow instability in the low-frequency range begins to occur where the slope of the ϕ/ϕd−Cp,d curve becomes positive. These findings suggest that leakage flow through the impeller–diffuser gap may promote flow instability within the diffuser, limiting the operating range of the pump.
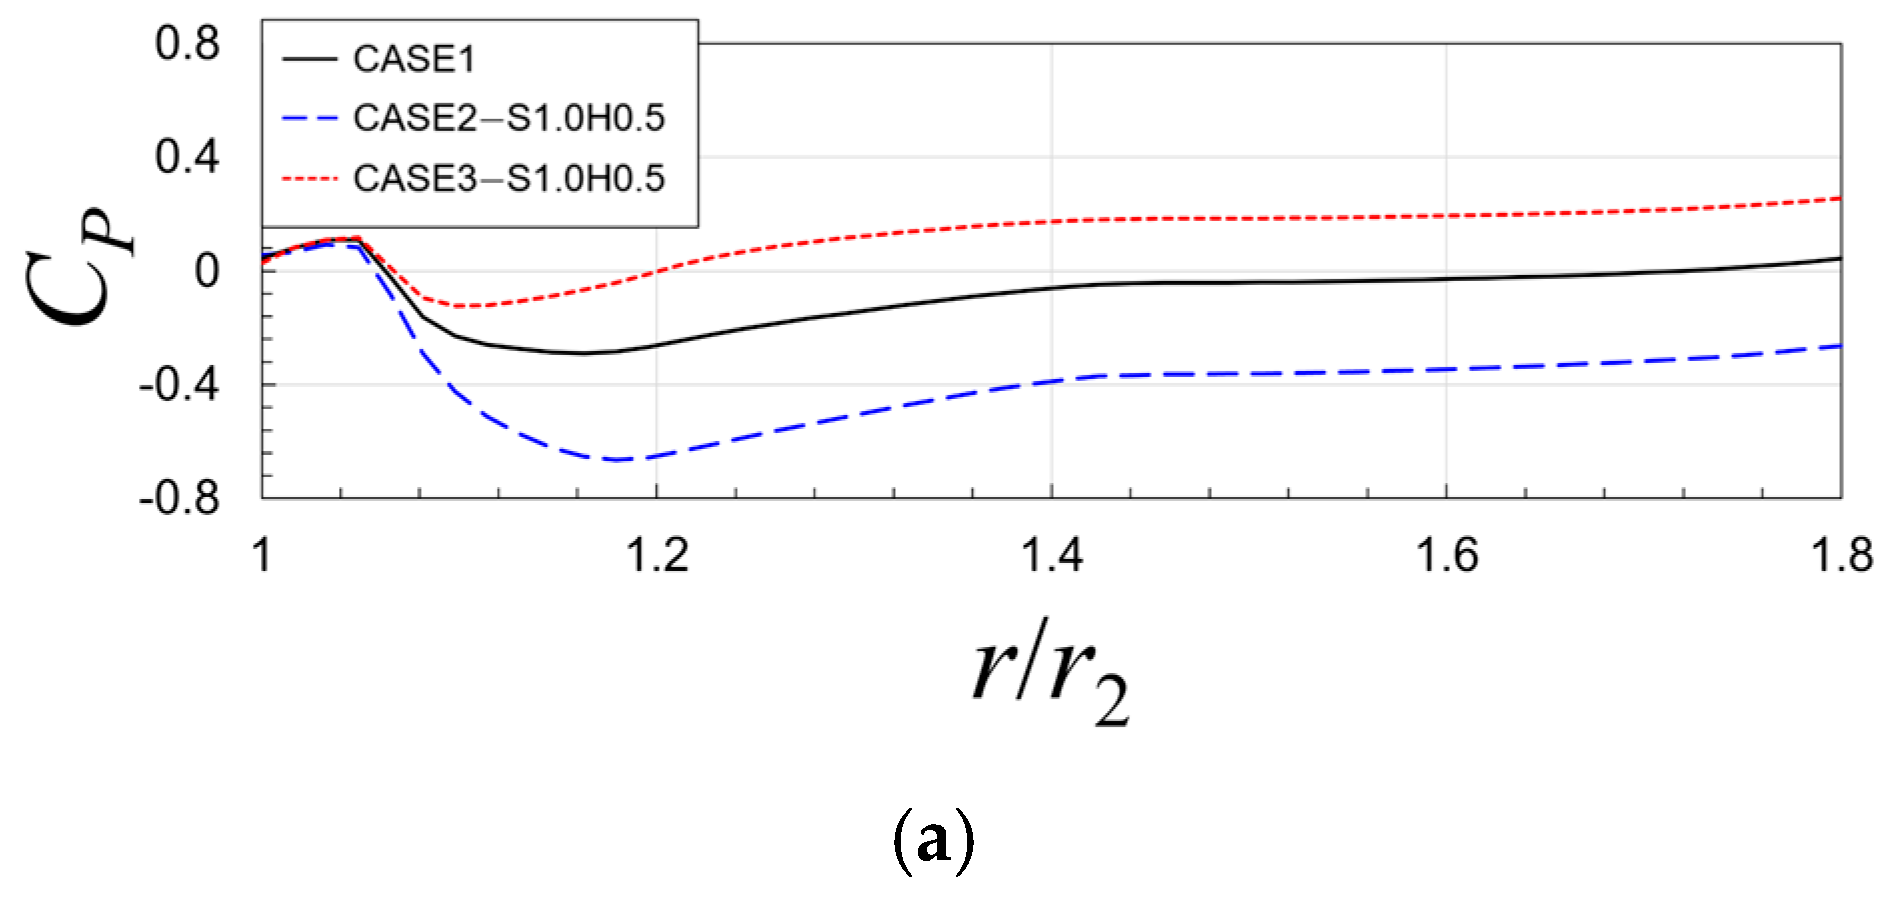
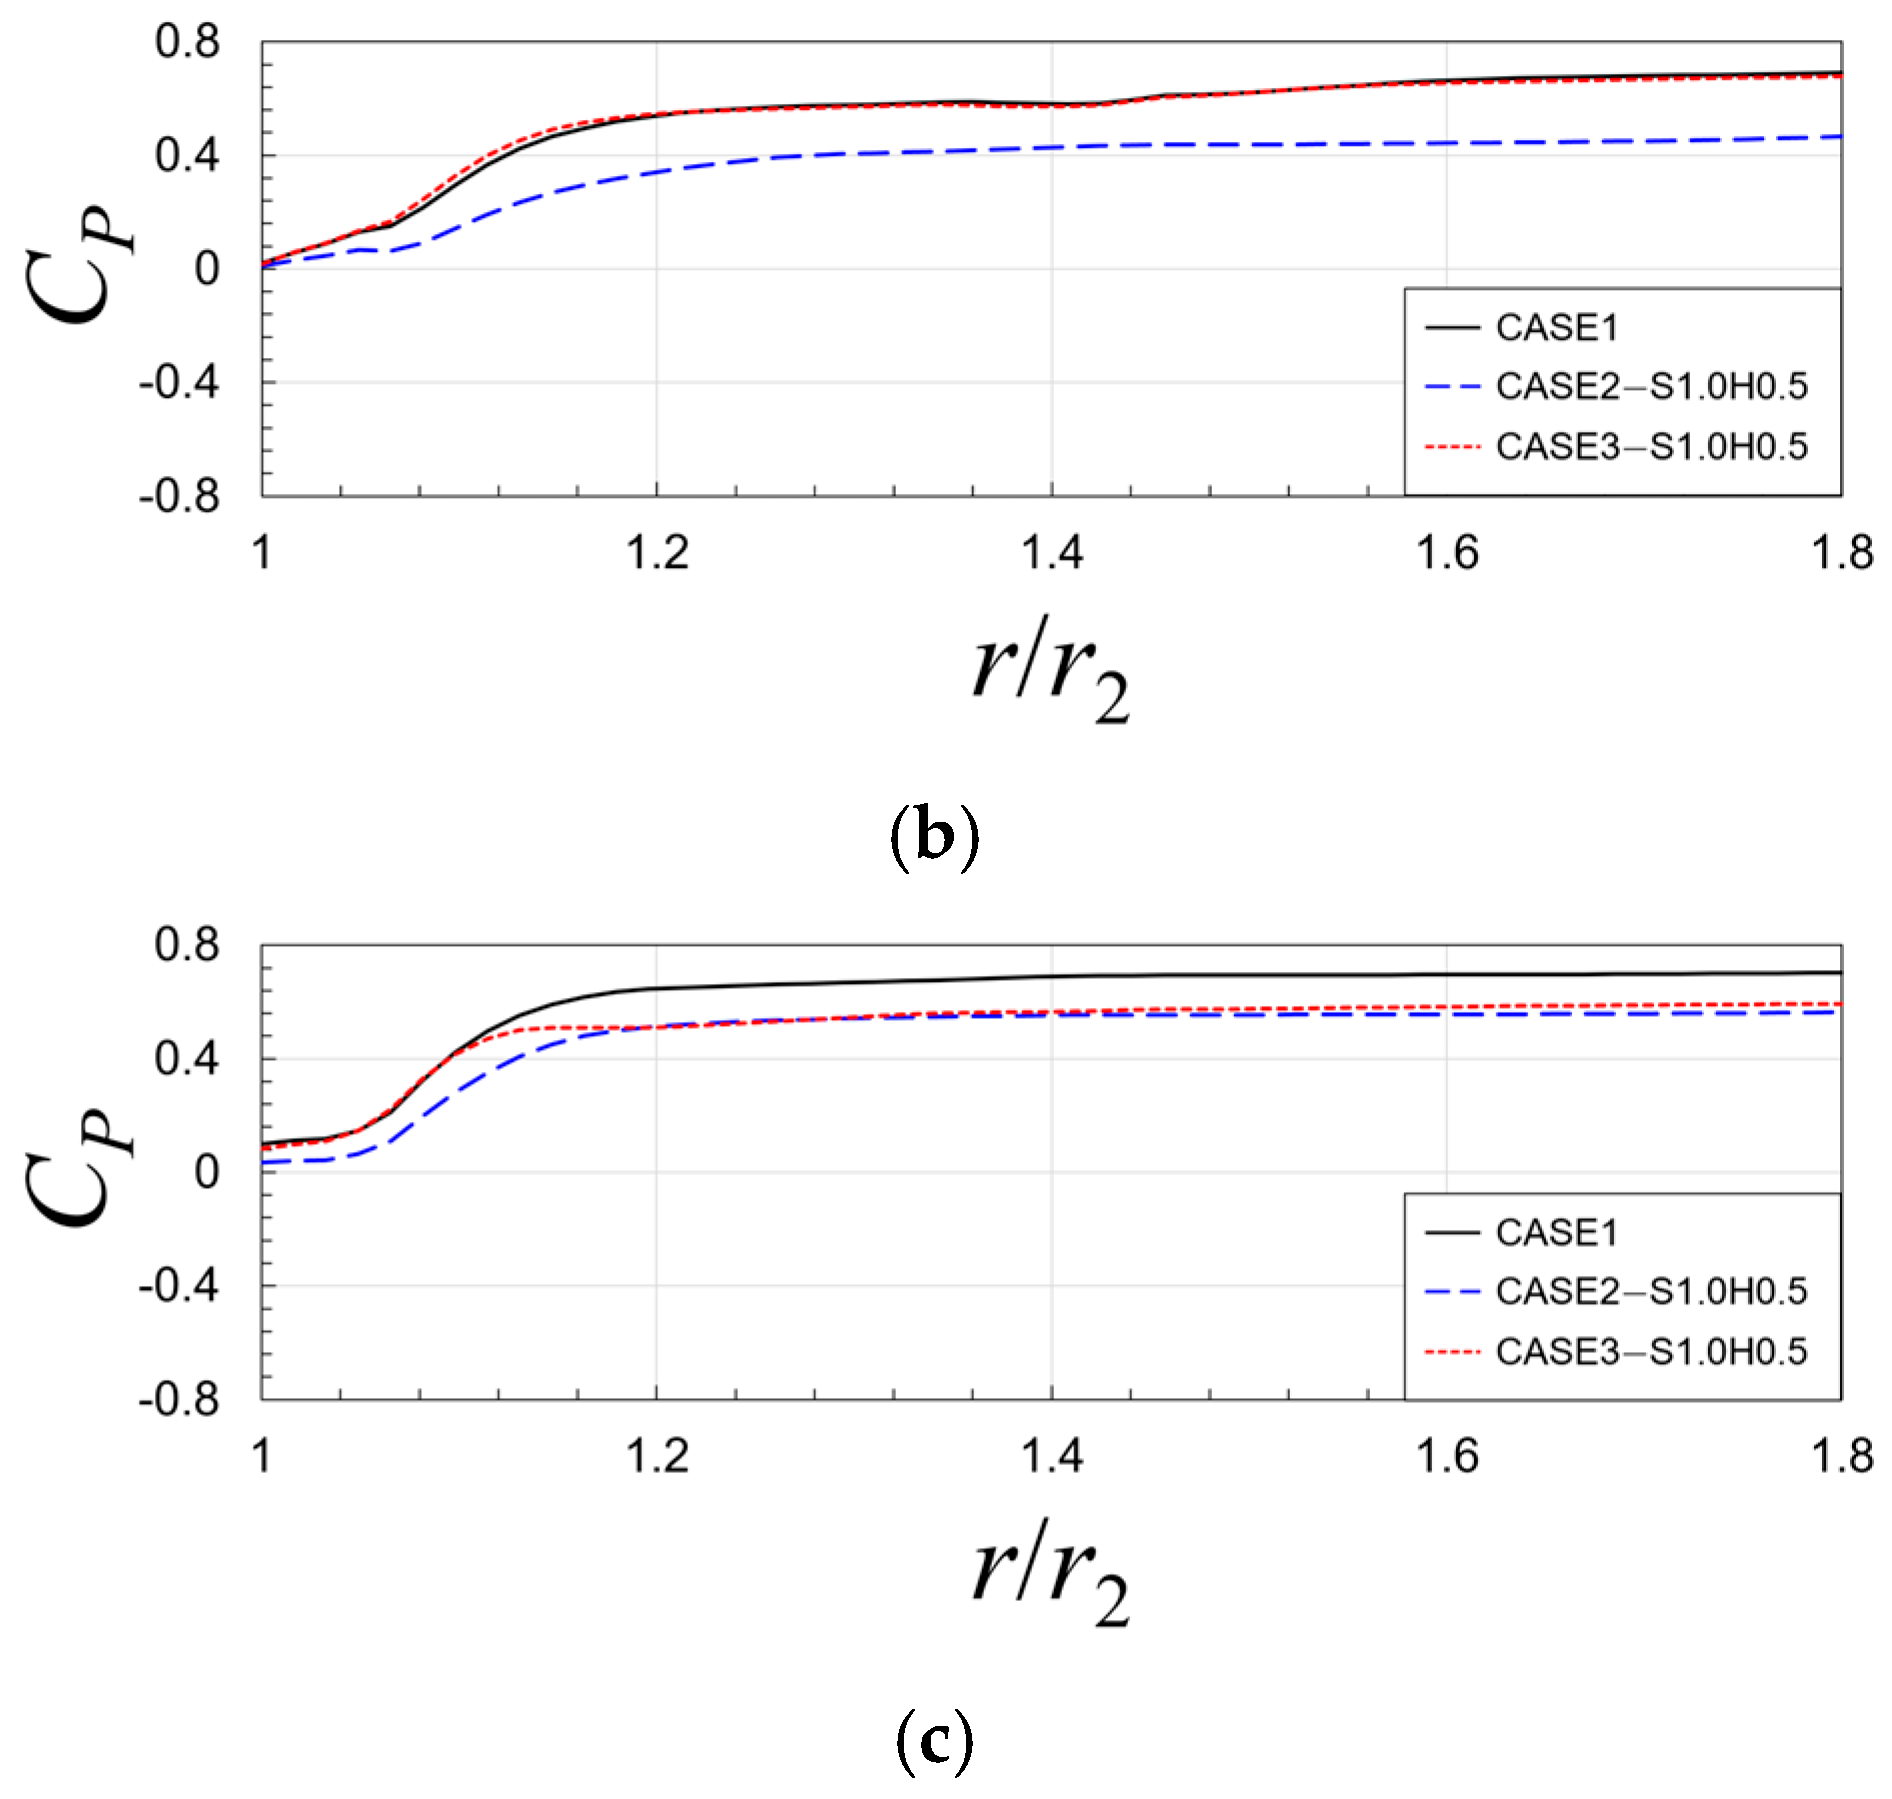
Figure 8 compares local Cp distributions in a radial direction for different impeller–diffuser gap flows. In all flow rates, local Cp values exhibit a sudden change in 1.04 < r/r2 < 1.12, followed by a more gradual slope in the subsequent region. This aligns with the findings of Gao et al. [6], who emphasized that the performance at the diffuser vane inlet and semi-vaneless region significantly influences overall diffuser performance. Meanwhile, at the diffuser’s trailing edge (r/r2~1.6), the local Cp values for CASE1 and CASE2 increase as flow decreases, resulting in a negative slope of the ϕ/ϕd−Cp,d curve in the most range of ϕ/ϕd, as shown in Figure 7d. On the other hand, at ϕ/ϕd = 0.4 (Figure 8c), CASE3 does not achieve sufficient pressure recovery at the diffuser trailing edge in comparison with that at ϕ/ϕd = 0.7 (Figure 8b). This phenomenon is considered as a major factor contributing to the positive slope of the ϕ/ϕd−Cp,d curve in ϕ/ϕd < 0.6, as shown in Figure 7d.
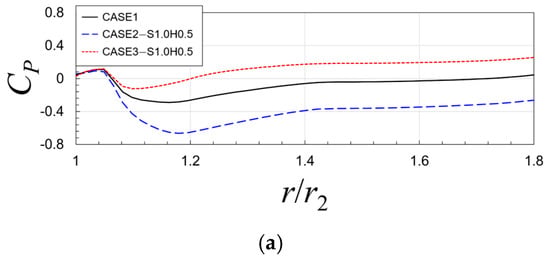

Figure 8.
Local Cp distributions in radial location for various impeller–diffuser side-gap flow configurations: (a) ϕ/ϕd = 1.0, (b) ϕ/ϕd = 0.7, and (c) ϕ/ϕd = 0.4.
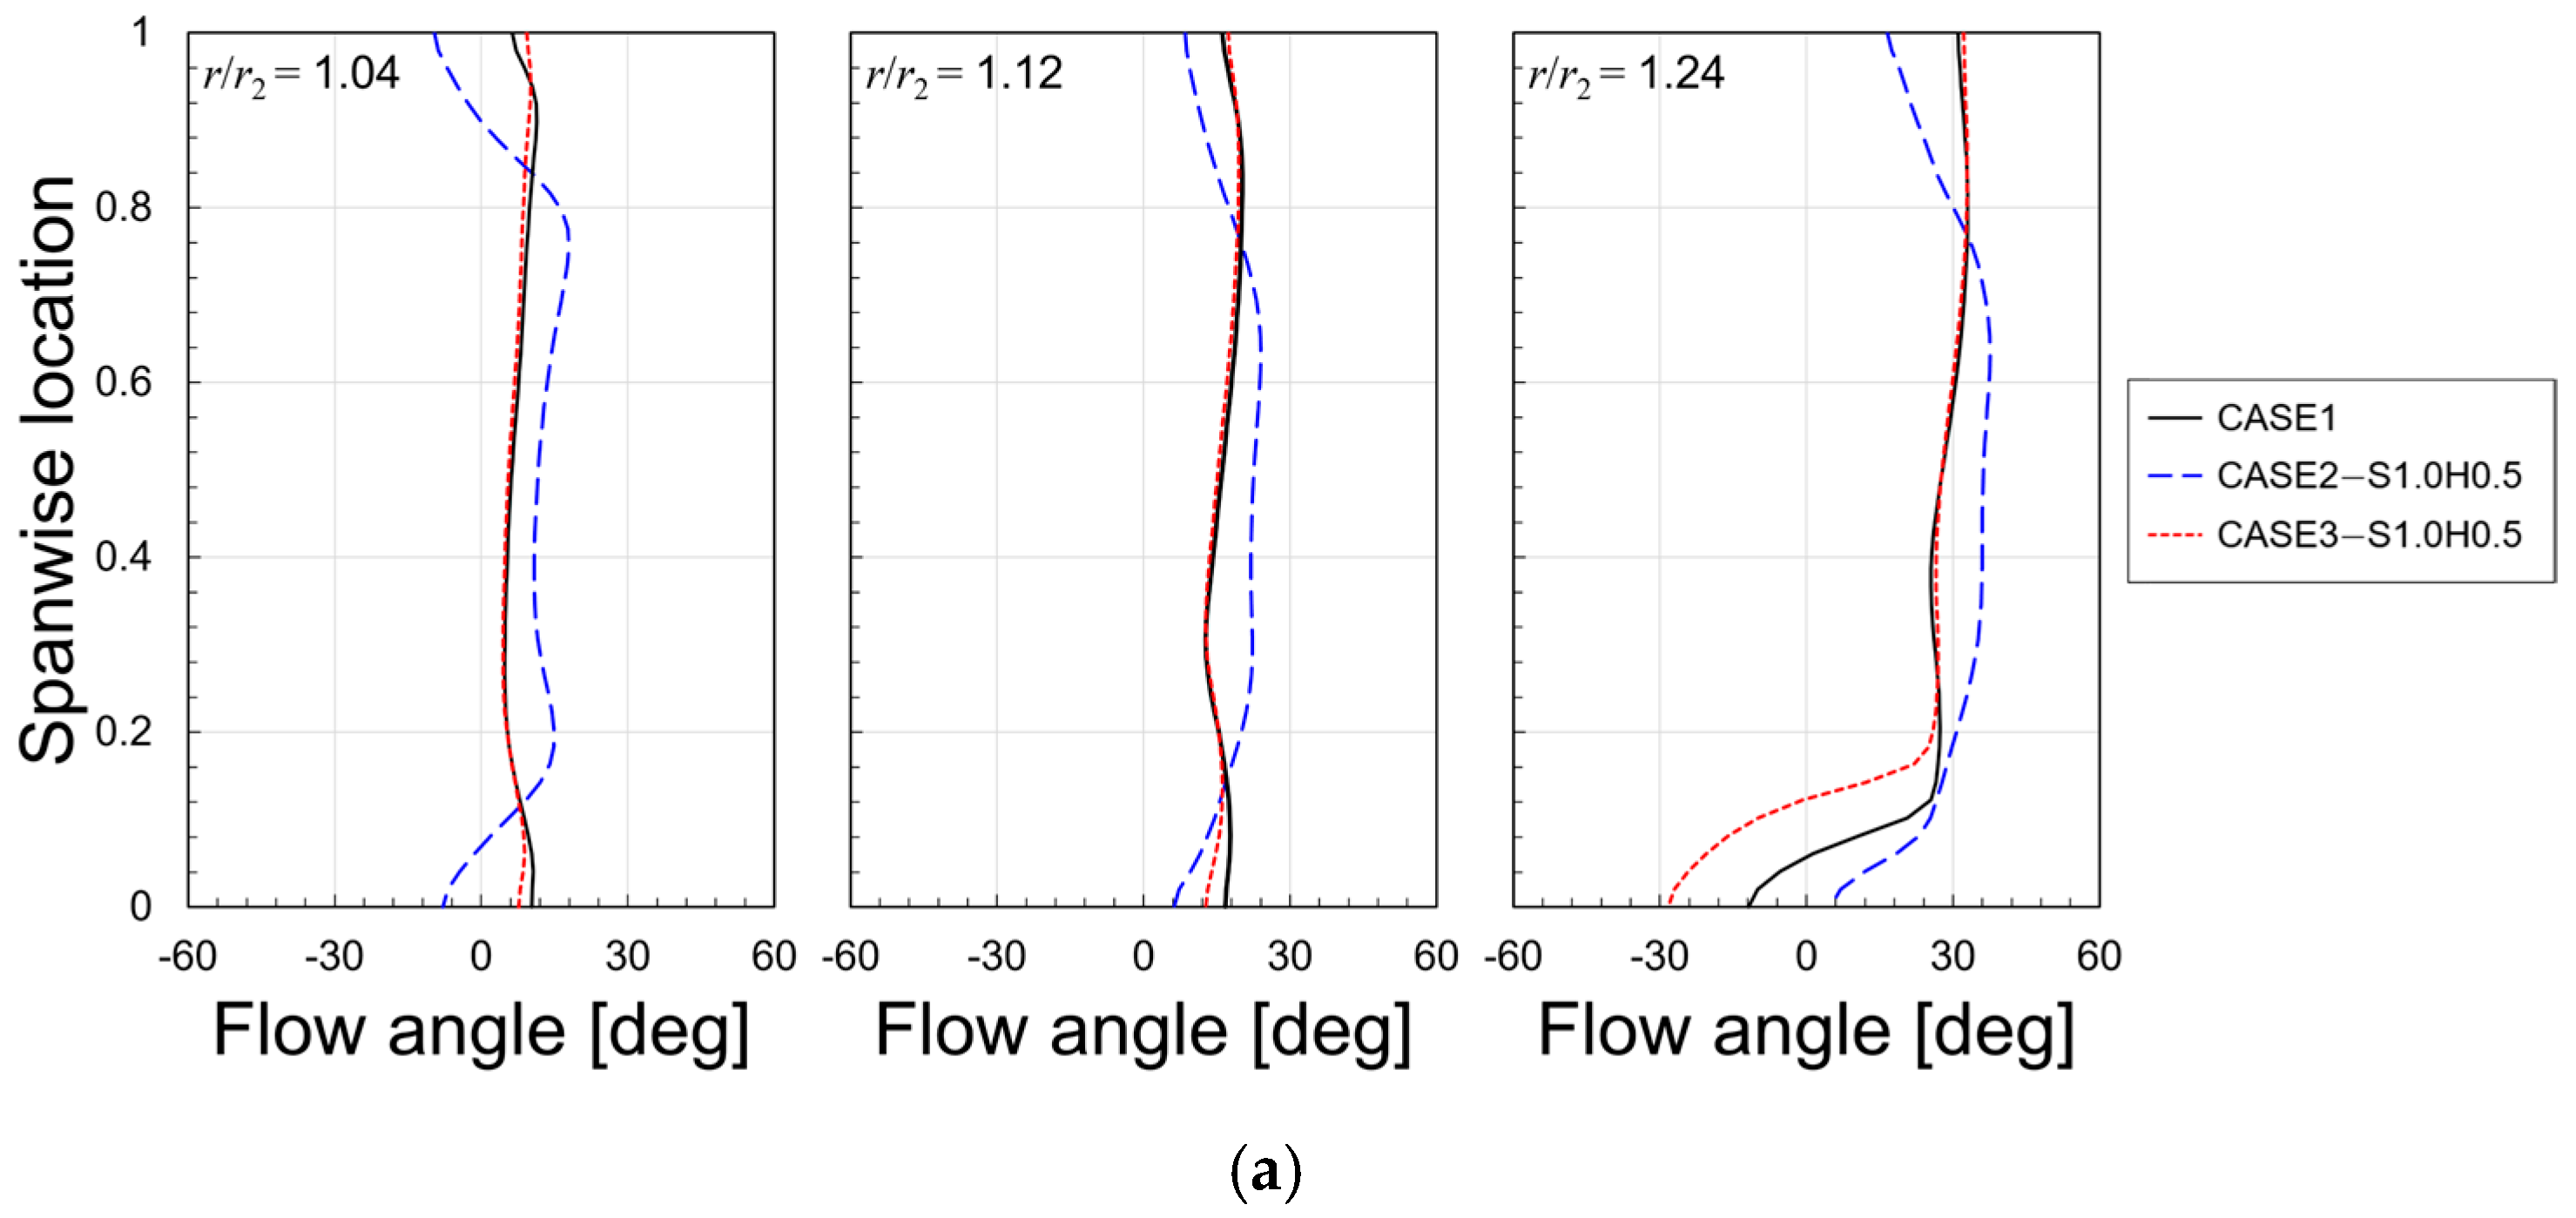
Figure 9a compares the pitch-averaged velocity flow angle distributions in a spanwise location at the diffuser inlet (r/r2 = 1.04), the semi-vaneless region (r/r2 = 1.12), and the middle of diffuser passage (r/r2 = 1.24). At the diffuser inlet (ϕ/ϕd = 0.7), CASE2 has negative flow angles indicating reverse flow both the shroud and hub. This reversed flow partially blocks the near-wall region, increasing the core flow velocity angles within the diffuser. This flow profile persists until the middle of diffuser passage. Consequently, as shown in Figure 8b, the local Cp value in all radial directions is lower than in other cases, leading to relatively lower Cp,d values (Figure 7d). Meanwhile, CASE1 and CASE3 have constant flow angle distributions across the span until the semi-vaneless region. However, flow reversal suddenly occurs near the hub at the middle of diffuser passage where the diffusive flow at the inlet transitions to boundary layer separation near the wall.
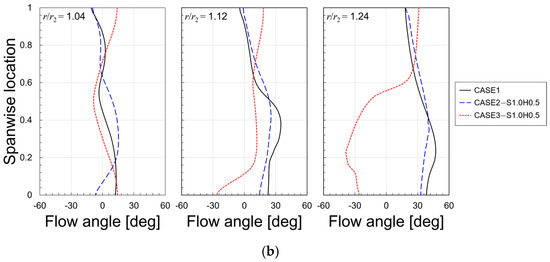
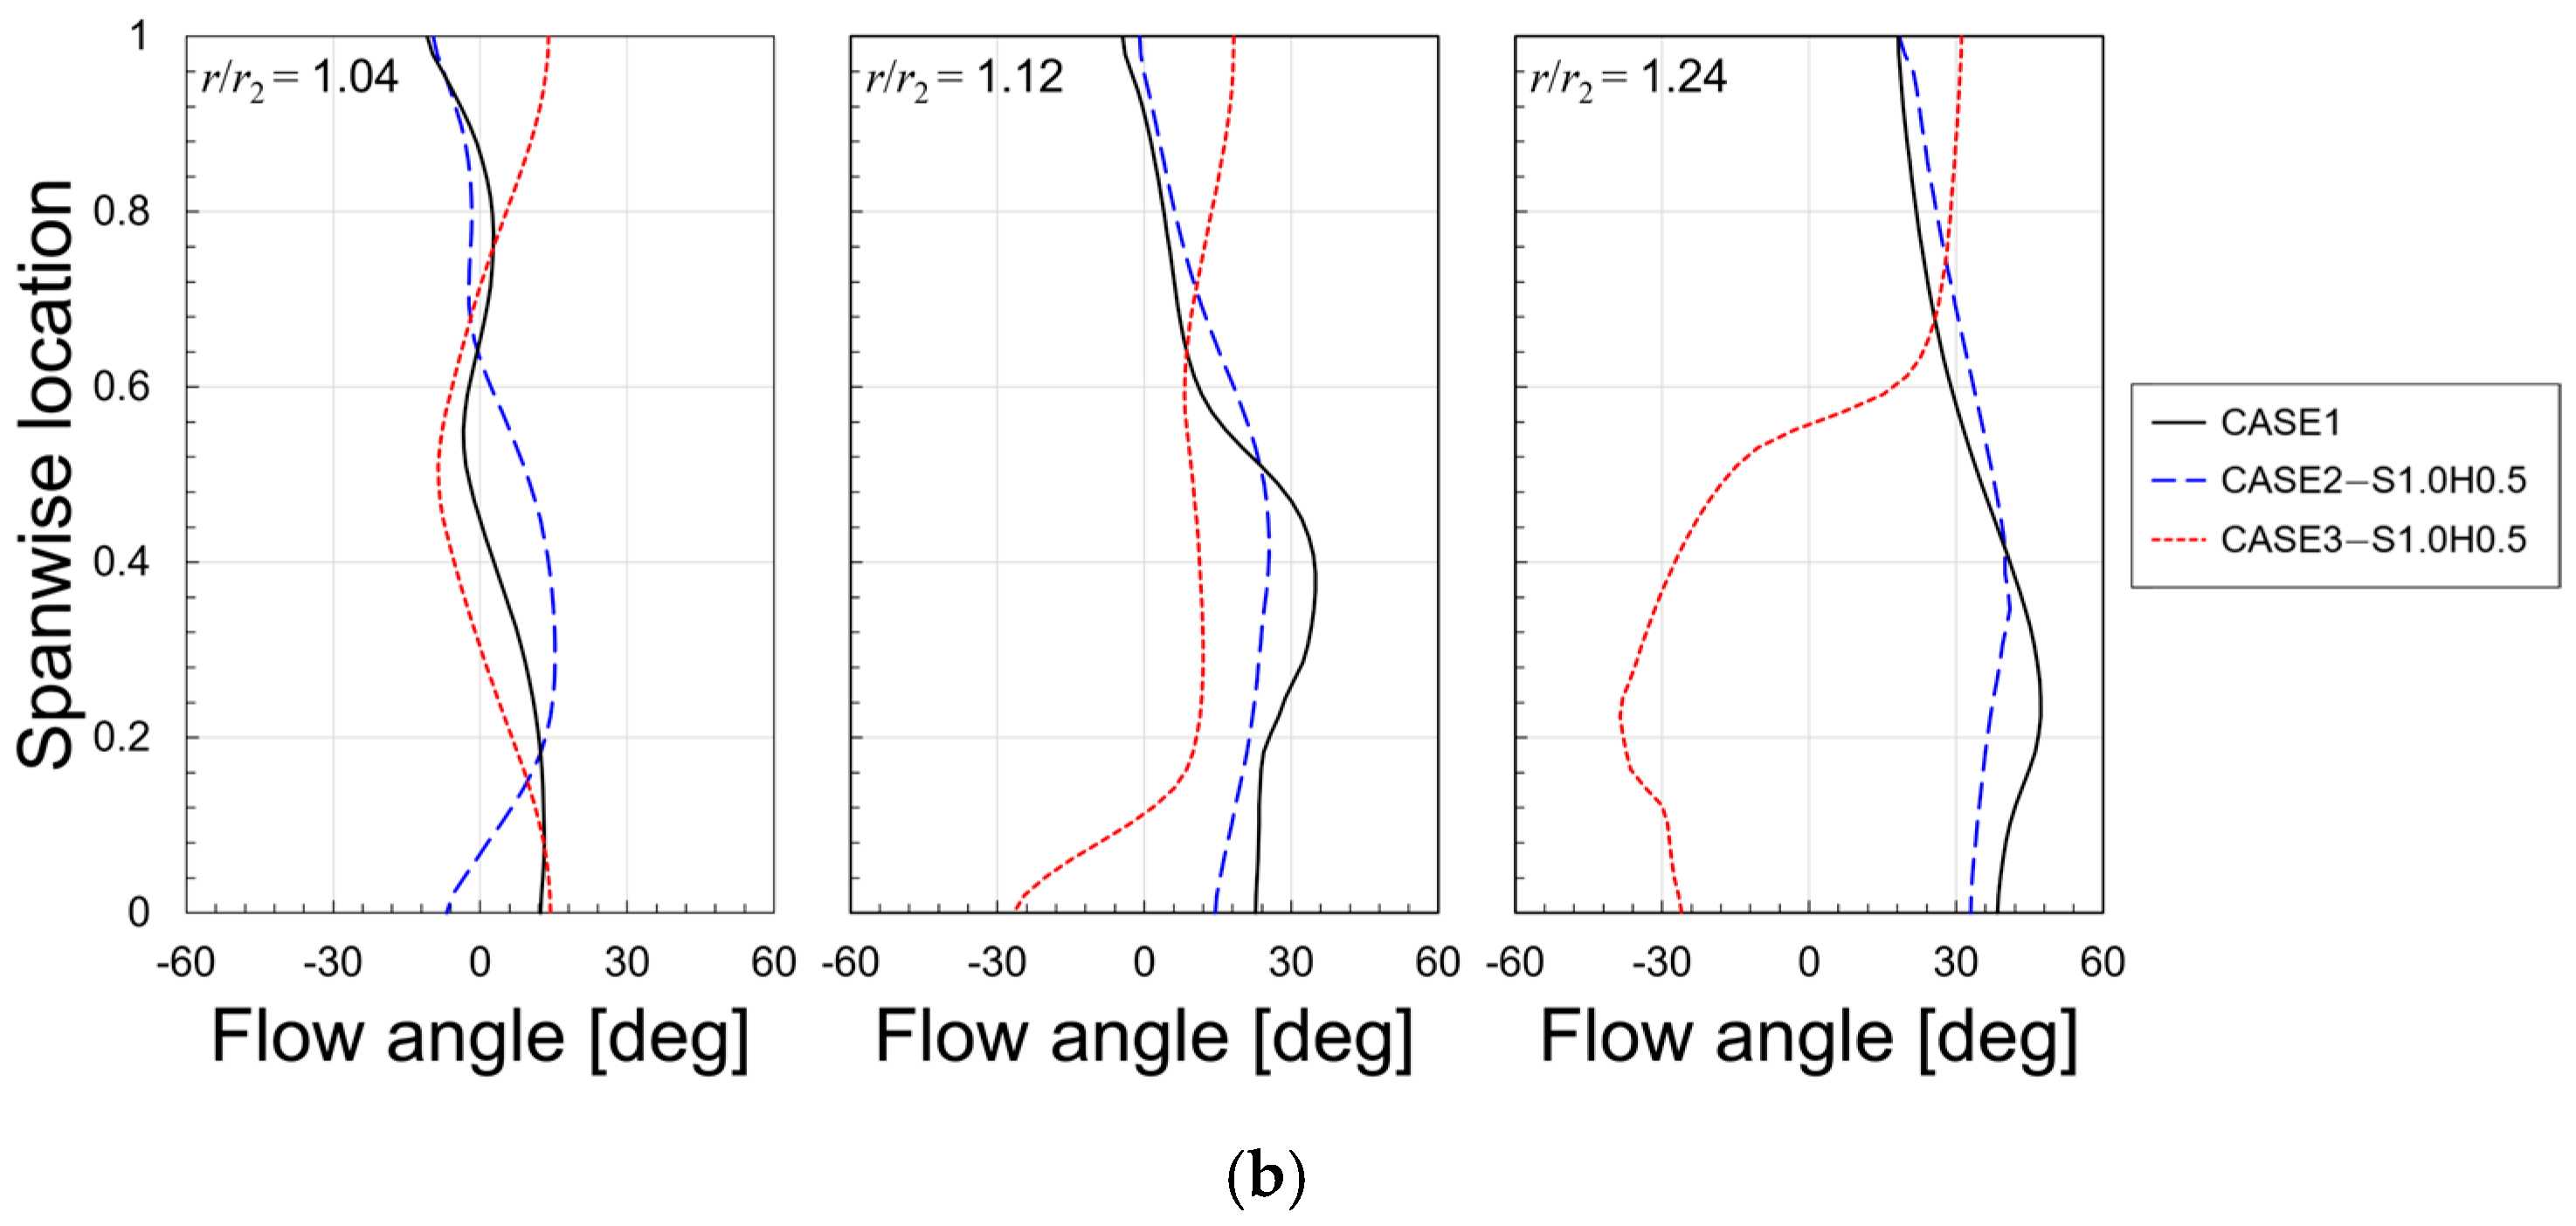
Figure 9.
Pitch wise-averaged velocity flow angle distributions in spanwise location for various impeller–diffuser side-gap flow configurations: (a) ϕ/ϕd = 0.7 and (b) ϕ/ϕd = 0.4.
Figure 9b shows the velocity flow angle distribution at ϕ/ϕd = 0.4. At the diffuser inlet, it is seen that no significant deviations are observed even though there are minor differences in the profiles. However, for CASE3, the negative flow angles near the hub begin to appear at the semi-vaneless region. Further, in the middle of the passage, their values reach nearly −50° with over 50% of the span, which is a much larger proportion compared to the other cases. It can be inferred that the flow reversal of CASE3 begins to occupy the middle passage of the diffuser passage at ϕ/ϕd = 0.7 (Figure 9a) and adversely extends to the semi-vaneless region at ϕ/ϕd = 0.4 (Figure 9b).
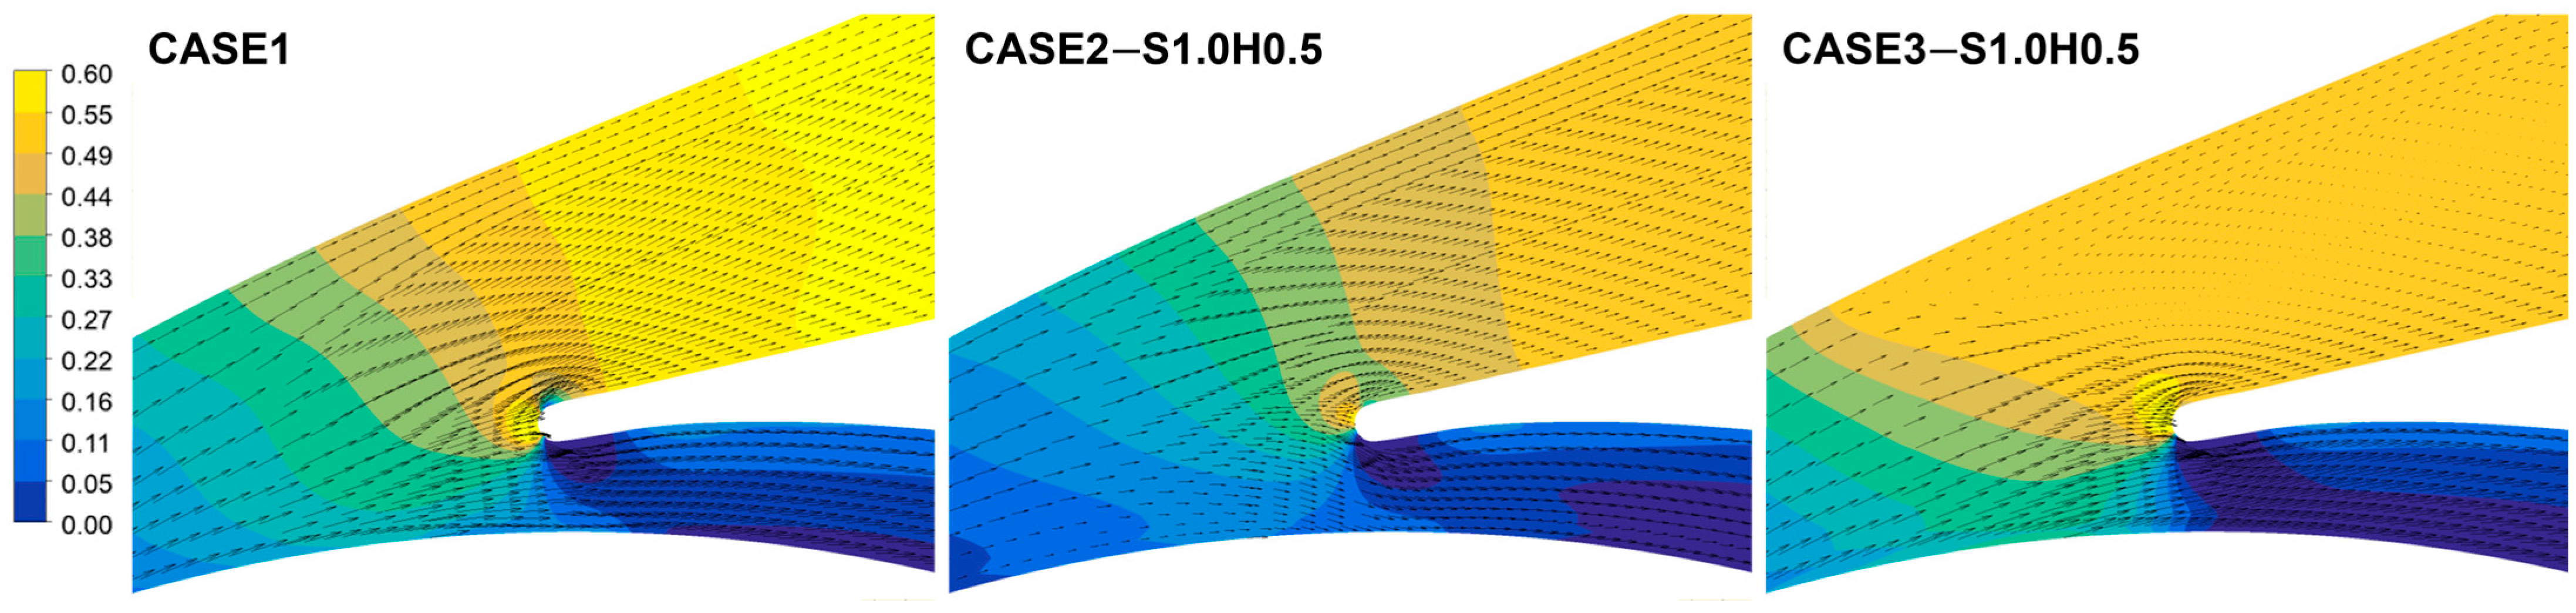
Figure 10 compares the local Cp contours and velocity vector distributions on the x-y plane near the hub (5% span) at ϕ/ϕd = 0.4. As discussed in Figure 9a, the flow angle at the diffuser inlet (r/r2 = 1.04) for CASE2 is large due to accelerated flow near the hub, and thus the flow within the vane diffuser passages forms with relatively consistent flow angles. However, it is seen that CASE3 has negative flow angles at the diffuser inlet and shows a strong adverse pressure gradient formed in the semi-vaneless region. Accordingly, flow reversal and stagnation begin to develop at the diffuser passage entrance, obstructing the diffusion and further pressure recovery in the main passage, as explained in Figure 8c.
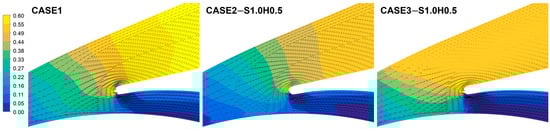
Figure 10.
Local Cp contours and velocity vectors on x-y plane near hub (5% span) at ϕ/ϕd = 0.4 for various impeller–diffuser side-gap flow configurations.
Figure 11 compares the iso-surface of velocity flow angle with −5° and the local Cp distribution on the diffuser surface at ϕ/ϕd = 0.4. In CASE1 and CASE2, reversed flows are located near the shroud leading edge and passage trailing edge, but they do not significantly affect the effective flow area of the diffuser. In contrast, CASE3 exhibits reversed flow initiated by flow separation at the hub edge on the suction side, which extends to the trailing edge. This reversed flow corresponds to the flow characteristics observed in Figure 9b, leading to a reduction in effective flow area. Consequently, a decrease in local Cp values occurs as shown in Figure 8, and it may be the primary cause of the slope sign change in the ϕ/ϕd−Cp,d curve, as shown in Figure 7d.
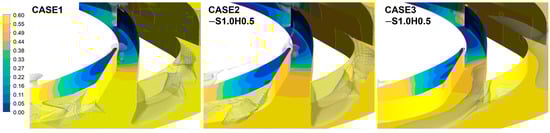
Figure 11.
Iso-surface of flow angle with −5° and local Cp distribution on diffuser surface at ϕ/ϕd = 0.4 for various impeller–diffuser side-gap flow configurations.
5.3. Effect of Leakage Flow with Variations of Clearances
This section analyzes the performance and flow characteristics focused on the impact of the clearances with outflow (leakage). A baseline was set with a shroud-side gap of 1.0 mm and a hub-side gap of 0.5 mm considering the results of the previous section. An additional four cases were compared: two cases where the shroud-side clearances were changed to 0.5 mm and 1.5 mm while keeping the hub-side gap fixed to the baseline (CASE3−S0.5H0.5 and CASE3−S1.5H1.5) and two cases where the hub-side clearances were changed to 0 mm and 1.0 mm while the shroud-side gap remained constant with the baseline (CASE3−S1.0H0 and CASE3−S1.0H1.5).
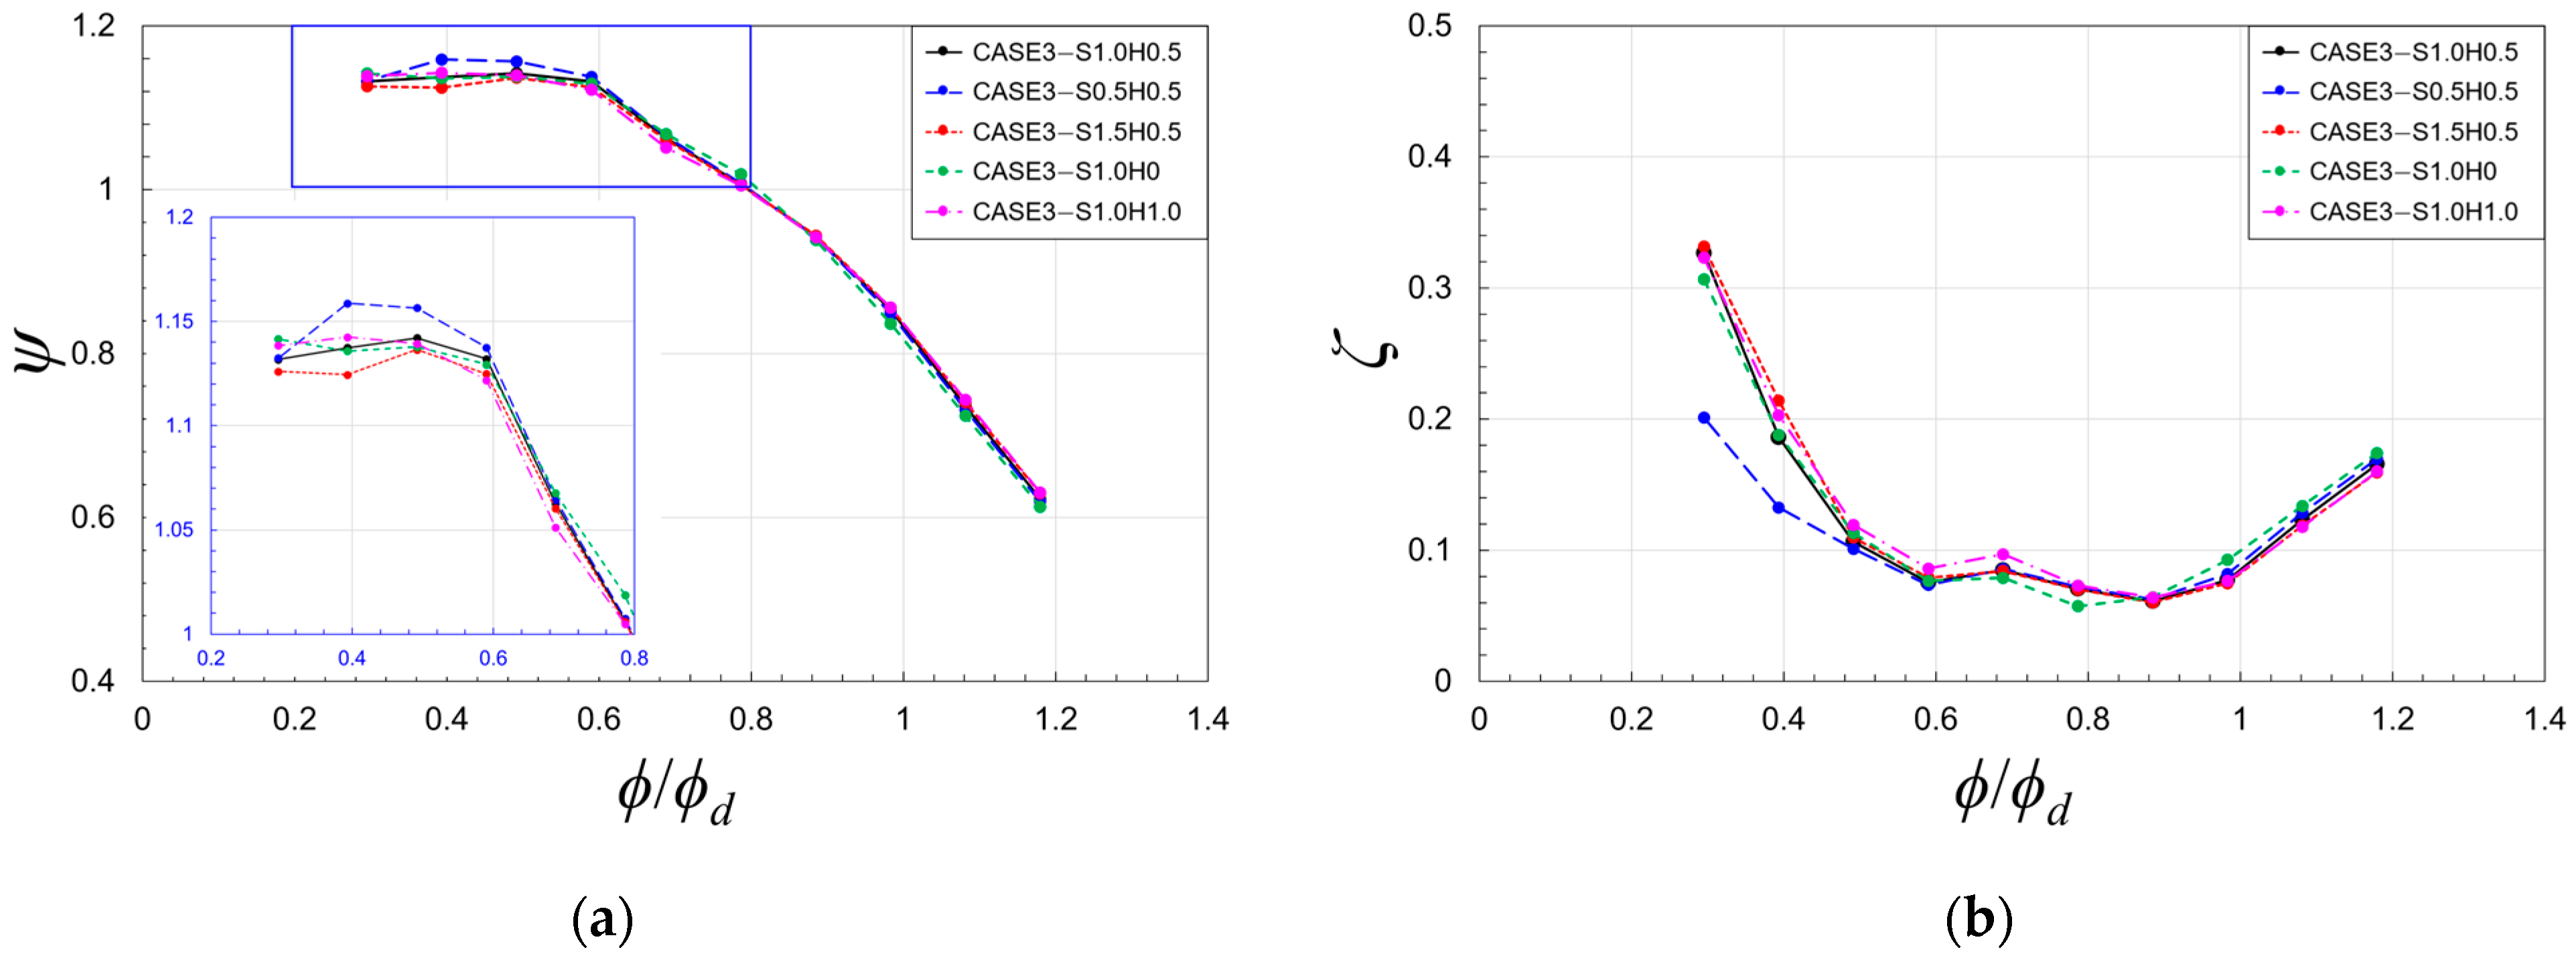
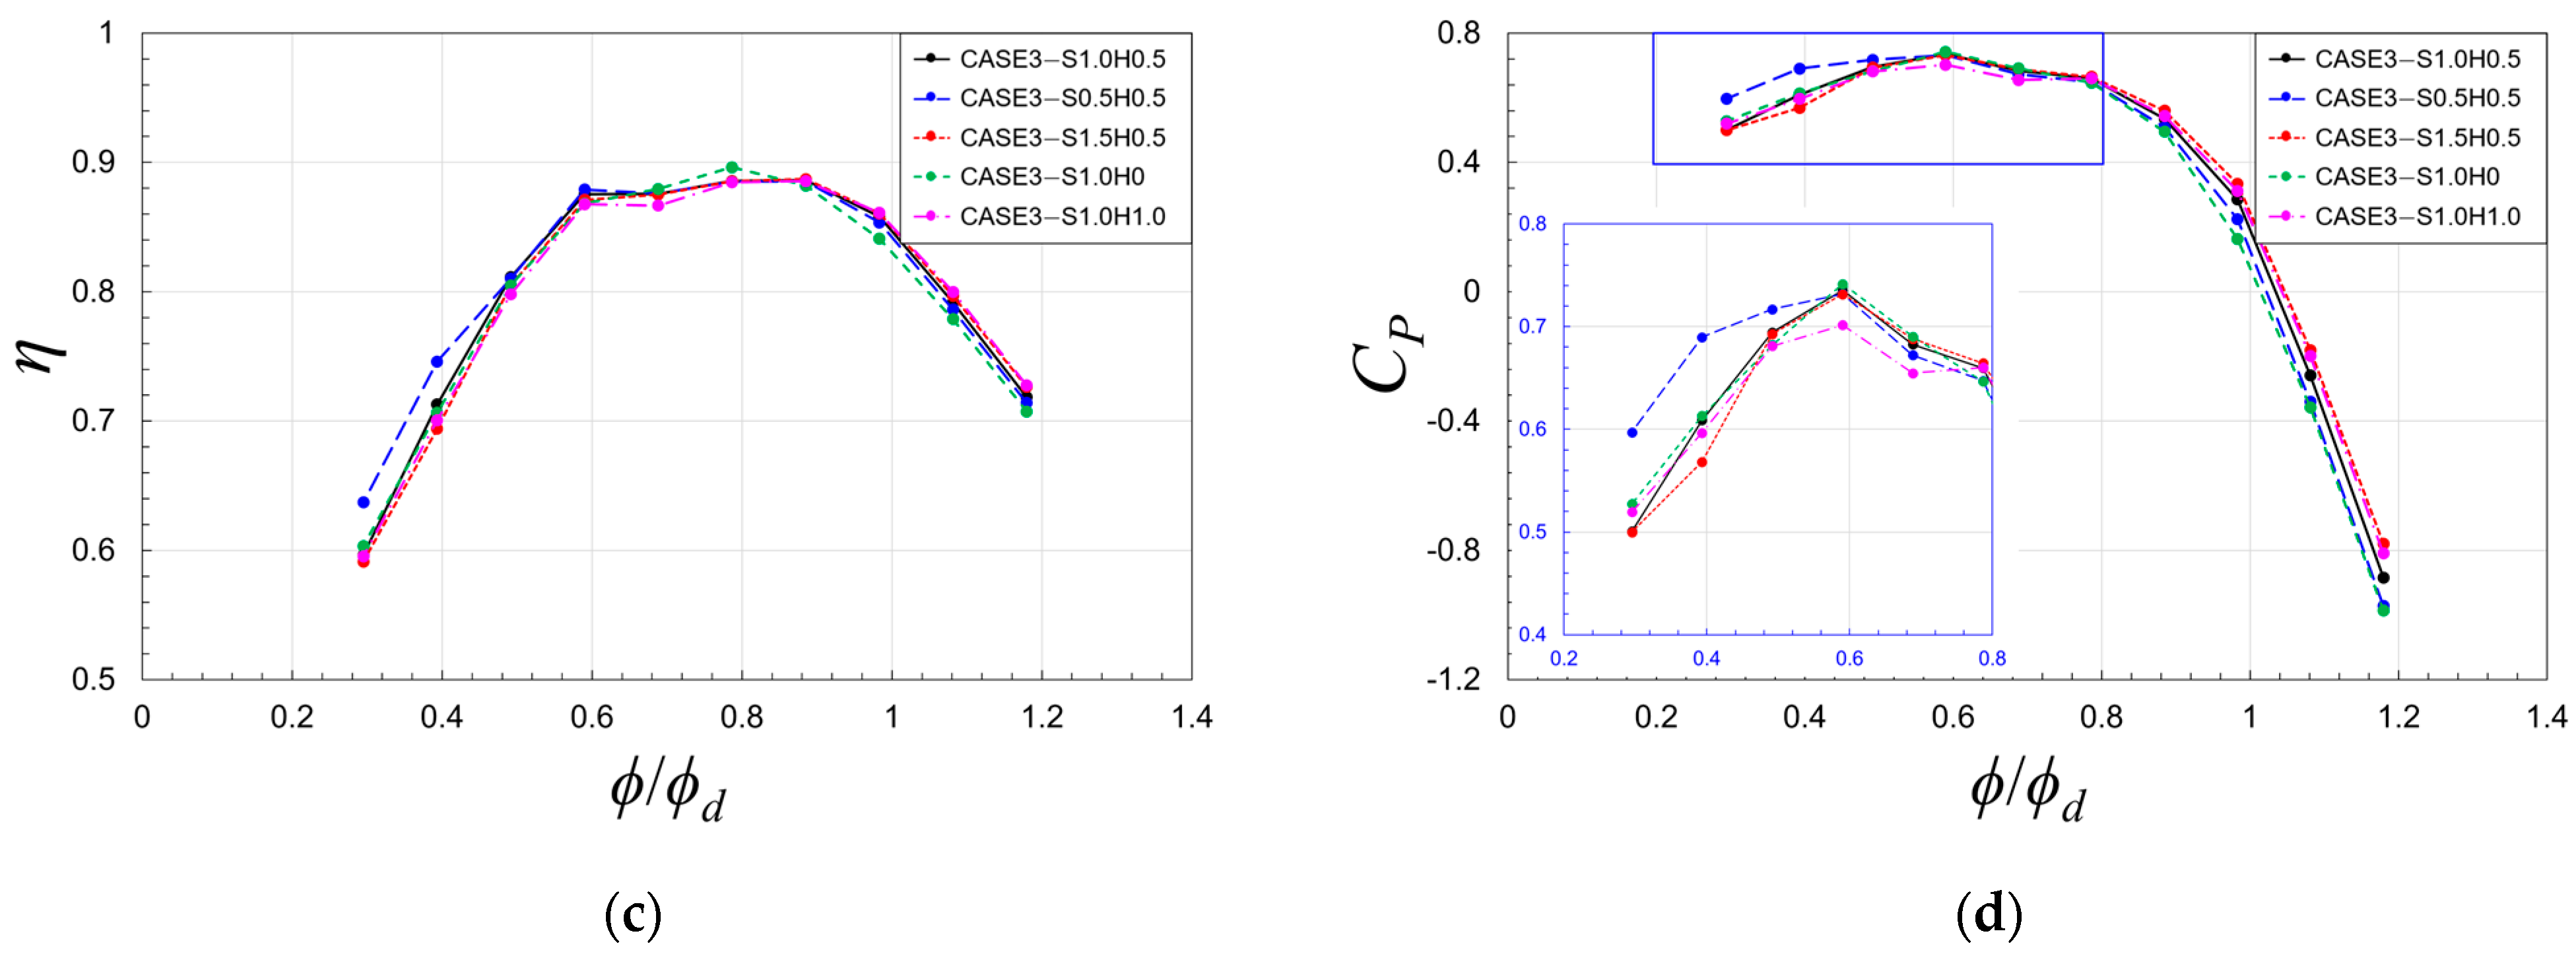
Figure 12 compares the performance curves for different gap configurations. The ϕ/ϕd−ψ curve (Figure 12a) indicates that the quantitative values are almost identical across all configurations in ϕ/ϕd > 0.6. This appears to be related to the small amount of leakage (Figure 4) and the absence of reversal flows (Figure 9). However, deviations between the cases are observed in ϕ/ϕd < 0.6, which become more pronounced in the enlarged view. Interestingly, changes in the hub-side gap (CASE3−S1.0H0 and CASE3−S1.0H1.5) have a negligible effect on the ϕ/ϕd−ψ curve, whereas changes in the shroud-side gap (CASE2−S0.5H0.5 and CASE2−S1.5H0.5) are significantly remarkable. This trend is also evident in other performance curves. Notably, the η value for CASE2−S0.5H0.5 is approximately 5% higher at ϕ/ϕd = 0.4 than that for other cases, indicating that leakage on the shroud side has a more substantial impact.
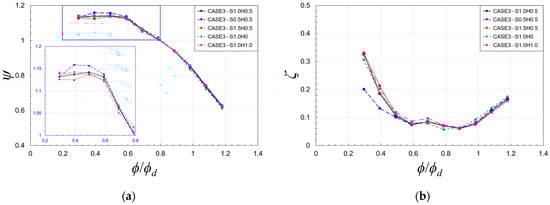

Figure 12.
Performance curves for different clearances of CASE3: (a) ϕ/ϕd−ψ, (b) ϕ/ϕd−ζ, (c) ϕ/ϕd−η, and (d) ϕ/ϕd−Cp,d.
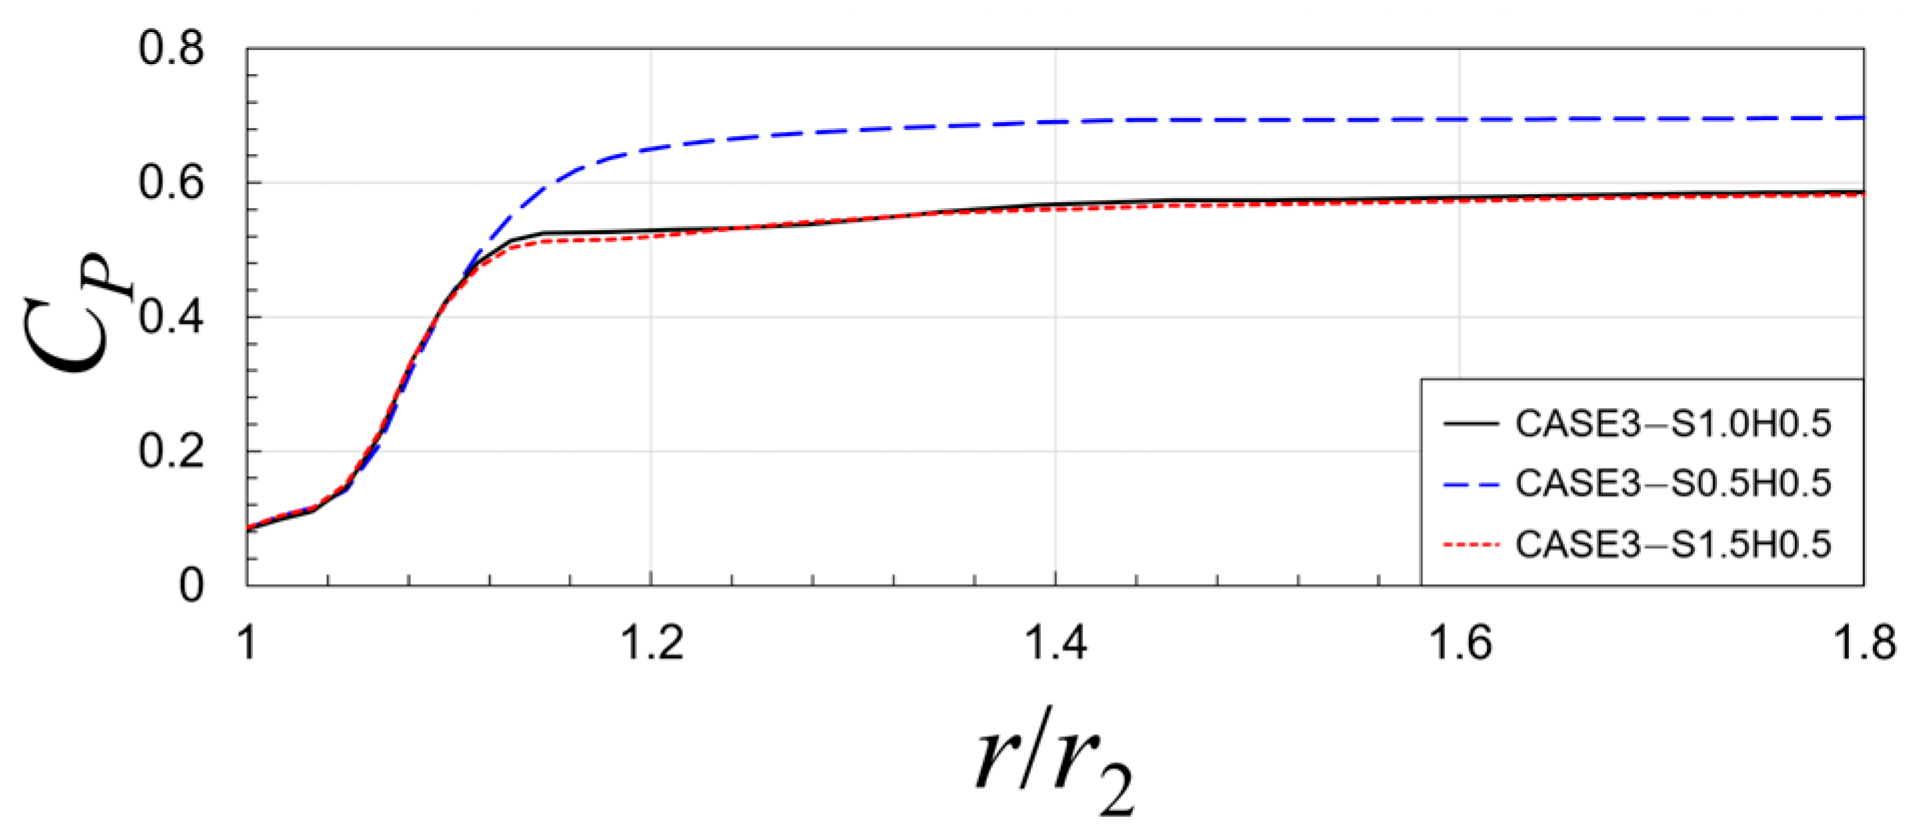
Figure 13 compares the local Cp distribution in a radial direction at ϕ/ϕd = 0.4. In all cases, the local Cp values show similar trends in r/r2 < 1.1. However, the local Cp values of CASE−S0.5H0.5 increase sharply in the region r/r2 > 1.1, whereas the slope of Cp values for other cases are much more gradual from the region r/r2 > 1.2. This means that a less effective pressure recovery through the diffuser passage occurred for CASE−S1.0H0.5 and CASE−S1.5H0.5 compared to CASE−S0.5H0.5. This is consistent with the results that the lower Cp,d values at ϕ/ϕd = 0.4 are observed for CASE−S1.0H0.5 and CASE−S1.5H0.5, as shown in Figure 12d.
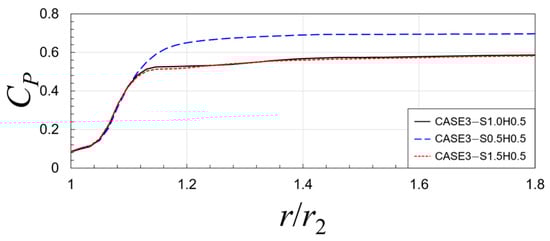
Figure 13.
Local Cp distributions in radial direction at ϕ/ϕd = 0.4 for different shroud side clearances of CASE3.
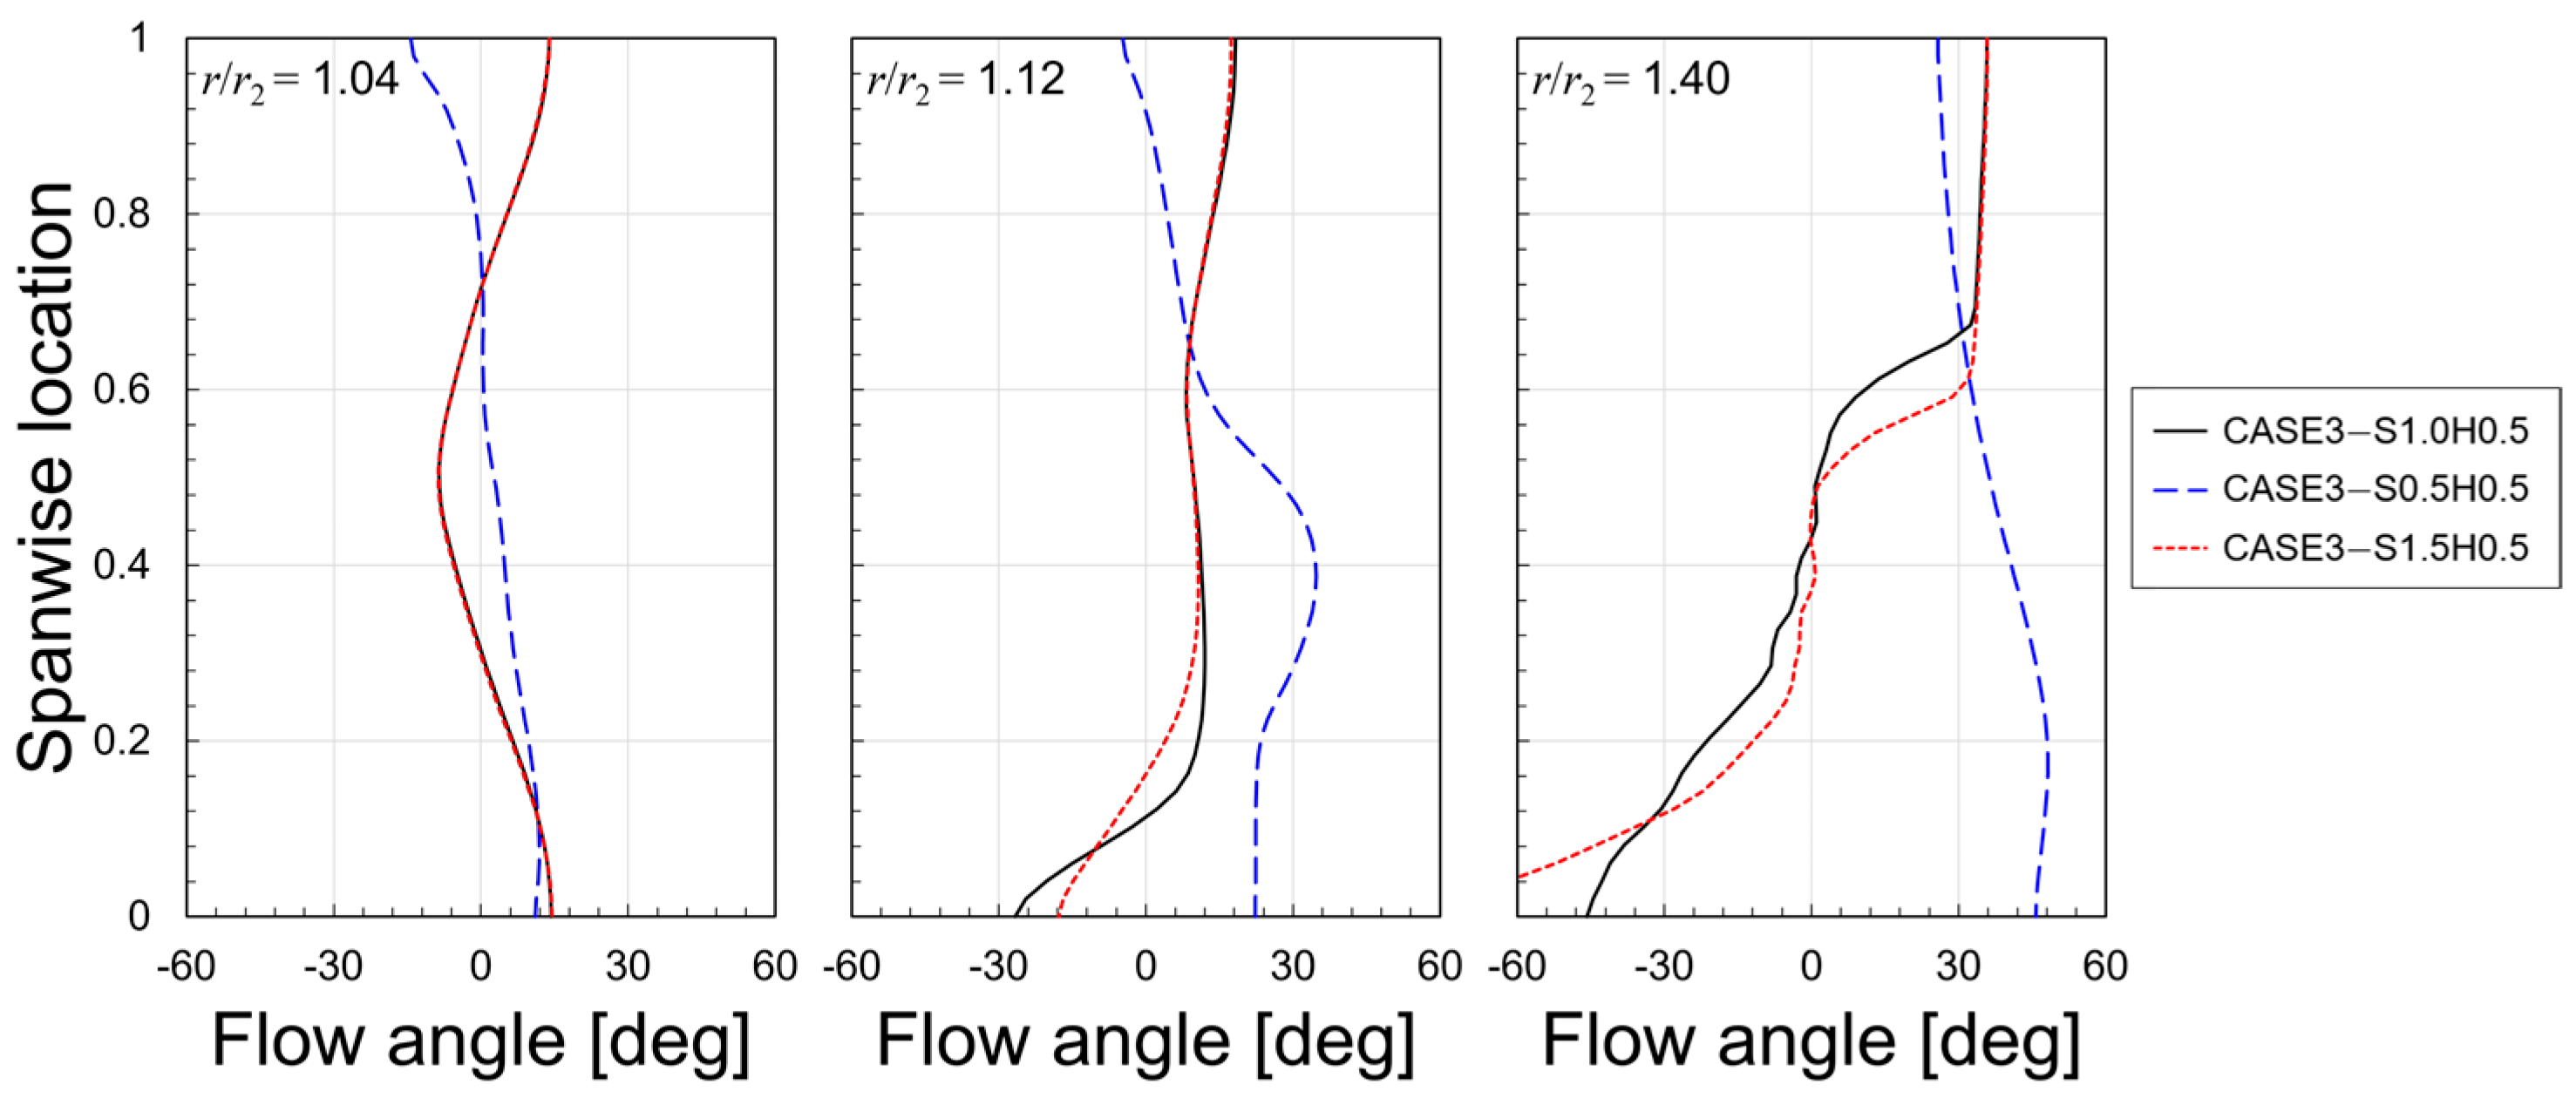
Figure 14 compares the pitch wise-averaged flow angle distributions in a the spanwise direction at ϕ/ϕd = 0.4 for different shroud clearances of CASE3. It is seen that the flow angles of CASE−S0.5H0.5 differ from those of the other cases, resembling the flow observed in CASE1 (without leakage) in Figure 9b. This indicates that small leakage from narrow gaps does not significantly affect overall flow characteristics. However, CASE3−S1.5H0.5 has reverse flow at the hub slightly stronger than CASE3−S1.0H0.5. This trend is related to the lower performance in ϕ/ϕd < 0.6 for the latter two cases compared to that for CASE3−S0.5H0.5, as observed in Figure 12d. Moreover, this suggests that the relationship between performance and flow characteristics is non-linear with respect to leakage magnitude, there existing a threshold flow rate where the feature abruptly changes.
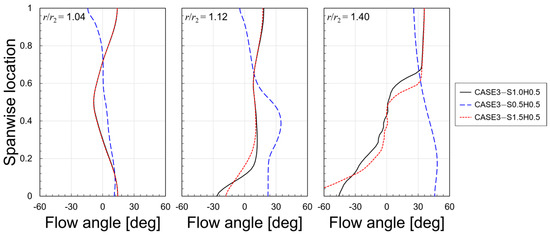
Figure 14.
Pitch wise-averaged velocity flow angle distributions in spanwise location at ϕ/ϕd = 0.4 for different shroud side clearances of CASE3.
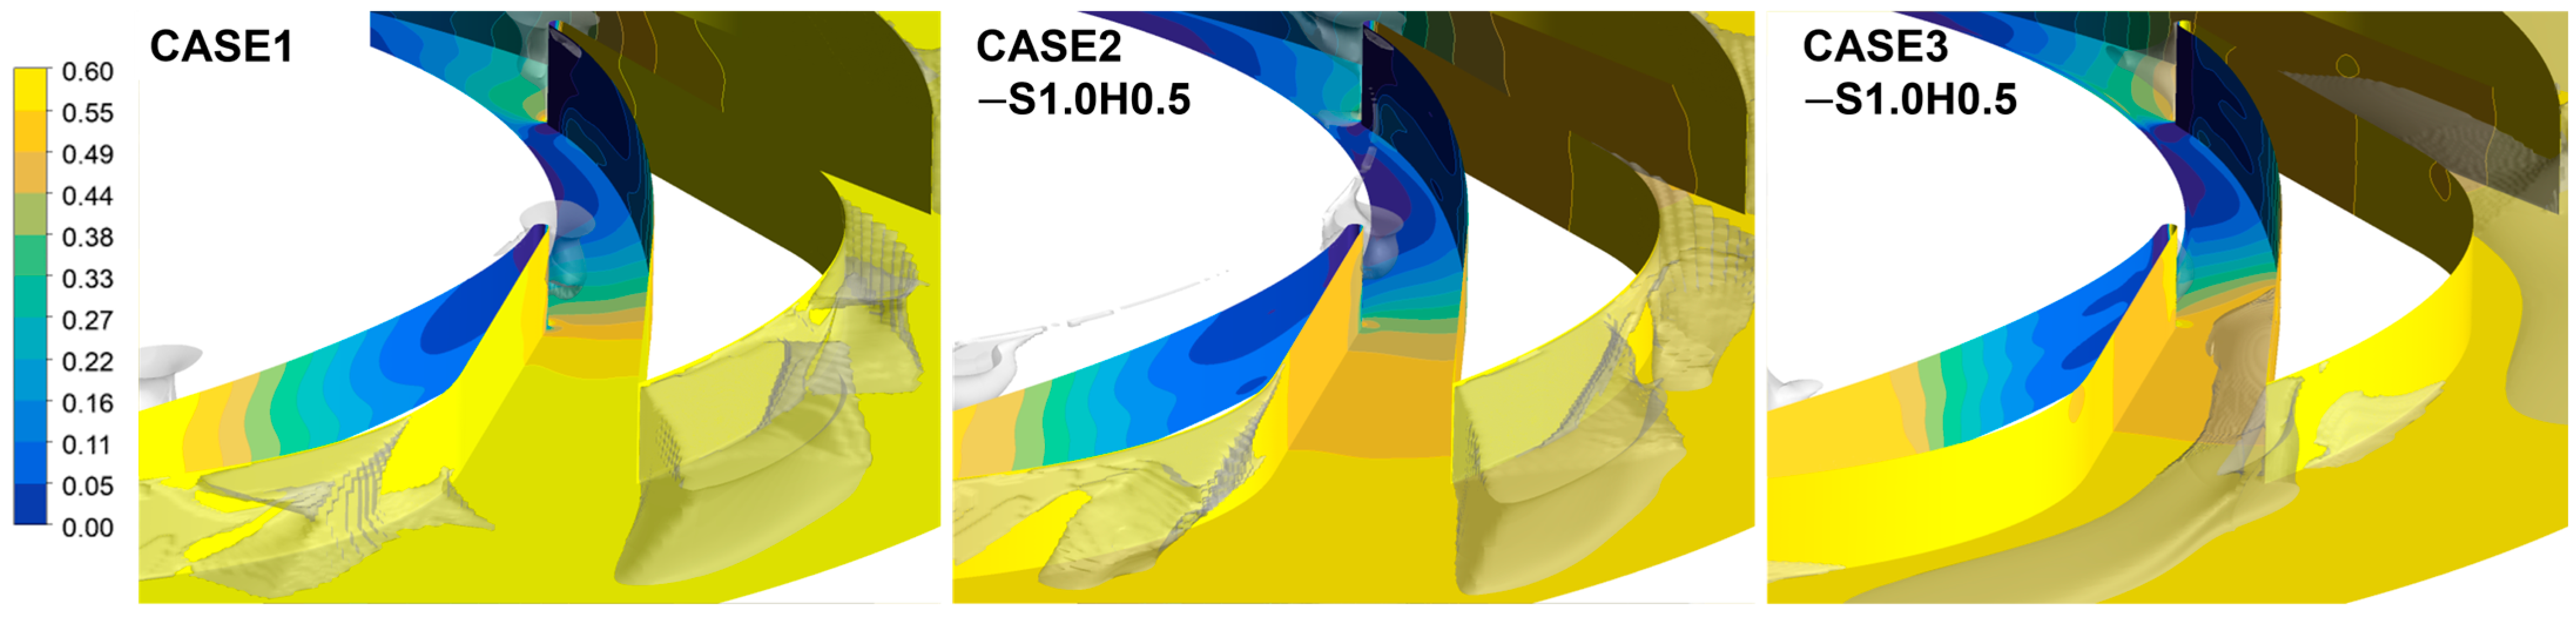
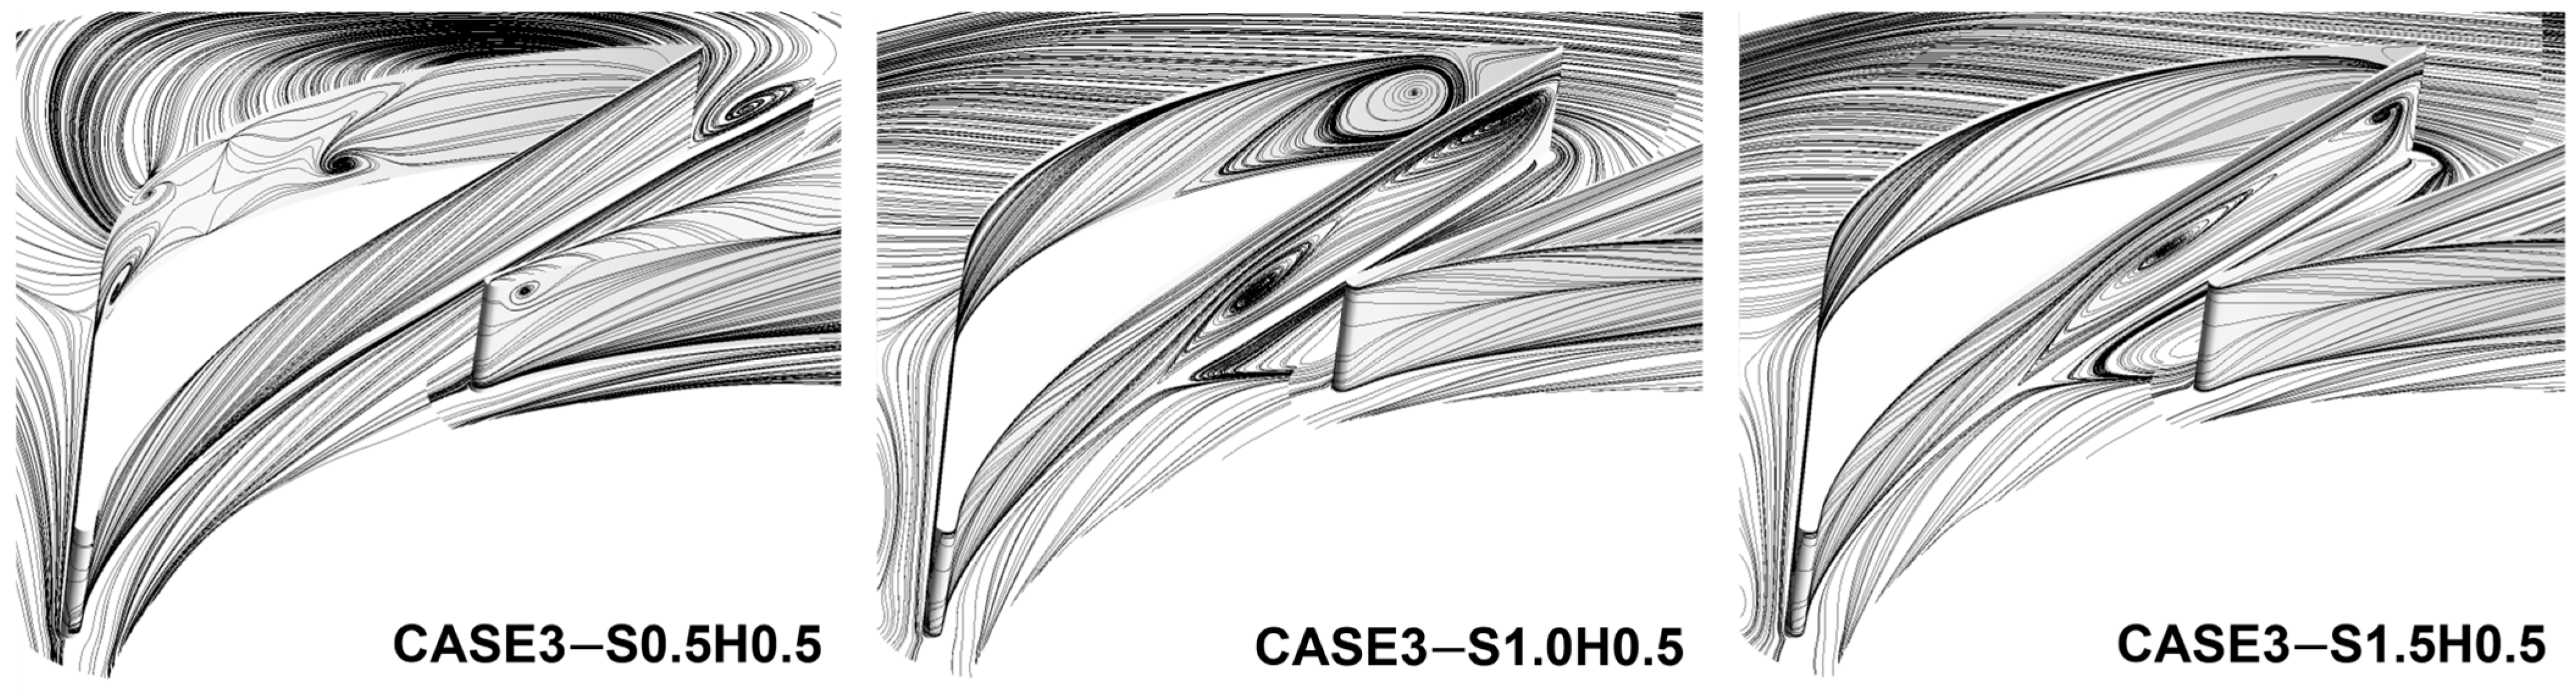
Figure 15 shows the surface streamlines on the diffuser surface at ϕ/ϕd = 0.4 for different shroud clearances of CASE3. In CASE3−S0.5H0.5, smooth surfaces are observed near the suction side and hub. Even though a minor vortex structure near the shroud on the leading edge of the suction side is shown, its size is too small to affect the effective area of the diffuser passage. However, in other cases, large vortical structures are observed from the inlet of the diffuser passage, especially concentrated near the mid-suction side and hub regions. This is associated with the development of reverse flow near the hub, as shown in Figure 14. Such reverse flow reduces the effective area of the diffuser passage, hindering pressure recovery, and leading to lower local Cp,d values at ϕ/ϕd = 0.4, as shown in Figure 12.
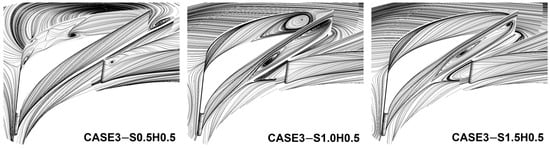
Figure 15.
Surface streamlines on diffuser surface at ϕ/ϕd = 0.4 for different shroud side clearances of CASE3.
6. Conclusions
This work investigated the effects of the side-gap flow between the impeller and diffuser on the performance and the flow characteristics of a centrifugal pump using three-dimensional steady-state RANS analysis. Different radial clearances on the shroud and hub sides (0.5 mm, 1.0 mm, and 1.5 mm) were applied to a one-dimensional leakage flow loss model. Then, the obtained values were used as inputs for the inlet conditions of annular leakage paths.
Among the tested cases for the validation, CASE2−S1.0H0.5 yielded results for the ϕ/ϕd−ψ and ϕ/ϕd−ζ curves that were quantitatively and qualitatively good agreements with the experimental data. Additionally, even though CASE1 failed to capture the velocity gradient near the shroud and hub regions, CASE2−S1.0H0.5 successfully predicted the incidence angle and radial velocity distribution at the diffuser inlet, further validating the numerical analysis method.
For the comparison between the cases for the flow through the impeller–diffuser side gap, the clearance of CASE3 was set to the same dimensions as CASE2−S1.0H0.5. The results of CASE3−S1.0H0.5 indicated lower ψ and higher ζ values, showing a tendency for decreasing η. The Cp,d values were similar to CASE1 in ϕ/ϕd > 0.6 but exhibited a positive slope in the ϕ/ϕd−Cp,d curve in ϕ/ϕd < 0.6. For CASE3−S1.0H0.5, a reverse flow near the hub developed and reduced the effective flow area in the diffuser passage, acting as a primary cause of the performance degradation in that region. Additionally, CASE3−S1.0H0.5 exhibited significant adverse pressure gradients and stagnation zones at the semi-vaneless regions. These were considered as major factors causing a reduction in the local Cp values and a steep decline in the ϕ/ϕd−Cp,d curve.
For CASE3, a variation in the flow rate by the shroud-side gap clearly affected the performance curves. In CASE3−S0.5H0.5, the performance and flow characteristics remained stable and the impact of the leakage flow was minimal. However, as the leakage flow rate increased, which is consistent with larger radial clearances on the shroud side (CASE2−S1.0H0.5 and CASE2−S1.5H0.5), all the performances deteriorated abruptly in ϕ/ϕd < 0.6 by backflow inside the diffuser passage. The performance variations due to the magnitude of leakage flow were found to be non-linear under specific flow rate conditions.
The findings of this study are expected to provide physical insights for personnel involved in the design or analysis of centrifugal pumps with impellers and diffusers. Future research will involve additional analyses to investigate the characteristics of leakage and internal flow based on the geometric parameters of the actual side chamber or disk cavity.
Funding
This research is funded by the new faculty Financial Program at Changwon National University in 2023. This research was supported by “Regional Innovation Strategy (RIS)” through the National Research Foundation of Korea (NRF) funded by the Ministry of Education (MOE) (2021RIS-003).
Data Availability Statement
The original contributions presented in the study are included in the article, further inquiries can be directed to the corresponding author.
Conflicts of Interest
The author declares no conflicts of interest.
Abbreviations
The following abbreviations are used in this manuscript:
| CFD | computational fluid dynamics |
| RANS | Reynolds-averaged Navier–Stokes analysis |
| SHF | Société Hydrotechnique de France |
| SST | shear stress transport |
References
- Cooper, P. A Vision and Mission for Pump R & D Over the Next 25 Years. In Proceedings of the 25th International Pump Users Symposium, Turbomachinery Laboratories, Texas A&M Engineering Experiment Station, Houston, TX, USA, 23–26 February 2009; pp. 1–12. [Google Scholar]
- Igor, J.P.M.; Karassik, J.; Cooper, P.; Heald, C.C. Pump Handbook, 4th ed.; McGraw-Hill: New York, NY, USA, 2008. [Google Scholar]
- Japikse, D.; Marscher, W.D.; Furst, R.B. Centrifugal Pump Design and Performance; Concepts ETI: Norwich, VT, USA, 1997. [Google Scholar]
- Inoue, M.; Cumpsty, N.A. Experimental Study of Centrifugal Impeller Discharge Flow in Vaneless and Vaned Diffusers. ASME J. Eng. Gas Turbines Power 1984, 106, 455–467. [Google Scholar] [CrossRef]
- Tamaki, H.; Nakao, H.; Saito, M. The Experimental Study of Matching Between Centrifugal Compressor Impellers and Diffuser. ASME J. Turbomach. 1999, 121, 113–118. [Google Scholar] [CrossRef]
- Gao, R.; Spakovszky, Z.; Rusch, D.; Hunziker, R. Area Schedule Based Design of High-Pressure Recovery Radial Diffusion Systems. ASME J. Turbomach. 2016, 139, 011012. [Google Scholar] [CrossRef]
- Shim, H.-S.; Kim, S.-H.; Kim, K.-Y. Analysis and optimization of staggered partial diffuser vanes in a centrifugal pump. ASME J. Fluids Eng. 2020, 142, 051207. [Google Scholar] [CrossRef]
- Arndt, N.; Acosta, A.J.; Brennen, C.E.; Caughey, T.K. Rotor–Stator Interaction in a Diffuser Pump. ASME J. Turbomach. 1989, 111, 213–221. [Google Scholar] [CrossRef]
- Shum, Y.K.P.; Tan, C.S.; Cumpsty, N.A. Impeller–diffuser interaction in a centrifugal compressor. J. Turbomach. 2000, 122, 777–786. [Google Scholar] [CrossRef]
- Zemp, A.; Abhari, R.S. Vaned diffuser induced impeller blade vibrations in a high-speed centrifugal compressor. J. Turbomach. 2012, 135, 021015. [Google Scholar] [CrossRef]
- Storer, J.A.; Cumpsty, N.A. Tip Leakage Flow in Axial Compressors. ASME J. Turbomach. 1991, 113, 252–259. [Google Scholar] [CrossRef]
- Jang, C.-M.; Sato, D.; Fukano, T. Experimental Analysis on Tip Leakage and Wake Flow in an Axial Flow Fan According to Flow Rates. ASME J. Fluids Eng. 2004, 127, 322–329. [Google Scholar] [CrossRef]
- Wu, H.; Miorini, R.L.; Katz, J. Measurements of the tip leakage vortex structures and turbulence in the meridional plane of an axial water-jet pump. Exp. Fluids 2010, 50, 989–1003. [Google Scholar] [CrossRef]
- Launder, B.; Poncet, S.; Serre, E. Laminar, transitional, and turbulent flows in rotor-stator cavities. Annu. Rev. Fluid Mech. 2010, 42, 229–248. [Google Scholar] [CrossRef]
- Lin, A.; Liu, G.; Yu, X.; Chang, R.; Feng, Q. Comprehensive investigations on fluid flow and heat transfer characteristics of a high-speed rotating turbine disk cavity system of aero-engine. Int. Commun. Heat Mass Transf. 2022, 136, 106170. [Google Scholar] [CrossRef]
- Roy, R.P.; Devasenathipathy, S.; Xu, G.; Zhao, Y. A Study of the Flow Field in a Model Rotor-Stator Disk Cavity. In Proceedings of the ASME 1999 International Gas Turbine and Aeroengine Congress and Exhibition. Volume 3: Heat Transfer; Electric Power; Industrial and Cogeneration, Indianapolis, IN, USA, 7–10 June 1999. V003T01A064. ASME. [Google Scholar]
- Kurokawa, J.; Sakura, M. Flow in a narrow gap along an enclosed rotating disk with through-flow. JSME Int. Journal. Ser. Fluids Eng. Heat Transf. Power Combust. Thermophys. Prop. 1988, 31, 243–251. [Google Scholar] [CrossRef]
- Zhang, S.; Li, H.; Xi, D. Investigation of the integrated model of side chamber, wear-rings clearance, and balancing holes for centrifugal pumps. J. Fluids Eng. 2019, 141, 101101. [Google Scholar] [CrossRef]
- Kye, B.; Park, K.; Choi, H.; Lee, M.; Kim, J.-H. Flow characteristics in a volute-type centrifugal pump using large eddy simulation. Int. J. Heat Fluid Flow 2018, 72, 52–60. [Google Scholar] [CrossRef]
- Zhai, L.; Lu, C.; Guo, J.; Zhu, Z.; Cui, B. Flow Characteristics and Energy Loss of a Multistage Centrifugal Pump with Blade-Type Guide Vanes. J. Mar. Sci. Eng. 2022, 10, 180. [Google Scholar] [CrossRef]
- Babayigit, O.; Ozgoren, M.; Aksoy, M.H.; Kocaaslan, O. Experimental and CFD investigation of a multistage centrifugal pump including leakages and balance holes. Desalination Water Treat. 2017, 67, 28–40. [Google Scholar] [CrossRef]
- Guinzburg, A.; Brennen, C.E.; Acosta, A.J.; Caughey, T.K. Experimental Results for the Rotordynamic Characteristics of Leakage Flows in Centrifugal Pumps. ASME J. Fluids Eng. 1994, 116, 110–115. [Google Scholar] [CrossRef]
- Zhou, W.; Ma, J.; Ma, Z.; Yu, W.; Su, H.; Gao, B. Fluid–structure interaction on the rotor-dynamic characteristics of a low-specific-speed centrifugal pump considering multi-scale fluid excitation effects. Phys. Fluids 2024, 36, 117157. [Google Scholar] [CrossRef]
- Gülich, J.F. Disk friction losses of closed turbomachine impellers. Forsch. Im Ingenieurwesen 2003, 68, 87–95. [Google Scholar] [CrossRef]
- Si, Q.; Dupont, P.; Bayeul-Lainé, A.-C.; Dazin, A.; Roussette, O.; Yuan, S. An Experimental Study of the Flow Field Inside the Diffuser Passage of a Laboratory Centrifugal Pump. ASME J. Fluids Eng. 2015, 137, 061105. [Google Scholar] [CrossRef]
- Liu, M.; Tan, L.; Cao, S. Theoretical model of energy performance prediction and BEP determination for centrifugal pump as turbine. Energy 2019, 172, 712–732. [Google Scholar] [CrossRef]
- ANSYS. ANSYS CFX-Solver Theory Guide-Release 15.0; ANSYS: Canonsburg, PA, USA, 2014. [Google Scholar]
- Menter, F.R. Two-equation eddy-viscosity turbulence models for engineering applications. AIAA J. 1994, 32, 1598–1605. [Google Scholar] [CrossRef]
- Barth, T.; Jesperson, D. The design and application of upwind schemes on unstructured meshes. In Proceedings of the 27th Aerospace Sciences Meeting, Reno, NV, USA, 9–12 January 1989. AIAA Paper. [Google Scholar]
- Menter, F.R.; Kuntz, M.; Langtry, R. Ten years of industrial experience with the SST turbulence model. Turbul. Heat Mass Transfer. 2003, 4, 625–632. [Google Scholar]
- Celik, I.; Karatekin, O. Numerical Experiments on Application of Richardson Extrapolation with Nonuniform Grids. ASME J. Fluids Eng. 1997, 119, 584–590. [Google Scholar] [CrossRef]
- Marsan, A.; Trebinjac, I.; Coste, S.; Leroy, G. Influence of Unstead iness on the Control of a Hub-Corner Separation Within a Radial Vaned Diffuser. ASME J. Turbomach. 2015, 137, 021008. [Google Scholar] [CrossRef]
- Deniz, S.; Greitzer, E.M.; Cumpsty, N.A. Effects of Inlet Flow Field Conditions on the Performance of Centrifugal Compressor Diffusers: Part 2—Straight-Channel Diffuser. ASME J. Turbomach. 1998, 122, 11–21. [Google Scholar] [CrossRef]
- Sano, T.; Yoshida, Y.; Tsujimoto, Y.; Nakamura, Y.; Matsushima, T. Numerical study of rotating stall in a pump vaned diffuser. J. Fluids Eng. 2002, 124, 363–370. [Google Scholar] [CrossRef]
- Shim, H.-S.; Kim, K.-Y. Relationship between flow instability and performance of a centrifugal pump with a volute. ASME J. Fluids Eng. 2020, 142, 111208. [Google Scholar] [CrossRef]
Disclaimer/Publisher’s Note: The statements, opinions and data contained in all publications are solely those of the individual author(s) and contributor(s) and not of MDPI and/or the editor(s). MDPI and/or the editor(s) disclaim responsibility for any injury to people or property resulting from any ideas, methods, instructions or products referred to in the content. |
© 2025 by the author. Licensee MDPI, Basel, Switzerland. This article is an open access article distributed under the terms and conditions of the Creative Commons Attribution (CC BY) license (https://creativecommons.org/licenses/by/4.0/).