Article

Energy-Saving Design Strategies for Industrial Heritage in Northeast China Under the Concept of Ultra-Low Energy Consumption

by
Shiqi Yang
1,
Hui Ma
1,*,
Na Li
2,
Sheng Xu
1 and
Fei Guo
1
1
School of Architecture and Fine Art, Dalian University of Technology, Dalian 116024, China
2
Design Institute of Civil Engineering & Architecture of Dalian University of Technology Co., Ltd., Dalian 116023, China
*
Author to whom correspondence should be addressed.
Energies 2025, 18(5), 1289; https://doi.org/10.3390/en18051289
Submission received: 7 January 2025 / Revised: 3 March 2025 / Accepted: 4 March 2025 / Published: 6 March 2025
(This article belongs to the Special Issue Advanced Research on Heat Exchangers Networks and Heat Recovery)

Abstract

:
Countries around the world have developed standards for ultra-low energy consumption building design and future plans. Unfortunately, these standards lack specific requirements for industrial heritage. As an important carrier of urban context, history, and the transmission of residents’ memories, industrial heritage cannot be overlooked in urban development. This study uses DesignBuilder energy simulation software to model industrial heritage (taking the Changchun Tractor Factory as an example) and compares the energy consumption before and after renovation strategies. The results show that in the Case 4 plan, after implementing the renovation strategy, heating energy consumption can be reduced by about 11,648 (kWh/m2) over the heating season, the total primary energy was reduced by about 4 million (kgce/tce), and total energy consumption decreases by approximately 95%. This demonstrates the effectiveness of the industrial heritage reuse design strategy proposed in this paper. It provides a new direction for reuse design under ultra-low energy consumption requirements in related case studies.

1. Introduction

The global building roadmap released by the International Energy Agency (IEA) aims to achieve zero emissions for new and existing buildings gradually from 2020 to 2050 [1]. Governments worldwide have prioritized the building sector’s focus on low carbon and ultra-low energy consumption. In March 2024, the Central Committee of the Communist Party of China and the State Council issued the Opinions on Accelerating the Comprehensive Green Transformation of Economic and Social Development, which stated that ultra-low-energy buildings in China are expected to achieve large-scale development by 2027. It emphasized that advancing green and low carbon development in urban and rural areas should begin with a strong focus on the development of ultra-low-energy buildings [2]. Globally, 39% of carbon emissions originate from the construction industry and buildings themselves. The issues of energy consumption and sustainability in buildings have become focal points for countries worldwide [3,4]. Various nations have established standards and regulations for energy-efficient, low-energy, and green buildings. Unfortunately, these standards lack specific considerations for industrial heritage [5].
The first project for the conservation and adaptive reuse of industrial heritage was the Ironbridge Gorge in the UK, repurposed in the 1960s [6]. In fact, the process of protecting industrial heritage evolved from architectural heritage. As such, like architectural heritage, it is essential to the development of a city, as it symbolizes and represents the historical period of the past [7]. However, extending the lifespan of industrial heritage and sustaining its historical and cultural value requires consideration of not only the impacts and limitations of traditional codes [5], the influences of sustainability requirements [8], and regional differences [7,9], but also energy consumption [10] and the balance between conservation and reuse [11]. Among these influencing factors, aligning with current global energy development requirements, the greatest and most pressing issue is achieving low energy consumption and ultra-low energy consumption.
However, a review of existing research literature reveals a significant lack of studies and practices related to low energy consumption and ultra-low energy consumption in the context of architectural heritage, particularly in the field of industrial heritage, which undoubtedly hinders the conservation and sustainable development of industrial heritage severely [12]. In addition, a disconnect exists between China’s industrial heritage reuse cases and the critical international and domestic strategic objectives, such as carbon peaking and sustainable development. It is a significant risk to the full lifecycle utilization of industrial heritage. The research on the energy consumption aspects of industrial heritage still has large gaps. On one hand, since most early industrial buildings were constructed to meet the needs of industrial production at minimal cost, their envelope structures were designed with the lowest standards for insulation and heating. Therefore, such buildings are inherently vulnerable in terms of energy-saving. On the other hand, industrial heritage is an important and continuous branch of the architectural field, which cannot be overlooked.
In addition, building simulation and computational technologies have been widely applied in architectural design for decades [13]. Building energy simulation tools have consistently assisted architects, designers, engineers, and researchers in identifying the most suitable and the most cost-effective energy-saving measures to reduce and optimize building energy consumption during the design, construction, and operation phases [14]. Currently, these software tools have become critical in the design phase of energy-efficient buildings [15]. Among them, DesignBuilder, as one of the most comprehensive energy simulation software tools, ranks among the top three in terms of usage frequency [16].
In summary, given the research gaps regarding industrial heritage under the concept of ultra-low energy consumption, the urgent need for renewal, and the alignment with sustainable development goals, this study proposes a novel reuse strategy based on the current status and needs of representative cases. DesignBuilder energy simulation software is utilized to conduct comparative studies of reused plans under different strategies. This research employs a combination of the Case Study Method, Simulation Analysis Method, and Comparative Analysis Method. By integrating theory and case studies, as well as qualitative analysis and quantitative simulations, this study develops instructive reuse strategies. Furthermore, the effectiveness and applicability of these strategies are demonstrated through scientific simulations and data validation methods. The main goals of this study are as follows:
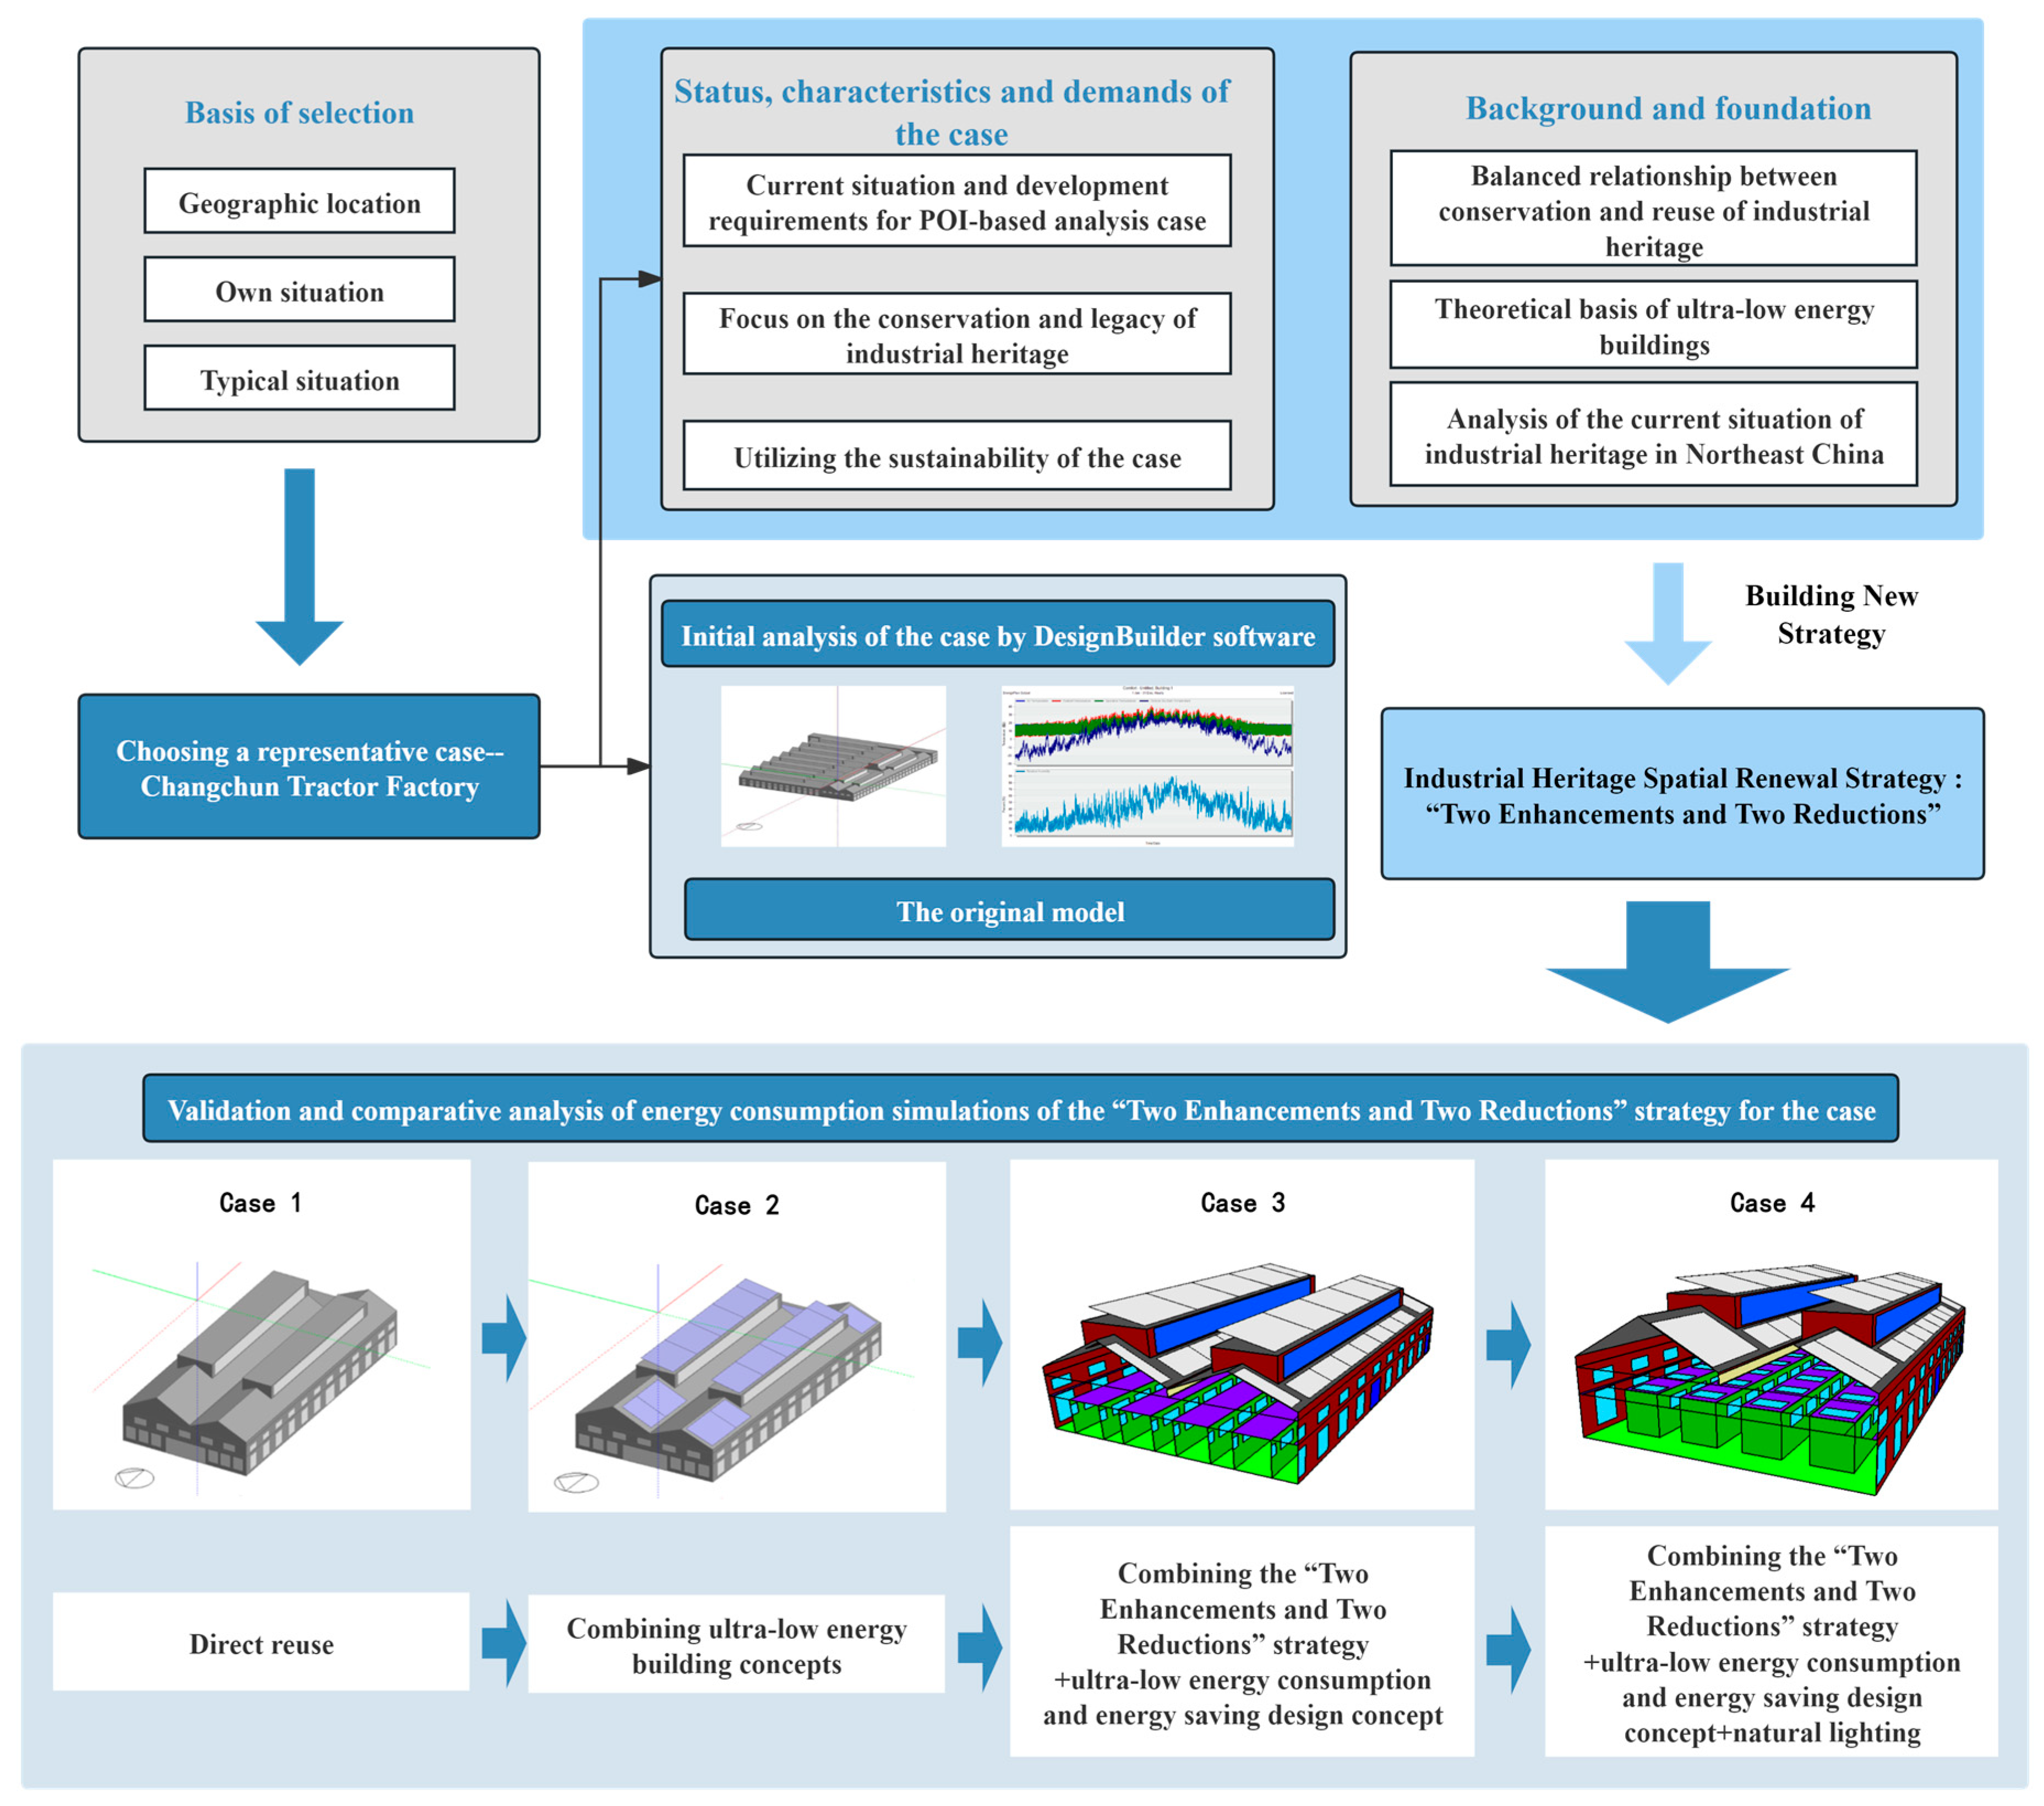
  • To investigate the current energy consumption status and energy-saving potential of industrial heritage buildings in Northeast China using DesignBuilder energy simulation software.
  • To propose the “Two Enhancements and Two Reductions” design strategy, which balances ultra-low energy consumption design principles with the imperative to conserve and adaptively reuse industrial heritage structures.
  • To verify the effectiveness of the “Two Enhancements and Two Reductions” strategy and demonstrate its potential for achieving ultra-low energy consumption in practice.

2. State of the Art

2.1. Ultra-Low-Energy Buildings

Ultra-low-energy buildings are a subset of green buildings, a concept that can be traced back to the energy crisis following World War II [17]. In 1969, Italian architect Paolo Soleri first introduced the concept of “arcology”, or ecological architecture [18]. In 1976, Torben V. Esbensen conducted theoretical and experimental research on using solar energy for building heating, proposing the concept of “zero-energy buildings” for the first time [19]. In 1990, the British Building Research Establishment introduced the world’s first green buildings assessment method, Building Research Establishment’s Environmental Assessment Method (BREEAM), marking a significant step toward the formalization of green buildings practice [20]. In 1991, German physicist Wolfgang Feist constructed the first “Passive House”, initiating extensive research into green buildings development worldwide [21]. In 2006, the UK proposed the concept of low-carbon buildings and introduced the goal of “zero-carbon homes”, propelling the advancement of low-carbon and zero-carbon buildings [22]. By 2010, Germany raised the energy-saving standards for buildings, combining low-energy building standards with passive house standards and introducing the concept of ultra-low-energy buildings. These architectural concepts originated from global energy crises, climate change, and the need for sustainable development. As a result, building standards in different countries have evolved into distinct systems and regulations worldwide [17,23,24]. In China, the development of green buildings began with energy-saving. Since the standard of its first design standard in 1986, the central and local governments have issued hundreds of building energy-saving codes, revising many standards regularly [25,26,27]. The evolution and derivation of these related concepts have been complex and lengthy, but they remain interconnected and share commonalities. The relationships between some of these concepts are illustrated in Figure 1.

2.2. Reuse of Industrial Heritage

As early as 1965, UNESCO proposed the establishment of the International Council on Monuments and Sites (ICOMOS) [28], initiating global attention to the conservation and adaptive reuse of architectural heritage. Currently, 168 countries are signatories to ICOMOS, with the ranking of countries by the number of World Heritage Sites shown in Figure 2 (Data from ICOMOS official website) [29]. Among them, Italy, China, Germany, France, and Spain occupy the top five positions. Notably, among these top five countries, all except China include industrial heritage within their World Heritage Sites. Examples include Italy’s Rhaetian Railway and the 20th-century industrial city of Ivrea; Germany’s Völklingen Ironworks; France’s Nord-Pas de Calais Mining Basin; and Spain’s Almaden mercury mining area. Additional examples include Belgium’s Major Mining Sites of Wallonia, Japan’s Tomioka Silk Mill, and the United Kingdom’s famous Ironbridge Gorge. This highlights the insufficient conservation and utilization of industrial heritage in China. However, this does not imply a severe lack of industrial heritage in China. On the contrary, China possesses a significant amount of industrial heritage.
China’s industrial development started relatively late. However, for a significant period after 1949, the country’s economy was primarily driven by heavy industry, light industry, and handicrafts [30]. With the continuous advancement of technology and urban development, the transformation of former industrial cities has become inevitable in the face of urban and architectural renewal. Within these cities, a large amount of industrial heritage has been preserved, serving as a new type of historical and cultural reserve resource for urban development, which is significant and cannot be overlooked [31,32,33].
The research on ecological architecture, ecological conservation, and architectural site preservation originated in the 1960s. Subsequently, studies on ecological architecture in various countries gradually diversified, giving rise to fields such as building carbon emissions and energy-saving technologies. Around the same time, research on industrial heritage began to emerge as an independent discipline from the broader category of architectural heritage, with architects and researchers extensively debating the issues of preservation versus renewal. However, it was not until the 1980s that energy-saving technologies were first applied to architectural heritage, while B. Jankovich et al. retrofitted passive and active solar energy systems and cooling systems suitable for architectural heritage [34]. From that point onward, the conservation and reuse of architectural and industrial heritage started to address energy consumption issues, as shown in Figure 3.

2.3. Selection of Energy Simulation Software

In the 1970s, the United States took the lead in developing energy simulation software, the BLAST and DOE-2. Subsequently, the United Kingdom developed BREDEM, China created DeST, and Japan produced HASP. By the end of the 20th century, many European countries had also developed their own building energy simulation software, as shown in Figure 4 [35]. Although there are more than 30 types of energy simulation software globally, after 50 years of updates and eliminations, a relatively mainstream selection has emerged. Choosing software suitable for the specific project has become an essential step in the research process. A comparison of these tools is shown in Table 1.
Attia, Shady conducted a comparative analysis of mainstream building energy simulation tools in the early 21st century, evaluating them from five aspects: usability, intelligence, accuracy, process suitability, and interoperability. Among these, DesignBuilder demonstrated the best overall performance [35]. Sağdıçoğlu, M. S., using Vosviewer and Bibliometrix tools, performed bibliometric analyses on the usage of energy simulation software, revealing that DesignBuilder ranked first in terms of usage frequency [36]. Haidong Wang et al. found that DesignBuilder integrates environmental simulation with building energy modeling, constructing an integrated simulation program that significantly enhances the accuracy of predictions for thermal and flow behaviors [37]. Subsequently, more scholars began utilizing DesignBuilder to simulate and calculate various building components. Piero Bevilacqua et al. used DesignBuilder to evaluate the performance of new envelope materials [38]. M.M. Rahman et al. compared energy-saving under various HVAC systems and high COP chiller investment strategies using the software [39]. Yang Liu et al. explored the relationship between the window/wall ratio and energy consumption [40]. Meanwhile, A. Goenaga-Pérez et al. conducted simulations to verify whether Spain’s nZEB standards are applicable to the various regional climate conditions within the country [41]. Moreover, DesignBuilder has demonstrated extensive applicability in energy simulation and is widely employed in studies analyzing overall building energy performance [42,43,44]. Based on previous research, DesignBuilder simulation software is applicable to almost all types of buildings. In summary, given DesignBuilder’s applicability and precision in simulating building energy consumption, this study selects DesignBuilder as the software for representative case simulation and analysis.

3. Methods and Strategies

3.1. Experiment Overview
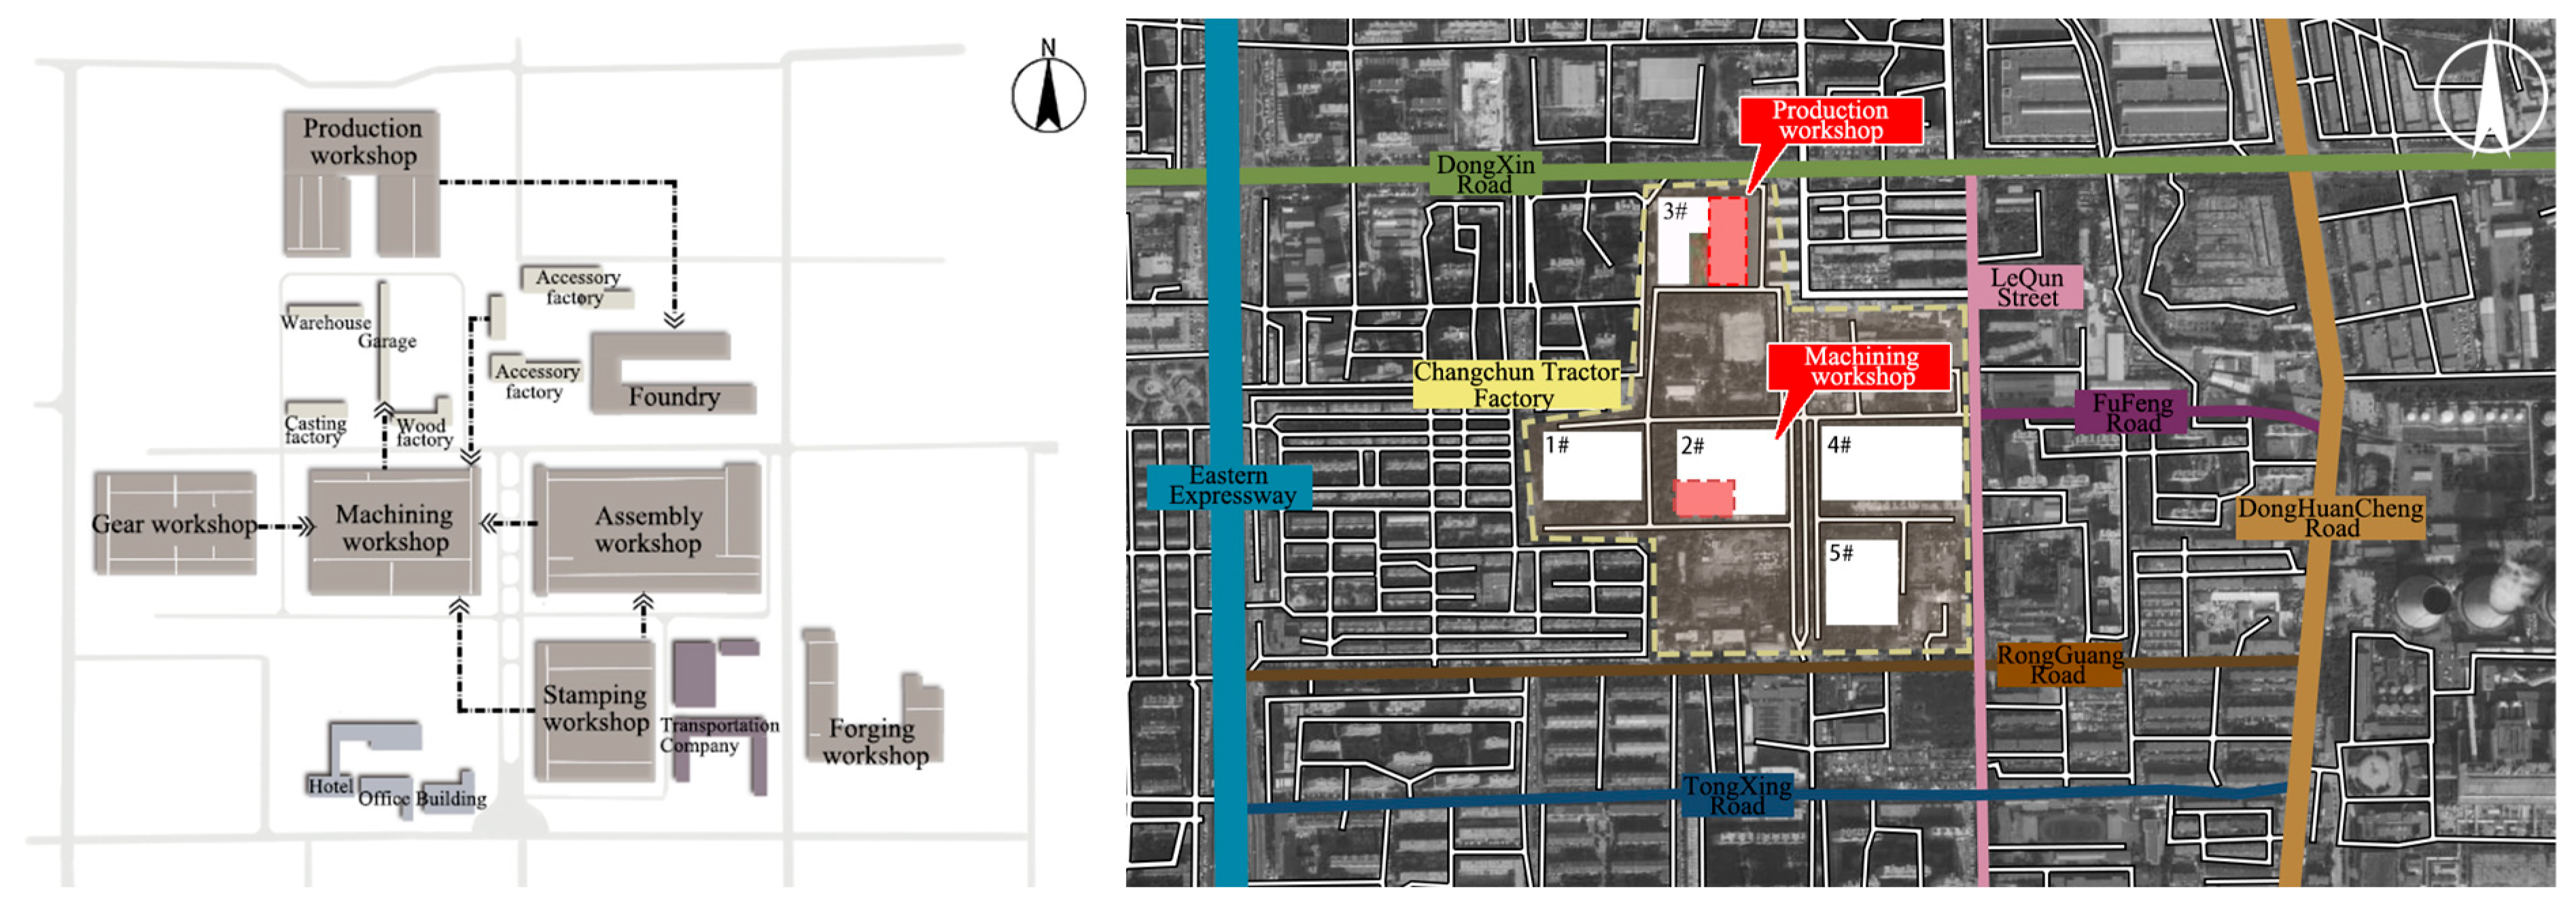
This study focuses on ultra-low energy consumption and energy-saving to address the practical conditions of industrial heritage. We comprehensively consider sustainable development, urbanization, technological progress, adaptive reuse, social needs, and ecological balance to explore more suitable reuse strategies, providing reference and direction for the development and reuse of industrial heritage. The flowchart of this study is illustrated in Figure 5: Firstly, based on a comprehensive analysis of geographical location, specific conditions, and typical characteristics, the Changchun Tractor Factory in Changchun, Jilin Province, is selected as the research subject. Subsequently, the original case is simulated and analyzed to evaluate its current features, surrounding context, and urban development demands, forming a “Two Enhancements and Two Reductions” design strategy tailored to industrial heritage reuse. Finally, using this strategy, four schemes are developed for the case. These schemes are then subjected to comparative analysis and validation calculations using DesignBuilder (v 7.0.2) software to determine the potential of the strategy for achieving ultra-low energy consumption.

3.2. The Case Study

Among the list of old industrial bases released in China, there are 95 prefecture-level cities, 23 of which are located in Northeast China (Including Heilongjiang, Jilin, and Liaoning Provinces), accounting for 24.2% of the total. Within the “156 Projects” of the “First Five-Year Plan” implemented in the early years of the People’s Republic of China, Northeast China hosted 56 projects, accounting for 35.9% of the total, as shown in Figure 6. Additionally, the three provincial capitals in Northeast China are all key cities for revitalizing old industrial bases [45]. As a critical area for the old industrial base revitalization, Northeast China, compared to other regions of the country, has undergone more profound industrial transformations, shifts in dominant sectors, adjustments in industrial structures, urban development demands, and significant policy changes. These factors have resulted in a larger number of abandoned or underutilized industrial heritage resources in need of renewal and reuse. Furthermore, Northeast China belongs to the severe cold B and C zones in China’s building thermal design classification, making it the coldest region in the country. Its unique geographical and climatic conditions are also among the critical factors influencing energy consumption.
China’s Ministry of Housing and Urban-Rural Development has divided thermal design zones into primary levels based on the coldest average temperatures and secondary levels based on heating degree days, as shown in Table 2 [46]. Most cities in the northeastern region fall under the severe cold zone, with cities in the severe cold zones B and C accounting for 72.5% of the total cities in the northeast, as indicated in Table 3. The northeastern region, located in the northern part of China, is one of the coldest areas in the country. Moreover, the cold climatic conditions are a critical factor in building energy consumption, directly resulting in heating energy use being the highest throughout a building’s lifecycle. Therefore, selecting a representative case from the cold northeastern region, which also has the highest concentration of industrial heritage in China, adds significant value to the development of energy consumption research for industrial heritage. Among the three provincial capitals in the northeast, Changchun is centrally located, and its thermal design zone is classified as severe cold zone C, representing a midpoint within the thermal zoning range of all northeastern cities. Consequently, this study selects industrial heritage in Changchun as a representative case.
Through field research on the present situation of industrial heritage in the region, the following was found: First, most industrial buildings were constructed with assistance from the former Soviet Union, showing specific characteristics of that era. Second, northeast China primarily had developed heavy industry, resulting in most industrial sites containing similar large-span factory buildings. Third, due to the rapid development of heavy industrial areas in Northeast China during the early years of the People’s Republic of China, many of the industrial heritage sites in this region are located in relatively favorable geographical positions. And some projects are even located in city centers, meaning that their abandonment or demolition would impose a burden on surrounding residents and the environment [30].
Based on the background conditions, a comparative analysis of the existing industrial heritage in the Changchun region was conducted. Ultimately, a tractor factory located in the Erdao District (within the Second Ring Road) of Changchun was selected as the representative industrial heritage case. This selection was made because the site is situated in the city center, making it urgently in need of renovation. Additionally, most industrial heritage sites in the area are large-space factory buildings, which are the most prevalent and representative building type among industrial heritage sites in Northeast China. Established in 1958, the factory covers an area of 26.9 km2 and was once the largest production base for wheeled tractors in China [47]. Over more than half a century of development, the surrounding area of the case study has transitioned to residential and educational land use. However, the site itself is still in a vacant situation, representing not only a waste of land resources but also a disconnection from the functional integration of the surrounding areas. This situation urgently calls for improvement.
It is worth noting that partial demolition and renovation have been carried out on the No. 3 Production Workshop within the factory site, while the other workshops remain vacant. Notably, the No. 2 Machining Workshop, located at the core of the factory, holds a superior geographical position and sunlight intensity compared to other workshops in the area. At present, it is being used as a temporary parking lot. We focus on conducting simulation calculations and reuse design for the overall structure of the No. 2 Machining Workshop and its A space. Based on the status analysis and development needs outlined in Section 3.3, the renovation is primarily focused on commercial use. Thermal zone setup is detailed in Section 3.5. The historical site layout is shown in Figure 7 (left), while the current site layout is depicted in Figure 7 (right). The current condition of the No. 2 Processing Workshop is illustrated in Figure 8.

3.3. Model Construction and Simulation Settings

Based on the analysis in Section 2.2, the selected representative building—Factory No. 2—was originally a machining workshop located at the center of the Changchun Tractor Factory area. Surrounded by internal factory roads, it has a building area of 18,300 m2, a total building length of 154 m, a total building width of 119.2 m, and an average interior clear height of 8 m. For various reasons, it is still unused and temporarily utilized as a parking space. Its structural form combines reinforced concrete columns with a prefabricated steel roof truss, categorized as a row of reinforced concrete column structures. Through field surveys and investigations, we redrew the floor plan and section of Factory No. 2, as shown in Figure 9. Subsequently, a model was constructed in DesignBuilder based on the measurement results.
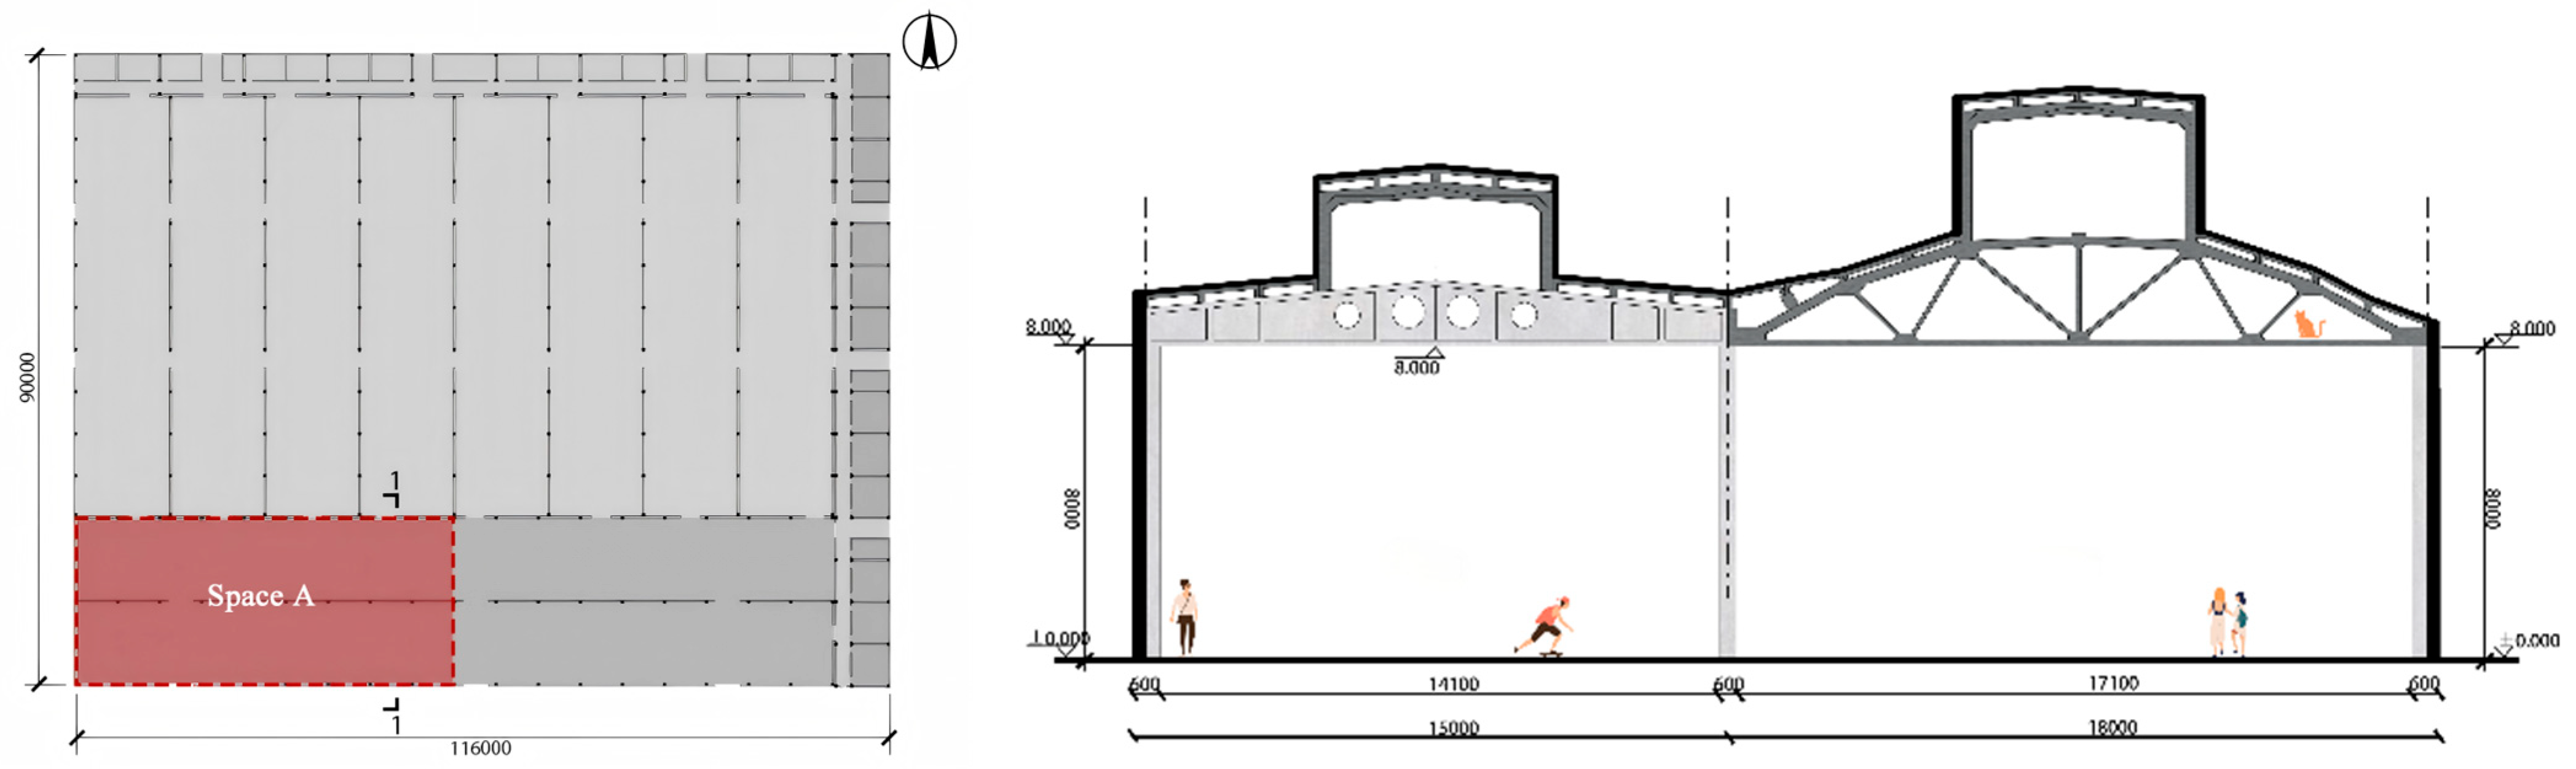
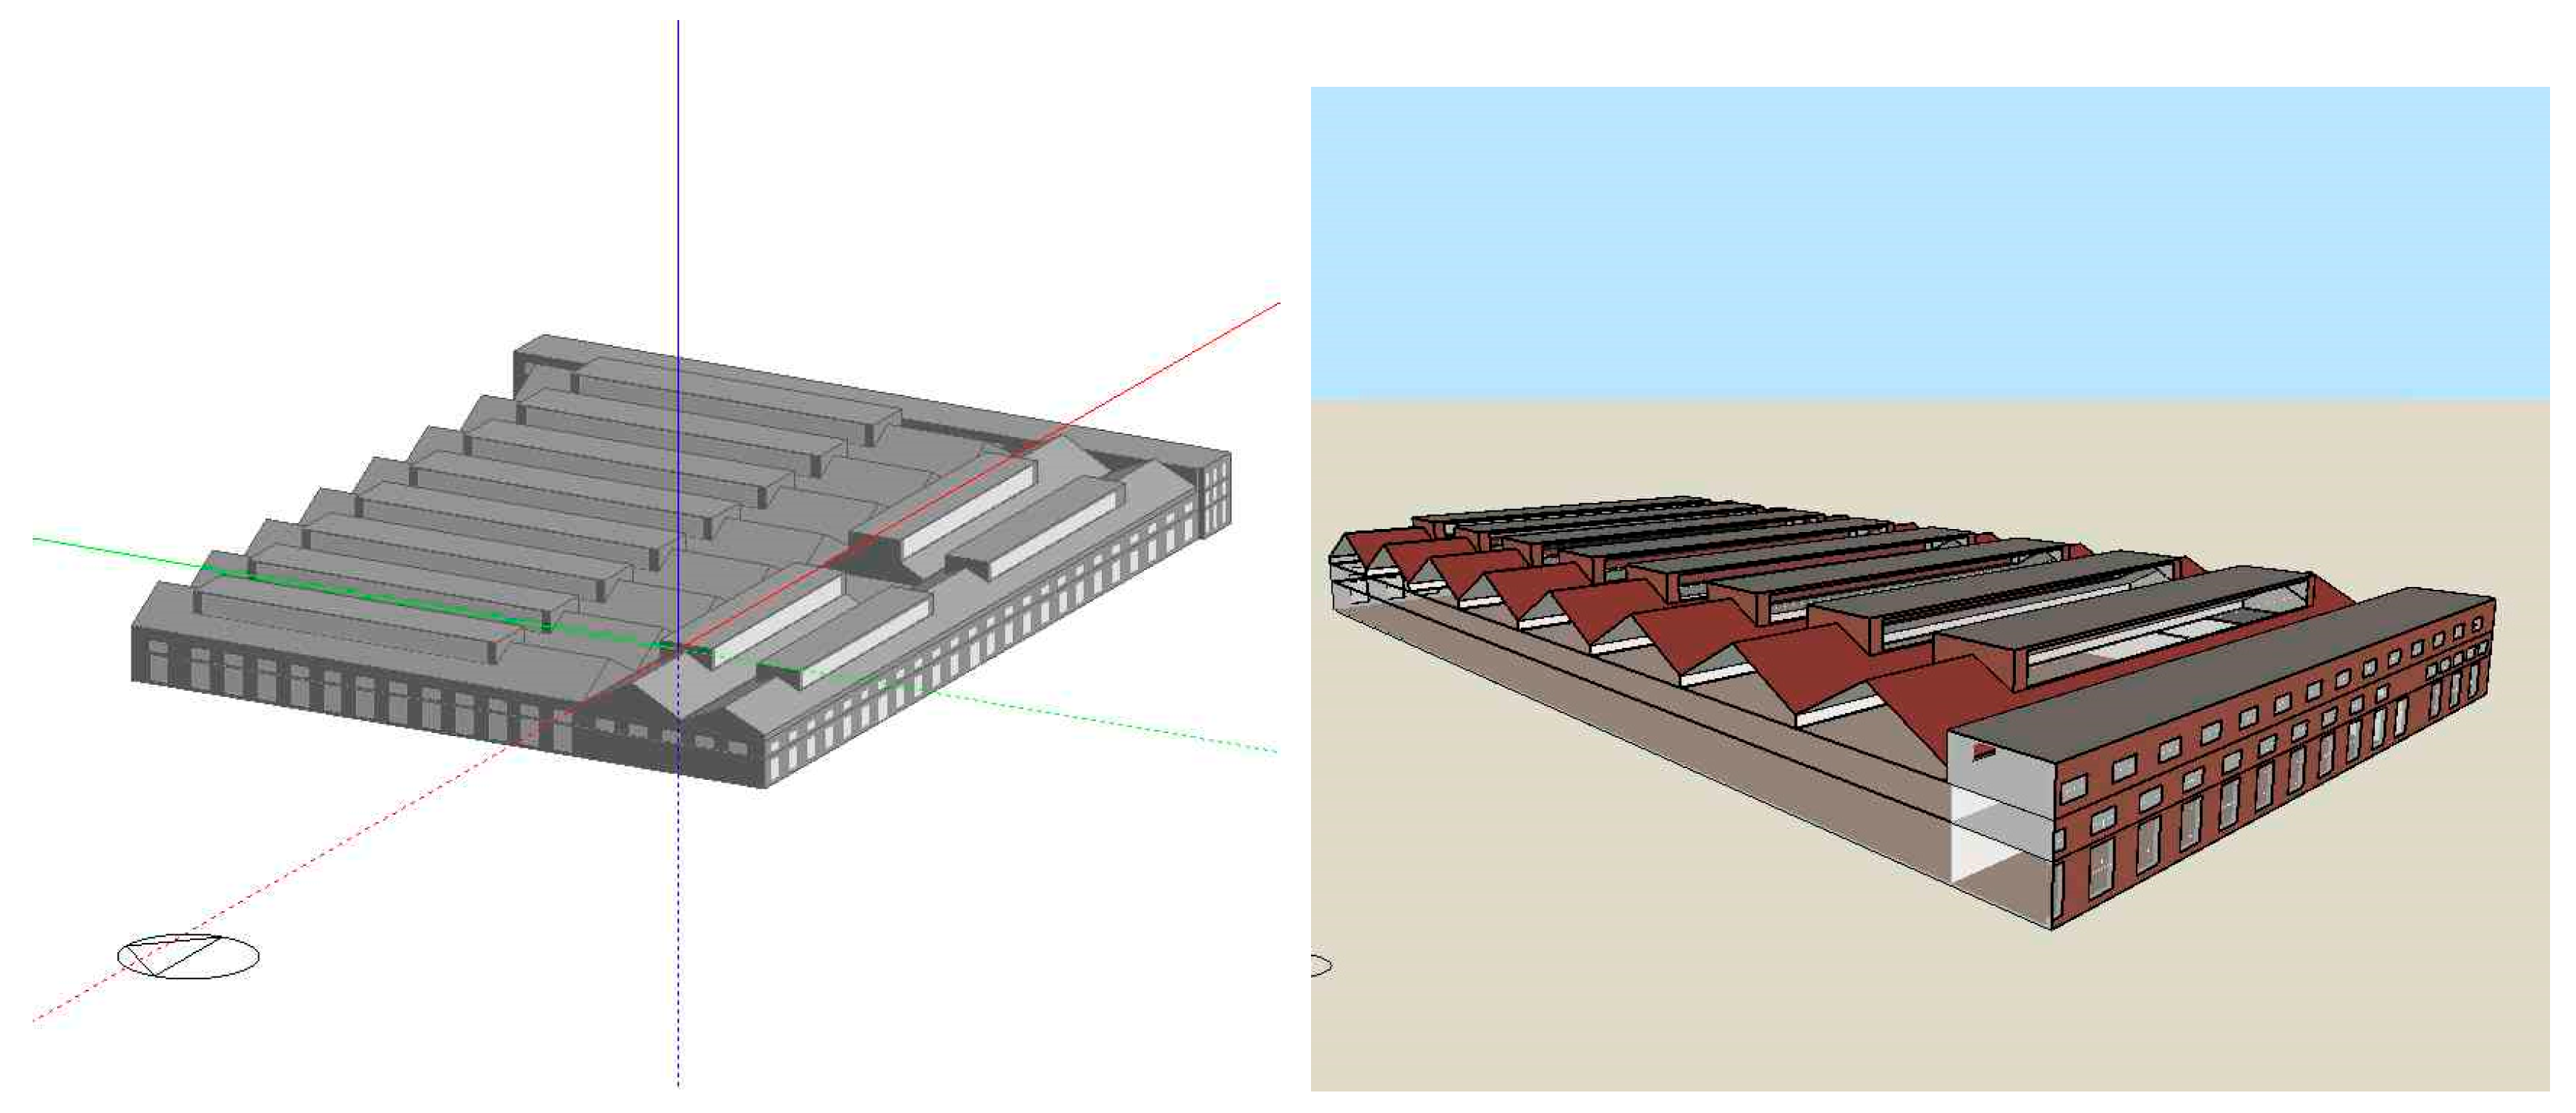
  • Construction and Glazing Template: Factory No. 2 exhibits distinct characteristics of an industrial factory building in terms of structural form and internal space. According to China’s Code for Thermal Design of Civil Buildings (GB50176-2016) [46], the external opaque envelope consists entirely of 490 mm-thick red brick walls, is lightweight mortar masonry clay brick with a thermal conductivity of 0.76 (W/m·K), and exposed both internally and externally. The transparent envelope consists of double-layer ordinary glass, with a thermal conductivity of 0.76 (W/m·K). The roof is composed of prefabricated concrete slabs combined with composite steel plates. The thermal conductivity of the concrete slab is 1.74 (W/m·K), while that of the composite steel plate is approximately 0.04 (W/m·K). And the roof skylights are made of non-operable single-layer ordinary glass. Based on these features, the corresponding original structural model was established as shown in Figure 10.
  • Climatic Conditions: The project is located in Changchun, the capital city of Northeast China, classified as a Severe Cold Zone C in China’s building thermal design zoning. The annual total solar radiation on a horizontal plane is 5000 MJ/m2, with an average annual outdoor temperature of 4.9 °C. The climate here is short and warm in summers, while cold and long in the winters, and there are significant daily temperature variations in spring and autumn. DesignBuilder software supports the CSWD’s (Chinese Standard Weather Data) weather database, which was developed by Dr. Jiang Yi, Department of Building Science and Technology at Tsinghua University and China Meteorological Bureau, and calculates heating and cooling loads using the heat balance method [48,49]. Therefore, the meteorological data of the Changchun area in the CSWD database selected for this project, detailed information, and outdoor temperature changes are shown in Table 4.
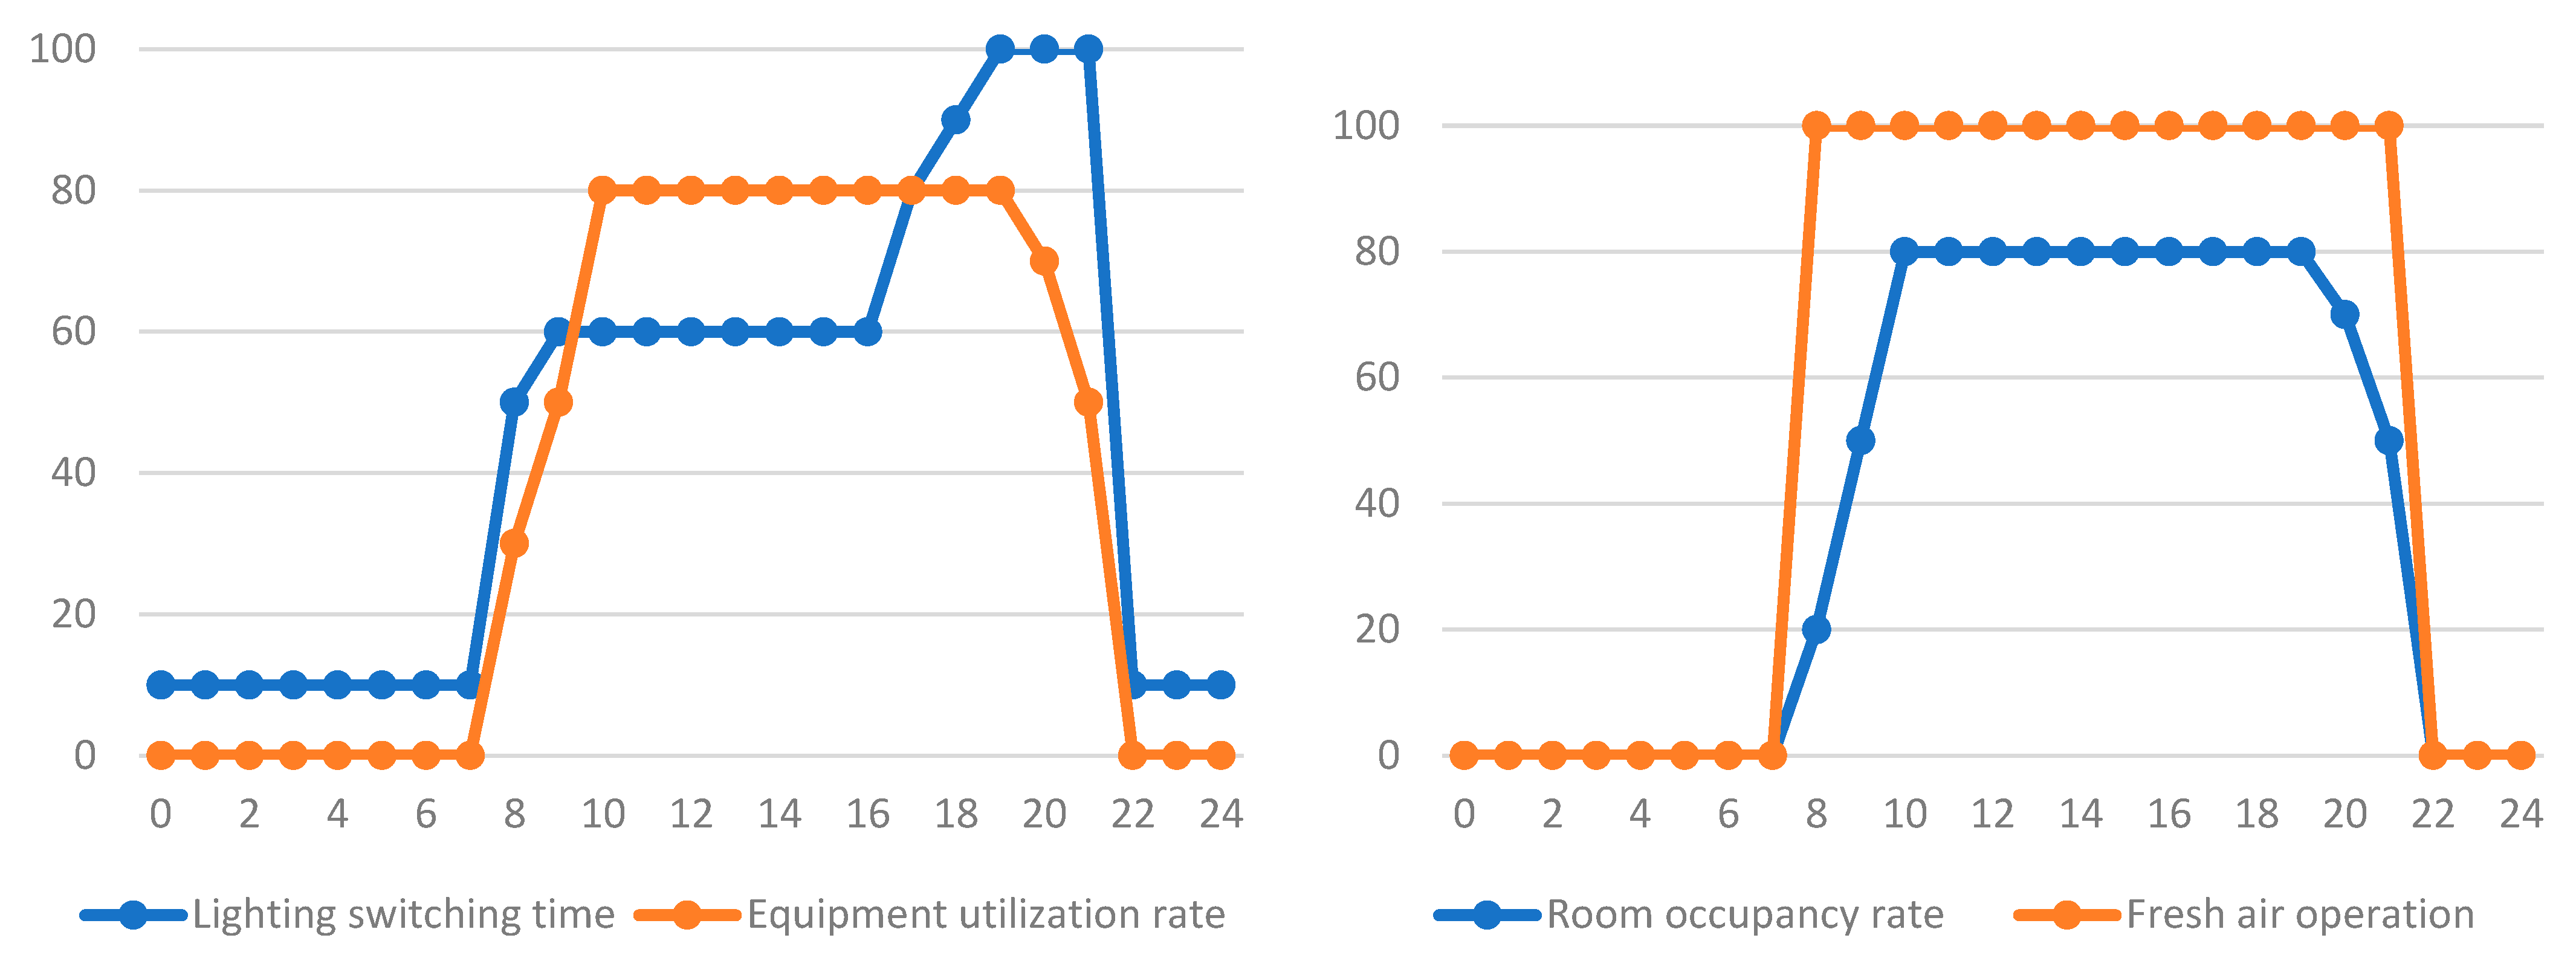
  • Activity Template: This study combines the Design Standard for Energy Efficiency of Public Buildings by Jilin Province (energy efficiency 72%) (DB22/T 5160-2024) [50], the Design standard for Green Building by Jilin Province (DB22/T 5055-2021) [51], and other standards. Additionally, the surrounding Points of Interest (POIs) were considered and analyzed. Based on this, the project is preliminarily defined with a focus on a cultural and creative business and educational template, supported by flexible structural forms, to expand the building’s adaptability and enhance its sustainability, thereby meeting more diverse user needs. The time-by-time parameterization for various types of room use requirements are shown in Figure 11.
  • Other Templates: During the previous use of the factory building, the indoor temperature was maintained at the minimum standard to prevent freezing, primarily due to the heat generated by machinery, technical limitations, and cost-saving considerations. Human comfort limits and other requirements were not taken into account. Field investigations revealed that the building was originally equipped with a boiler heating system but lacked an air conditioning system. Therefore, the original model parameters exclude mechanical ventilation and cooling systems. Based on the average temperature during the heating period in Changchun, the heating temperature was set to 24 °C. The heating time was set to the annual heating cycle schedule of Changchun from October 20 of each year to April 6 of the following year.
The DesignBuilder software calculates heating and cooling loads based on the ASHRAE-approved heat balance method in EnergyPlus. Below are some commonly used ASHRAE heating and cooling load calculation formulas, which are used to determine the heating or cooling capacity required for a building [13].
The overall cooling load calculation formula is as follows:
Q = U × A × C L T D
Here, Q is the cooling load (W); U is the conduction heat flow of the building shell (W/m2 K); A is the surface area (m2); and CLTD is the color decorated temperature difference (K).
The overall heat load calculation formula is as follows:
Q = u × A × ( T )
Here, Q is the heat load (W); U is the conduction heat flow of the building shell (W/m2 K); A is the surface area (m2); and ∆T is the temperature difference (K).

3.4. Building a Reuse Strategy

3.4.1. Analysis of Current Situation

This study explores the reuse of industrial heritage under ultra-low energy consumption theories, emphasizing the conservation of the historical value of the building envelope while integrating new eco-friendly materials and low-energy technologies. The analysis is conducted from the following three views:
  • Current status and development needs of the Changchun Tractor Factory surrounding: A data analysis was performed on six categories of POIs (Points of Interest) within a 5 km radius of the Changchun Tractor Factory, using data sourced from Gaode Map [52]. The project samples were visualized and organized into a dataset using Kepler.gl software, as illustrated in Figure 12. It can be observed that education categories in this area are distributed very densely, followed by sports categories and mall categories. Additionally, the data obtained from POIs after data analysis are shown in Table 5. To verify the accuracy of the data, we used the triple standard deviation method, and the guidelines were shown as follows:
Data Di (Deviation Average) that satisfy Di < 2σ are considered as normal; 2. Data Di that satisfy 2σ < Di < 3σ are considered early warning data, requiring expert assessment to determine their adherence to expectations; 3. Data that satisfy Di > 3σ are regarded as abnormal and necessitate re-collection and recalculation (σ is standard deviation) [53].
The results of the calculations are: σ = ±0.0309, 2σ = ±0.0619, and 3σ = ±0.0928. Based on the data computed in Table 5, it is evident that all of the data fall within two times the standard deviation range, and the validation passes. In order to make the data more readily available for statistical purposes, the results were normalized in this study. From the data in Table 5, it can be concluded that exhibition category and mall category have the highest share in the entire city, followed closely by education category, with only a small difference. Currently, after renovation of the Changchun Tractor Factory’s Building #3, it is primarily focused on shopping mall use, with the addition of multiple fitness and children’s entertainment facilities. In the update design for Building #2, this study takes into account the city’s evolution and development. The reuse of industrial heritage should prioritize long-term applicability and sustainability. By integrating the density and regional proportion data from POIs, this study ultimately focuses on the demand for education category, exhibition category, and some mall spaces.
2.
Key concerns for the conservation and inheritance of industrial heritage: The U.S. Department of the Interior, through discussions with experts, identified windows as a consistently significant element of historical buildings. This point has also been recognized in European countries, where windows are considered a unique and integral part of historical architecture, warranting maximum restoration and preservation efforts [54,55,56,57]. Consequently, this project focuses on protecting the external envelope and overall form, specifically preserving historically valuable windows, red brick walls, and building façades. Meanwhile, reuse strategies are applied to enhance the adaptability and flexibility of internal spaces [48].
3.
Sustainability of reuse projects: This study employs ultra-low energy concepts to reduce building energy consumption and extend the service life of the structure. However, due to the large spatial volume of factory buildings and the principle of preserving external enclosures, calculations using DesignBuilder indicate that achieving ultra-low energy performance while maintaining the existing enclosure is nearly impossible with current technologies. Consequently, this study incorporates the “loggias” retrofitting concept proposed by Reina Oki et al. from Waseda University in Japan [54,58] and combines it with the design of interior walking spaces, resulting in a sustainable, low-energy, and adaptable prefabricated design solution.
In addition, we learned from the design requirements outlined in China’s Code for Design of Underground Air Defense Shelters, which mandates a one-time conversion between peacetime and wartime functions [59]. This adaptable form addresses spatial limitations, technological evolution, and changing user needs. In summary, this study innovatively proposes the “Two Enhancements and Two Reductions” strategy for industrial heritage reuse design.

3.4.2. “Two Enhancements”: Increasing Functionality of Space and Diversity of Energy-Saving Materials

In terms of spatial functionality, after analyzing the spatial, structural, and regional characteristics of various industrial factory buildings, it is concluded that the reuse of industrial heritage can accommodate multiple service-oriented space functions: Under regular circumstances, it serves as a multi-school joint practice base integrating teaching, experimentation, and practical application, with additional spaces for cultural innovation business spaces; during summer and winter breaks and public holidays, it hosts exhibitions, sales events, or similar projects with commercial objectives to increase economic income, while under special requirements, it provides full dismantling capability to offer larger usable spaces when necessary. Accordingly, a variable structural design is adopted for the spatial layout, aiming to meet the requirements of different spatial volumes through flexibility and thereby enhancing utilization over time. Similarly, for other design parameters mandated by the codes, a full-coverage design is employed.
In terms of materials, new energy-saving products available on the market are selected. Research by Dorota Chwieduk has found that recent energy-saving materials—especially envelope materials—exhibit total heat transfer coefficients approximately 0.15–0.45 [W/(m2·K)] lower than those of traditional envelope materials, undoubtedly providing a better foundation for low-energy buildings [60]. The physical properties of building materials determine a building’s energy consumption [61]. In recent years, building materials have transitioned from traditional, singular options such as reinforced concrete and masonry to composite materials [62], laminated materials [63], and phase change materials [64]. Moreover, these new materials share the common characteristic of effectively reducing building energy consumption and carbon emissions. Therefore, in the structural system constructed under this strategy, the load-bearing frame utilizes prefabricated H-section steel beams and columns, offering excellent tensile and compressive strength while ensuring ease of construction and dismantling. For short-term non-removable walls, dual-cavity ultra-low energy light steel composite panels are employed, with a tested thermal conductivity value of 0.25 (W/m2 K), providing exceptional insulation, soundproofing, and measures to reduce thermal bridging. Movable walls are constructed using rock wool composite panels paired with perimeter steel tracks, achieving a thermal conductivity value of 0.41 (W/m2 K). These panels are lightweight, soundproof, and easily repositioned, enabling flexible spatial configurations. The glazing components feature triple-glass, two-cavity windows filled with inert gas, designed for adjustable top-and-bottom tilting, ensuring excellent insulation and soundproofing while maximizing natural light penetration. The selection of new energy-saving materials and their performance characteristics are derived from the “China Passive Ultra-Low Energy Building Annual Development Research Report 2022”.

3.4.3. “Two Reductions”: Reducing Profile Sizes and Carbon Emissions

The term “modular architecture” originated in the late 19th century and has evolved with continuous technological advancements, offering more diverse forms. Research indicates that if a building features repetitive spaces, the advantages of modularity are significantly enhanced [65]. Therefore, to meet diverse service demands, the strategy in this study minimizes the variety of structural profiles and establishes standardized modular dimensions to shorten construction periods, facilitate transportation, storage, and assembly, and enable easy disassembly and reconfiguration. Based on the factory building’s floor height, vertical structural components are standardized with a 4m module to meet the height requirements of various functional spaces and reserve enough space for natural ventilation. Horizontal structural components are modularized with dimensions of 4.5 m × 3 Nm (where N represents a multiple of the extended module), enabling seamless transitions between different functional uses and faster, simpler implementation in expansion projects.
Compared to traditional house construction, the use of steel structures and new environmentally friendly materials can effectively reduce carbon dioxide emissions. The use of numerous prefabricated steel structural components can effectively reduce carbon emissions. According to the China Annual Development Report on Building Energy Efficiency 2022 (Public Building Edition), the carbon emissions during the production of building materials primarily originate from steel and cement production, which together account for over 70% of the total energy consumption in the construction industry [66]. Furthermore, steel structures produce approximately 27% lower carbon emissions during production and transportation compared to concrete structures, with minimal differences observed during construction [67]. Therefore, this project extensively employs steel structures, prefabricated components, and modular systems, significantly reducing resource consumption, environmental pollution, construction-related pollution, and carbon emissions. This strategy primarily adopts steel structures, prefabricated components, and precast construction to significantly reduce carbon dioxide emissions. Additionally, when selecting material suppliers, we prioritize those located closer to the project site to minimize transportation energy consumption and carbon emissions. Furthermore, by implementing a standardized modular design strategy, the reusability of components is enhanced, thereby reducing resource consumption, environmental pollution, construction-related pollution, and carbon emissions. The overall technical pathway for the “Two Enhancements and Two Reductions” reuse design strategy is presented in Table 6.

3.5. Model Construction and Simulation Settings Under the “Two Enhancements and Two Reductions” Strategy

Given the vast scale and high spatial repetition of the factory, this study selects the A space of Changchun Tractor Factory’s Factory No. 2 as a representative case. The total building area of the original Factory No. 2 is approximately 18,300 m2, while the A space covers about 2376 m2, with a total length of 72 m and a width of 33 m, accounting for roughly 12% of the total area.
To achieve an enhanced ultra-low-energy design, this study constructs a progressive technical verification model based on the sustainable development principles of industrial heritage and the “Two Enhancements and Two Reductions” design strategy, comprising four cases as presented in Table 7. Case 1, the baseline model, simulates the energy consumption of reuse without altering the original conditions. Case 2 integrates the “Two Enhancements and Two Reductions” structural system while accounting for the advantageous aspects of photovoltaics. Case 3 not only incorporates the “Two Enhancements and Two Reductions” structural system but also simulates zonal control and the addition of photovoltaic solar panels. Building on Case 3, Case 4 addresses the lighting shortcomings caused by the factory’s 8 m clear height and internal partitioning by introducing internal structural skylights. It should be noted that while Case 1 serves as the baseline, Cases 2–4 represent progressive scheme models developed by combining the “Two Enhancements and Two Reductions” design strategy with various technical measures. The basic information for Cases 1–4 is provided in Table 8 and Table 9, and the model construction is illustrated in Figure 13.
These usage spaces can be categorized into commercial, educational, and exhibition types, which achieve more efficient utilization by staggering their use over time. Consequently, during the construction of the energy model in DesignBuilder, the division of thermal zones becomes more complex. Considering that actual usage scenarios are complex and variable—with the time proportions allocated to different functions over the year being unpredictable and subject to uncontrollable changes—it is impossible to accurately determine the operating time and proportional duration of each function. Therefore, a full-coverage design is adopted in the simulation, while in practice, some equipment can be manually adjusted according to varying usage demands. In the model constructed using DesignBuilder, all spaces, except for corridors, are designated as usage spaces (i.e., spaces that meet the requirements for commercial, educational, and exhibition uses). Their full-coverage design parameters are presented in Table 10, and the corridor parameters for Cases 2–4 are provided in Table 11. These data are sourced from the Chinese building code: Standard for Green Performance Calculation of Civil Buildings (JGJ/T 449-2018) [68]. In addition, there are auxiliary usage spaces such as restrooms and storage rooms; however, since this study simulates the same case using different techniques, the impact of these constant-parameter usage spaces on the simulation results is minimal. To more intuitively analyze the effectiveness of the “Two Enhancements and Two Reductions” design strategy, detailed simulations of auxiliary spaces are not conducted. Furthermore, based on the requirements of China’s General Code for Energy Efficiency and Renewable Energy Application in Buildings (GB55015-2021) [69], the nominal efficiency of each piece of equipment is determined, as detailed in Table 12.

4. Results

4.1. Analysis of the Original Model—Current Situation with No Modifications

We input the normal commercial usage requirements, including parameters for lighting, heating, and other factors, into the unrenovated factory to obtain the energy consumption data for the original building (referred to as the Original Model). The calculation results from the Original Model show that during winter, due to the large factory space, the heating system can only maintain a temperature range of indoor temperatures between 5 °C and 18 °C. In summer, due to the lack of proper passive ventilation, mechanical ventilation, and cooling systems, indoor temperatures significantly exceed outdoor levels, peaking at 30 °C. These conditions fail to meet human comfort requirements, making reuse infeasible. The monthly temperature results output by DesignBuilder are shown in Table 13. Additionally, the monthly energy consumption throughout the year, illustrated in Table 14, clearly demonstrates that heating energy consumption far exceeds that of lighting and equipment, with the energy consumption per unit area reaching as high as 19,562.84 kWh/m2. In this context, the energy consumption attributable to equipment and lighting is almost negligible. Moreover, according to current Chinese building energy consumption standards—which stipulate that the energy consumption per unit area should not exceed 300 kWh/m2—it is evident that the factory building’s energy consumption far exceeds acceptable usage standards.

4.2. Analysis of Modeling Results for the “Two Enhancements and Two Reductions” Strategy

As shown on the left side of Figure 14, the indoor temperature for Case 1 is not ideal, particularly in winter, with an average temperature below 20 °C. In comparison, the indoor temperatures for the mall space in Cases 2–4 are relatively similar. However, the maximum temperatures in Cases 3 and 4 are significantly lower than in Case 2, and the annual temperature fluctuation in Case 4 is slightly smaller than in the other two cases. On the right side of Figure 14, which represents the air temperature variation of the month period in the walking space, the overall temperature in Case 2 is relatively high without zoned temperature control, exceeding the normal temperature range for its mall spaces. After implementing zoned temperature control, the minimum temperature requirement was reduced. However, Case 4 still demonstrates better annual temperature fluctuation compared to Case 3.
Indoor temperature variation is only a minor aspect of reflecting indoor comfort. According to international standards, the PMV (Predicted Mean Vote) model is adopted as the basis for assessing thermal comfort requirements in building interiors [71]. PMV was developed by Fanger in the 1960s and specifies that the standard indoor comfort range should fall between −0.5 and 0.5 [72]. However, some researchers argue that variables (such as age, health status, body mass index, and other characteristics) also influence human perceptions of comfort [73]. Nevertheless, this metric primarily predicts the average comfort level for the majority of people. In China, the government has similarly used this as a standard, implementing codes as shown in Table 15 [74]. Given the context of this study, the standard is sufficient to hold on the analysis of whether the proposed reuse strategies are effective.
Figure 15 presents the results for the month period, showing consistent abnormal variations in April, primarily related to the heating schedule. These discrepancies can be addressed by adjusting the heating cutoff time based on actual conditions. In the mall space, the PMV values under zoned control are closer to the Class I standard, with Cases 3 and 4 being nearly identical. For the walking space, Case 4 demonstrates better PMV performance. Figure 16 compares the results over the run period. For the mall space, the PMV values for Cases 2–4 all meet the Class I standard, while the PPD values meet the Class II standard, with Case 1 being slightly higher. In contrast, for the walking space, the PMV and PPD results for Case 2, without zoned control, are more favorable compared to the other cases.
Figure 17 and Figure 18 display the average monthly energy consumption for Cases 1–4 as simulated by DesignBuilder. Additionally, by comparing the heating and cooling energy consumption data for each month, the peak months (January and July) are selected as representative of winter and summer, respectively, for a horizontal comparative analysis of the four cases, as shown in Figure 19 and Figure 20. It is evident that Room Electricity shows minimal variation across cases. For Lighting, after adding interior skylights in Case 4, the monthly energy consumption decreased by approximately 0.169 (kwh/m2), resulting in an annual reduction of about 2.028 (kwh/m2). For Heating, after implementing zoned control (Case 3 and Case 4), monthly consumption decreased by approximately 1665 (kwh/m2), leading to a reduction of about 8325 (kwh/m2) over the heating season. For Cooling (Electricity), zoned control (Case 3 and Case 4) reduced average summer monthly consumption by approximately 0.35 (kwh/m2). In Case 4, photovoltaic energy production, combining solar panels and photovoltaic tiles, achieved a maximum monthly energy generation of 25,166 (kWh) and an annual total of approximately 203,946 (kWh). After deducting the energy used for Lighting, the remaining photovoltaic energy per year can supplement Room Electricity consumption or be stored in energy storage facilities for backup use.

5. Discussion

To comprehensively evaluate the energy-saving of the design strategy proposed in this study, the energy consumption output from DesignBuilder simulations is converted into primary energy, thereby providing a more scientifically accurate reflection of actual energy usage. According to the calculation method for coal-fired heating and the standard coal conversion coefficient specified in the General Rules for Calculation of the Comprehensive Energy Consumption (GB/T 2589-2020) [75] published by China, 1 kg of raw coal, with a lower heating value of 20,934 KJ/kg (5000 kcal/kg), is equivalent to 0.7143 kgce/kg. The formula for calculating primary energy is as follows:
P E C = E h e a t × 3600 Q c o a l × η × f c o a l
Here, PEC is Primary Energy Consumption (kgce/tce); E h e a t is the energy consumption demand (kWh); Q c o a l is the lower heating value of raw coal (KJ/kg); f c o a l is the standard coal conversion coefficient for raw coal (kgce/kg); and η is the nominal efficiency of the boiler.
According to the “Limits on Energy Consumption per Unit Product for Coal-Fired Power Generation Units” issued in China, the coal used for power supply must not exceed 300 g of standard coal per kWh. Furthermore, public data from the Chinese Resources Bureau indicate that the maximum energy conversion efficiency of power plants is 38%, with a transmission loss rate of approximately 6%. The primary energy calculation formula for coal-fired power generation is as follows:
P E C d e v i c e = E d e v i c e η d e v i c e × C E B η p l a n t × f c o a l × ( 1 η l o s s )
Here, E d e v i c e is the energy consumption demand of the equipment (kWh); CEB is the nationally prescribed upper limit for coal supply for power; η d e v i c e is the efficiency of the equipment; η p l a n t is the energy conversion efficiency of the power plant; f c o a l represents the standard coal conversion coefficient for raw coal; and η l o s s is the transmission loss rate. The unit for PEC is standard coal (kgce/tce).
By consolidating and calculating the data, Table 16 presents the energy consumption and primary energy usage for different project models over one operational cycle. It is evident that the total primary energy consumption for Case 1 and Case 2 reaches as high as 4,353,303 (kgce/tce), with heating energy consumption being the predominant contributor at 4,073,358 (kgce/tce), accounting for 98–99% of the project’s total energy consumption and an energy intensity of up to 11,908 (kWh/m2). Therefore, the primary objective in reducing energy consumption is to decrease the heating load. By employing the “Two Enhancements and Two Reductions” design strategy along with zonal temperature control technology, Case 3 and Case 4 successfully reduced the heating energy consumption to approximately 50–60% of the total energy consumption, lowering the primary energy by about 4 million (kgce/tce) and reducing the energy intensity to around 180–230 (kWh/m2)—a reduction of roughly 90–95% compared to the first two cases. Additionally, the installation of 30 sets of photovoltaic solar panels is capable of providing approximately 203,946 kWh of actual power generation annually, thereby substituting a portion of the primary energy. Considering the 95% efficiency of the LED lighting system, this substitution can effectively replace all coal-fired electricity. In the Lighting sector, this results in a reduction of about 71,429 (kgce/tce) of primary energy, which accounts for 20% of the total primary energy consumption for this case.
Moreover, to verify whether the updated simulation results using the “Two Enhancements and Two Reductions” design strategy meet the ultra-low energy consumption design standards, we compare the project’s simulation outcomes with the regulatory requirements. Unfortunately, there are currently no specific standards in China for ultra-low energy consumption in industrial and architectural heritage. Therefore, we refer to the requirements for energy-saving renovations of existing buildings—which mandate that such renovations should begin with an energy diagnosis, followed by the development of renovation plans, energy-saving indicators, and testing and acceptance procedures—and to the “Ultra-Low Energy Consumption Requirements for Public Buildings in Jilin Province (DB22/T 5128-2022)” [76] issued by Jilin Province in China. Table 17 presents a comparison between the ultra-low energy requirements for public buildings and the conditions of this project. In order to preserve the historical value of the peripheral structure of the industrial heritage, the “Two Enhancements and Two Reductions” reuse strategy was implemented. While the building envelope’s airtightness, comprehensive energy-saving rate, and renewable energy utilization rate meet the requirements for ultra-low-energy public buildings, the energy-saving rate of the building itself is adversely affected by the original enclosure of the industrial heritage and thus does not meet the standards. Given the unique characteristics of industrial heritage buildings, the ultra-low-energy renovation requirements cannot be directly replicated from those of public buildings. As a result, the current simulation results of the renovation strategy essentially satisfy most of the ultra-low-energy public building requirements.
To assess whether the updated simulation using the “Two Enhancements and Two Reductions” design strategy improves occupant comfort, we utilized the indoor comfort data derived from DesignBuilder simulations. These data not only reflect the occupants’ experiences but also directly influence their satisfaction, constituting one of the indispensable criteria for sustainable development. According to the results shown in Figure 15 and Figure 16, the comfort levels of the mall space in Cases 2–4 meet Class I of the Chinese standard, achieving a 90% satisfaction rate. However, for the walking space, Case 2 meets the Class II standard, while Case 3 and Case 4, after implementing zoned temperature control, only meet the Class III standard. The walking space refers to usage areas similar to semi-enclosed corridors, semi-enclosed pedestrian streets, and loggias, where the primary goal is to maintain a comfortable level of warmth in winter and a pleasant coolness in summer, providing pedestrians with a more comfortable passage compared to outdoor conditions. Additionally, the walking space serves to seamlessly connect mall areas, creating an integrated environment for both strolling and shopping. Based on the simulation results of the “Two Enhancements and Two Reductions” reuse strategy, the comfort levels in Case 3 and Case 4 are sufficient to meet the usage needs of the walking space.
In comparison to Case 3, Case 4 introduces internal roof skylights, which, while causing some negative impacts on heat loss and other factors, are essential for regions in Northeast China, where natural lighting is in high demand to enhance user comfort by increasing natural daylight, particularly during the winter months. Therefore, even though Case 3 already demonstrates excellent energy reduction results compared to the original factory condition, Case 4 was designed with further improvements in mind, incorporating natural light for user comfort. Ultimately, whether the space is utilized as a cultural and creative commercial street, a shared educational space, or a temporary exhibition area, the design enables flexibility and adaptability to meet the varying needs of users, allowing for seamless transitions between different functions.
In summary, the analysis of the aforementioned results demonstrates that the “Two Enhancements and Two Reductions” industrial heritage reuse strategy significantly facilitates the reuse of industrial heritage within an ultra-low energy consumption framework. The development of an indoor walking space model with zonal control offers the following advantages:
  • Preservation of the external envelope, conserving the historical value of industrial heritage.
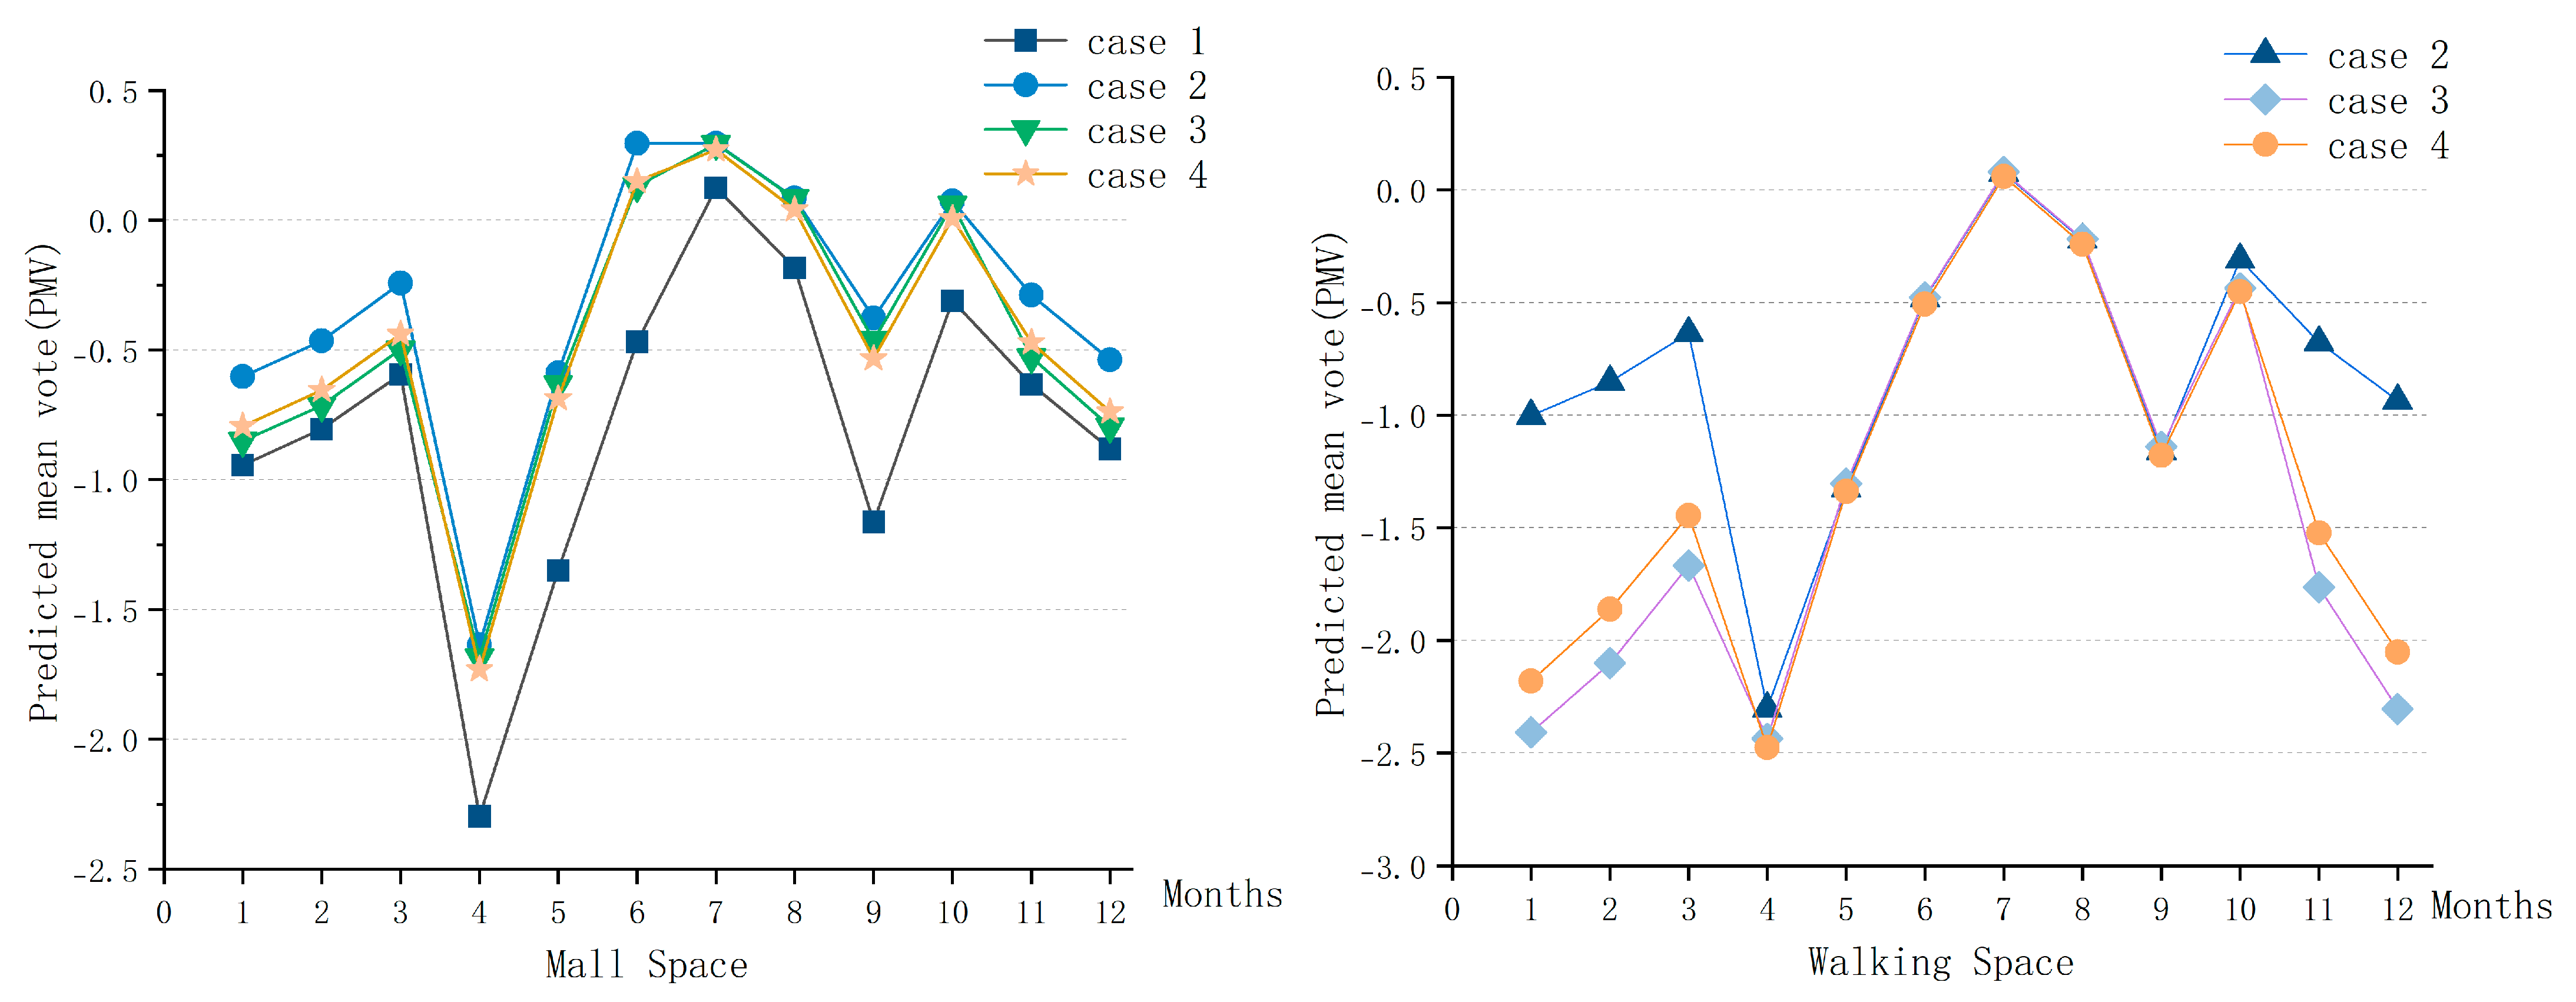
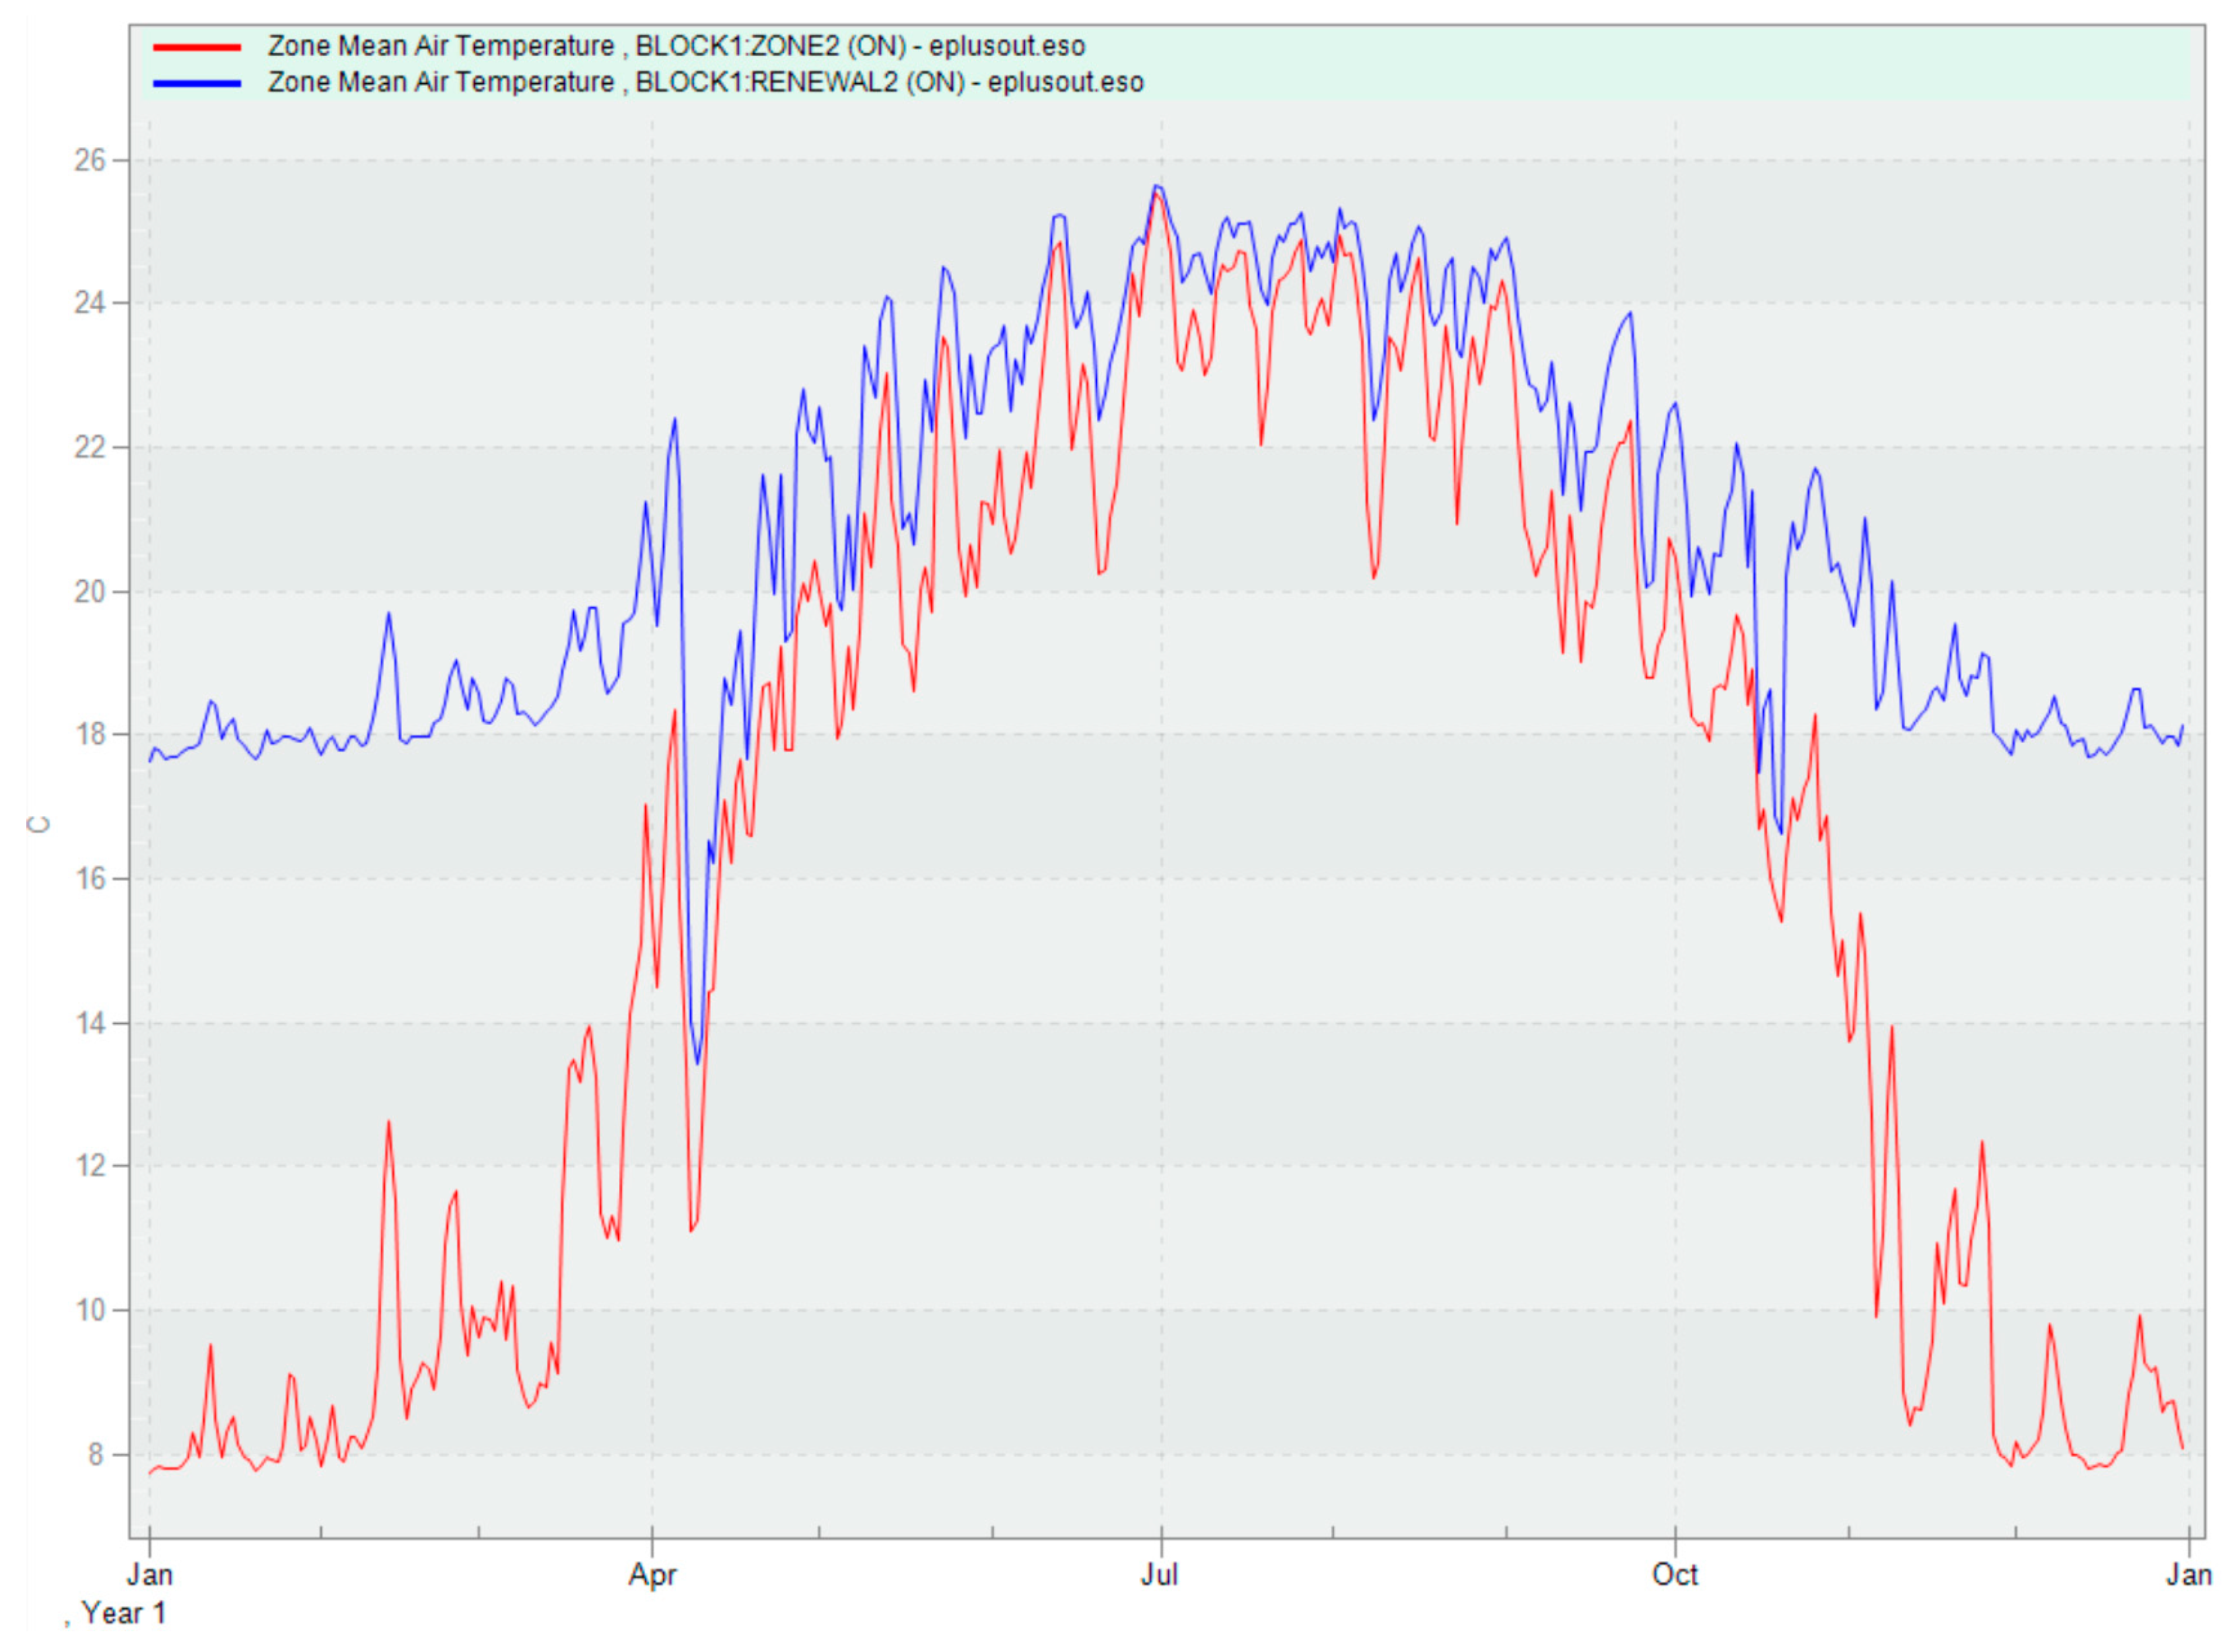
  • Utilization of large spaces and high ceilings in factory buildings, transforming the indoor walking space into more than just a transitional commercial area. It also provides an improved walking environment during the five-month winter period in cold regions, with an annual temperature maintained between 8 °C and 26 °C (as shown in Figure 21).
  • Significant reduction in total energy consumption—compared to Case 1, total energy consumption was reduced by approximately 95%, with an annual decrease in primary energy of 4,009,346 (kgce/tce).
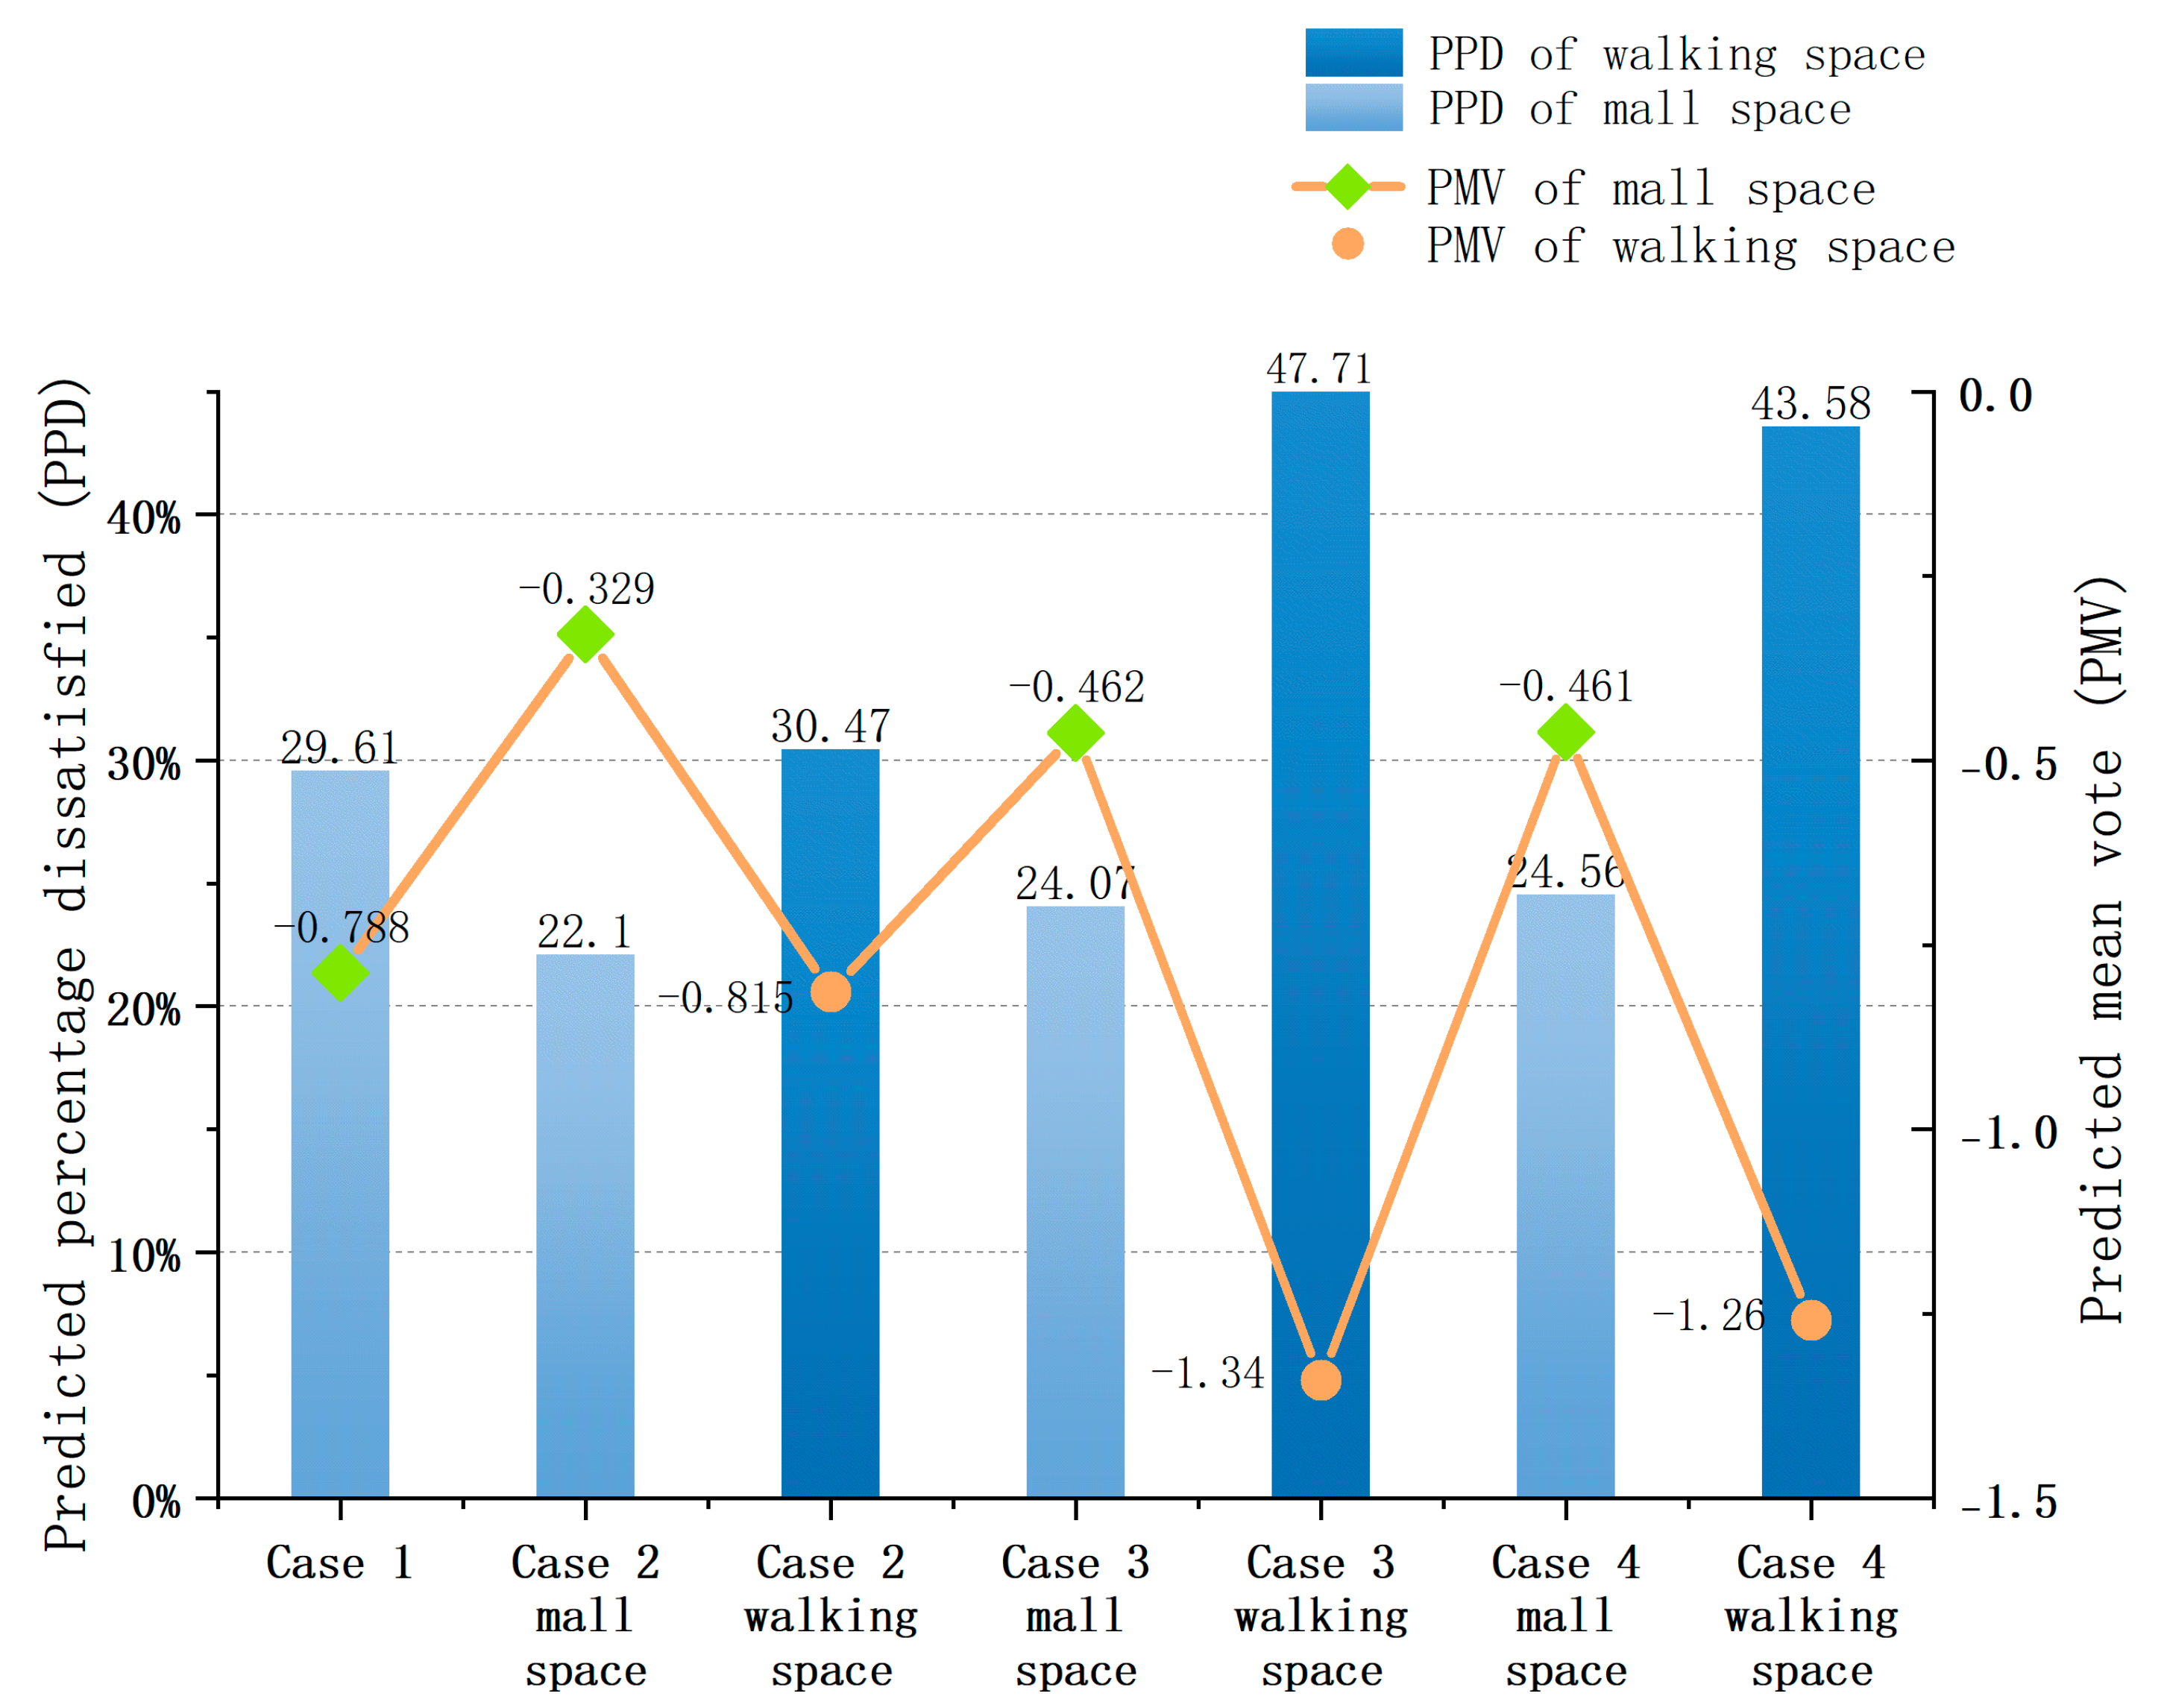
  • Ensuring the usability and thermal comfort of the mall space, with an annual temperature maintained between 18 °C and 26 °C (as shown in Figure 21), meeting human comfort standards.
Therefore, zoned temperature control not only satisfies human thermal comfort but also optimally regulates temperature requirements for different functional spaces. Additionally, it serves as a crucial step in reducing energy consumption during the adaptive reuse of large industrial heritage factory buildings.
Although it does not possess an absolute advantage in reducing energy consumption compared to newly constructed buildings, industrial heritage—whether viewed from the perspective of historical continuity or urban transformation—demands sustainable development even more critically than new constructions. Based on the simulation results of the representative case in the DesignBuilder software, the “Two Enhancements and Two Reductions” strategy is applicable to most factory-type, high-ceiling, and large-space industrial heritage structures. During the investigation of industrial heritage in Northeast China, it was found that these types of structures were originally used for heavy industry and mechanical production. Since heavy industry accounts for approximately 70% of the “156 Project” in China, these data increase the universal applicability of the “Two Enhancements and Two Reductions” industrial heritage reuse design strategy in China.
However, the application of the “Two Enhancements and Two Reductions” industrial heritage reuse design strategy has certain limitations. This strategy may not be universally applicable to multi-story industrial buildings left by light industry. In addition, DesignBuilder’s energy consumption simulations still have certain limitations in terms of accuracy, particularly when it comes to the continuous changes over a building’s lifecycle (e.g., building deterioration). It cannot provide precise simulations of energy consumption under these evolving conditions, which restricts the ability to model and calculate sustainable low-energy performance for reused industrial heritages. Additionally, this study lacks comparisons with simulation data from other cities in Northeast China. Different regions may have varying conditions, but overall, the approach can still achieve relatively better energy consumption reduction results.

6. Conclusions

The perfect conservation and development of industrial heritage is not merely about preserving historical buildings but also about reusing them while maintaining protection. Balancing the tension between conservation and reuse is essential for the sustainable development of industrial heritage. At the same time, in the face of the global ecological crisis, industrial heritage, as part of the built environment, also faces the issue of achieving low energy consumption. Therefore, to realize a successful industrial heritage reuse project, it is necessary to balance the relationship between energy consumption, conservation, and reuse. This study integrates quantitative energy modeling with heritage conservation goals, addressing both energy consumption and cultural sustainability in the context of China’s industrial heritage. Additionally, this study identifies two main advantages of industrial heritage in Northeast China:
  • The high ceiling and large space provide a high level of flexibility for reuse, accommodating diverse functional needs.
  • Most are located in the city center, offering excellent foot traffic and geographical location advantages.
However, the disadvantages of these industrial heritage buildings are more pronounced:
  • The large spaces result in excessively high demands for heating and cooling.
  • To preserve the historical value of the industrial heritage, the factory’s envelope structure is retained, but these structures have poor thermal insulation properties.
  • The large spans and multiple bays of these factories also impose significant limitations on natural daylight.
This study leverages the advantages of this industrial heritage using Factory No. 2 of Changchun Tractor Factory as a case example. It analyzes the architectural form, structural form, spatial configuration, and available space characteristics. By employing DesignBuilder software for simulation and calculation, this study integrates ultra-low energy consumption building theories, industrial heritage conservation requirements, and the “Two Enhancements and Two Reductions” strategy for the reuse of industrial heritage. This study approaches the problem from multiple angles, dimensions, and perspectives, constructing four comparative models to comprehensively address the building’s deficiencies. The final Case 4 results in a reduction of about 11,648 (kWh/m2) over the heating season. With the addition of photovoltaic solar panels, the total lighting energy consumption for the entire year is fully compensated. Although there is an increase in domestic hot water (DHW) and equipment energy consumption, the total primary energy was reduced by about 4 million (kgce/tce), and the total energy consumption still decreased by approximately 95%. This verifies the ultra-low energy consumption advantages of the “Two Enhancements and Two Reductions” reuse design strategy for factory-type industrial heritage.
In conclusion, the “Two Enhancements and Two Reductions” reuse design strategy for industrial heritage proposed in this study breaks through the limitations of traditional reuse perspectives. It provides a new approach to reducing energy consumption in factory-type industrial heritage reuse in cold regions while ensuring the preservation of historical value. This strategy proactively aligns with ultra-low energy consumption building design requirements, filling a gap in the field of industrial heritage reuse. The innovative “Two Enhancements and Two Reductions” industrial heritage reuse design strategy for industrial heritage reuse not only plays a regulatory role in the future development of industrial heritage reuse but also provides valuable reference for architects and scholars. In the future, we will consider applying this strategy to different cases, seeking a balance between commonalities and uniqueness, and continuously exploring the ultra-low energy consumption potential of industrial heritage reuse. This ongoing effort will further refine and perfect the reuse strategy. Of course, this study has certain limitations, as it does not conduct a universal analysis across more projects. However, the findings still hold significant guidance for industrial heritage reuse, particularly in cold regions, and are applicable to factory-type industrial heritage worldwide.

Author Contributions

Conceptualization: S.Y.; investigation: N.L.; methodology: S.Y.; funding acquisition: H.M.; software: S.Y.; validation: H.M., S.X.; writing—original draft: S.Y.; review and editing: H.M., S.X. and F.G. All authors have read and agreed to the published version of the manuscript.

Funding

Research on Paradigm Innovation and Practical Exploration of VR Virtual Reality Technology Intervention in Art and Design Teaching under the Background of Digital Education (Subject No. 2023RY051).

Data Availability Statement

The original contributions presented in the study are included in the article, further inquiries can be directed to the corresponding author.

Acknowledgments

We would like to thank the anonymous reviewers for their constructive and supportive feedback.

Conflicts of Interest

Author Na Li was employed by the Design Institute of Civil Engineering & Architecture of Dalian University of Technology Co., Ltd. The remaining authors declare that the research was conducted in the absence of any commercial or financial relationships that could be construed as a potential conflict of interest.

References

  1. IEA. Global ABC Roadmap for Buildings and Construction. 2020–2050. Available online: https://www.iea.org/reports/globalabc-roadmap-for-buildings-and-construction-2020-2050 (accessed on 15 October 2024).
  2. CPC Central Committee State Council. Oponions on Accelerating Comprehensive Green Transformation of Economic and Social Development. Available online: https://www.gov.cn/gongbao/2024/issue_11546/202408/content_6970974.html (accessed on 15 October 2024).
  3. Alsabry, A.; Szymański, K.; Backiel-Brzozowska, B. Analysis of the Energy, Environmental and Economic Efficiency of Multi-Family Residential Buildings in Poland. Energies 2024, 17, 2057. [Google Scholar] [CrossRef]
  4. Spandagos, C.; Ng, T.L. Equivalent full-load hours for assessing climate change impact on building cooling and heating energy consumption in large Asian cities. Appl. Energy 2017, 189, 352–368. [Google Scholar] [CrossRef]
  5. Blagojević, M.R.; Tufegdžić, A. The new technology era requirements and sustainable approach to industrial heritage renewal. Energ Build. 2016, 115, 148–153. [Google Scholar] [CrossRef]
  6. Douet, J. Industrial Heritage Re-Tooled: The TICCIH Guide to Industrial Heritage Conservation; Routledge: London, UK, 2016. [Google Scholar]
  7. Misirlisoy, D.; Günçe, K. Adaptive reuse strategies for heritage buildings: A holistic approach. Sustain. Cities Soc. 2016, 26, 91–98. [Google Scholar] [CrossRef]
  8. Vardopoulos, I. Critical sustainable development factors in the adaptive reuse of urban industrial buildings. A fuzzy DEMATEL approach. Sustain. Cities Soc. 2019, 50, 101684. [Google Scholar] [CrossRef]
  9. Scaffidi, F. Average social and territorial innovation impacts of industrial heritage regeneration. Cities 2024, 148, 104907. [Google Scholar] [CrossRef]
  10. Guidetti, E.; Ferrara, M. Embodied energy in existing buildings as a tool for sustainable intervention on urban heritage. Sustain. Cities Soc. 2023, 88, 104284. [Google Scholar] [CrossRef]
  11. Wang, S.; Zhang, J.; Wang, F.; Dong, Y. How to achieve a balance between functional improvement and heritage conservation? A case study on the renewal of old Beijing city. Sustain. Cities Soc. 2023, 98, 104790. [Google Scholar] [CrossRef]
  12. Banti, N. Existing industrial buildings—A review on multidisciplinary research trends and retrofit solutions. J. Build. Eng. 2024, 84, 108615. [Google Scholar] [CrossRef]
  13. Yue, J.; Lu, J.; Yan, C.; Liu, J.; Pan, Y. Dynamic Simulation Analysis of Influencing Factors of Energy Consumption of Public Building Envelope in Central China. Sustainability 2023, 15, 14982. [Google Scholar] [CrossRef]
  14. Harish, V.S.K.V.; Kumar, A. A review on modeling and simulation of building energy systems. Renew. Sustain. Energy Rev. 2016, 56, 1272–1292. [Google Scholar] [CrossRef]
  15. Gan, V.J.L.; Lo, I.M.C.; Ma, J.; Tse, K.T.; Cheng, J.C.P.; Chan, C.M. Simulation optimisation towards energy efficient green buildings: Current status and future trends. J. Clean. Prod. 2020, 254, 120012. [Google Scholar] [CrossRef]
  16. Tian, Z.C.; Zhang, X.K.; Jin, X.; Zhou, X.; Si, B.H.; Shi, X. Towards adoption of building energy simulation and optimization for passive building design: A survey and a review. Energy Build. 2018, 158, 1306–1316. [Google Scholar] [CrossRef]
  17. Zhang, Y.; Wang, H.; Gao, W.; Wang, F.; Zhou, N.; Kammen, D.M.; Ying, X. A survey of the status and challenges of green building development in various countries. Sustainability 2019, 11, 5385. [Google Scholar] [CrossRef]
  18. Cucuzzella, C. Analyzing Eco-Architecture Beyond Performance; Editions JFD: Montreal, QC, Canada, 2020. [Google Scholar]
  19. Esbensen, T.V.; Korsgaard, V. Dimensioning of the solar heating system in the zero energy house in Denmark. Sol. Energy 1977, 19, 195–199. [Google Scholar] [CrossRef]
  20. Ding, Z.; Fan, Z.; Tam, V.W.Y.; Bian, Y.; Li, S.; Illankoon, I.M.C.S.; Moon, S. Green building evaluation system implementation. Build. Environ. 2018, 133, 32–40. [Google Scholar] [CrossRef]
  21. Bere, J. An introduction to Passive House; Riba Publishing: London, UK, 2019. [Google Scholar]
  22. Martiskainen, M.; Kivimaa, P. Creating innovative zero carbon homes in the United Kingdom—Intermediaries and champions in building projects. Environ. Innov. Soc. Transit. 2018, 26, 15–31. [Google Scholar] [CrossRef]
  23. Dang, M.; van den Dobbelsteen, A.; Voskuilen, P. A Parametric Modelling Approach for Energy Retrofitting Heritage Buildings: The Case of Amsterdam City Centre. Energies 2024, 17, 994. [Google Scholar] [CrossRef]
  24. Xiaoxiang, Q.; Junjia, Y.; Haron, N.A.; Alias, A.H.; Law, T.H.; Abu Bakar, N. Status, Challenges and Future Directions in the Evaluation of Net-Zero Energy Building Retrofits: A Bibliometrics-Based Systematic Review. Energies 2024, 17, 3826. [Google Scholar] [CrossRef]
  25. Zhang, Y.; Wang, J.; Hu, F.; Wang, Y. Comparison of evaluation standards for green building in China, Britain, United States. Renew. Sustain. Energy Rev. 2017, 68, 262–271. [Google Scholar] [CrossRef]
  26. Collection of Building Energy Effciency Standards; China Architecture & Building Press: Beijing, China, 2017.
  27. CECC. National Standard E-Book Library. Available online: https://ebook.chinabuilding.com.cn/zbooklib/index?SiteID=1&IsSiteUrl=Y (accessed on 31 October 2024).
  28. Francioni, F.; Lenzerini, F. The 1972 World Heritage Convention: A Commentary; Oxford University Press: Oxford, UK, 2023. [Google Scholar]
  29. Unesco. World Heritage Convention. Available online: https://whc.unesco.org/ (accessed on 10 October 2024).
  30. Chen, J.; Judd, B.; Hawken, S. Adaptive reuse of industrial heritage for cultural purposes in Beijing, Shanghai and Chongqing. Struct. Surv. 2016, 34, 331–350. [Google Scholar] [CrossRef]
  31. Bandarin, F.; Van Oers, R. The Historic Urban Landscape: Managing Heritage in an Urban Century; John Wiley & Sons: Hoboken, NJ, USA, 2012. [Google Scholar]
  32. Mo, C.; Wang, L.; Rao, F. Typology, preservation, and regeneration of the post-1949 industrial heritage in China: A case study of Shanghai. Land 2022, 11, 1527. [Google Scholar] [CrossRef]
  33. Alfrey, J.; Putnam, T. The Industrial Heritage: Managing Resources and Uses; Routledge: London, UK, 2003. [Google Scholar]
  34. Jankovich, B.; Puccetti, P. Building rehabilitation with retrofit of passive and low energy systems. In Passive and Low Energy Architecture; Yannas, S., Ed.; Pergamon: Oxford, UK, 1983; pp. 177–181. [Google Scholar]
  35. Attia, S. State of the Art of Existing Early Design Simulation Tools for Net Zero Energy Buildings: A Comparison of Ten Tools; Architecture et climat: Ottignies-Louvain-la-Neuve, Belgium, 2011. [Google Scholar]
  36. Sagdiçoglu, M.S.; Yenice, M.S.; Tel, M.Z. The Use of Energy Simulations in Residential Design: A Systematic Literature Review. Sustainability 2024, 16, 8138. [Google Scholar] [CrossRef]
  37. Wang, H.D.; Zhai, Z. Advances in building simulation and computational techniques: A review between 1987 and 2014. Energy Build. 2016, 128, 319–335. [Google Scholar] [CrossRef]
  38. Bevilacqua, P.; Bruno, R.; Szyszka, J.; Cirone, D.; Rollo, A. Summer and winter performance of an innovative concept of Trombe wall for residential buildings. Energy 2022, 258, 124798. [Google Scholar] [CrossRef]
  39. Rahman, M.M.; Rasul, M.; Khan, M.M.K. Energy conservation measures in an institutional building in sub-tropical climate in Australia. Appl. Energy 2010, 87, 2994–3004. [Google Scholar] [CrossRef]
  40. Liu, Y.; Chen, H.; Zhang, L.; Feng, Z. Enhancing building energy efficiency using a random forest model: A hybrid prediction approach. Energy Rep. 2021, 7, 5003–5012. [Google Scholar] [CrossRef]
  41. Goenaga-Pérez, A.; Álvarez-Sanz, M.; Terés-Zubiaga, J.; Campos-Celador, A. Cost-effectiveness and minimum requirements of nZEB for residential buildings under the new Spanish Technical Building Code. Energ Build. 2023, 287, 112986. [Google Scholar] [CrossRef]
  42. Hosseini, S.M.A.; Farahzadi, L.; Pons, O. Assessing the sustainability index of different post-disaster temporary housing unit configuration types. J. Build. Eng. 2021, 42, 102806. [Google Scholar] [CrossRef]
  43. Martinaitis, V.; Zavadskas, E.K.; Motuzienė, V.; Vilutienė, T. Importance of occupancy information when simulating energy demand of energy efficient house: A case study. Energy Build. 2015, 101, 64–75. [Google Scholar] [CrossRef]
  44. Zhang, A.; Bokel, R.; van den Dobbelsteen, A.; Sun, Y.; Huang, Q.; Zhang, Q. An integrated school and schoolyard design method for summer thermal comfort and energy efficiency in Northern China. Build. Environ. 2017, 124, 369–387. [Google Scholar] [CrossRef]
  45. Development and Reform Commission. Circular on the Issuance of the National Plan for the Adjustment and Transformation of Old Industrial Bases. Available online: https://www.gov.cn/gongbao/content/2013/content_2441018.htm (accessed on 15 October 2024).
  46. GB 50176-2016; Code for Thermal Design of Civil Building. China Architecture & Building Press: Beijing, China, 2016.
  47. Zhu, G. Resource Conservation Study of Changchun Tractor Works Industrial Heritage Under the Concept of Urban Micro-Renewal. Master’s Thesis, Jilin Jianzhu University, Changchun, China, 2022. [Google Scholar]
  48. Anderson, K. Design Energy Simulation for Architects: Guide to 3D Graphics, 1st ed.; Routledge: London, UK, 2014. [Google Scholar]
  49. Wilcox, S. Users Manual for TMY3 Data Sets; NREL/TP-581-43156; National Renewable Energy Laboratory: Golden, CO, USA, 2008. [Google Scholar]
  50. DB22/T 5160-2024; Design Standard for Energy Efficiency of Public Buildings (Energy Efficiency 72%). Housing and Urban-Rural Development Department of Jilin Province: Changchun, China, 2024.
  51. DB22/T 5055-2021; Design standard for Green Building. Housing and Urban-Rural Development Department of Jilin Province: Changchun, China, 2021.
  52. Han, R.; Yang, S. A study on industrial heritage renewal strategy based on hybrid Bayesian network. Sustainability 2023, 15, 10707. [Google Scholar] [CrossRef]
  53. Felipe, C.A.S.; Rocha, S.C.S. Prediction of minimum fluidization velocity of gas–solid fluidized beds by pressure fluctuation measurements—Analysis of the standard deviation methodology. Powder Technol. 2007, 174, 104–113. [Google Scholar] [CrossRef]
  54. Welch, S.; Obonyo, E.; Memari, A.M. A review of the previous and current challenges of passive house retrofits. Build. Environ. 2023, 245, 110938. [Google Scholar] [CrossRef]
  55. Hensley, J.E.; Aguilar, A. Preservation Brief 3: Improving Energy Efficiency in Historic Buildings, National Park Service. 2011. Available online: https://www.nps.gov/orgs/1739/index.htm (accessed on 15 October 2024).
  56. Kertsmik, K.-A.; Arumägi, E.; Hallik, J.; Kalamees, T. Low carbon emission renovation of historical residential buildings. Energy Rep. 2024, 11, 3836–3847. [Google Scholar] [CrossRef]
  57. Menconi, M.; Painting, N.; Piroozfar, P. Modelling and simulation of low-risk energy retrofit measures for Traditional Listed Dwellings in the UK. J. Build. Eng. 2024, 82, 108346. [Google Scholar] [CrossRef]
  58. Oki, R.; Tsuneoka, Y.; Yamaguchi, S.; Sugano, S.; Watanabe, N.; Akimoto, T.; Hayashi, Y.; Wakao, S.; Tanabe, S.-i. Renovating a house to aim for net-zero energy, thermal comfort, energy self-consumption and behavioural adaptation: A method proposed for ENEMANE HOUSE 2017. Energy Build. 2019, 201, 183–193. [Google Scholar] [CrossRef]
  59. Hao, L.; Chengyuan, Z. Regional Linkage, Strategic Reserve, and the Dual Track of Peacetime and Wartime: Reflections on the Architectural Design of Contemporary Infectious Disease Hospitals Based on Historical Study and the Current Outbreak of Pandemics. Archit. J. 2020, 3, 41–48. [Google Scholar] [CrossRef]
  60. Chwieduk, D. Towards sustainable-energy buildings. Appl. Energy 2003, 76, 211–217. [Google Scholar] [CrossRef]
  61. Liu, Z.; Yu, Z.; Yang, T.; Qin, D.; Li, S.; Zhang, G.; Haghighat, F.; Joybari, M.M. A review on macro-encapsulated phase change material for building envelope applications. Build. Environ. 2018, 144, 281–294. [Google Scholar] [CrossRef]
  62. Brigante, D. New Composite Materials: Selection, Design, and Application; Springer: Berlin/Heidelberg, Germany, 2014. [Google Scholar] [CrossRef]
  63. Sah, T.P.; Lacey, A.W.; Hao, H.; Chen, W. Prefabricated concrete sandwich and other lightweight wall panels for sustainable building construction: State-of-the-art review. J. Build. Eng. 2024, 89, 109391. [Google Scholar] [CrossRef]
  64. Tripathi, B.M.; Shukla, S.K. A comprehensive review of the thermal performance in energy efficient building envelope incorporated with phase change materials. J. Energy Storage 2024, 79, 110128. [Google Scholar] [CrossRef]
  65. Sharafi, P.; Samali, B.; Ronagh, H.; Ghodrat, M. Automated spatial design of multi-story modular buildings using a unified matrix method. Autom. Constr. 2017, 82, 31–42. [Google Scholar] [CrossRef]
  66. Building Energy Efficiency Research Center, Tsinghua University. China Annual Development Report on Building Energy Efficiency 2022 (Public Building Edition); China Building Industry Press: Beijing, China, 2022. [Google Scholar]
  67. Zhao, Y.; Sun, Q.; Wei, W.; Xiao, C.; Ren, J.; Wang, Z.; Gao, S.; Dai, Y. Research on the impact of building structure type and scheme on carbon emission. Build. Struct. 2023, 53, 14–18. [Google Scholar]
  68. JGJ/T 449-2018; Standard for Green Performance Calculation of Civil Buildings. China Architecture & Building Press: Beijing, China, 2018.
  69. GB 55015-2021; General Code for Energy Efficiency and Renewable Energy Application in Buildings. China Architecture & Building Press: Beijing, China, 2021.
  70. GB 21455-2019; Minimum Allowable Values of the Energy Efficiency and Energy Efficiency Grades for Room Air Conditioners. State Administration for Market Regulation of the People’s Republic of China: Beijing, China, 2019.
  71. Arakawa Martins, L.; Soebarto, V.; Williamson, T. A systematic review of personal thermal comfort models. Build. Environ. 2022, 207, 108502. [Google Scholar] [CrossRef]
  72. Fanger, P. Thermal Comfort: Analysis and Applications in Environmental Engineering; Danish Technical Press: Copenhagen, Denmark, 1970. [Google Scholar]
  73. Kim, J.; Schiavon, S.; Brager, G. Personal comfort models—A new paradigm in thermal comfort for occupant-centric environmental control. Build. Environ. 2018, 132, 114–124. [Google Scholar] [CrossRef]
  74. GB/T 50785-2012; Evaluation Standard for Indoor Thermal Environment in Civil Buildings. China Architecture & Building Press: Beijing, China, 2012.
  75. GB/T 2589-2020; General Rules for Calculation of the Comprehensive Energy Consumption. State Administration for Market Regulation of the People’s Republic of China: Beijing, China, 2020.
  76. DB22/T 5128-2022; Ultra-Low Energy Consumption Requirements for Public Buildings in Jilin Province. Housing and Urban-Rural Development Department of Jilin Province: Changchun, China, 2022.
Figure 1. Relationship diagram of concepts related to ultra-low-energy buildings.
Energies 18 01289 g001
Figure 2. Total number of World Heritage properties and industrial heritage sites in some of the ICOMOS member countries.
Energies 18 01289 g002
Figure 3. Development and correlation chart of research related to ultra-low energy consumption and conservation and reuse of built heritage.
Energies 18 01289 g003
Figure 4. Some of the results from the analysis of Attia, Shady [35].
Energies 18 01289 g004
Figure 5. Experimental flowchart diagram.
Energies 18 01289 g005
Figure 6. Distribution of the number of old industrial cities in China by province (the number of provinces not appearing is 0).
Energies 18 01289 g006
Figure 7. Layout of Changchun Tractor Factory (transferred by the author).
Energies 18 01289 g007
Figure 8. Current condition of the No. 2 Processing Workshop of Changchun Tractor Factory.
Energies 18 01289 g008
Figure 9. The redraw of floor plan and 1-1 section of Factory No. 2.
Energies 18 01289 g009
Figure 10. Model of Factory No. 2 in DesignBuilder software.
Energies 18 01289 g010
Figure 11. Time-by-time parameterization for room.
Energies 18 01289 g011
Figure 12. POI data visualization and analysis map for 5 km around Changchun Tractor Factory: (a) Kernel density analysis of education category; (b) Kernel density analysis map for mall category; (c) Kernel density analysis of exhibition hall category; (d) Kernel density analysis of park category; (e) Kernel density analysis chart of sport category; (f) Kernel density analysis of tourism category. (Red in these figures represents data within 5 kilometers of this project).
Energies 18 01289 g012
Figure 13. Case 1–4 models built in DesignBuilder software: (a) Case 1 model diagram; (b) Case 2 model diagram; (c) Case 3 model diagram; (d) Case 4 model diagram.
Energies 18 01289 g013
Figure 14. The air temperature variation of the month period in the different spaces of Cases 1–4.
Energies 18 01289 g014
Figure 15. Predicted mean vote (PMV) of the month period in the different spaces of Cases 1–4 from DesignBuilder.
Energies 18 01289 g015
Figure 16. PMV and PPD of the run period in the different spaces of Cases 1–4 from DesignBuilder.
Energies 18 01289 g016
Figure 17. Average energy consumption (excluding heating) per unit area (kWh/m2) for valid months of DesignBuilder simulation Cases 1–4.
Energies 18 01289 g017
Figure 18. Average heating energy consumption per unit area (kWh/m2) for valid months of DesignBuilder simulation Cases 1–4.
Energies 18 01289 g018
Figure 19. Comparison of energy consumption (excluding heating) per unit area (kWh/m2) for Cases 1–4 in a typical month by DesignBuilder.
Energies 18 01289 g019
Figure 20. Comparison of heating energy consumption per unit area (kWh/m2) for Case 1–4 in a typical month by DesignBuilder.
Energies 18 01289 g020
Figure 21. Comparison of internal temperature simulations for Case 3 and Case 4 zones.
Energies 18 01289 g021
Table 1. Comparison of major international building energy simulation softwares.
TRNSYSPHPPEnergyPluseQUESTDeSTDesignBuilder
CountryUnited StatesGermanyUnited StatesUnited States of AmericaChinaUnited Kingdom
Development CompanyUniversity of WisconsinPassive House InstituteU.S. Department of Energy (DOE)JB EngineeringTsinghua UniversityDesignBuilder Software Ltd.
Development197519961999200020042006
Load Simulation MethodsModular Thermodynamic ModelingHeat Balance MethodHeat Balance and Fluid DynamicsSimplified ModelsHeat Balance MethodHeat Balance and Fluid Dynamics
Model Complexityhighmediumhighlowmediummedium
System Restructuringhighly flexiblelimitedflexiblelimitedlimitedflexible
Accurate Temperature Calculationsaccurateaccurateaccurateaccurateaccurateaccurate
Applicable Structuresall types of complex systemsprimarily for passive housesall types of buildingsresidential and small businessesChinese buildingsall types of buildings
Photovoltaic Modulesupportpartial supportsupportpartial supportpartial supportsupport
Data Input Methodmanual or scriptmanualmanual or batch inputsimple importmanualgraphical input
Output of Resultsreports and data outputreportsgraphs and data tablesgraphs and reportsreportsgraphs and reports
Table 2. Some thermal design zoning in China.
Name of the First-Level ZoneMain Indexes of the ClassificationName of the Second-Level ZoneMain Indexes of the Classification
Severe cold zonetmin·m ≤ −10 °CSevere cold zone A (1A)6000 ≤ HDD18
Severe cold zone B (1B)5000 ≤ HDD18 < 6000
Severe cold zone C (1C)3800 ≤ HDD18 < 5000
Cold zone−10 °C < tmin·m ≤ 0 °CCold zone A (2A)2000 ≤ HDD18 < 3800
CDD26 ≤ 90
Cold zone B (2B)2000 ≤ HDD18 < 3800
CDD26 > 90
Table 3. Number of thermal design zones for cities in Northeast China.
Provinces in Northeast ChinaNumber and Percentage of 1ANumber and Percentage of 1BNumber and Percentage of 1CNumber and Percentage of 2A
Heilongjiang Province6; 30%14; 70%00
Jilin Province03; 30%7; 70%0
Liaoning Province005; 50%5; 50%
Total number617125
Total Percentage15%42.5%30%12.5%
Table 4. Weather information and daily frequency of site outdoor air dewpoint temperature and dry bulb temperature in Changchun.
Location TemplatesDaily Frequency of Site Outdoor Air Dewpoint Temperature and Dry Bulb Temperature in Changchun
LocationEnergies 18 01289 i001
SourceASHRAE/CSWD
WMO541,610
ASHRAE climate zone6A
Latitude43.90
Longitude125.22
Elevation (m)238.0
Standard pressure (kPa)98.5
Time zone(GMT+8:00) Beijing
Winter design weather
Outside design temperature−25 °C
Wind speed2.0
Wind direction220.0
Table 5. The POI data of Changchun Tractor Factory.
Categories NameAreaNumber Percentage   P i Deviation Average (Di)Normalized Percentage P i
sportsSurrounding1975.04%−0.031710.23%
Citywide3912
mallsSurrounding9412.00%−0.038024.37%
Citywide783
parksSurrounding156.73%−0.014813.66%
Citywide223
tourismSurrounding264.20%−0.04018.53%
Citywide619
educationSurrounding4359.44%0.012319.17%
Citywide4610
exhibition hallSurrounding911.84%0.036324.03%
Citywide76
Table 6. The overall technical pathway for the “Two Enhancements and Two Reductions” reuse design strategy.
Reuse Strategy DeconstructionTechnology PathwayTechnology Support
Increase the functionality of the spaceConstructing Variable Composite Structure SystemMovable wall panel track system
Foldable three-glass, two-cavity inert gas-filled windows
Removable dual-cavity ultra-low-energy light steel composite panels
Increase the diversity of energy-saving materialsReducing the energy consumption of renewed buildingsReduction of heating (cooling) loss through the high performance of new energy-saving materials themselves
reducing profile sizesModular architectureReduced profile sizes of modularized buildings 4.5 m × 3 Nm as the standard module size
reducing carbon emissionsNew energy-saving materials and standardizationCarbon reduction advantages and reuse of energy-saving materials
Table 7. Explanation of the technical program level for the application of the “Two Enhancements and Two Reductions” strategy to the case.
Program LevelCharacterizationValidation Objectives
Case 1L0—Baseline modelPartial area of the original plantEstablishing a Baseline for building energy consumption
Case 2L1—Energy Complement Model+The structural system of the “Two Enhancements and Two Reductions” strategy
+ Solar panel
Effectiveness of spatial reconfiguration and renewable energy
Case 3L2—Thermal control model with spatial reconfiguration zoning+The structural system of the “Two Enhancements and Two Reductions” strategy
+ Solar panel
+ Zone temperature control
Effectiveness of spatial reconfiguration, renewable energy, and zonal temperature control
Case 4L3—Comfort Optimization Model+The structural system of the “Two Enhancements and Two Reductions” strategy
+ Solar panel
+ Zone temperature control
+ Dynamic natural lighting
Dynamic optimization of energy consumption changes and comfort
Table 8. Basic information for Cases 1–4.
Cooling SystemSolar PanelsZone Temperature ControlInternal Space
Internal Enclosure DividingInterior Structure Roof Lighting
Case 1Applicable----
Case 2Applicable16 groups ---
Case 3Applicable30 groupsApplicableApplicable-
Case 4Applicable30 groupsApplicableApplicableApplicable
Table 9. Material information for Cases 1–4.
Roof MaterialEnvelope (Restoration Only)Internal Space
Removable Dividing WallInterior Side WindowsInterior RoofInternal Roof Windows
Case 1250 mm prefabricated concrete panel + 80 mm laminated steel panel490 mm red brick repair----
Case 2----
Case 3Rockwool composite panelTriple-glazed, double-cavity inert gas-filled windowsDouble-cavity ultra-low energy consumption light steel composite panel-
Case 4Double-cavity inert gas-filled windows
Table 10. Full-coverage design parameter information for use of space for Cases 1–4.
SpacesLighting Power Density for Different Functional Spaces (W/m2)Lighting Power Density with Full-Coverage Design (W/m2)Equipment Power Density for Different Functional Spaces (W/m2)Equipment Power Density with Full-Coverage Design (W/m2)Fresh Air Volume for Different Functional Spaces (m3/h·person)Fresh Air Volume with Full-Coverage Design (m3/h·Person)
Usage spaces of Case 1–4General
commercial = 10
Upscale
commercial = 16
General classroom = 9
Art classroom = 15
Exhibition = 10
16General
commercial = 13
Upscale
commercial = 13
General
classroom = 5
Art classroom = 5
Exhibition = 10
13General commercial = 19
Upscale
commercial = 19
General
classroom = 24
Art classroom = 20
Exhibition = 20
24
SpacesPersonnel Density for Different Functional Spaces (m2/h·Person)Personnel Density with Full-Coverage Design (m2/h·Person)Room Summer Set Temperature for Different Functional Spaces (°C)Room Summer Set Temperature with Full-Coverage Design (°C)Room Winter Set Temperature for Different Functional Spaces (°C)Room Winter Set Temperature with Full-Coverage Design (°C)
Usage spaces of Case 1–4General
commercial = 4
Upscale
commercial = 4
General
classroom = 1.39
Art classroom = 4
Exhibition = 4
4General
commercial = 26
Upscale
commercial = 26
General
classroom = 26
Art classroom = 26
Exhibition = 20
26General
commercial = 20
Upscale
commercial = 20
General
classroom = 18
Art classroom = 18
Exhibition = 20
20
Table 11. Parametric information for the hallway for Cases 1–4.
NameLighting Power Density (W/m2)Equipment Power Density (W/m2)Personnel Density (m2/Person)Fresh AirLighting Power Density (W/m2)Equipment Power Density (W/m2)
Case 2 hallway7134192620
Cases 3–4 hallway7134192610
Table 12. Nominal efficiency of individual equipment.
TypeNominal Efficiency
Heating system: coal-fired boilerη = 85%
LED lightingη = 95%
Cooling system: inverter air conditioner (GB 21455-2019 standard) [70]Annual Performance Factor: APF = 4.8
Domestic Hot Water systems (DHW)CoP = 0.85
Solar PanelPV Constant Efficiency = 20%
Table 13. The monthly temperature results output by DesignBuilder.
DateRelative Humidity (%)Fanger PMVFanger PPD
(%)
Air TemperatureRadiant TemperatureOperative TemperatureOutside Dry-Bulb Temperature
Jan12.11028−1.8374653.0313114.6863312.9206613.80349−15.3989
Feb12.35588−1.6438349.1269915.305114.2690614.78708−9.48382
Mar20.13476−1.3377442.9594716.3932215.9410116.16712−3.31946
Apr27.02408−2.2159968.8072917.3170618.4624217.889747.259167
May35.56598−1.0427534.488621.0449922.7067221.8758615.05538
Jun50.804152.65 × 10−221.2769924.1624625.9989425.080720.20503
Jul64.016170.66013420.4943825.7480927.9007226.824422.94425
Aug61.843070.34935219.1998824.8787226.8775525.8781421.30336
Sept45.78144−0.79827.501321.5168623.4814922.4991815.21132
Oct36.45867−0.6707522.96618.5391919.5796319.059417.616667
Nov21.47486−1.3980443.7786316.2111315.4363715.82375−5.01031
Dec16.05555−1.7582251.6498314.9678613.3029614.13541−11.6448
Table 14. The monthly energy consumption throughout the year.
Date/TimeRoom Electricity (kWh)Lighting (kWh)Heating (kWh)
Jan134,958.4114,195.51.00 × 108
Feb121,897.9103,144.46.51 × 107
Mar134,958.4114,195.54.63 × 107
Apr130,604.9110,511.84,406,595
May134,958.4114,195.50
Jun130,604.9110,511.80
Jul134,958.4114,195.50
Aug134,958.4114,195.50
Sept130,604.9110,511.80
Oct134,958.4114,195.57,094,450
Nov130,604.9110,511.85.27 × 107
Dec134,958.4114,195.58.21 × 107
Annual all1,589,0261,344,5613.58 × 108
Energy consumption per unit area (kWh/m2)86.8373.4719,562.84
Table 15. Human comfort evaluation standard according to Chinese standard [74].
LevelEvaluation Indicator 1Evaluation Indicator 2Explanation
Level I−0.5 ≤ PMV ≤ +0.5PPD ≤ 10%Thermal environment in which 90% of the population is satisfied
Level II−1 ≤ PMV < −0.5
or +0.5 < PMV ≤ +1
10% < PPD ≤ 25%Thermal environment in which 75% of the population is satisfied
Level IIIPMV < −1 or PMV < +1PPD > 25%Thermal environment in which less than 75% of the population is satisfied
Table 16. The energy consumption and its proportions for Cases 1–4 in the run period.
CategoryIndicatorOriginal ModelCase 1Case 2Case 3Case 4
RoomEnergy consumption (kWh)1,589,026155,024153,890153,890139,916
Energy consumption per unit area (kWh/m2)86.83265.4965.0165.0159.11
Percentage 0.44%0.5445%0.5408%19.0981%15.5237%
PEC1,966,692.91191,868.86190,465.34190,465.34173,170.11
LightingEnergy consumption (kWh)1,344,56156,92662,50962,53257,713
Energy consumption per unit area (kWh/m2)73.4724.0526.4126.4224.38
Percentage 0.37%0.1999%0.2196%7.7604%6.4032%
PEC1,664,125.4470,455.7177,365.6477,394.1071,429.76
HeatingEnergy consumption (kWh)358,000,00028,186,46728,077,519424,385551,408
Energy consumption per unit area (kWh/m2)19,562.8411,908.1011,862.07179.29232.96
Percentage 99.19%99.0029%98.6612%52.6673%61.1787%
PEC51,736,260.184,073,358.634,057,614.0561,329.8779,686.56
CoolingEnergy consumption (kWh) 71,93485,45285,82480,303
Energy consumption per unit area (kWh/m2)30.3936.1036.2633.93
Percentage 0.2527%0.3003%10.6510%8.9096%
PEC17,620.6620,931.9721,023.1019,670.69
DHWEnergy consumption (kWh)--79,15479,15471,967
Energy consumption per unit area (kWh/m2)33.4433.4430.40
Percentage 0.2781%9.8232%7.9847%
PEC116,335.44116,335.4105,772.5
AllEnergy consumption (kWh)360,933,58728,470,35028,458,524805,784901,307
Energy consumption per unit area (kWh/m2)19,723.1512,02812,023340.42380.78
PEC55,367,078.534,353,303.864,346,376.99350,212.40343,957.12
Generation (Electricity)--−163,978−203,946−203,946
Table 17. Comparison of energy-saving requirements for ultra-low-energy public buildings and the situation of this project.
Energy Efficiency Requirements for Public Buildings with Low Energy ConsumptionLimit ValuesThis Project
Building envelope’s airtightness (N50, h−1)≤1.0New structures under the “Two Enhancements and Two Reductions” reuse strategy (Case 3,4)
Original factory > 1.0
Comprehensive energy-saving rate η≥50%92% (Case 3,4)
Energy-saving of the building itself≥25%10%
Renewable energy utilization rate≥10%14.82% (Case 3,4)
Disclaimer/Publisher’s Note: The statements, opinions and data contained in all publications are solely those of the individual author(s) and contributor(s) and not of MDPI and/or the editor(s). MDPI and/or the editor(s) disclaim responsibility for any injury to people or property resulting from any ideas, methods, instructions or products referred to in the content.

