Article

Experimental Study on Heat Transfer Coefficients in an Office Room with a Radiant Ceiling During Low Heating Loads

Department of Power Systems and Environmental Protection Facilities, Faculty of Mechanical Engineering and Robotics, AGH University of Krakow, al. A. Mickiewicza 30, 30-059 Krakow, Poland
Energies 2025, 18(7), 1591; https://doi.org/10.3390/en18071591
Submission received: 15 February 2025 / Revised: 18 March 2025 / Accepted: 20 March 2025 / Published: 22 March 2025

Abstract

:
Estimation of the heating or cooling capacity of radiant systems requires selecting appropriate internal heat transfer coefficients by convection (CHTCs) and radiation (RHTCs). Due to practical reasons, their measurement during the normal use of buildings is very troublesome. This study attempts to present the results of measurements of CHTCs and RHTCs taken in an office room located in a passive building with a heated concrete ceiling. Special attention was paid to the proper choice of reference temperatures. For better accuracy, view factors for radiant heat exchange were calculated using Matlab. Average values of CHTCs and RHTCs calculated from measurements amounted to 0.80 W/m2K and 5.66 W/m2K. RHTCs showed a significant correlation against the ceiling temperature, with the coefficient of determination being R2 = 0.96. Finally, the total heat transfer coefficient of 6.47 W/m2K was obtained. These values are comparable with other studies and standards and confirm that measurements were performed correctly.

1. Introduction

Water-based radiant heating and cooling systems have become increasingly popular in recent decades due to their positive features as good indoor climate and effective cooperation with low-temperature sources such as heat pumps [1,2].
The ISO 11855 standard [3] categorises these systems into several groups. Depending on construction and geometry, they are labelled from A to G. Among them, an interesting solution is the Type E (named Thermally Activated Building System—TABS) in which pipes are embedded in a massive concrete layer of a floor or a ceiling, and heat is transferred to both adjacent zones, below and above it. When located in a given zone as a ceiling, it can operate as radiant ceiling cooling (RCC) or radiant ceiling heating (RCH). The first solution was analysed in numerous theoretical and experimental works [4,5,6]. However, as recently stated in [7,8], radiant ceiling heating (RCH) was rarely studied in the literature. If so, the authors focused mainly on energy consumption [9], indoor comfort [10], or economic aspects [11].
To estimate the cooling or heating capacity of such systems, heat transfer coefficients by convection (CHTC) and radiation (RHTC) are necessary. Several authors have published their works on indoor heat transfer in buildings with radiant ceiling systems recently.
Causone et al. [12] measured heat transfer coefficients of a radiant ceiling in an environmental chamber (floor area of 11.6 m2) acting as an office room. Using heated cylinders and cooled surfaces they simulated heat gains and losses, respectively. Tests were performed both in cooling and heating modes, at various working water flow rates and supplying temperatures. The authors emphasised the important role of the reference temperature in the calculations of heat transfer coefficients.
Rahimi and Sabernaeemi [13] studied heat transfer by radiation and free convection from a heated ceiling to other internal surfaces of a cubical (edge length of 2.4 m) test chamber. Based on their measurements, they concluded that over 90% of the heat was transferred from the ceiling to the zone interior by radiation. However, heat transfer coefficients were not evaluated.
Cholewa et al. [14] used a small laboratory room (floor area of 2.43 m2) to measure heat transfer coefficients for the surface of a cooled and heated radiant floor. They recommended the correction of CHTCs from other models due to the high (24%) difference between their results and the literature data.
Yu et al. [15] presented tests of heating and cooling of a concrete ceiling with and without a ceiling panel in a test chamber under steady-state conditions. Natural ventilation with a diffuse ceiling inlet was used. Obtained heat transfer coefficients were compared with other references, showing visible differences in the case with a ceiling panel.
Koca and Gürsel [16] integrated hydronic ceiling heating with an additional heated wall to cover peak heating loads in cold climates. Then, they evaluated thermal characteristics and heat transfer coefficients for different configurations of this system. They also found that radiant heat exchange dominated with a share of 72% and 87% for the heated wall and heated ceiling cases, respectively.
In [17], experiments in a test room with heated radiant ceiling panels, made of gypsum board, water pipes, and thermal insulation, were described. The authors evaluated the heat transfer characteristics of this system under its different configurations in a room in 28 test cases. In the next paper [7], they enriched their investigation withCFD simulations. Then, experimental and simulation data were used as input for the artificial neural network (ANN) analysis. The predicted values of CHTCs and RHTCs were within the ±15% deviation range.
In [18], a radiant ceiling system in a test chamber was tested experimentally in both heating and cooling modes. Heat transfer coefficients were calculated and compared with values reported in the literature. The authors suggested using lower values of total heat transfer coefficients for the heating mode than those reported in the literature.
Based on this review, several outcomes can be formulated. At first, all the above experiments were performed in the laboratory, steady-state conditions with thoroughly controlled parameters. This way, high accuracy and reliability were maintained, the number of uncertainty sources was reduced, and the impact of various ambient factors was limited. The question then becomes how such an RHC system will behave in real-life conditions during operation in a building in daily use. Will it be possible to measure CHTCs and RHTCs under these conditions? If so, will the values obtained be comparable to those recommended by various standards and the literature?
What is more, all presented studies were carried out in rather small areas when compared to real spaces in residential or office buildings. Ceilings were made as 20 cm TABS with air cavities [15], 1.5 cm gypsum boards [7,16,17], or 2 cm granoliths [18], which are not typical construction materials in buildings. Therefore, these facts confirm the need to examine this type of radiant system in real facilities.
This study is an attempt to answer these questions and to give some new insights into the operation of radiant ceiling heating during its normal daily use. It also providesa chance to indicate the limitations of such experiments and to formulate possible measures to improve their quality in the future.
The paper is structured as follows: First, the studied object is presented, and measurement equipment is described. Then, the calculation procedure is given in detail. Next, the results of calculations of radiant, convective, and total heat transfer coefficients are presented. The results are compared with the data from the literature. Finally, concluding remarks are given.

2. Materials and Methods

2.1. Building Description

The research was conducted in a passive office building (Figure 1). This object is located in Katowice in south Poland and it was presented in [19,20]. It has a total and usable area of 8100 m2 and 7500 m2, respectively. Energy-efficient solutions were used in this object, such as triple-glazed external windows with external blinds, photovoltaic modules mounted on the roof and on the facade, and the three trackers in front of the building. Heating and cooling are provided mainly by a thermally activated building system (TABS) in the form of concrete ceiling heating and cooling and additional floor heating in the basement. It is supplied by a set of three cascade-connected two-compressor heat pumps. For energy monitoring purposes, the building management system (BMS) is used.
An office room (Figure 2), located on the west side of the second floor of the building, was used during the research. It is 7.95 m long, 5.80 m wide, and 3.1 m high.
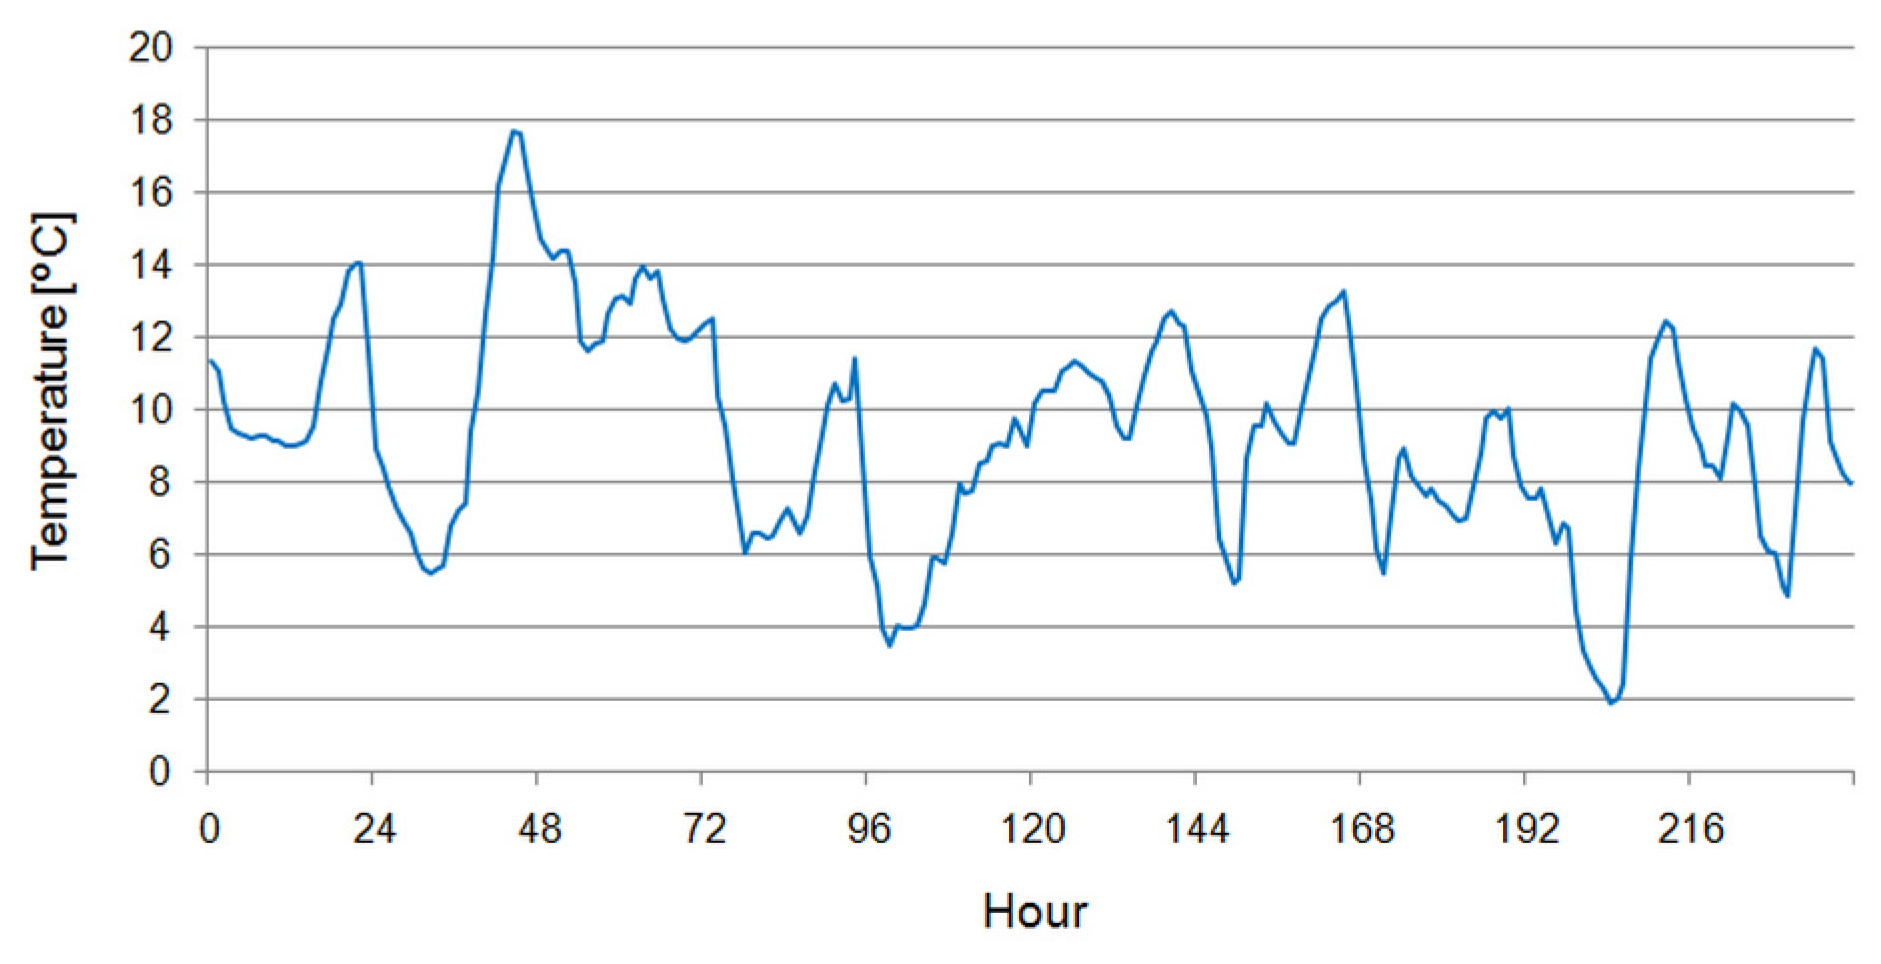
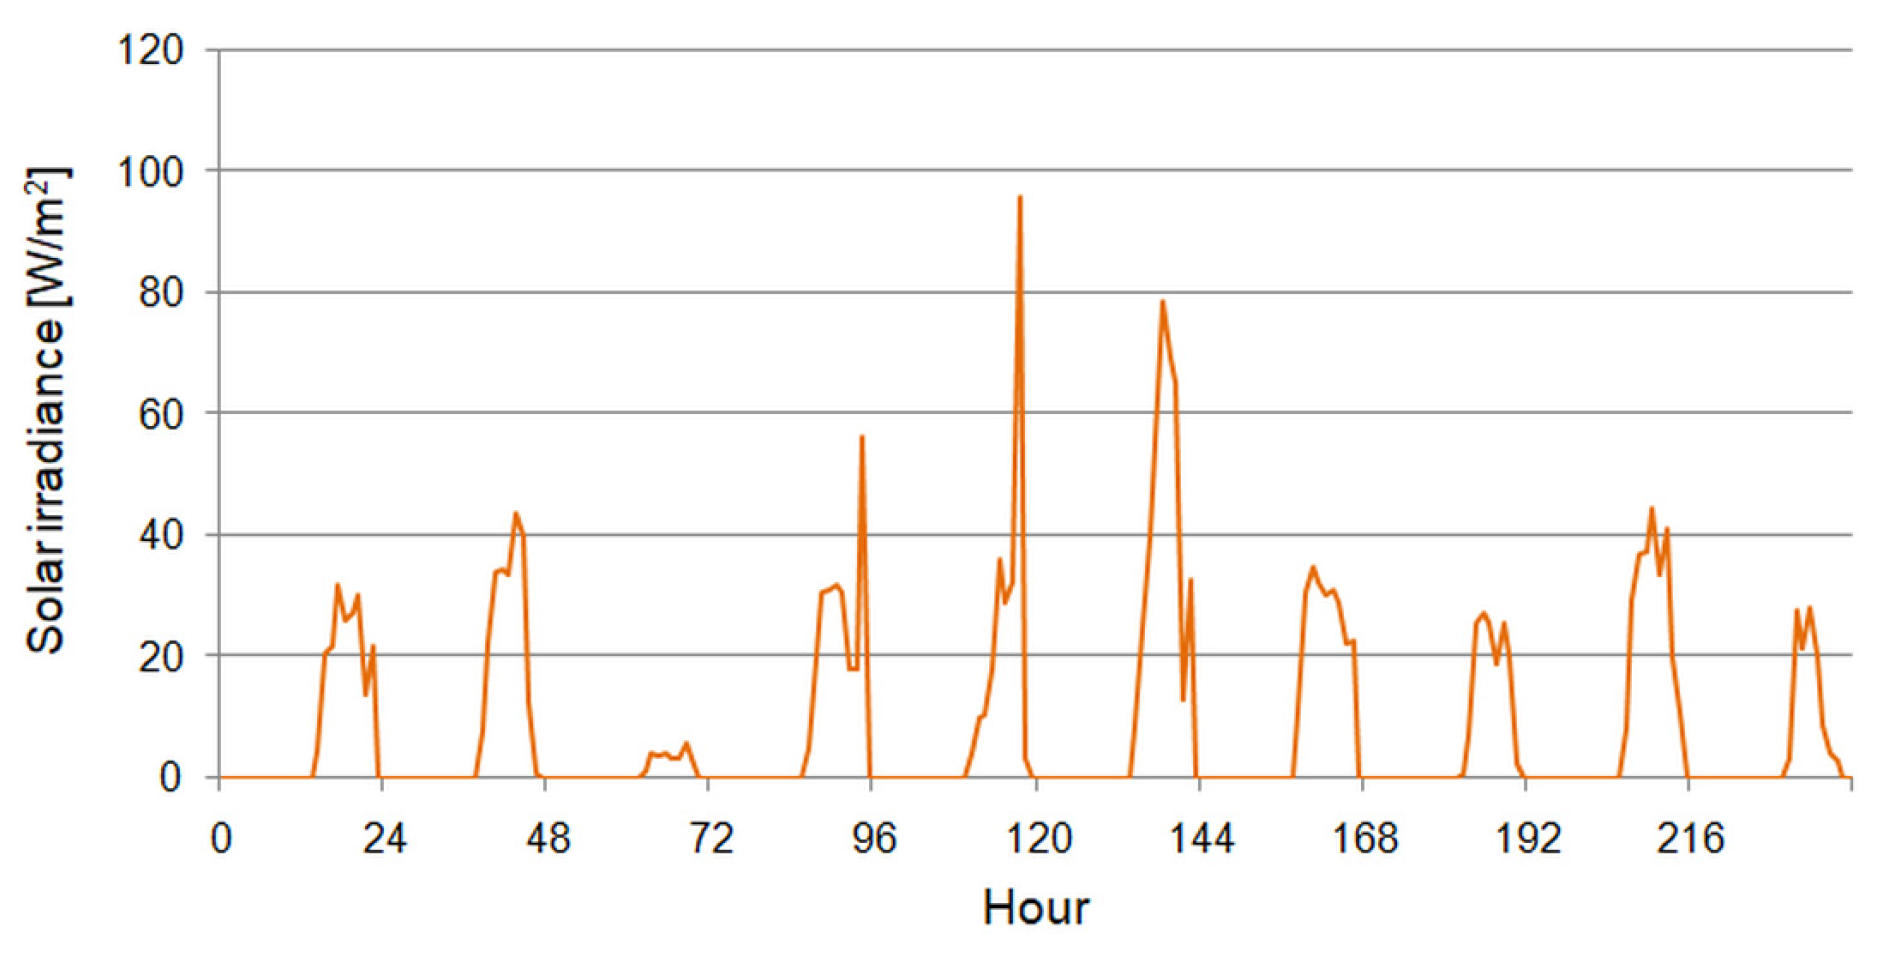
The measurements started on 31 October at 18:00 and ended on 10 November at 18:00. During this period, the outdoor air temperature (Figure 3) varied from 1.9°C (at 7:00 on 9 November) to 17.7°C (at 15:00 on 2 November). The weather was cloudy, and solar irradiance was low (Figure 4). When considering the external, west-facing wall with a window, it was up to 97 W/m2 (at 16:00 on 5 November).

2.2. Experimental Setup

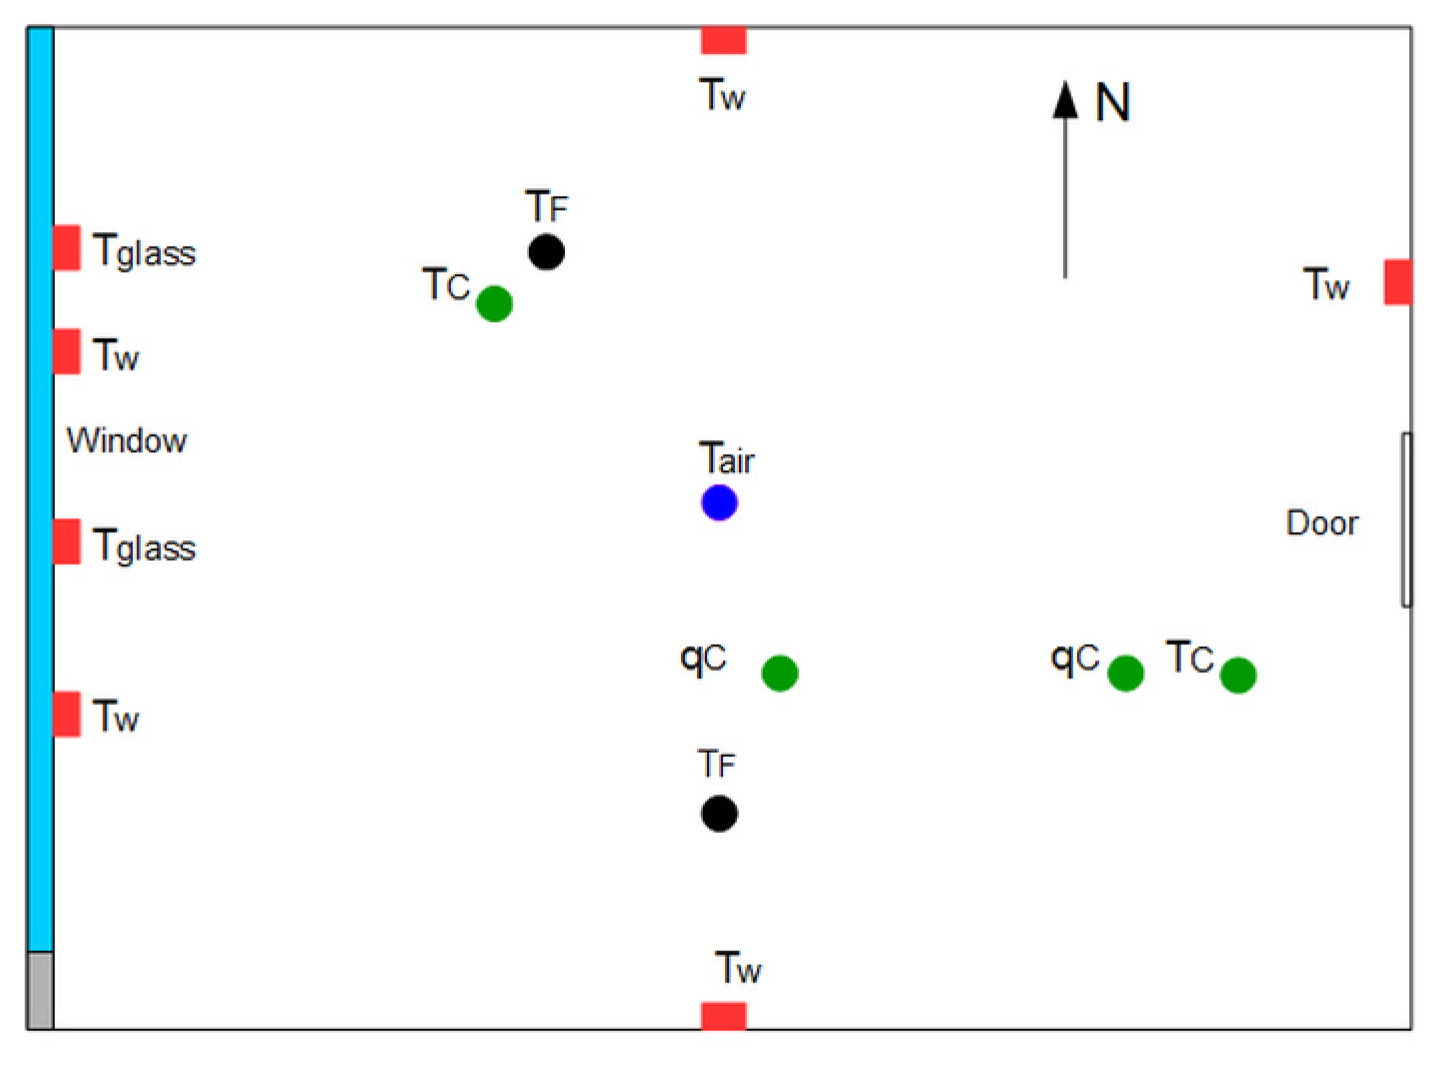
The measurement system was set from various sensors (Table 1). Platinum resistance sensors were used to measure the temperatures of internal and ambient air and the internal surfaces of all vertical walls, windows, ceilings, and floors. Global solar irradiance incident on the external wall was measured by the pyranometer. In the centre of the room, a tripod was placed with three cylindrical air temperature sensors (diameter 3 mm) at heights of 0.55 m, 1.5 m, and 2.2 m above the floor level. All sensors were connected to the Fluke 2638A data logger. Their locations are shown in Figure 5.
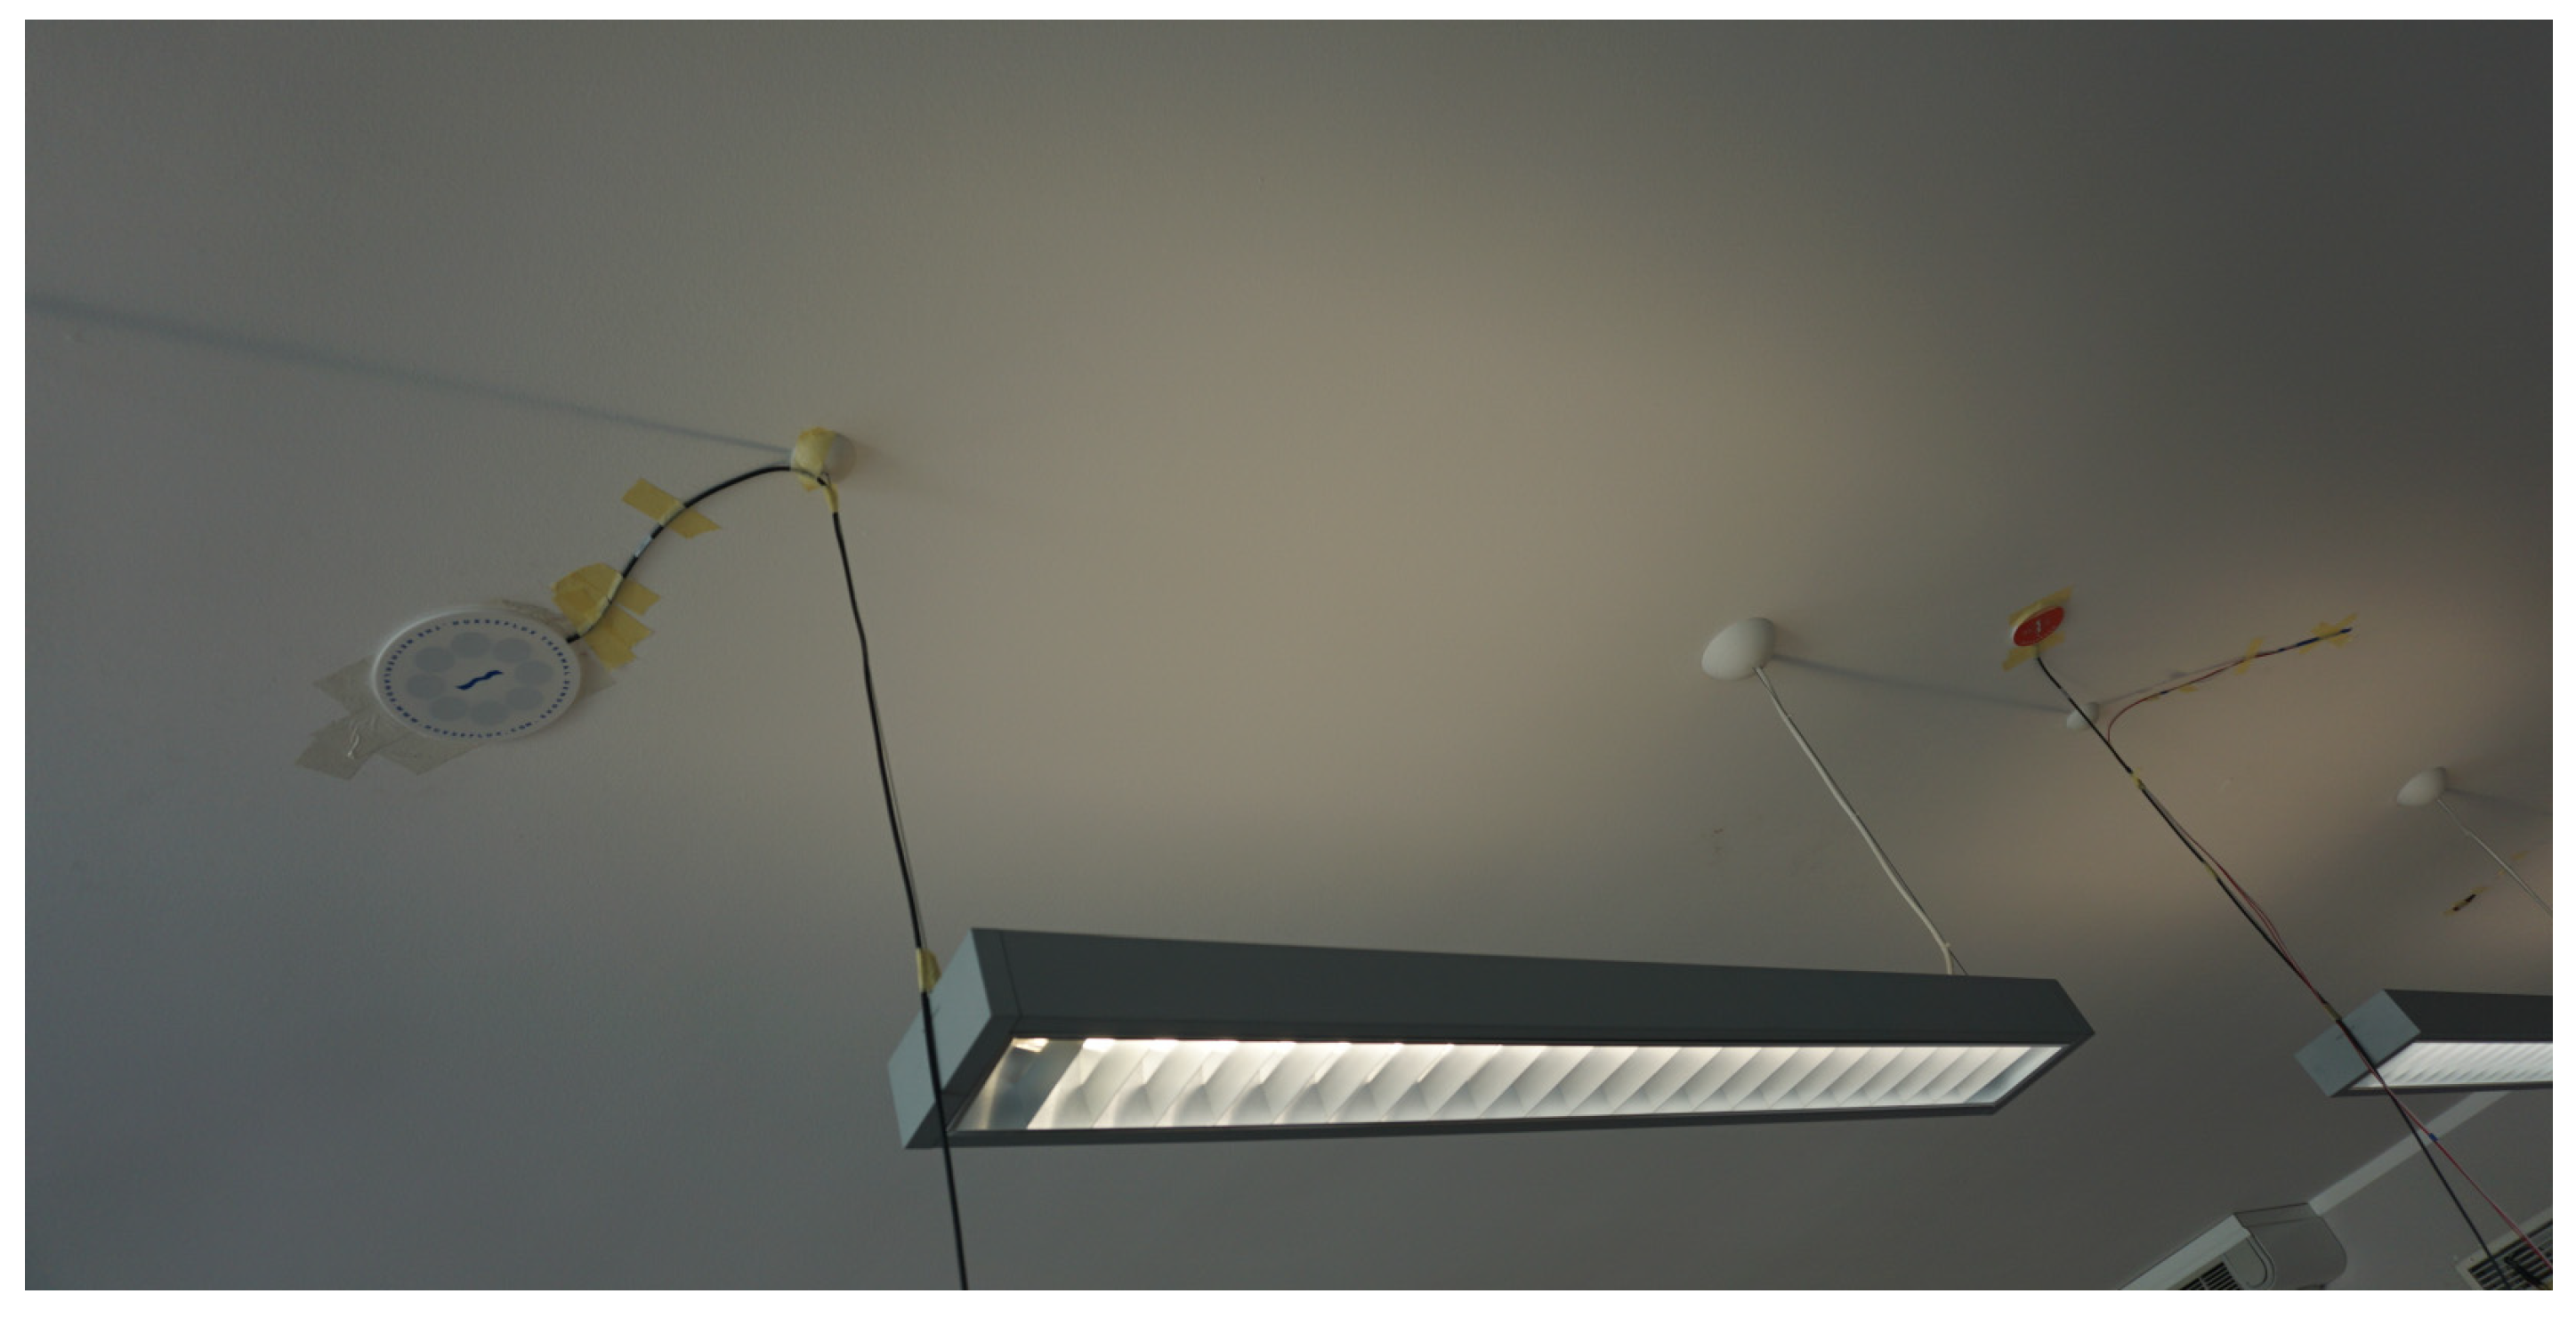
The ceiling heat flux was measured (Figure 6) by the HFP03 (white, on the left) and HFP01 (red coloured, on the right) heat flux sensors. This first sensor is an ultra-sensitive heat flux sensor. The manufacturer states that its nominal sensitivity is 500 μV/(W/m2). It was chosen due to low expected values of ceiling heat flux. The second heat flux sensor, HFP01, has a ten-times-lower nominal sensitivity. It had also one important role. Due to its dimensions, HFP03 is larger and heavier than HFP01. Consequently, even if adhesive tape is used according to the manufacturer’s instructions, it may dry and peel off from the ceiling more easily during measurement than the much lighter HFP01. By comparing the results from both sensors, one can easily capture such situations.
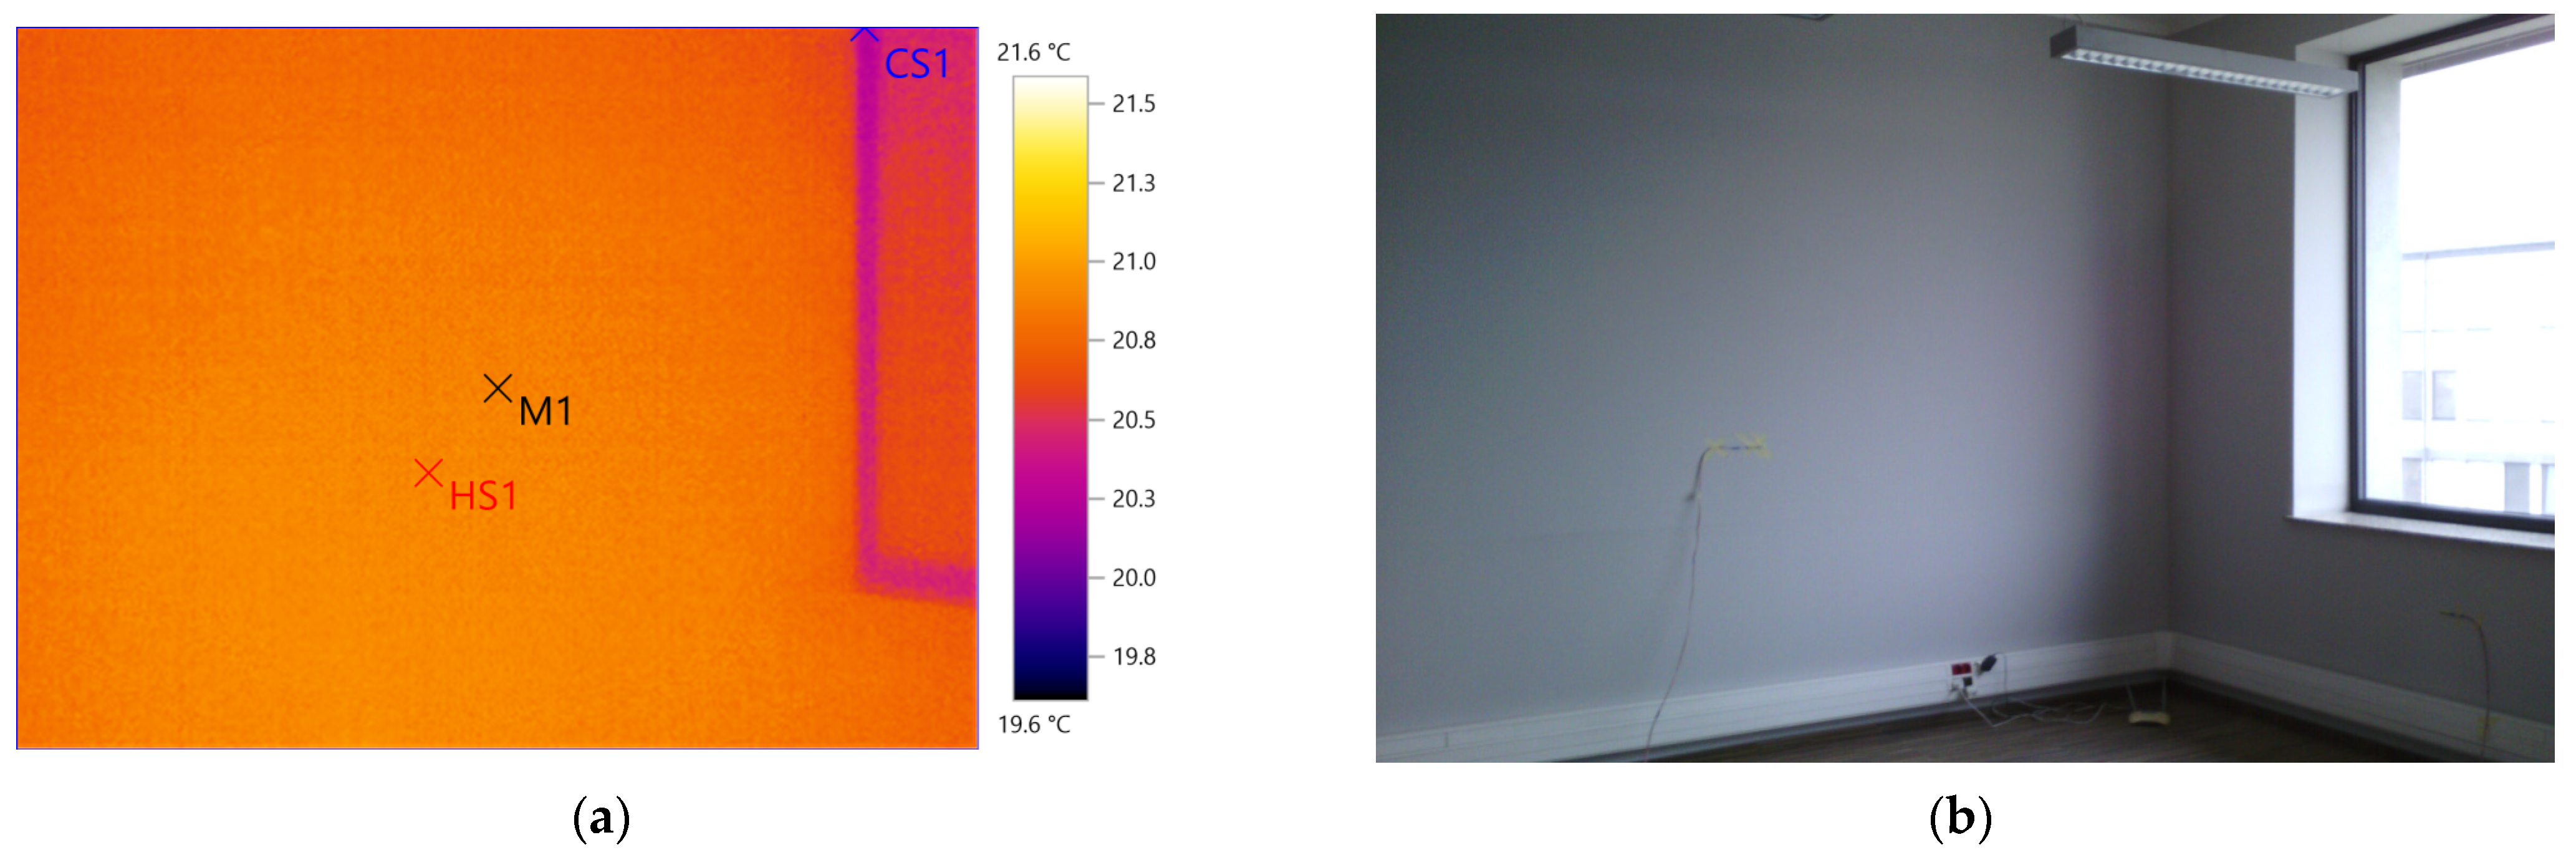
In this study, the internal surface temperature of each wall was measured with two temperature sensors. However, a vertical temperature gradient can adversely affect results based on the assumption of temperature uniformity. An analysis of the room was therefore carried out with the Testo 883 thermal imaging camera before the tests, which showed that there were no noticeable temperature differences on the internal surfaces. For example, Figure 7 shows a view of a window section and corner on the southwest side. Temperature differences are only visible on the window frame, but no longer on the walls.

2.3. Calculation Procedure

The total heat flux flowing through the ceiling surface (qtot) and measured by the heat flux sensor is the sum of radiant (qr) and convective (qc) fluxes entering an interior space of the room:
qtot = qr + qc.
Radiant heat transfer between the ceiling and other internal surfaces in the room creates a closed system. To obtain the RHTC, the average unheated surface temperature (AUST) is computed first [16,17]:
A U S T = j = 1 n F c j T j 4 4 .
These values can be obtained from the relevant view factors and surface temperatures. The view factor between the surface of interest (in this case, the ceiling, assigned by the “c” subscript) and j-th surface is given by
F c j = 1 A c A c A j c o s θ c c o s θ j π R 2 .
Then, the radiant heat transfer coefficient is obtained from
h r = ε σ q r A U S T T c .
Radiant heat flow exchanged by the ceiling and surrounding surfaces is expressed by the following relationship:
q r = j = 1 n σ F ε c j T c 4 T j 4 ,
with the following radiation interchange factor
F ε c j = 1 1 ε c ε c + 1 / F c j + A c / A j 1 ε j ε j .
As this method is computationally demanding [24], simpler ways have been developed to obtain radiant heat flux in a zone. If surface emissivities are equal within a studied enclosure, the area-weighted radiant temperature can be used [25,26]:
T r a d = j = 1 n A j T j j = 1 n A j .
Then, Equation (5) may be simplified to the well-known form commonly used in building calculations:
q r = h r T c T r a d .
with
h r = ε σ T c 4 T r 4 T c T r = ε σ T c + T r a d T c 2 + T r a d 2 .
Further, if the difference between surface temperatures within a zone is small enough and the mean temperature of all surfaces accounts for Tm, the equation can be written as [27,28]
h r = 4 ε σ T m 3 .
It should be noted that Equation (10) is also used in the EN ISO 6946 standard [29].
When qr is known, then, from Equation (1), qc can be obtained. On the other hand, qc is given by
q c = h c T c T a i r .
From the above, an unknown convective heat transfer coefficient can be computed.
The last examined parameter is the total heat transfer coefficient. It takes into account both radiant and convective heat transfer between the considered surface and its surroundings. In such a case as the reference variable, the operative temperature is used:
T o p = ( h c T a i r + h r A U S T ) / h c + h r .
Then,
h t o t = q t o t / ( T c T o p ) .

2.4. Selected Correlations for CHTC Calculations

During the last several decades, many experimental models have been developed to obtain CHTCs for surfaces of various orientations [8,30]. Among them, some relationships can be used for a heated ceiling to compare with other measurements.
Awbi and Hatton [31] conducted a series of experiments on convection in a test chamber (2.78 × 2.78 × 2.3 m) and a small box (1.05 × 1.01 × 1.05 m) under steady-state conditions. The internal surfaces of both objects were covered with aluminium plates to minimise radiant heat flux. In the case of a heated ceiling in the chamber, they proposed the following relationship:
h c = 0.704 D 0.601 T 0.133 ,
The ASHRAE handbook [32] gives a correlation for a downward-facing heated small plate with the length L:
h c = 0.59 T L 0.25 ,
The ASHRAE handbook of HVAC [33] gives correlations developed by Min [34] in a room 3.66 m long, 7.74 m wide, and 1.5 m above its floor. For natural convection from heated ceiling panels, when room size cannot be ignored,
h c = 0.20 T c T a i r 0.25 / D 0.25 ,
with D being the equivalent diameter of a panel (4× area/perimeter).
In a simpler form,
h c = 0.134 T c T a i r 0.25 .
In [16], the authors cited a relationship given in the CIBS guide:
h c = 1.32 T c T a i r L 0.25 .

3. Results and Discussion

3.1. Radiant Heat Transfer Coefficient

Following the first calculation method of the RHTC, presented in Section 2.3, view factors were calculated from Equation (3). For this purpose, Matlab R2017b code was used. The resulting values are given in Table 2.
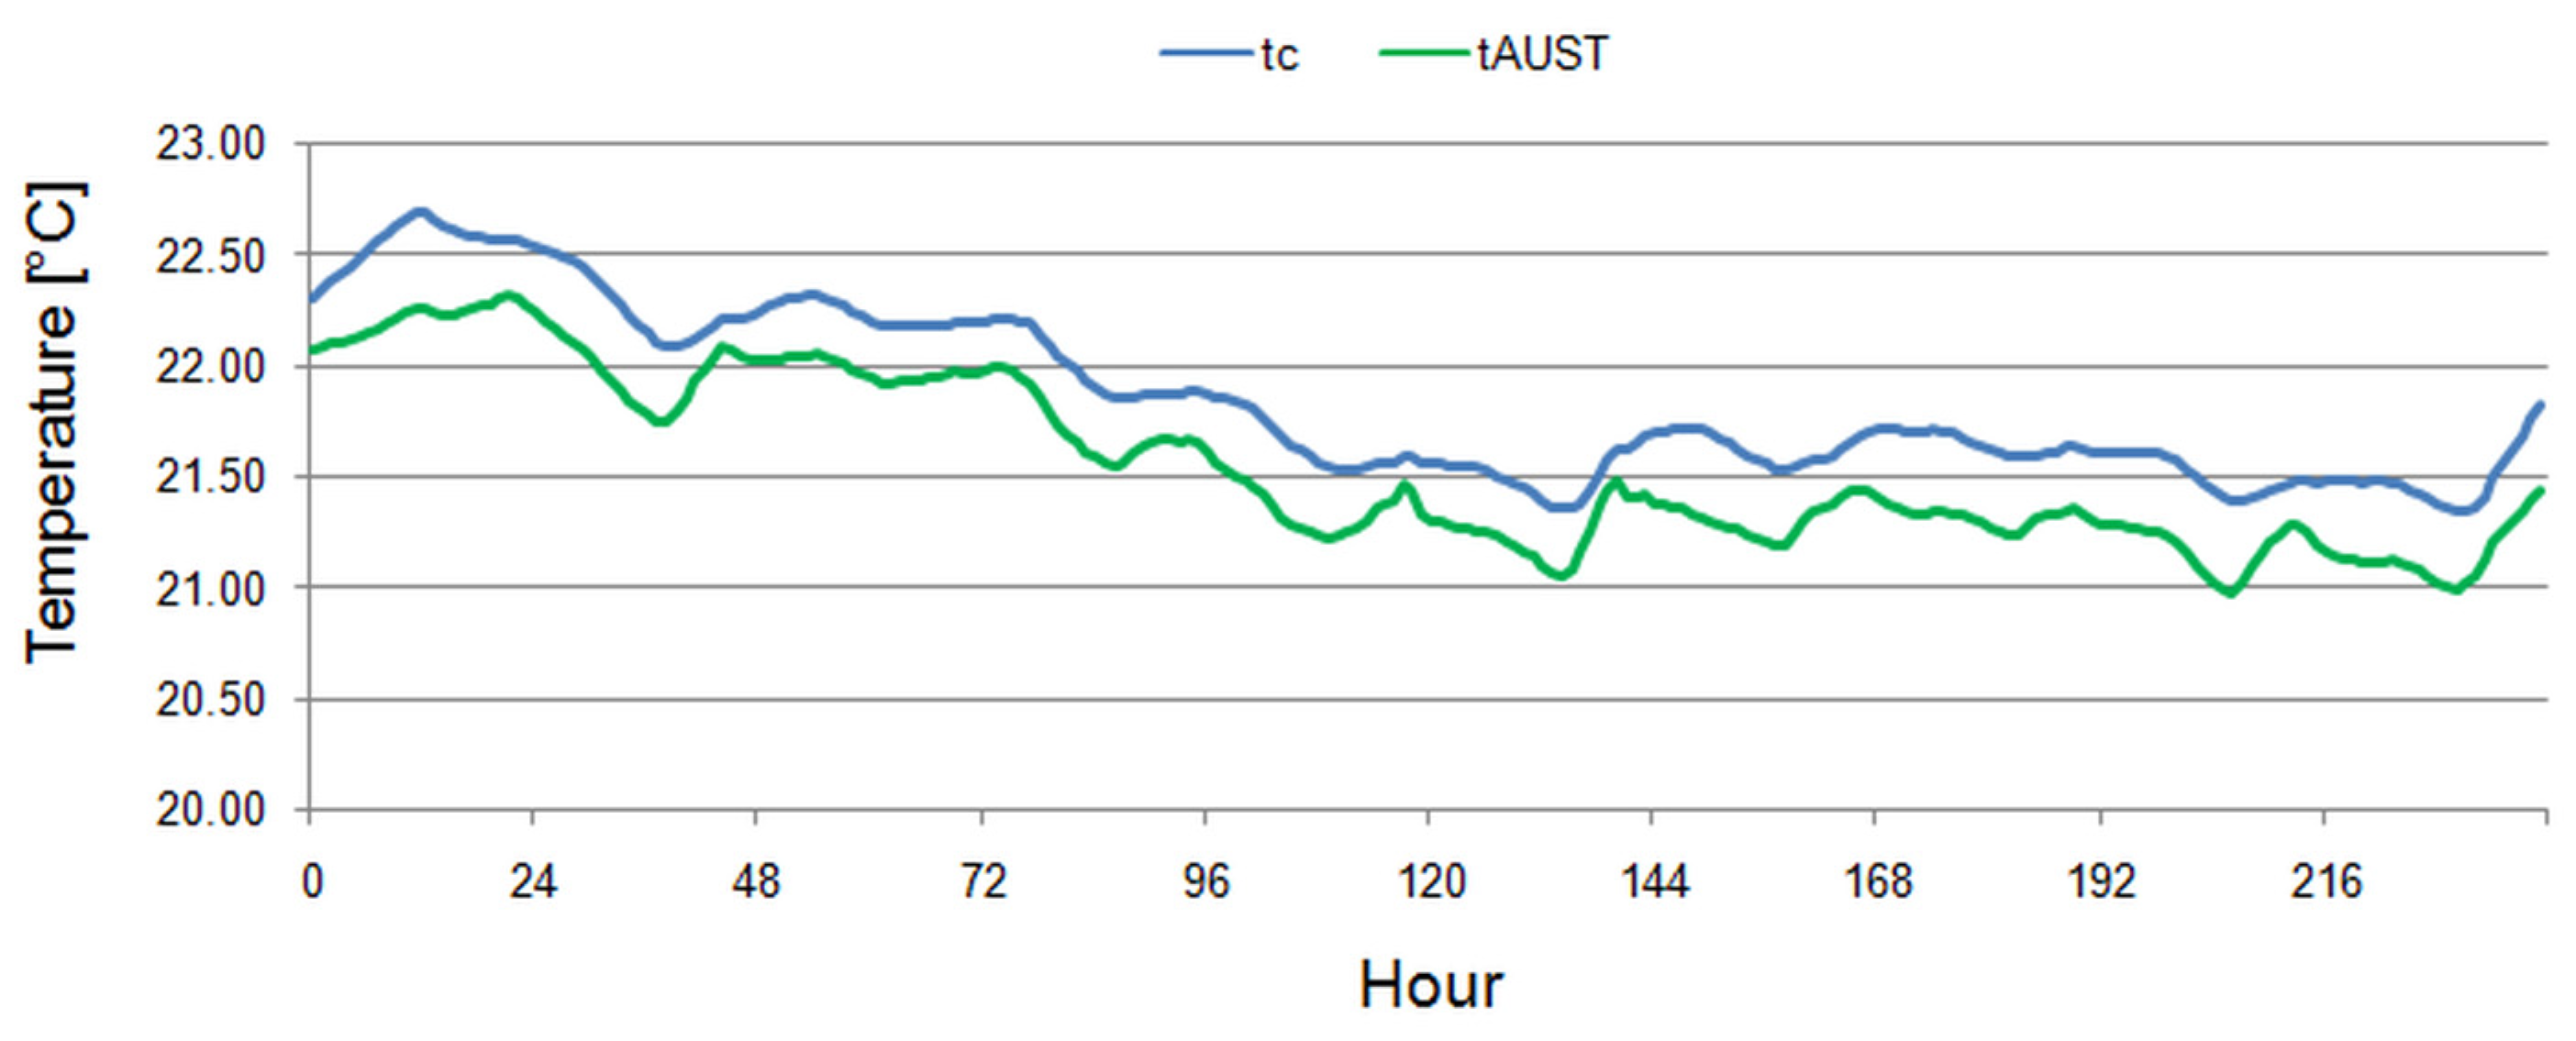
The average unheated surface temperature (Figure 8) was from 21.0°C (at 9:00 on 9 November) to 22.32°C (at 16:00 on 1 November) with 21.56°C on average. During the whole study, it was lower than the ceiling temperature, which varied from 21.34°C (at 22:00 on 7 November) to 22.68°C (at 6:00 on 1 November) with 21.85°C on average.
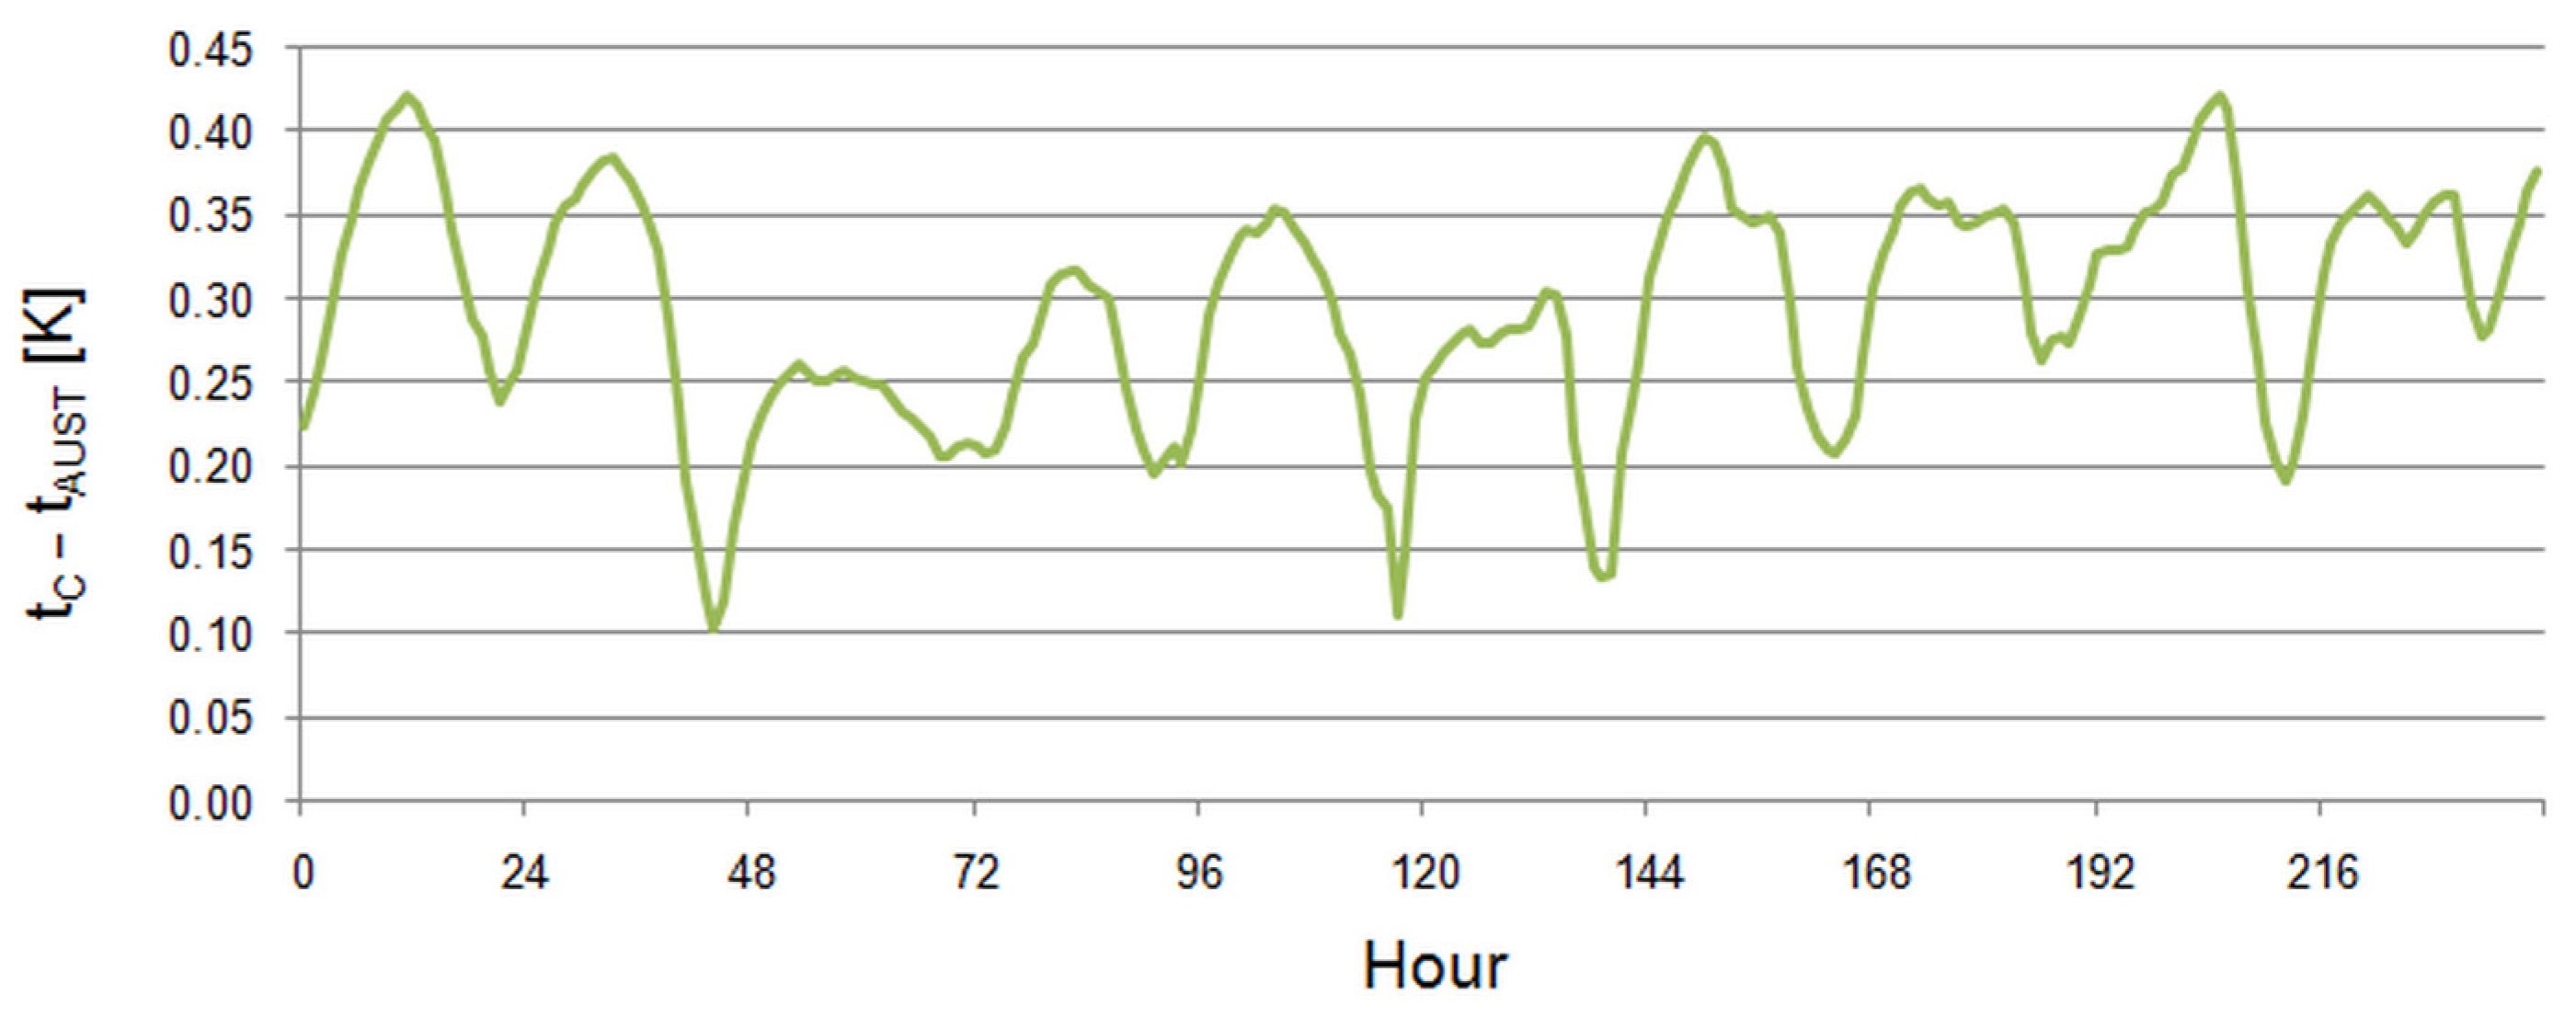
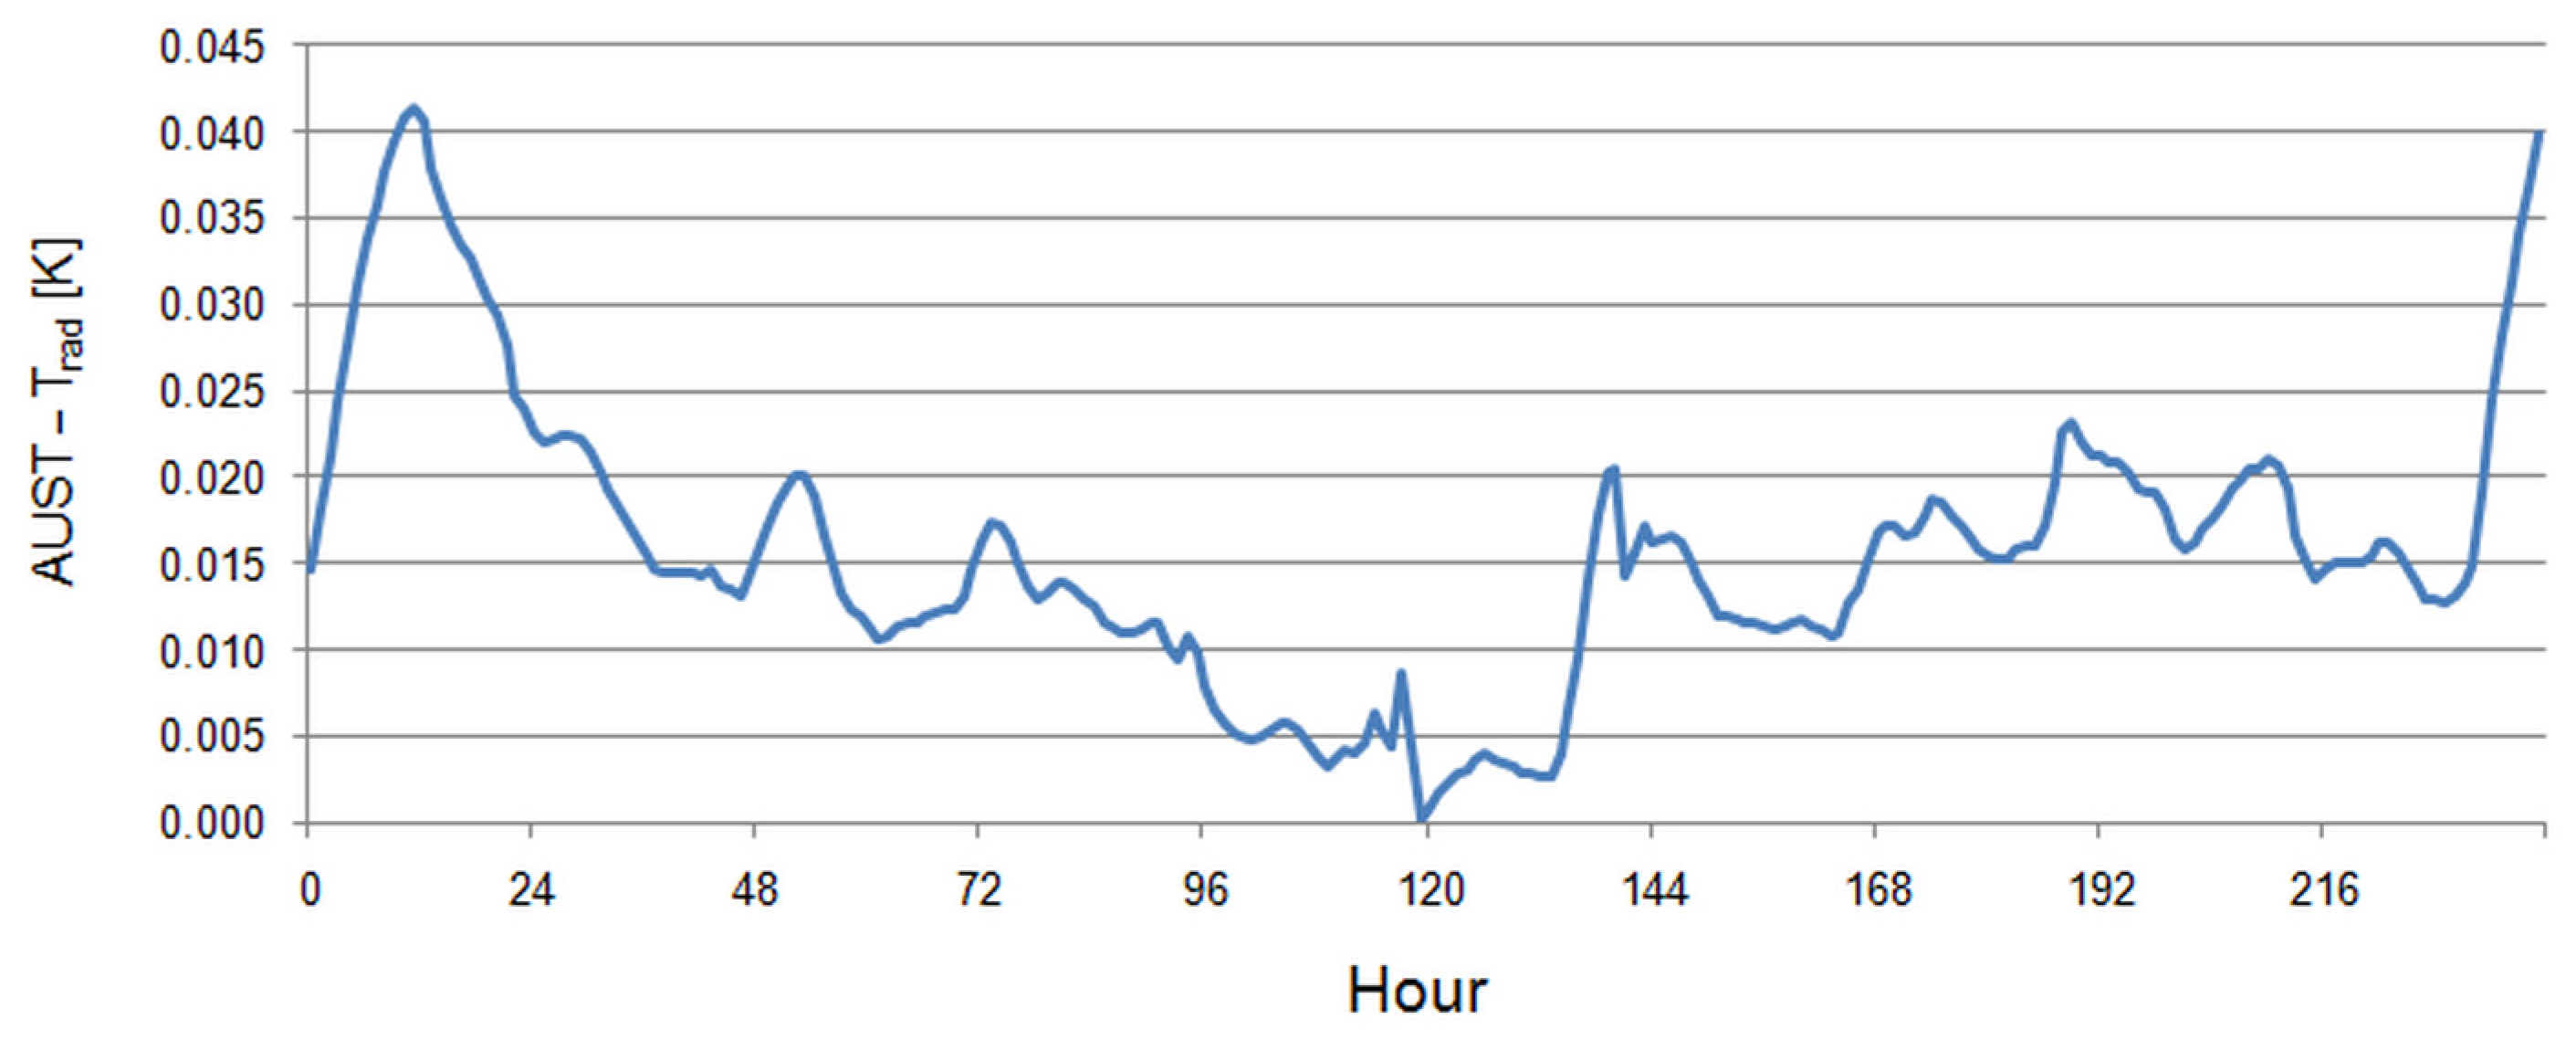
The difference between them (Figure 9) was from 0.10°C (at 15:00 on 2 November) to 0.42°C (at 6:00 on 1 November) with 0.30°C on average. It was very low, which means uniform thermal conditions in the room. In the next step, the area-weighted radiant temperature was calculated. Its comparison with AUST resulted in very small differences, with a maximum of 0.041 K (Figure 10), which can be treated as negligible.
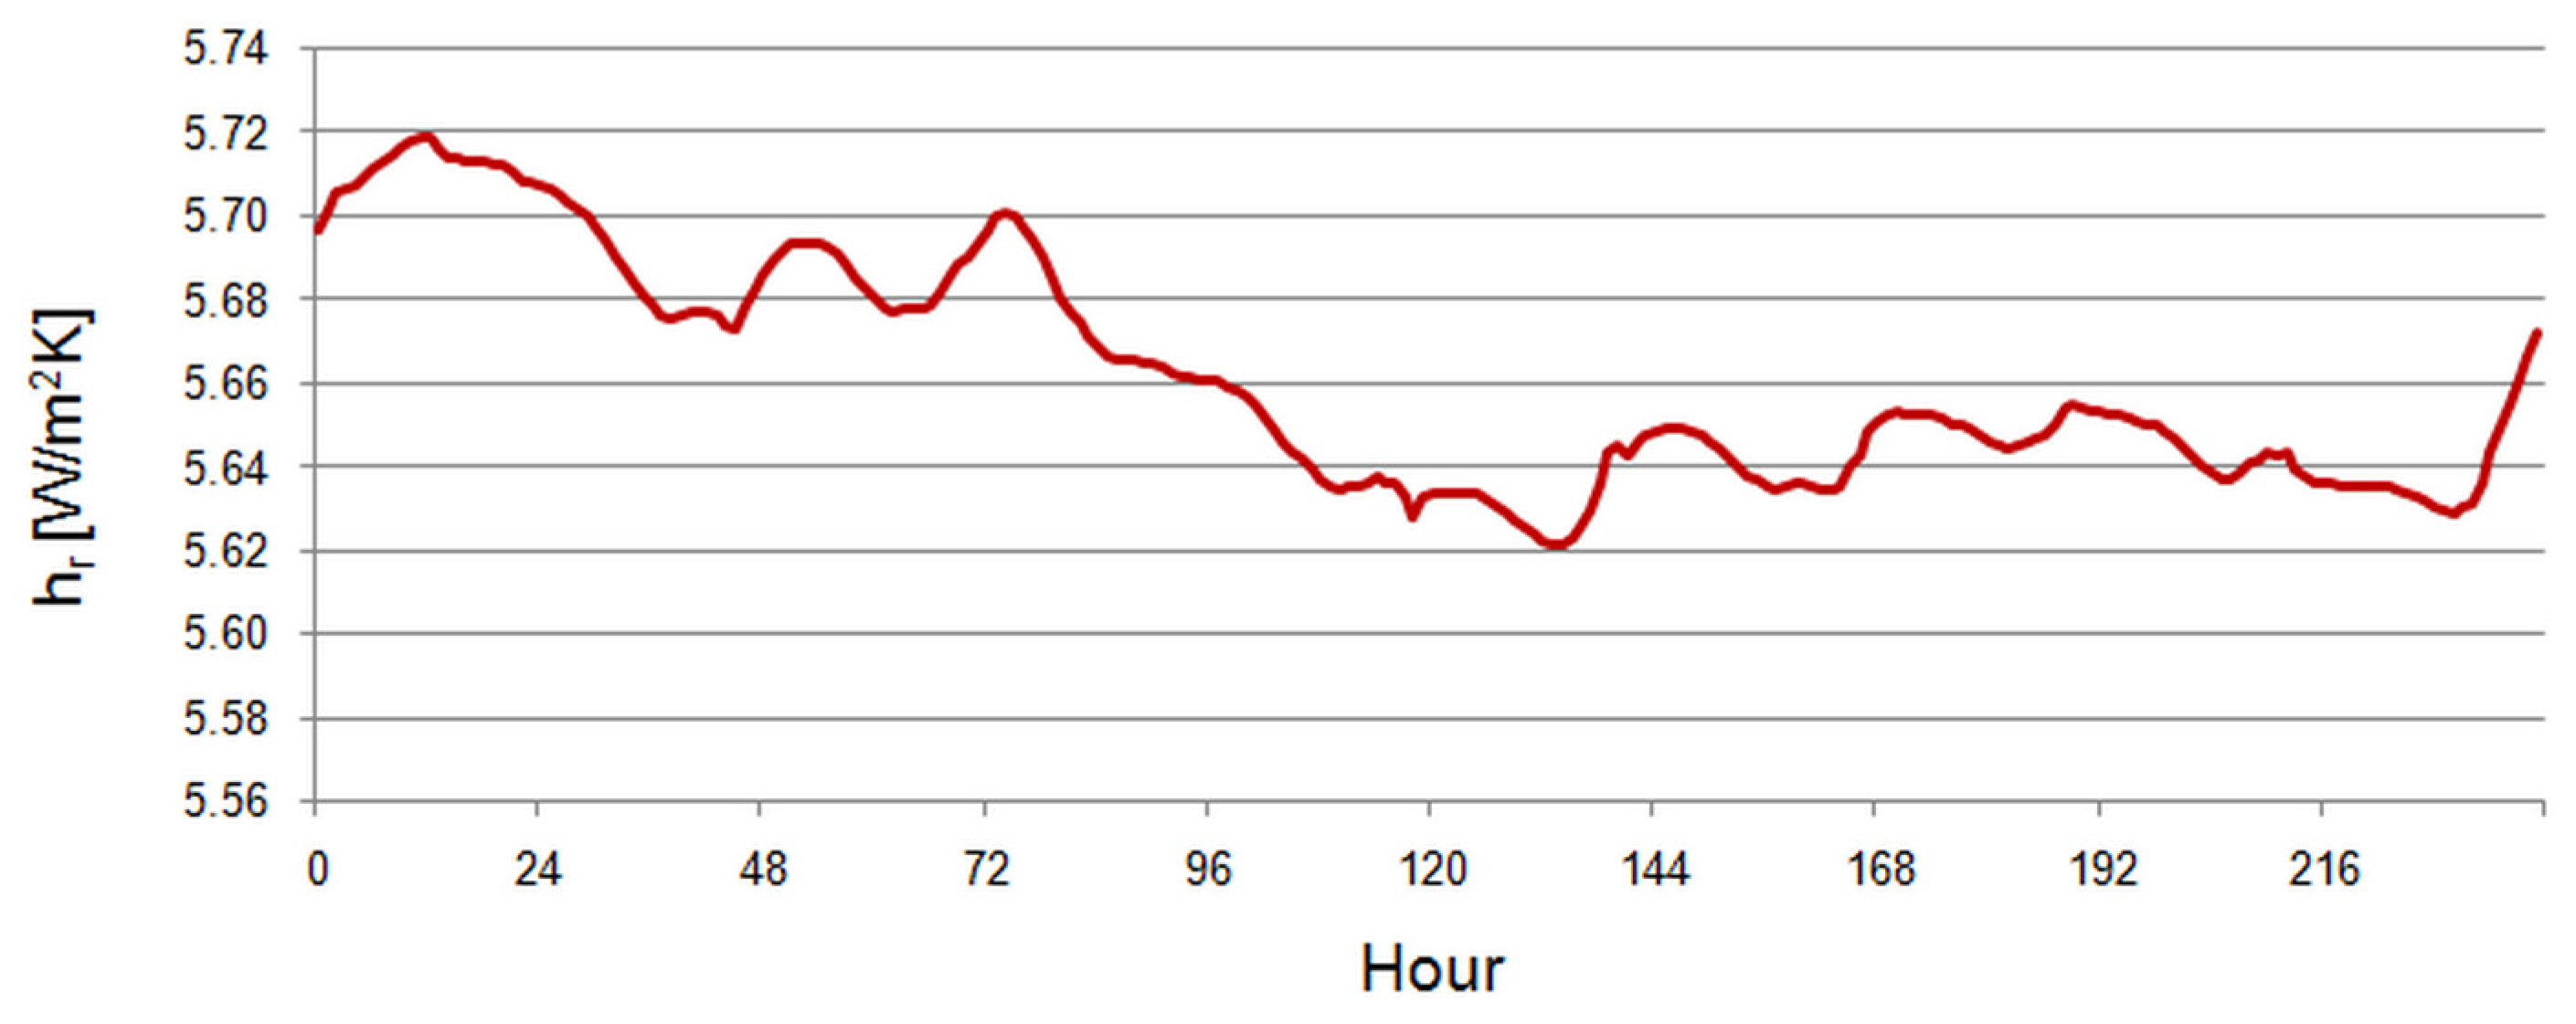
Therefore, both methods (involving AUST and Trad) were employed to compute the RHTC. In the first method, the resulting RHTC varied (Figure 11) from 5.621 W/m2K (at 8:00 on 6 November) to 5.718 W/m2K (at 21:00 on 31 October) with 5.661 W/m2K on average.
RHTCs were calculated from the simplified relationship (Equation (10)) at the average temperature tmn = 21.7 °C and emissivity ε = 0.95, hr = 5.523 W/m2K, which is very close to the obtained average value of 5.661 W/m2K.
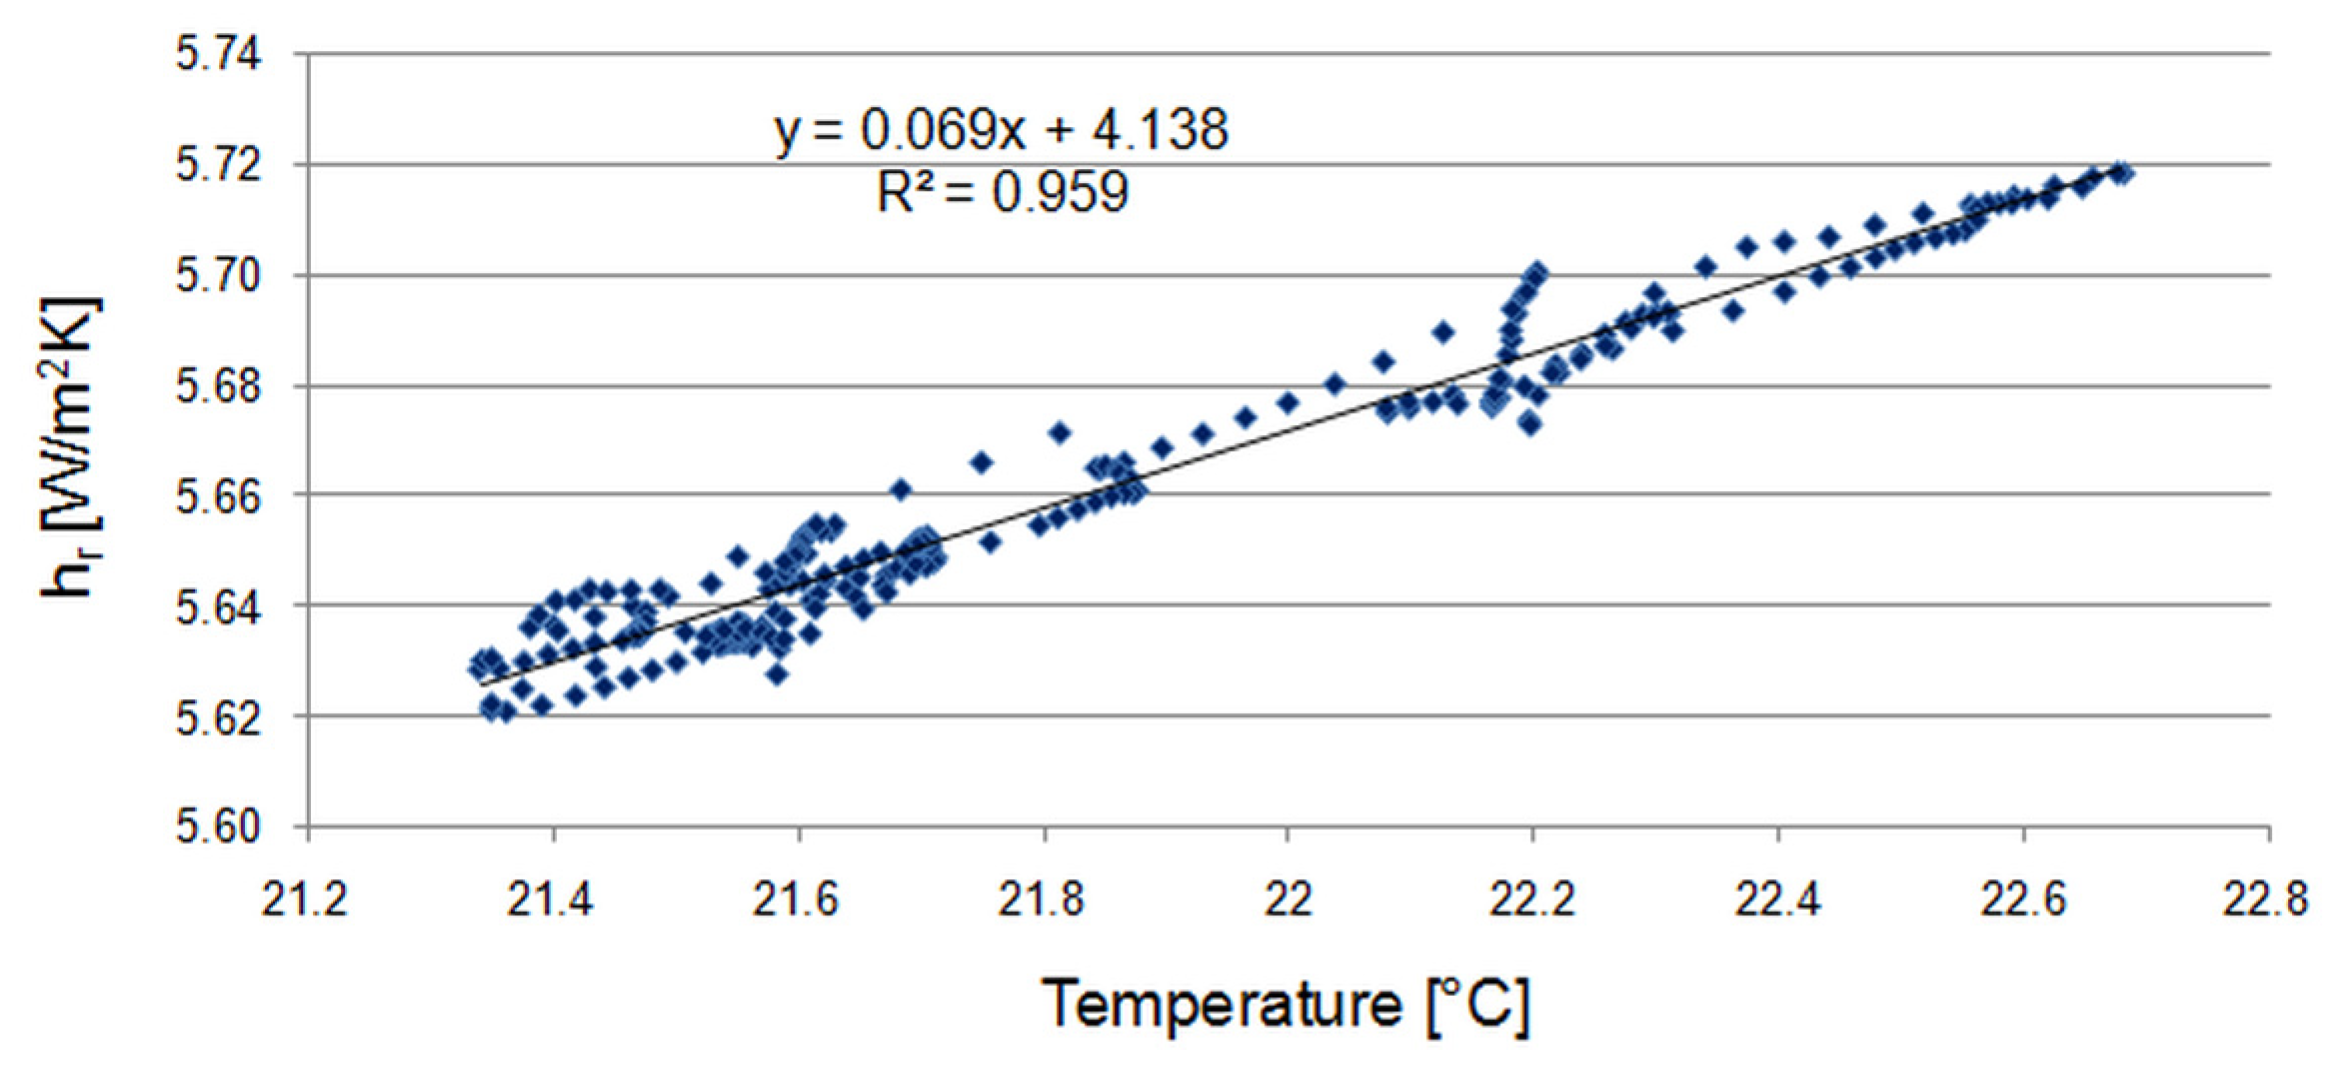
In the experimental study, it should also be noted that measurement error may influence the difference between AUST and Tc. This difference is in the denominator of Equation (4) used to compute hr. Therefore, the resulting radiant heat transfer coefficient is very sensitive to any inaccuracies. However, despite small differences between AUST and Tc (below 0.5 K), the resulting values of RHTCs, depending on the ceiling temperature, have the correct view (Figure 12).
The obtained correlation is very strong, with the calculated coefficient of determination R2 = 0.959, which means that over 97.9% of the variation in RHTCs is explained by the model. At the same, when comparing hourly values of RHTCs calculated from both presented methods, the correlation between them is also very strong, with R2 = 0.912.
The presented results confirm the applicability of the simplified method to obtain RHTCs in indoor building applications when the differences between internal surface temperatures are small. The details on the calculation of measurement uncertainties are given in Appendix A.

3.2. Convective Heat Transfer Coefficient

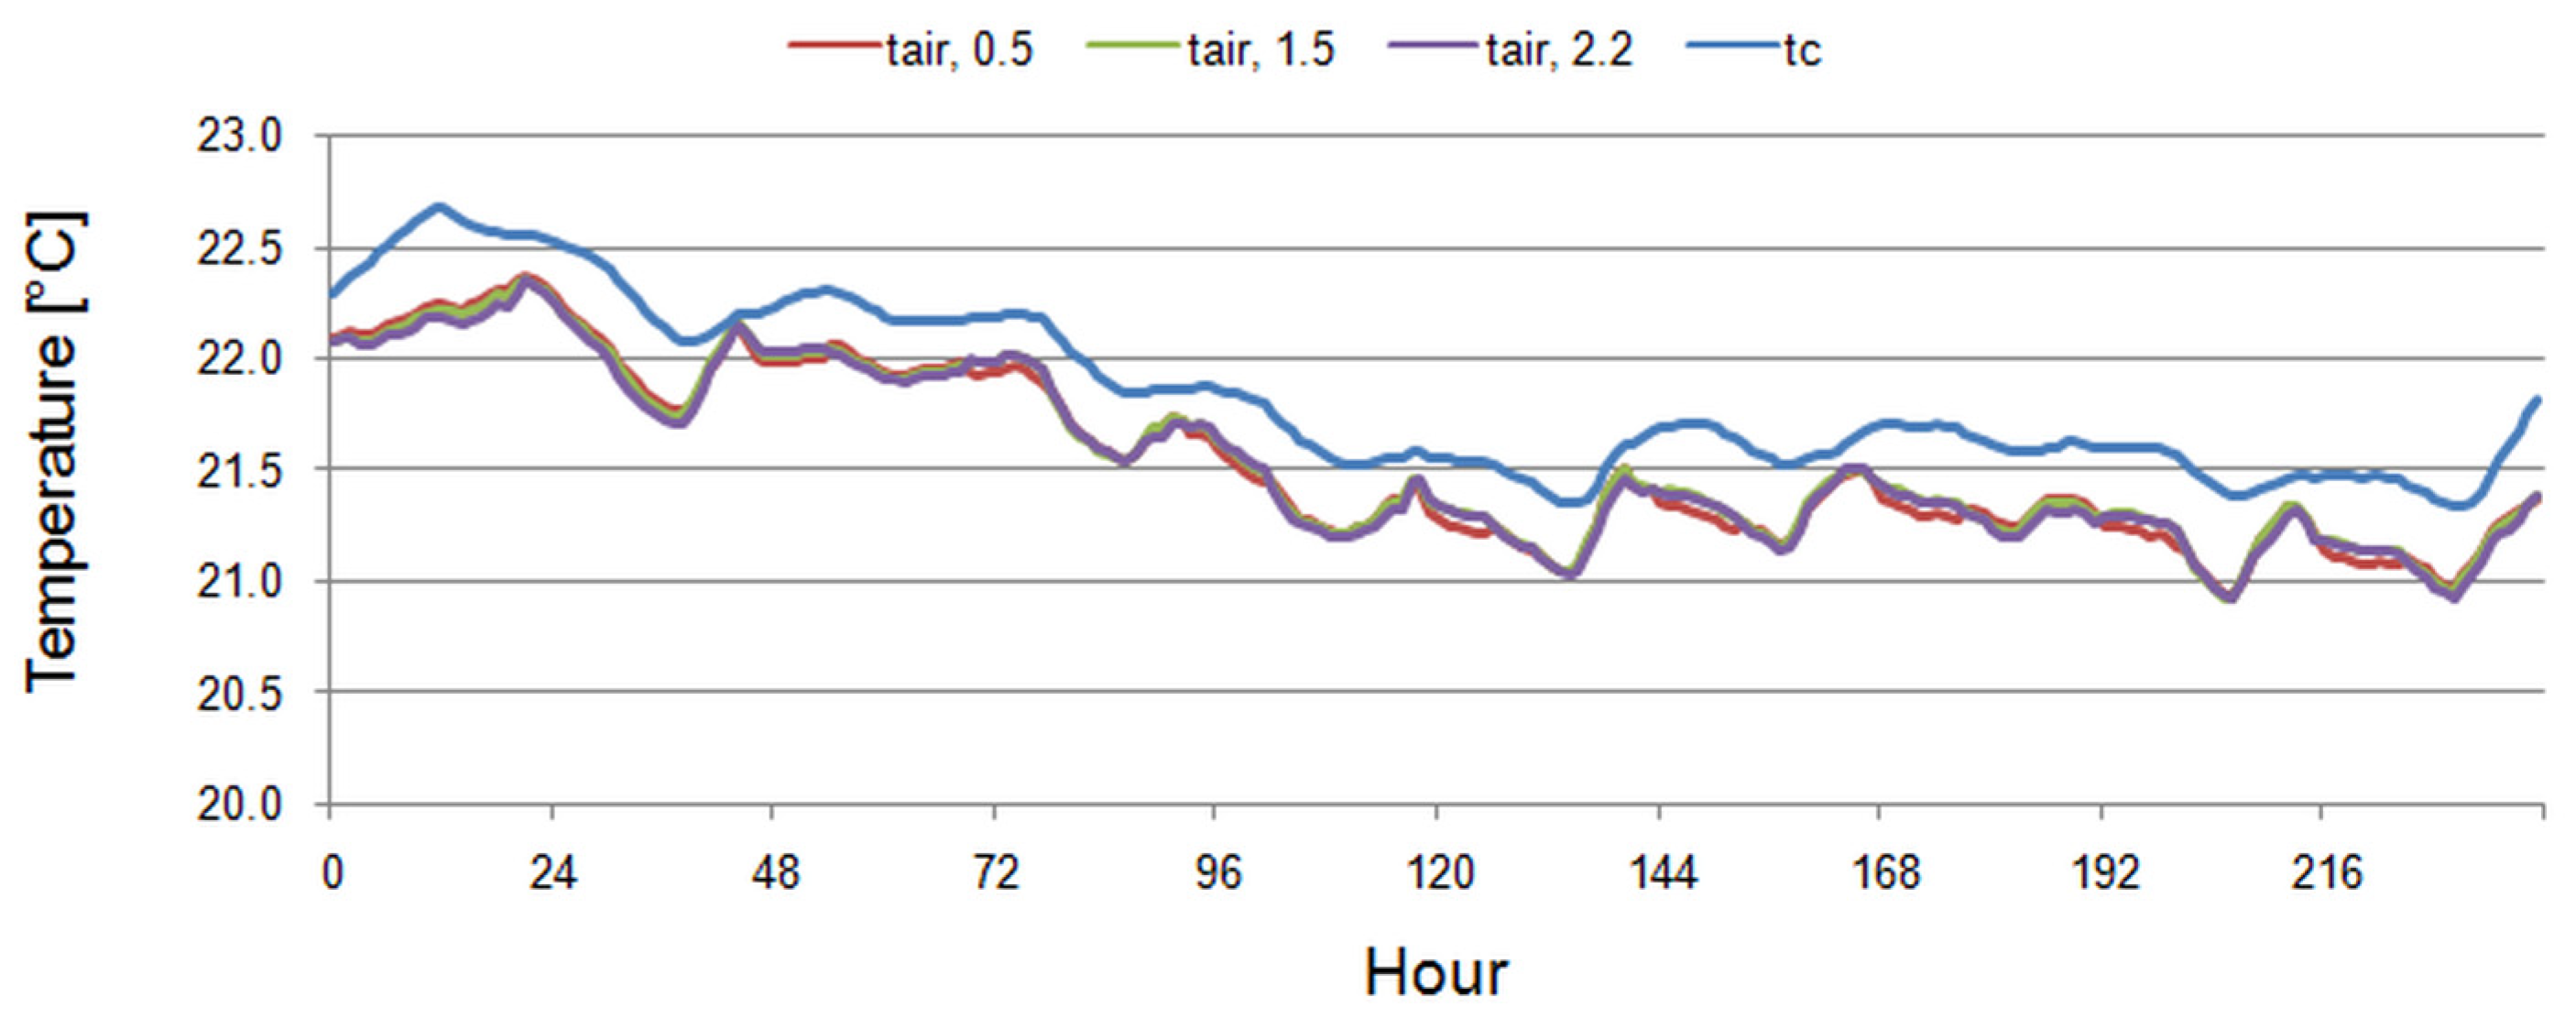
During the measurements, indoor air temperature showed very good vertical uniformity. It varied from 20.93°C to 22.37°C, from 20.92°C to 22.35°C, and from 20.92°C to 22.36°C at heights of 0.55 m, 1.5 m, and 2.2 m above the floor (Figure 13) with the hourly difference between the maximum and minimum values ranging from 0 to 0.08 K. Its average value was from 20.92°C (at 9:00 on 9 November) to 22.35°C (at 16:00 on 1 November) and was lower than the ceiling surface temperature from 0.04°C (at 15:00 on 2 November) to 0.47°C (at 8:00 on 9 November). This temperature difference was then of a similar order as the difference between the ceiling and AUST, which created comfortable indoor conditions.
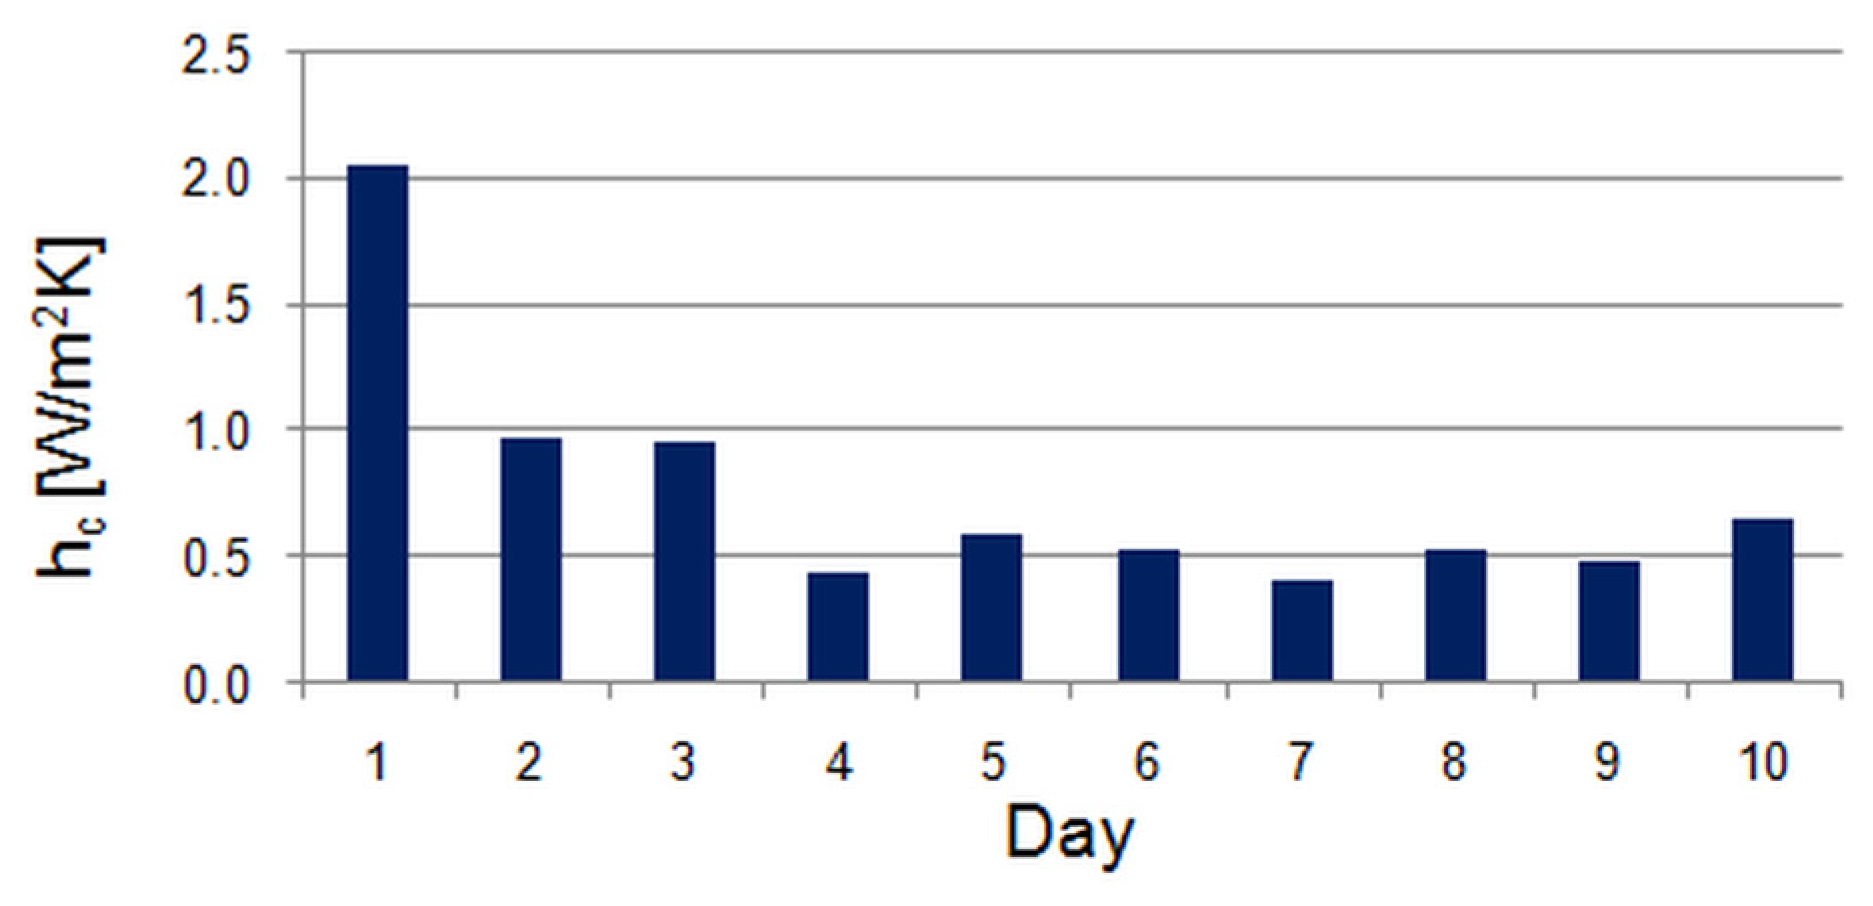
Calculations showed that CHTCs varied from 0.01 W/m2K (at 11:00 on 4 November) to 2.51 W/m2K (at 21:00 on 31 October) with the average value being0.801 W/m2K. But, when excluding the first day of measurements which may have been influenced by various factors (equipment assembling, personal control, etc.), the average hc = 0.639 W/m2K. Its daily averaged values are given in Figure 14.
Variability of CHTC can be mainly attributed to measurement errors which tend to be higher at low heat flows. A significant dispersion of experimentally obtained CHTCs in real conditions was observed in [35]. Despite these problems, a comparison of the average value of hc with other references (Table 3) reveals that the obtained values are comparable at the same average temperature difference of 0.31 K. The same also refers to the convective heat transfer coefficient, given in EN ISO 6946 [26], for a horizontal wall with downward heat flow.

3.3. Total Heat Transfer Coefficient

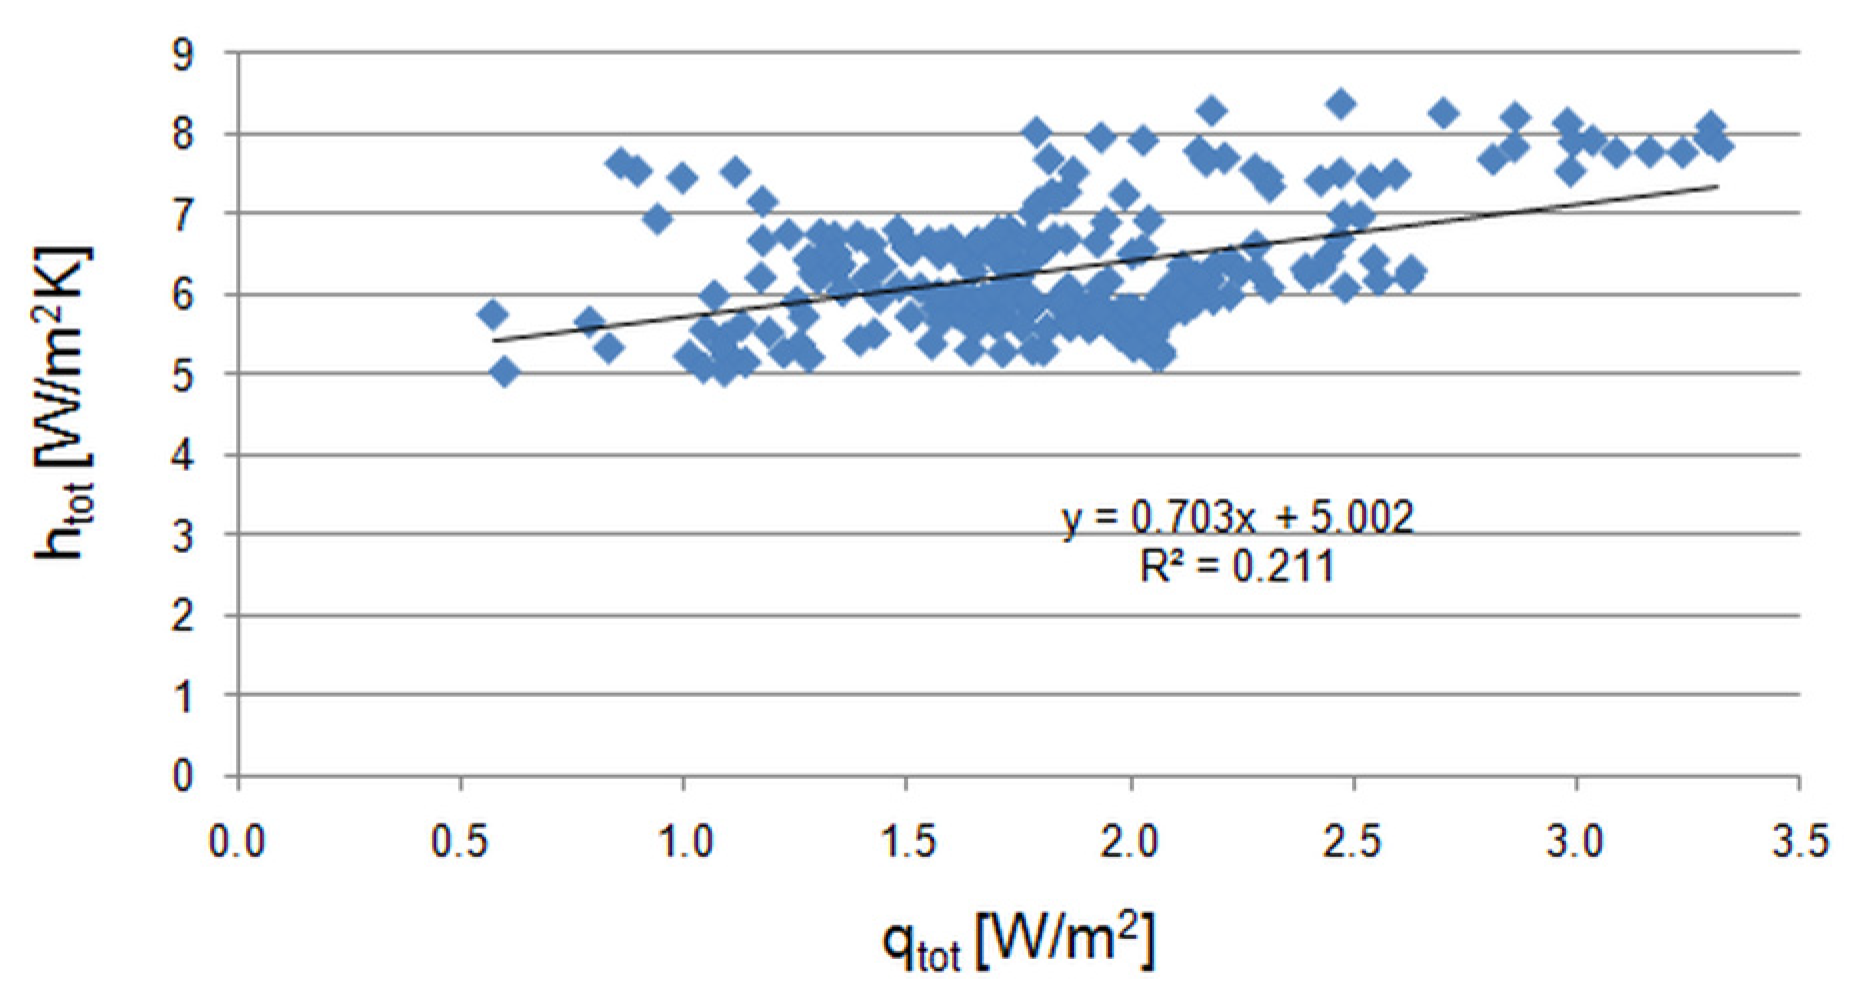
Obtained values of the radiant and convective heat transfer coefficients were used to calculate the operative temperature. It varied from 20.97°C to 22.32°C. The resulting total heat transfer coefficient was from 5.625 W/m2K (at 9:00 on 6 November) to 8.218 W/m2K (at 21:00 on 31 October), with 6.473 W/m2K on average. It showed a positive correlation with total heat flux (Figure 15). However, the resulting correlation was rather moderate, with R2 = 0.211, which means that about 46% of the dependent variables were explained by this model.
Finally, daily averaged values of the main variables that were measured and calculated are given in Table 4. It can easily be noticed that the heating heat flux is low when compared to popular radiant water-based floor heating systems in residential buildings when values of 20–70 W/m2 are commonly met and differences between indoor air and floor surface temperatures are more significant. However, in passive buildings, these capacities can be significantly lower, which makes measurements more demanding.
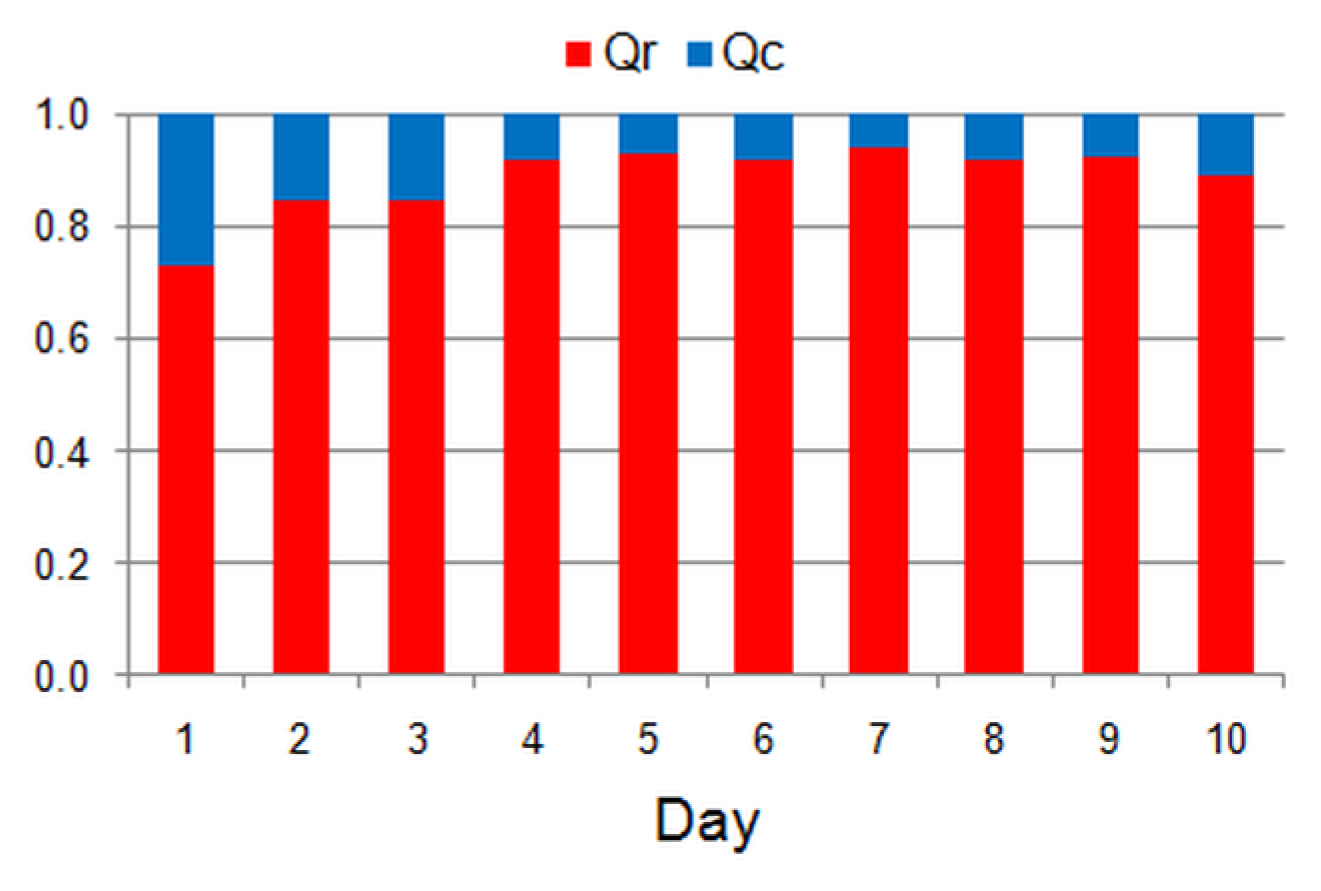
Variation in the daily averaged RHTCs was negligible, between 5.63 and 5.71 W/m2K. CHTCs changed more significantly, from 0.40 to 2.05 W/m2K. The total heat transfer coefficient was from 6.14 to 7.77 W/m2K. These values show that radiation dominated heat exchange between the ceiling and the zone (Figure 16). Its share varied in the consecutive days from 72.8% (day 1) to 93.9% (day 7) with 88.6% on average.
Rahimi and Sabernaeemi [13] used a test chamber with a heated ceiling and reported an average share of a radiant heat transfer of 96.2%. The next study [16] on a heated ceiling with a gypsum board placed in a 4 × 4 × 3 m test chamber reported an 87% share of radiant transfer. But when wall heating was also used, it decreased to 72%. Causone et al. [12] used a test box with a 15 cm thick plasterboard radiant ceiling. Radiant heat transfer in their case varied from 90.2% to 100%. In [18], the authors used a ceiling with a 2 cm thick granolite filling. They reported that, in one case, radiant heat transfer was over 98% of the total heat flow. However, in the next eight cases, it was over 100%, which might result from measurement errors.

3.4. Comparison of Results

Obtained resulting values of heat transfer coefficients, given in previous sections, should be compared to other sources to obtain a more complete view (Table 5). Radiant, convective, and total heat transfer coefficients were reported by several authors. Also, ISO 11855 provides recommended values for the design purposes of radiant systems.
Variation can be seen in the presented values. The smallest dispersion is observed for hr. However, its values below 5.0 W/m2K are rather surprising in building applications. CHTCs in experimental works are lower than 1.0 W/m2K and these values are in agreement with the findings presented here. The total heat transfer coefficient is also within acceptable range.
It is also worth noting that for horizontal surfaces with downward heat flow, the EN ISO 6946 standard suggests the value hc = 0.7 W/m2K, and for the total surface thermal resistance, the suggested value is Rsi = 0.17 m2K/W. For the obtained hr and hc, Rsi = 0.154 m2K/W is the resulting value.

4. Conclusions

In the presented study, convective (hc), radiant (hr), and total (htot) heat transfer coefficients were calculated for the heated concrete ceiling during the period of the heating load. This resulted in low values of the temperature difference between the ceiling surface and other internal surfaces facing the room and indoor air. This situation is very comfortable for the occupants, but much less beneficial for measurement accuracy.
Other experiments were conducted in specially designed test chambers with stable internal conditions and thermal isolation reducing the impact of ambient factors and under steady-state thermal conditions during tests. Also, sufficiently large differences between the temperatures of conditioned and unconditioned internal surfaces and indoor air were maintained. Consequently, the impact of the main sources of errors could be reduced. That is why their outcomes can be treated as a reference.
However, in real buildings, during their everyday use, such laboratory conditions are impossible to obtain. During measurements in the studied object, the heating load was low. Therefore, high-sensitivity sensors were successfully used for the precise measurement of heat flux. Accurate temperature measurements were made possible by using sensors with a high-accuracy class. Further improvements in the accuracy of the tests carried out would be possible after additional calibration of the temperature sensors using special certified calibration equipment. It is also advisable to measure the temperature of each wall at several heights to determine the uniformity of its distribution.
Nevertheless, despite the mentioned limitations, the results presented in this study are comparable with other experiments in zones with heated ceilings and confirm the validity of the tests performed.

Funding

This research project was partly supported by the programme “Excellence initiative—research university” for the AGH University of Science and Technology.

Data Availability Statement

The raw data supporting the conclusions of this article will be made available by the author upon request.

Conflicts of Interest

The author declares no conflicts of interest.

Symbols

AUSTaverage unheated surface temperature, K
hcconvective heat transfer coefficient, W/m2K
hrradiant heat transfer coefficient, W/m2K
htottotal heat transfer coefficient, W/m2K
kcoverage factor,
qcconvective heat flux, W/m2
qrradiant heat flux, W/m2
qtottotal heat flux, W/m2
ttemperature (general), °C
uccombined uncertainty,
R2coefficient of determination,
Tairinternal air temperature, K
Tradarea-weighted radiant temperature, K
Tcceiling surface temperature, K
Topoperative temperature, K
Uexpanded uncertainty,
εsurface emissivity,
σStefan–Boltzmann constant, σ = 5.6697 10−8 W/m2K4

Appendix A

In the present study, heat transfer coefficients are computed indirectly from formulas given by Equations (4) and (10), or Equation (11). Therefore, they are based on physical variables measured with various accuracies.
In the case of indirect measurement of a physical quantity, y, being a function of independent measurements x1, x2, … , xn,
y = f x 1 , x 2 , , x n
The standard combined uncertainty uc of y can be obtained using the propagation model of uncertainty [37]:
u c ( y ) = y x 1 u x 1 2 + y x 2 u x 2 2 + + y x n u x n 2 .
Then, the expanded uncertainty of the measured quantity is computed from
U = k u c ( y )
where k is the coverage factor; for a 95% confidence level, the uncertainty of k = 2.
Using the procedure described in the previous section, at first, the uncertainty of the RHTC is derived. Inserting Equation (4) into Equation (11), we can obtain an equation describing the standard combined uncertainty of the measured RHTC. It has three independent variables: qr, Tc and AUST. Consequently,
u c ( h r ) = ( h r ) q r u q r 2 + ( h r ) T c u T c 2 + ( h r ) A U S T u A U S T 2 .
with the following partial derivatives,
( h r ) q r = ε σ 1 T c A U S T ,
h r T c = ε σ q r T c A U S T 2 ,
h r A U S T = ε σ q r T c A U S T 2 .
Uncertainty of the ceiling temperature measurement, u(Tc), consists of two elements: accuracy of a temperature sensor and accuracy of the data logger.
u T c = u s e n s , c 2 + u l o g g e r , c 2 ,
Here, “sens” and “logger” subscripts refer to a sensor and a logging device, respectively. They can be easily obtained from the manufacturers’ data given in Table 1.
To estimate uncertainties of radiant heat flux and AUST, there are necessary additional calculations. When inserting Equation (5) into Equation (A2), we obtain
u c ( q r ) = ( q r ) T k u T k 2 .
with Tk being the temperatures of all k-th surfaces facing the zone. Partial derivative of radiant flux is then given by:
( q r ) T k = k σ F ε c j T c 4 T j 4 T k .
By writing out the numerator of the right side of Equation (A10), we obtain
k σ F ε c j T c 4 T j 4 = j = 1 n σ F ε c j T c 4 j = 1 n σ F ε c j T j 4 .
And finally,
( q r ) T k = j = 1 n 4 σ F ε c j T c 3 T j 3
To simplify the calculations, it can be assumed that the temperatures of all surfaces are measured by the same sensors. Therefore, we can write that u(Tk) in Equation (A9) is the same for all considered partitions.
The last component of RHTC uncertainty is AUST. This variable is computed from the complex summation formula. After rewriting Equation (2), we obtain
A U S T = j = 1 n F c j T j 4 1 / 4 .
The partial derivative of AUST with respect to all unheated surfaces (Tj) is as follows:
( A U S T ) T j = j = 1 n F c j T j 4 1 / 4 T j .
And finally,
( A U S T ) T j = j = 1 n F c j T j 3 j = 1 n F c j T j 4 3 / 4 .
As can be seen, this procedure is complicated. Therefore, the second one, based on Equation (9), can be used for convenience. After inserting Equation (9) into Equation (A2), we obtain three derivatives, as follows:
h r ε = σ T c 3 + T c T r a d 2 + T r a d T c 2 + T r a d 3 ,
h r T r a d = ε σ 2 T c T r a d + T c 2 + 3 T r a d 2 ,
h r T c = ε σ 3 T c 2 + T r a d 2 + 2 T c T r a d .
In the case of the simple model, given by Equation (10), only one derivative can be written:
h r T m = 12 ε σ T m 2 .
In the case of the heat transfer coefficient by convection, the uncertainty assessment is simpler. After rearranging Equation (7), we obtain
h c = q c / T c T a i r .
After inserting Equation (11) into Equation (A2), we obtain
u c ( h c ) = ( h c ) q c u q c 2 + ( h c ) T i u T a i r 2 + ( h c ) T s u T c 2 .
with the following partial derivatives:
h c q c = 1 T c T a i r ,
h c T s = q c T c T a i r 2 ,
h c T i = q c T c T a i r 2 .
The uncertainty components due to the measurement of indoor air temperature u(Tair) and surface temperature u(Tc) can be derived similarly, as in the previous case on the basis of Equation (A8).
Because of stable thermal conditions in the room during the experiment and the operational temperature of heat flux sensors close to the calibration temperature, only an additional 2% uncertainty was also included because of the non perfect contact of a sensor with a ceiling. This means that for the maximum measured heat flux of 2.5 W/m2, the resulting uncertainty u(qc) = 0.175 W/m2.
To give the reader a better view of this analysis, the results of the calculations of partial derivatives are given by Equations (A5)–(A7) and (A19).
For the first method of RHTC calculation, based on AUST, the following average conditions were used: AUST = 294.699 K, Tc = 294.992 K, and qr = 1.655 W/m2. Then, the results presented in Table A1 were obtained. The average uncertainty uc (hr) = 1.10 × 10⁻⁷ W/m2K is very small and is comparable with findings presented in other studies on radiant heating systems [16,17]. This is because radiant heat flux was computed analytically from the detailed model.
Table A1. Uncertainties in RHTC measurement.
UncertaintyValueUnit
u(qr)0.017W/m2
u(Tc)0.050K
u(AUST)0.648K
( h r ) q r −1.966 × 10⁻⁷W/m2K
h r T c 1.113 × 10⁻⁶W/m2K2
h r A U S T 1.113 × 10⁻⁶W/m2K2
When applying the simple method to evaluate RHTCs (Equation (10)), only the average mean radiant temperature Tm = 294.850 K was used. Then, from Equation (A19), 12 ε σ T m 2 = 0.065 W/m2K, and, from Equation (10), hr = 5.523 W/m2K.
The last computed variable was the heat transfer coefficient by convection (Table A2). The relevant derivatives, given by Equations (A22), (A23) and (A24), were computed for the following average conditions: Ti = 21.555 °C, Tc = 21.861°C, and qc = 0.245 W/m2. For these conditions, uncertainty u(hc) = 0.189 W/m2K for the whole period.
Table A2. Uncertainties in CHTC measurement.
UncertaintyValueUnit
u(qc)0.012W/m2
u(Ti)0.05K
u(TC)0.05K
h c q c 3.268W/m2K
h c T i −2.617W/m2K2
( h c ) T C 2.617W/m2K2
The obtained uncertainty of CHTCs is high and comparable with the calculated value of CHTCs. This is the most important problem in this study. However, when considering other experimental studies on internal heat transfer coefficients in buildings with various radiant systems, it was commonly noticed that measured CHTCs were influenced by uncertainties significantly higher than RHTCs [16,17]. The accuracy of experimentally measured CHTCs was estimated from about 20% [38,39] to 30% or even 35% at ΔT ≈ 1 K [35]. These are the outcomes of the methods applied. The measurement uncertainty of CHTCs is determined by the experimental method (Equation (11)). Therefore, the results are very sensitive to the difference between the surface (ceiling) and internal air temperatures (Equations (A22)–(A24)).
In this study, highly sensitive heat flux sensors and precise temperature sensors were used. Therefore, the next step to improve the accuracy of the obtained results is the additional calibration of the temperature sensors using the special certified calibration equipment, as in the experimental study presented in [40].

References

  1. Junasová, B.; Krajčík, M.; Šikula, O.; Arıcı, M.; Šimko, M. Adapting the construction of radiant heating and cooling systems for building retrofit. Energy Build. 2022, 268, 112228. [Google Scholar] [CrossRef]
  2. Krajčík, M.; Šimko, M.; Šikula, O.; Szabó, D.; Petráš, D. Thermal performance of a radiant wall heating and cooling system with pipes attached to thermally insulating bricks. Energy Build. 2021, 246, 111122. [Google Scholar] [CrossRef]
  3. ISO 11855–1:2021.; Building Environment Design. Embedded Radiant Heating and Cooling Systems. Part 2: Determination of the Design Heating and Cooling Capacity. International Organization for Standardization: Geneva, Switzerland, 2021.
  4. Sinacka, J.; Szczechowiak, E. An Experimental Study of a Thermally Activated Ceiling Containing Phase Change Material for Different Cooling Load Profiles. Energies 2021, 14, 7363. [Google Scholar] [CrossRef]
  5. Aryal, A.; Chaiwiwatworakul, P.; Chirarattananon, S. An experimental study of thermal performance of the radiant ceiling cooling in office building in Thailand. Energy Build. 2023, 283, 112849. [Google Scholar] [CrossRef]
  6. Shi, S.; Merabtine, A.; Bennacer, R. Radiant systems and solar-driven overheating: A comprehensive literature analysis over a decade. Build. Environ. 2024, 259, 111659. [Google Scholar] [CrossRef]
  7. Karakoyun, Y.; Acikgoz, O.; Çebi, A.; Koca, A.; Çetin, G.; Dalkilic, A.S.; Wongwises, S. A comprehensive approach to analyze the discrepancies in heat transfer characteristics pertaining to radiant ceiling heating system. Appl. Therm. Eng. 2021, 187, 116517. [Google Scholar] [CrossRef]
  8. Hu, R.; Sun, S.; Liang, J.; Zhou, Z.; Yin, Y. A Review of Studies on Heat Transfer in Buildings with Radiant Cooling Systems. Buildings 2023, 13, 1994. [Google Scholar] [CrossRef]
  9. Liao, W.; Wen, C.; Luo, Y.; Peng, J.; Li, N. Influence of different building transparent envelopes on energy consumption and thermal environment of radiant ceiling heating and cooling systems. Energy Build. 2022, 255, 111702. [Google Scholar] [CrossRef]
  10. Dogan, A.; Kayaci, N.; Kanbur, B.B.; Demir, H. Experimental Investigation of Mean Radiant Temperature Trends for a Ground Source Heat Pump-Integrated Radiant Wall and Ceiling Heating System. Buildings 2023, 13, 2420. [Google Scholar] [CrossRef]
  11. Bouacida, T.; Bentoumi, L.; Bessaïh, R. Experimental study of a low-cost ceiling cooling system in the north Algerian climate. Energy Build. 2023, 293, 113196. [Google Scholar] [CrossRef]
  12. Causone, F.; Corgnati, S.P.; Filippi, M.; Olesen, B.W. Experimental evaluation of heat transfer coefficients between radiant ceiling and room. Energy Build. 2009, 41, 622–628. [Google Scholar] [CrossRef]
  13. Rahimi, M.; Sabernaeemi, A. Experimental study of radiation and free convection in an enclosure with a radiant ceiling heating system. Energy Build. 2010, 42, 2077–2082. [Google Scholar] [CrossRef]
  14. Cholewa, T.; Rosiński, M.; Spik, Z.; Dudzińska, M.R.; Siuta-Olchaa, A. On the heat transfer coefficients between heated/cooled radiant floor and room. Energy Build. 2013, 66, 599–606. [Google Scholar] [CrossRef]
  15. Yu, T.; Heiselberg, P.; Lei, B.; Pomianowski, M.; Zhang, C.; Jensen, R. Experimental investigation of cooling performance of a novel HVAC system combining natural ventilation with diffuse ceiling inlet and TABS. Energy Build. 2015, 105, 165–177. [Google Scholar] [CrossRef]
  16. Koca, A.; Gürsel, C. Experimental investigation on the heat transfer coefficients of radiant heating systems: Wall, ceiling and wall-ceiling integration. Energy Build. 2017, 148, 311–326. [Google Scholar] [CrossRef]
  17. Koca, A.; Acikgoz, O.; Çebi, A.; Çetin, G.; Dalkilic, A.S.; Wongwises, S. An experimental investigation devoted to determine heat transfer characteristics in a radiant ceiling heating system. Heat Mass. Transf. 2017, 54, 363–375. [Google Scholar] [CrossRef]
  18. Cholewa, T.; Anasiewicz, R.; Siuta-Olcha, A.; Skwarczynski, M.A. On the heat transfer coefficients between heated/cooled radiant ceiling and room. Appl. Therm. Eng. 2017, 117, 76–84. [Google Scholar] [CrossRef]
  19. Szpytma, M.; Rybka, A. Ecological ideas in Polish architecture—environmental impact. J. Civ. Eng. Environ. Arch. 2016, XXXIII, 321–328. [Google Scholar] [CrossRef]
  20. Michalak, P. Selected Aspects of Indoor Climate in a Passive Office Building with a Thermally Activated Building System: A Case Study from Poland. Energies 2021, 14, 860. [Google Scholar] [CrossRef]
  21. IEC 60751:2022; Industrial Platinum Resistance Thermometers and Platinum Temperature Sensors. International Electrotechnical Commission: Geneva, Switzerland, 2022.
  22. ISO 9060:2018; Solar Energy—Specification and Classification of Instruments for Measuring Hemispherical Solar and Direct Solar Radiation. International Organization for Standardization: Geneva, Switzerland, 2018.
  23. IEC 61724-1:2021; Photovoltaic system performance—Part 1: Monitoring. International Organization for Standardization: Geneva, Switzerland, 2022.
  24. Diaz, F.N.; Lebrun, J.; André, P. Experimental study and modelling of cooling ceiling systems using steady-state analysis. Int. J. Refrig. 2010, 33, 793–805. [Google Scholar] [CrossRef]
  25. Atef, A.; Noureddine, Z.; Soufiane, F. SPUCAL_mrt as a New Model for Estimating the Mean Radiant Temperature in Arid Lands. Energy Procedia 2015, 74, 273–280. [Google Scholar] [CrossRef]
  26. Evren, M.F.; Özsunar, A.; Kılkış, B. Experimental investigation of energy-optimum radiant-convective heat transfer split for hybrid heating systems. Energy Build. 2016, 127, 66–74. [Google Scholar] [CrossRef]
  27. Lauster, M.; Teichmann, J.; Fuchs, M.; Streblow, R.; Mueller, D. Low order thermal network models for dynamic simulations of buildings on city district scale. Build. Environ. 2014, 73, 223–231. [Google Scholar] [CrossRef]
  28. Cui, Y.; Xie, J.; Liu, J.; Xue, P. Experimental and Theoretical Study on the Heat Transfer Coefficients of Building External Surfaces in the Tropical Island Region. Appl. Sci. 2019, 9, 1063. [Google Scholar] [CrossRef]
  29. EN ISO 6946:2017; Building Components and Building Elements. Thermal Resistance and Thermal Transmittance. Calculation Methods. International Organization for Standardization: Geneva, Switzerland, 2017.
  30. Shinoda, J.; Kazanci, O.B.; Tanabe, S.; Olesen, B.W. A Review of the Surface Heat Transfer Coefficients of Radiant Heating and Cooling Systems. Build. Environ. 2019, 159, 106156. [Google Scholar] [CrossRef]
  31. Awbi, H.B.; Hatton, A. Natural convection from heated room surfaces. Energy Build. 1999, 30, 233–244. [Google Scholar] [CrossRef]
  32. ASHRAE. Handbook HVAC Fundamentals; ASHRAE: Peachtree Corners, GA, USA, 2009. [Google Scholar]
  33. ASHRAE. 2012 ASHRAE Handbook—Heating, Ventilating, and Air Conditioning: Systems and Equipment; ASHRAE: Peachtree Corners, GA, USA, 2012. [Google Scholar]
  34. Min, T.C.; Schutrum, L.F.; Parmelee, G.V. Natural convection and radiation in a panel heated room. ASHRAE Trans. 1956, 62, 337–358. [Google Scholar]
  35. Wallentén, P. Convective heat transfer coefficients in a full-scale room with and without furniture. Build. Environ. 2001, 36, 743–751. [Google Scholar] [CrossRef]
  36. Miriel, J.; Serres, L.; Trombe, A. Radiant ceiling panel heating-cooling systems: Experimental and simulated study of the performances, thermal comfort and energy consumptions. Appl. Therm. Eng. 2002, 22, 1861–1873. [Google Scholar] [CrossRef]
  37. Helm, I.; Jalukse, L.; Leito, I. Measurement Uncertainty Estimation in Amperometric Sensors: A Tutorial Review. Sensors 2010, 10, 4430–4455. [Google Scholar] [CrossRef]
  38. Alamdari, F.; Hammond, G.P. Improved data correlations for buoyancy-driven convection in rooms. Build. Serv. Eng. Res. Technol. 1983, 4, 106–112. [Google Scholar] [CrossRef]
  39. Lewandowski, W.M. Natural convection heat transfer from plates of finite dimensions. Int. J. Heat Mass Transf. 1991, 34, 875–885. [Google Scholar] [CrossRef]
  40. Le Dreau, J.; Heiselberg, P.; Jensen, R.L. Experimental Data From a Full-Scale Facility Investigating Radiant and Convective Terminals: Uncertainty and Sensitivity Analysis, Description of the Experimental Data; DCE Technical reports No. 168; Department of Civil Engineering, Aalborg University: Aalborg, Denmark, 2014; Available online: https://vbn.aau.dk/en/publications/experimental-data-from-a-full-scale-facility-investigating-radian (accessed on 10 January 2025).
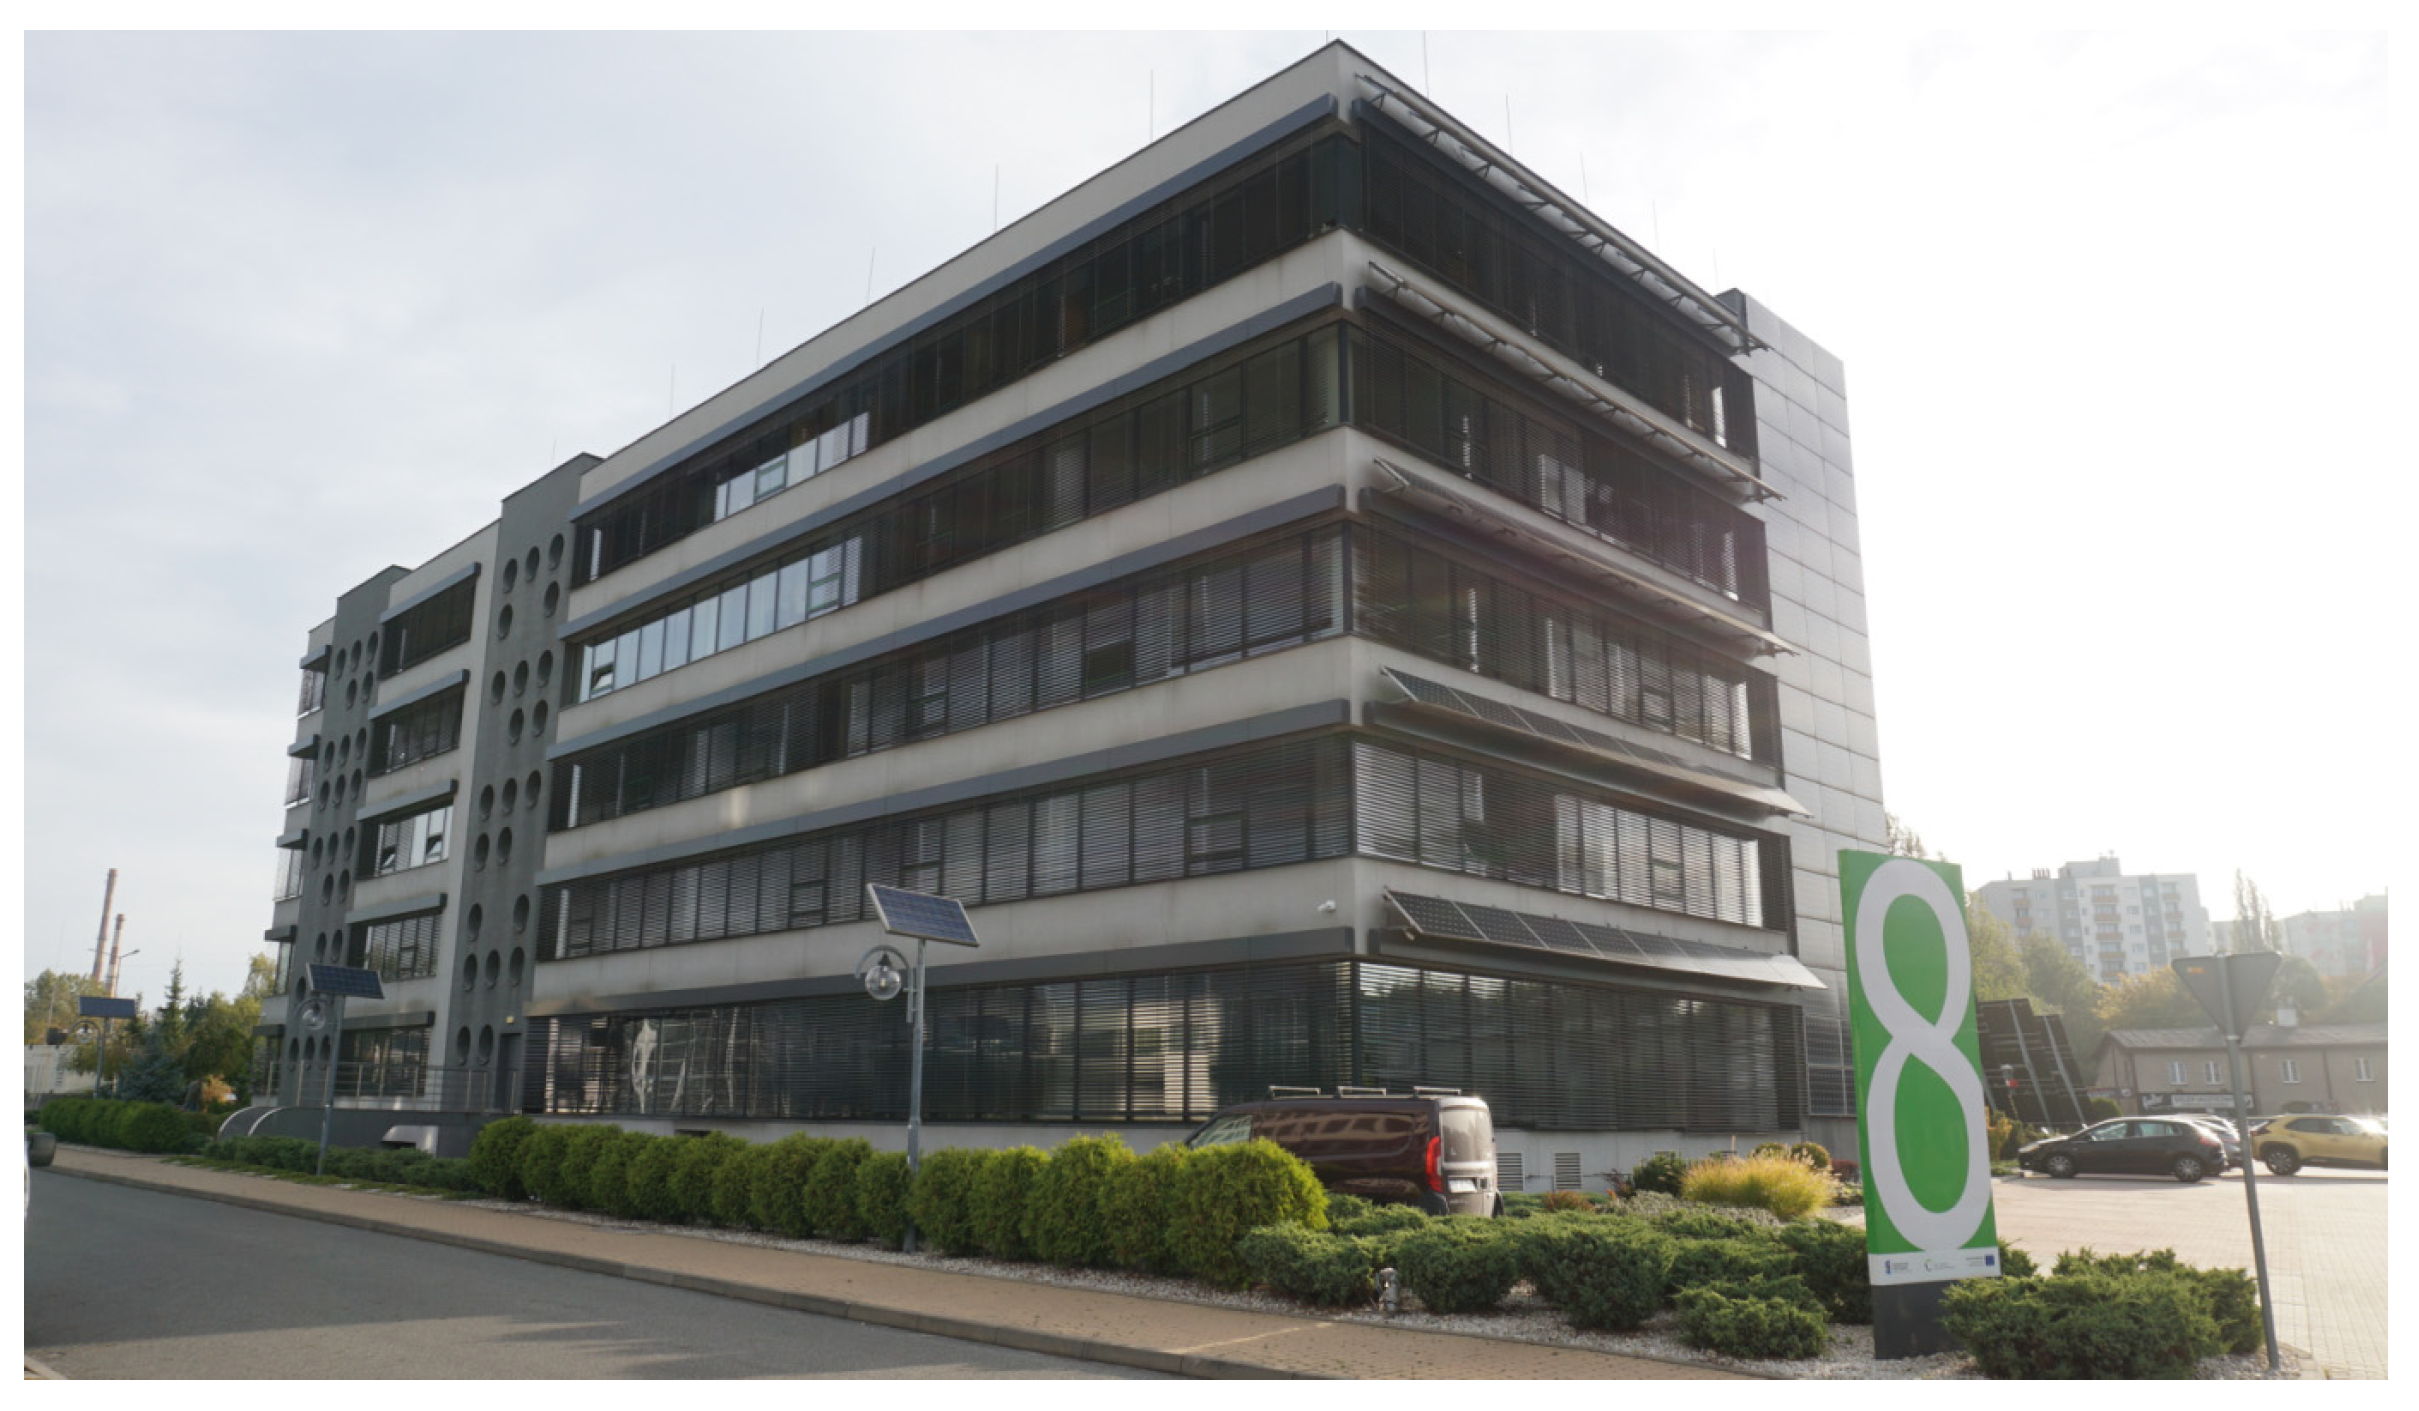
Figure 1. Southwest view of the building.
Energies 18 01591 g001
Figure 2. General view of the studied room.
Energies 18 01591 g002
Figure 3. Outdoor air temperature during measurements.
Energies 18 01591 g003
Figure 4. Global solar irradiance incident on the west-facing wall during measurements.
Energies 18 01591 g004
Figure 5. Location of measurement sensors (C—ceiling; F—floor; w—wall).
Energies 18 01591 g005
Figure 6. Measurement sensors mounted on the ceiling.
Energies 18 01591 g006
Figure 7. View of the southwest side of the room: (a) thermal imaging photo; (b) real view.
Energies 18 01591 g007
Figure 8. AUST and ceiling surface (tc) temperatures.
Energies 18 01591 g008
Figure 9. Difference between ceiling and AUSTs.
Energies 18 01591 g009
Figure 10. Difference between AUST and area-weighted radiant temperature.
Energies 18 01591 g010
Figure 11. Radiant heat transfer coefficient from measurements.
Energies 18 01591 g011
Figure 12. Radiant heat transfer coefficient from measurements (AUST method).
Energies 18 01591 g012
Figure 13. Indoor air temperatures at three heights and their ceiling temperatures.
Energies 18 01591 g013
Figure 14. Daily heat transfer coefficient by convection obtained from measurements.
Energies 18 01591 g014
Figure 15. The total heat transfer coefficient in relation to total heat flux.
Energies 18 01591 g015
Figure 16. Heat transfer between the ceiling and the room.
Energies 18 01591 g016
Table 1. The main metrological parameters of the measuring devices used.
DeviceManufacturerMeasured VariableMeasurement RangeAccuracy
Pt100 resistance sensorLimatherm Sensor, PolandRoom air temperature−50 °C ÷ +150 °CClass AA 1
Pt100 resistance sensorAmpero Thermo-Est, PolandSurface temperature−50 °C ÷ +150 °CClass AA 1
Pt1000 resistance sensorApator, PolandAmbient air temperature−50 °C ÷ +150 °CClass A 1
LP PYRA03Delta Ohm, ItalySolar irradiance0 ÷ 2000 W/m2Spectrally Flat Class C 2
HFP01 Hukseflux, NetherlandsHeat flux−2000 ÷ 2000 W/m2±3%
HFP03 Hukseflux, NetherlandsHeat flux−2000 ÷ 2000 W/m2±6%
Fluke 2638A data loggerFluke, U.S.A.Voltage0÷100 mV0.0025% MV + 0.0035% FS + 2 μV 3
Fluke 2638A data loggerFluke, U.S.A.Temperature−50 °C ÷ +150 °C0.038 °C at 0 °C, 0.073 °C at 300 °C
1 According to EN 60751 [21]. 2 According to ISO 9060 [22] and IEC 61724 [23]. 3 MV—measured value; FS—full scale.
Table 2. View factors between the ceiling and other surfaces in the room.
Surface NumberSurface NameFc-j [–]
1East wall0.116039641
2North wall0.163240031
3External (west) wall0.033180406
4External window0.082859227
5South wall0.163240030
6Floor0.441440661
Table 3. Convective heat transfer coefficients for downward-facing heated surfaces.
Referencehc [W/m2K]Comments
This study0.80Whole period
[31]0.19Equation (14)
[32]0.26Equation (15)
[33]0.09Equation (16)
[33]0.10Equation (17)
[16]0.59Equation (18)
[29]0.70Horizontal wall with downward heat flow
[16]0.82Tc—Tair = 10.8 K
[12]0.0 … 0.60Tc—Tair = 6.3 … 11.1 K, Tair at 1.1 m
[18]0.0 … 0.13Tc—Tair = 1.32 … 8.29 K, Tair at 1.1 m
[36]1.25Validated TRNSYS model
Table 4. Daily average values of the measured variables.
VariableUnit12345678910
Tc°C22.5422.2622.2221.9921.6521.5021.6321.6521.5021.48
Tair°C22.2021.9821.9721.7421.3621.2521.3321.3221.1821.13
AUST°C22.2121.9821.9921.7321.3721.2521.3221.3221.1821.14
Top°C22.2121.9821.9821.7621.3421.2621.3121.3221.1621.14
qrW/m21.881.621.351.441.581.401.761.851.831.91
hrW/m2K5.715.695.695.685.645.635.645.655.645.64
qcW/m20.700.290.240.130.120.120.110.170.150.24
hcW/m2K2.050.970.960.450.590.540.400.530.500.65
qtotW/m22.581.841.591.511.621.521.762.021.942.14
htotW/m2K7.776.666.646.136.236.176.056.186.146.29
Table 5. Convective, radiant and total heat transfer coefficients for downward-facing heated surfaces.
Ref.hc [W/m2K]hr [W/m2K]htot [W/m2K]
Present study0.40–2.055.53–5.716.05–7.77
[7]0.95.37.0
[12]0.35.65.8
[16]0.825.707.28
[18]0–0.135.21–5.644.94–5.90
[17]0.5–1.04.6–5.56.1–6.9
[3]6.5
Disclaimer/Publisher’s Note: The statements, opinions and data contained in all publications are solely those of the individual author(s) and contributor(s) and not of MDPI and/or the editor(s). MDPI and/or the editor(s) disclaim responsibility for any injury to people or property resulting from any ideas, methods, instructions or products referred to in the content.