
Systematic Optimize and Cost-Effective Design of a 100% Renewable Microgrid Hybrid System for Sustainable Rural Electrification in Khlong Ruea, Thailand


 ,
,
Abstract
1. Introduction
2. Materials and Methods
- I
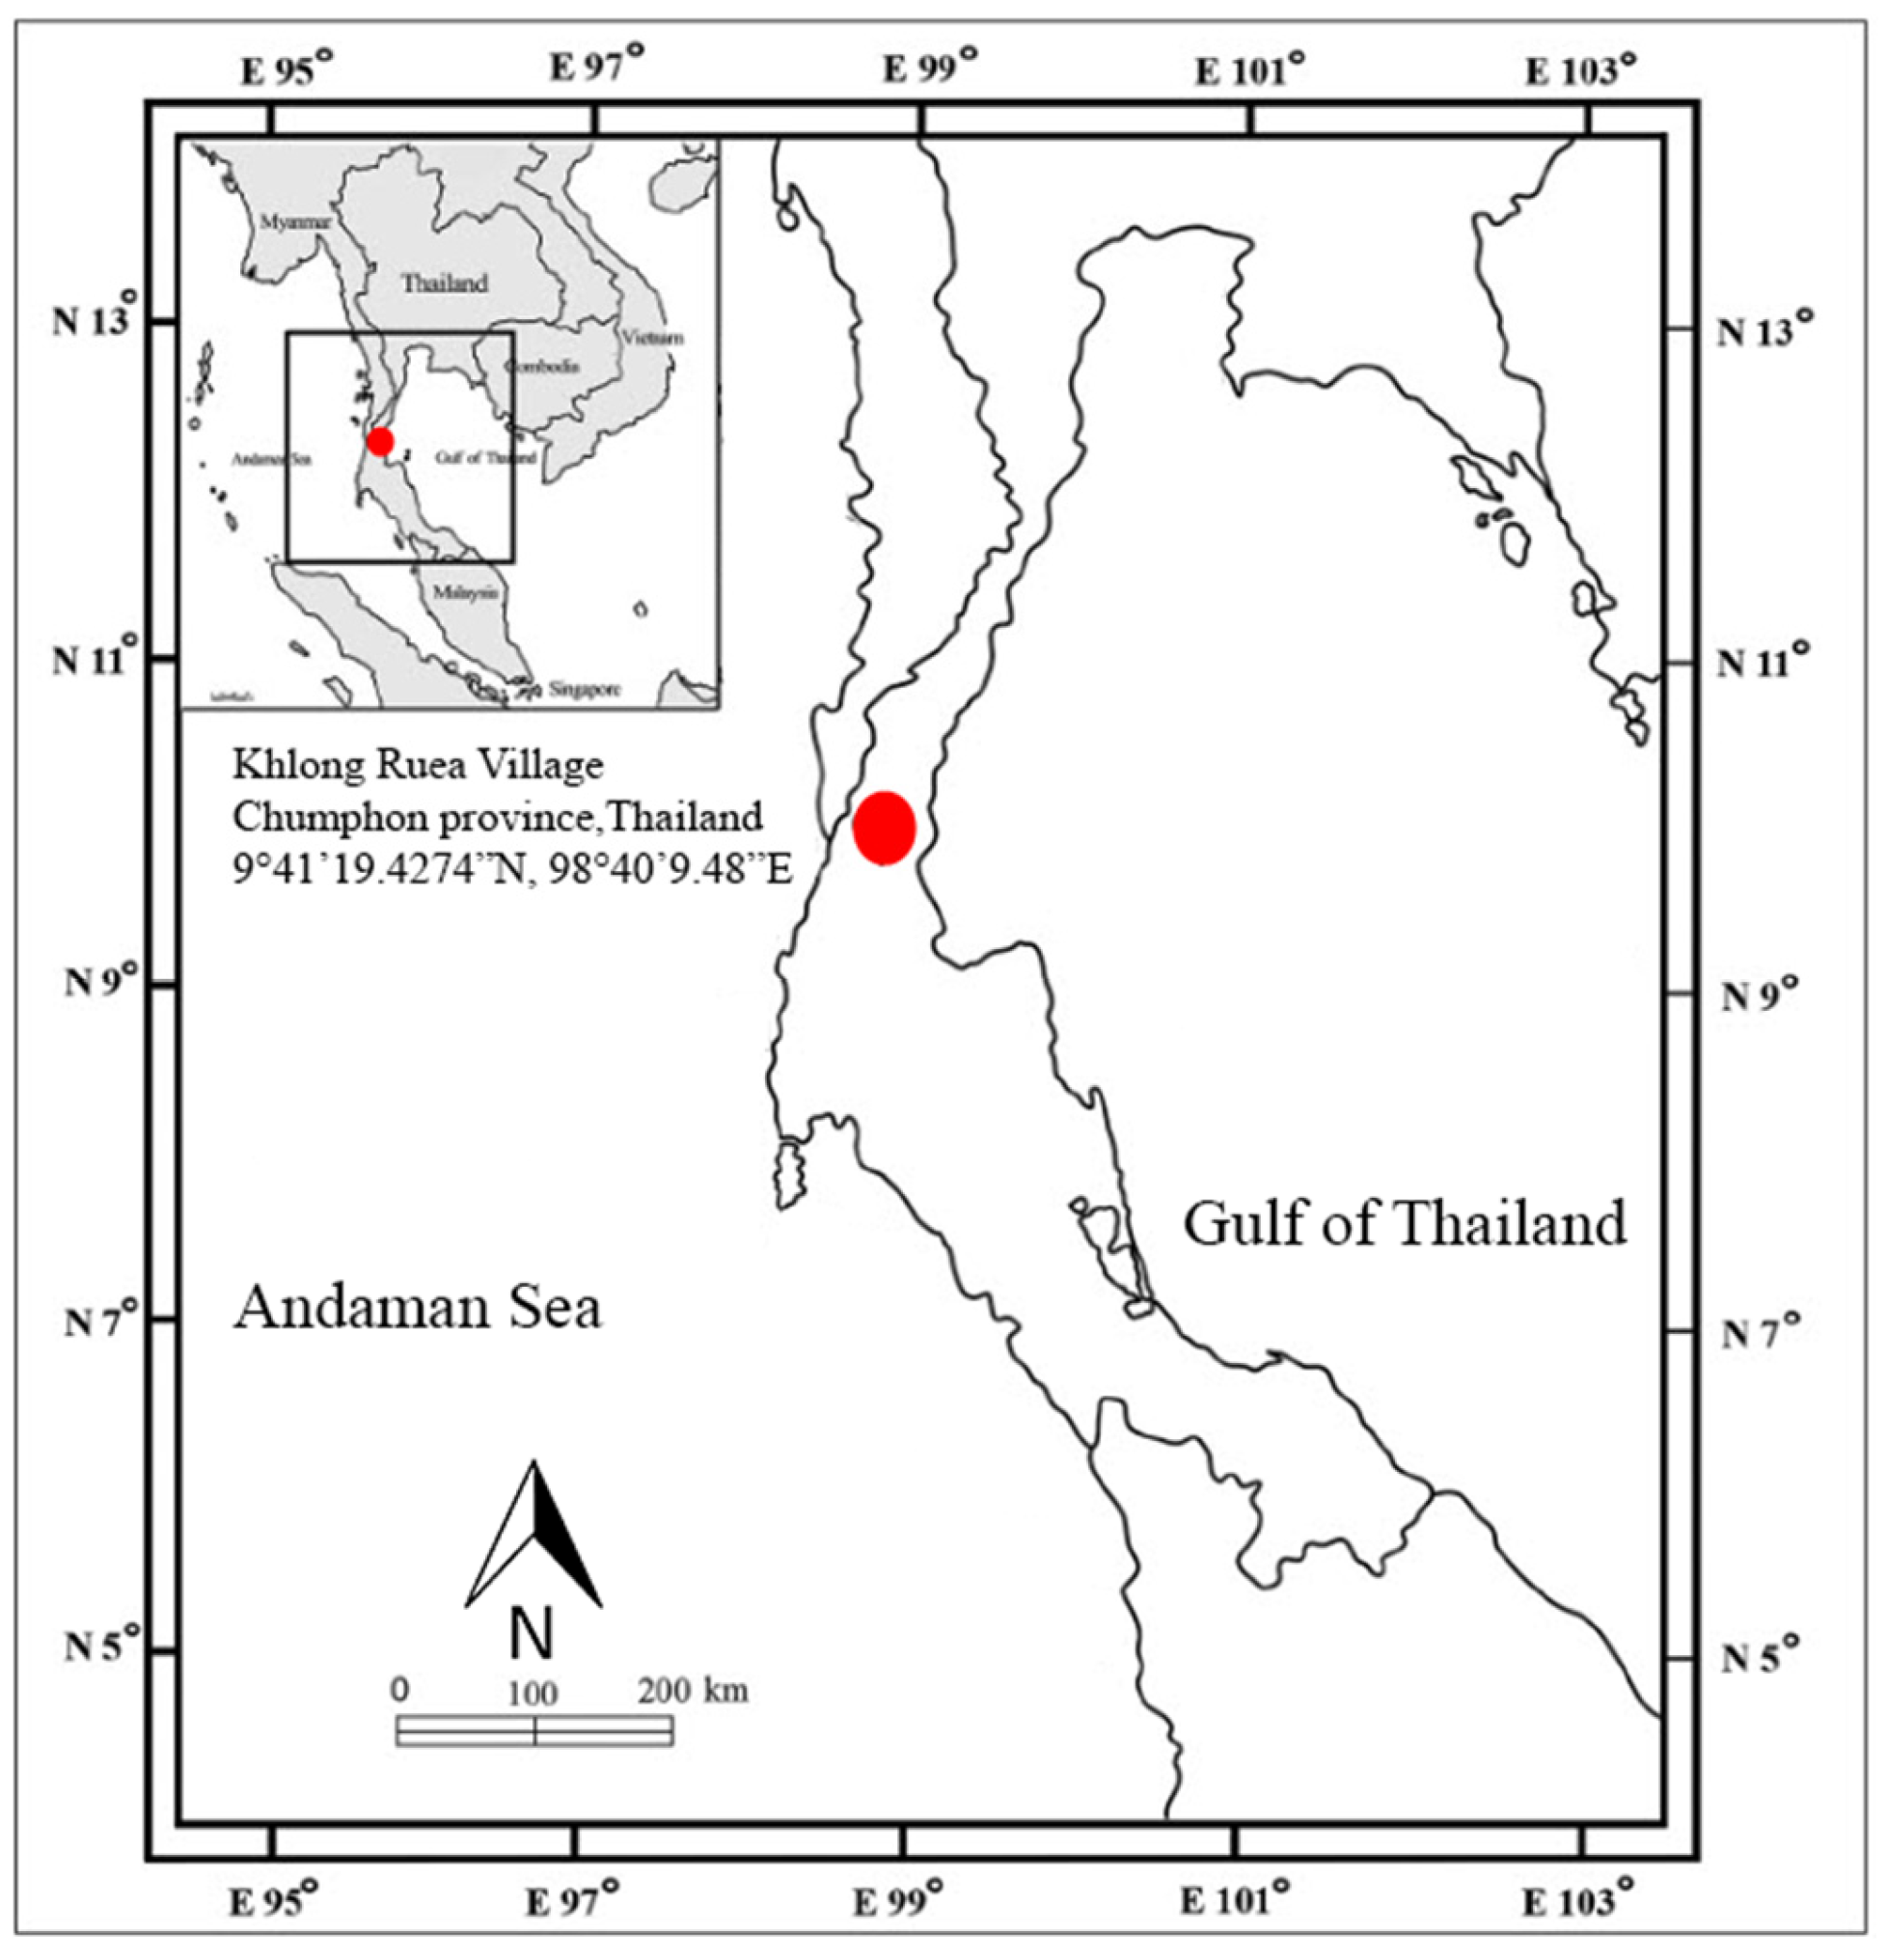
- Site specification.
- II
- Development and validation of a modeled dataset:
- (a)
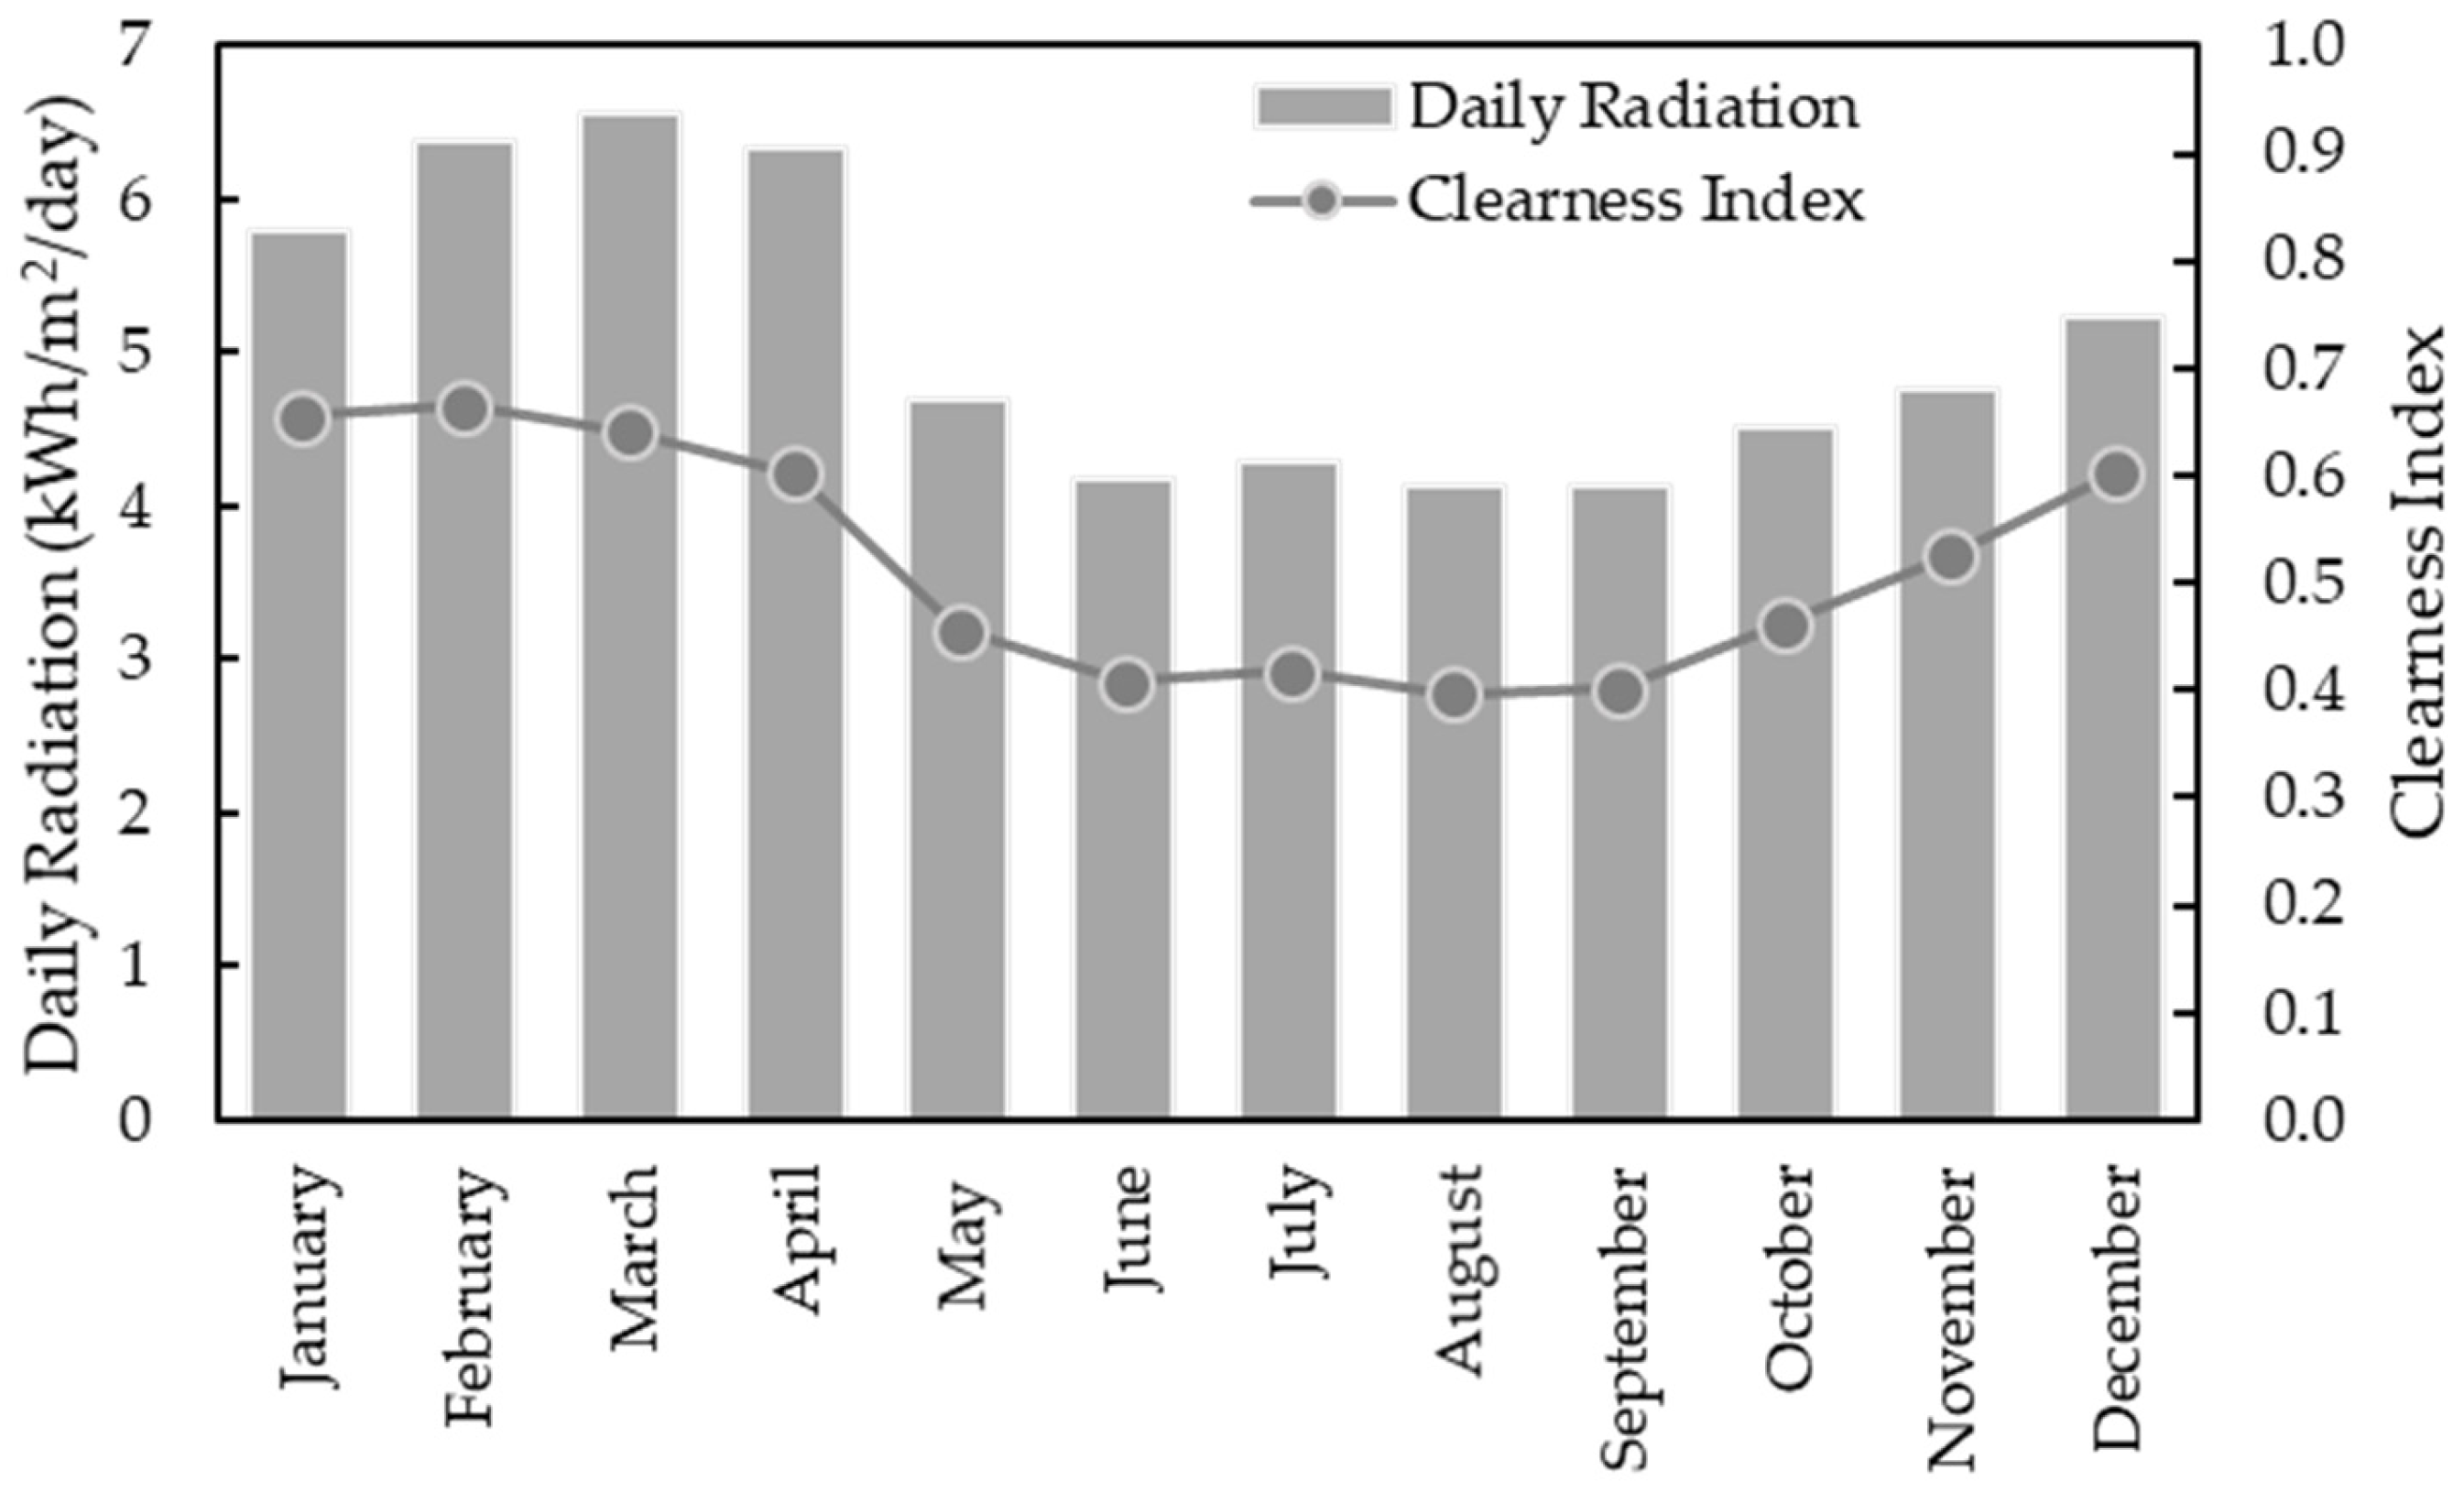
- Solar irradiance;
- (b)
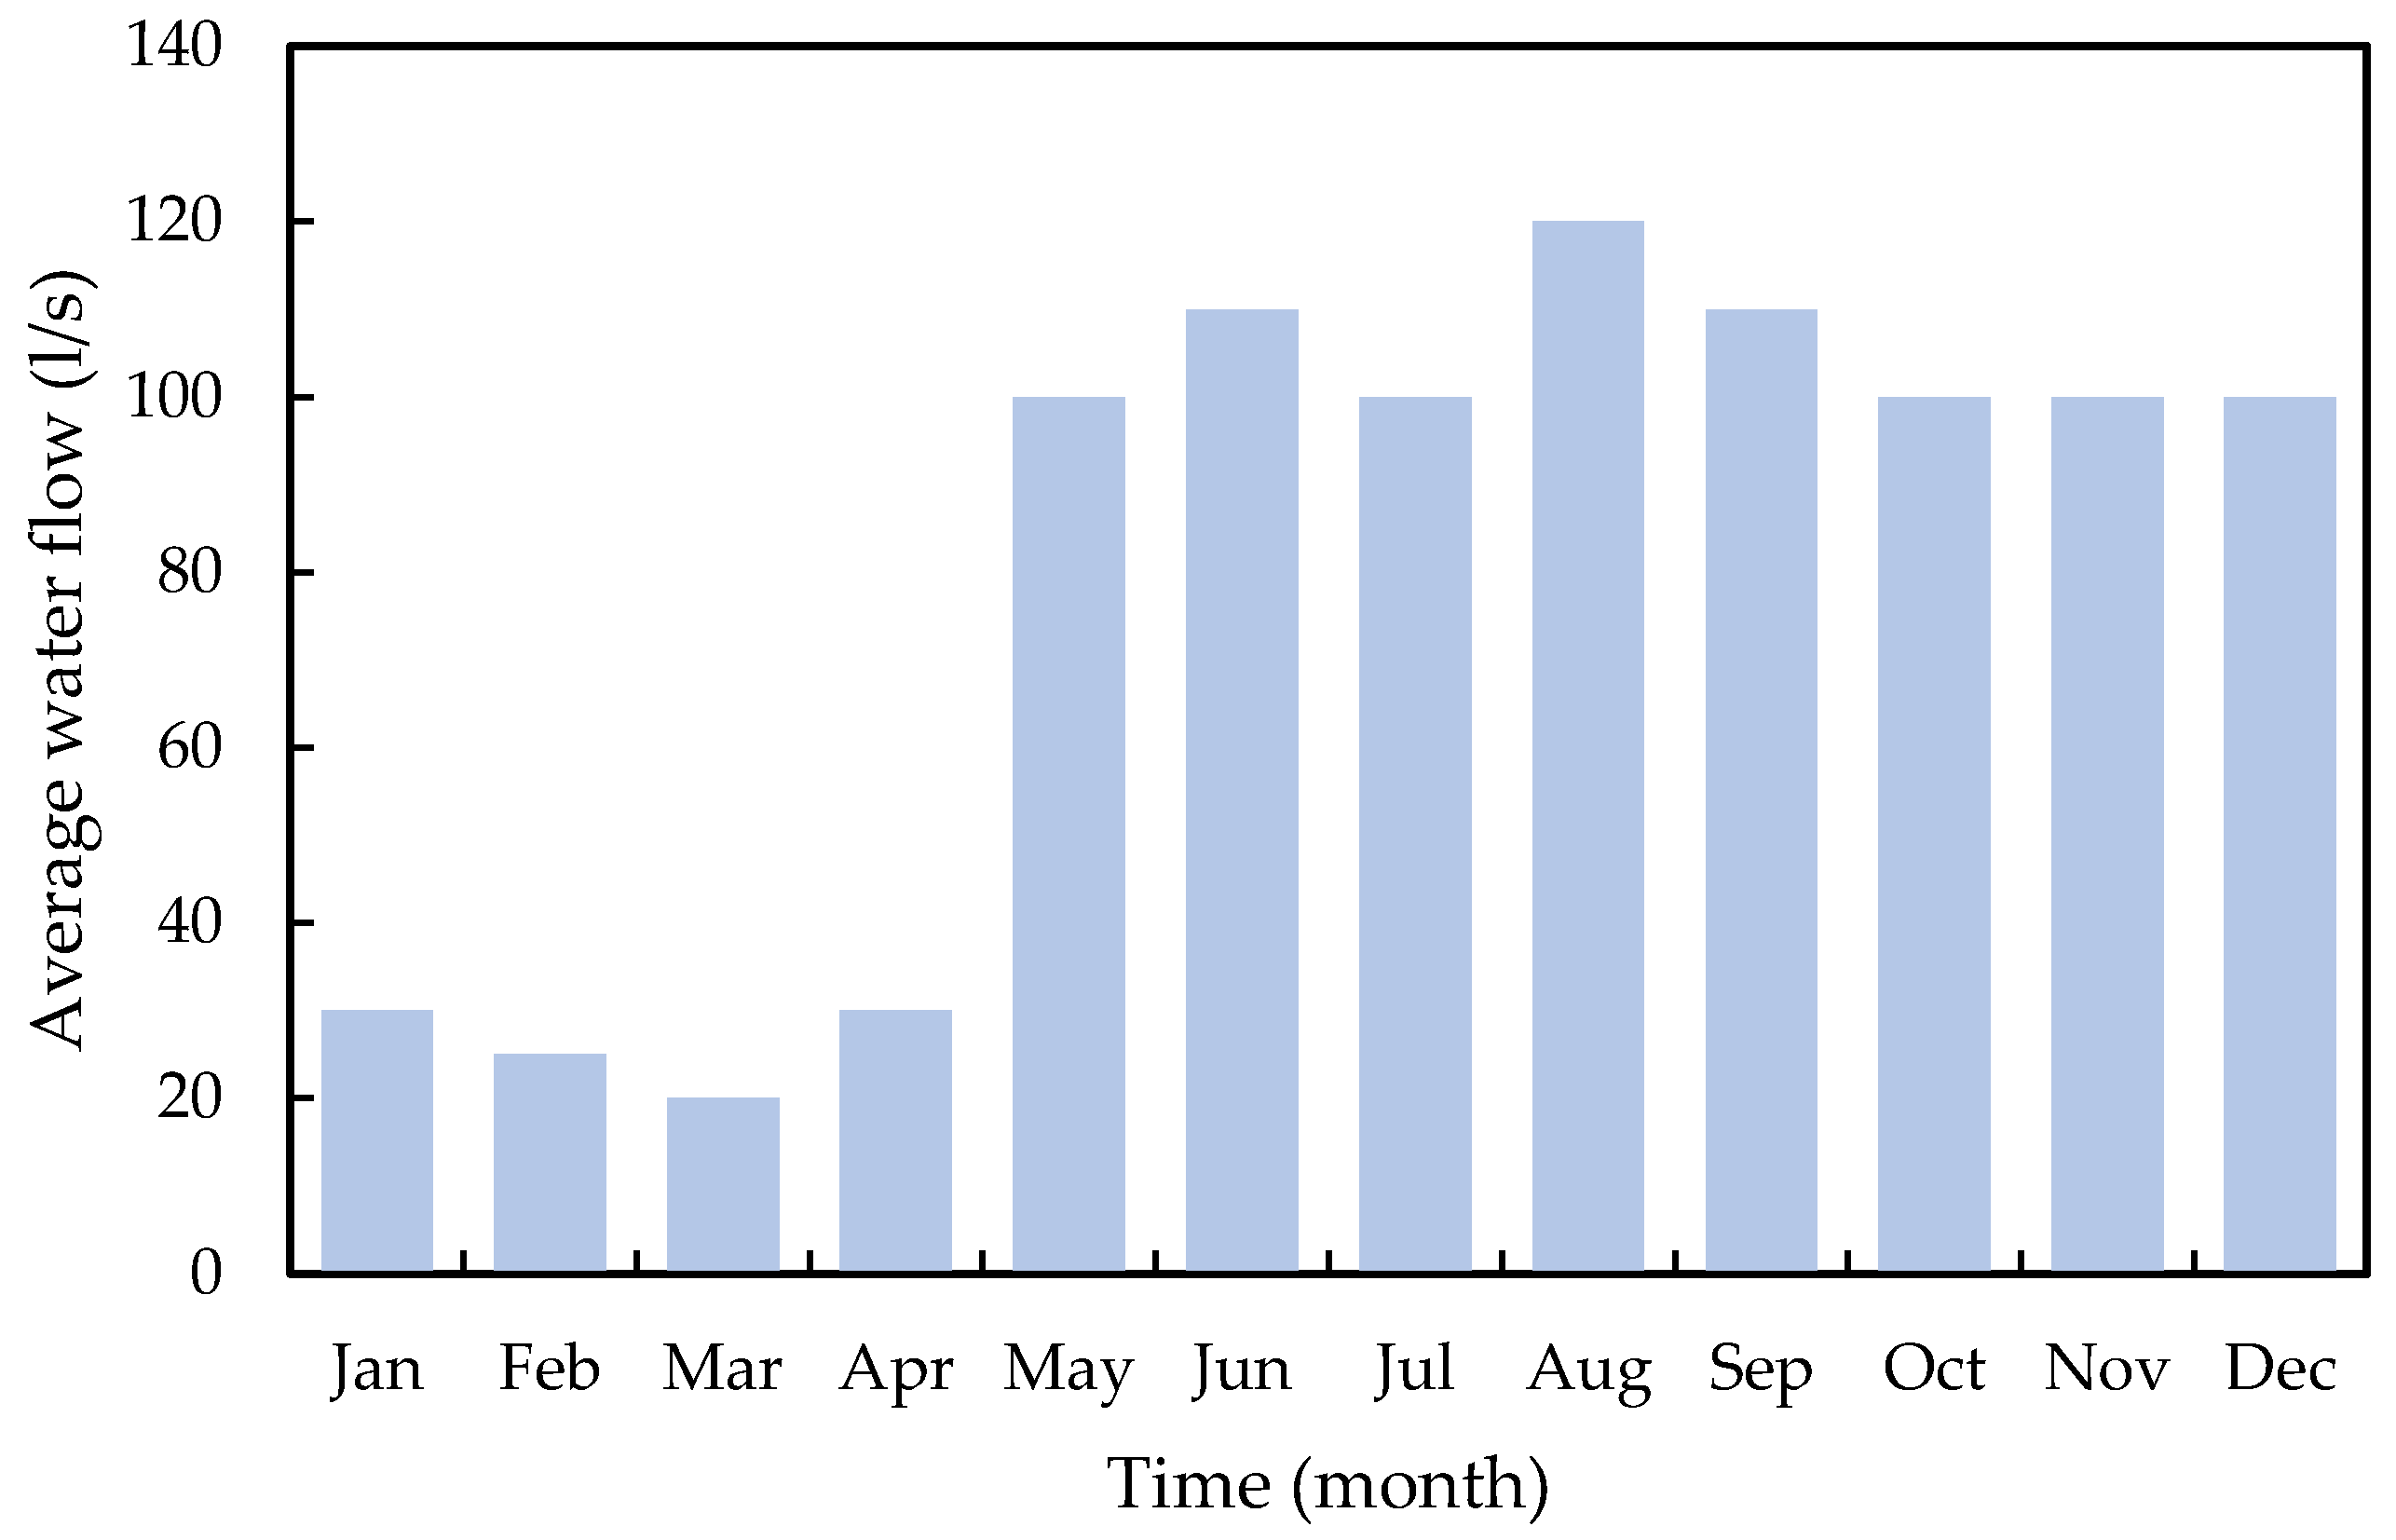
- Hydro resource;
- (c)
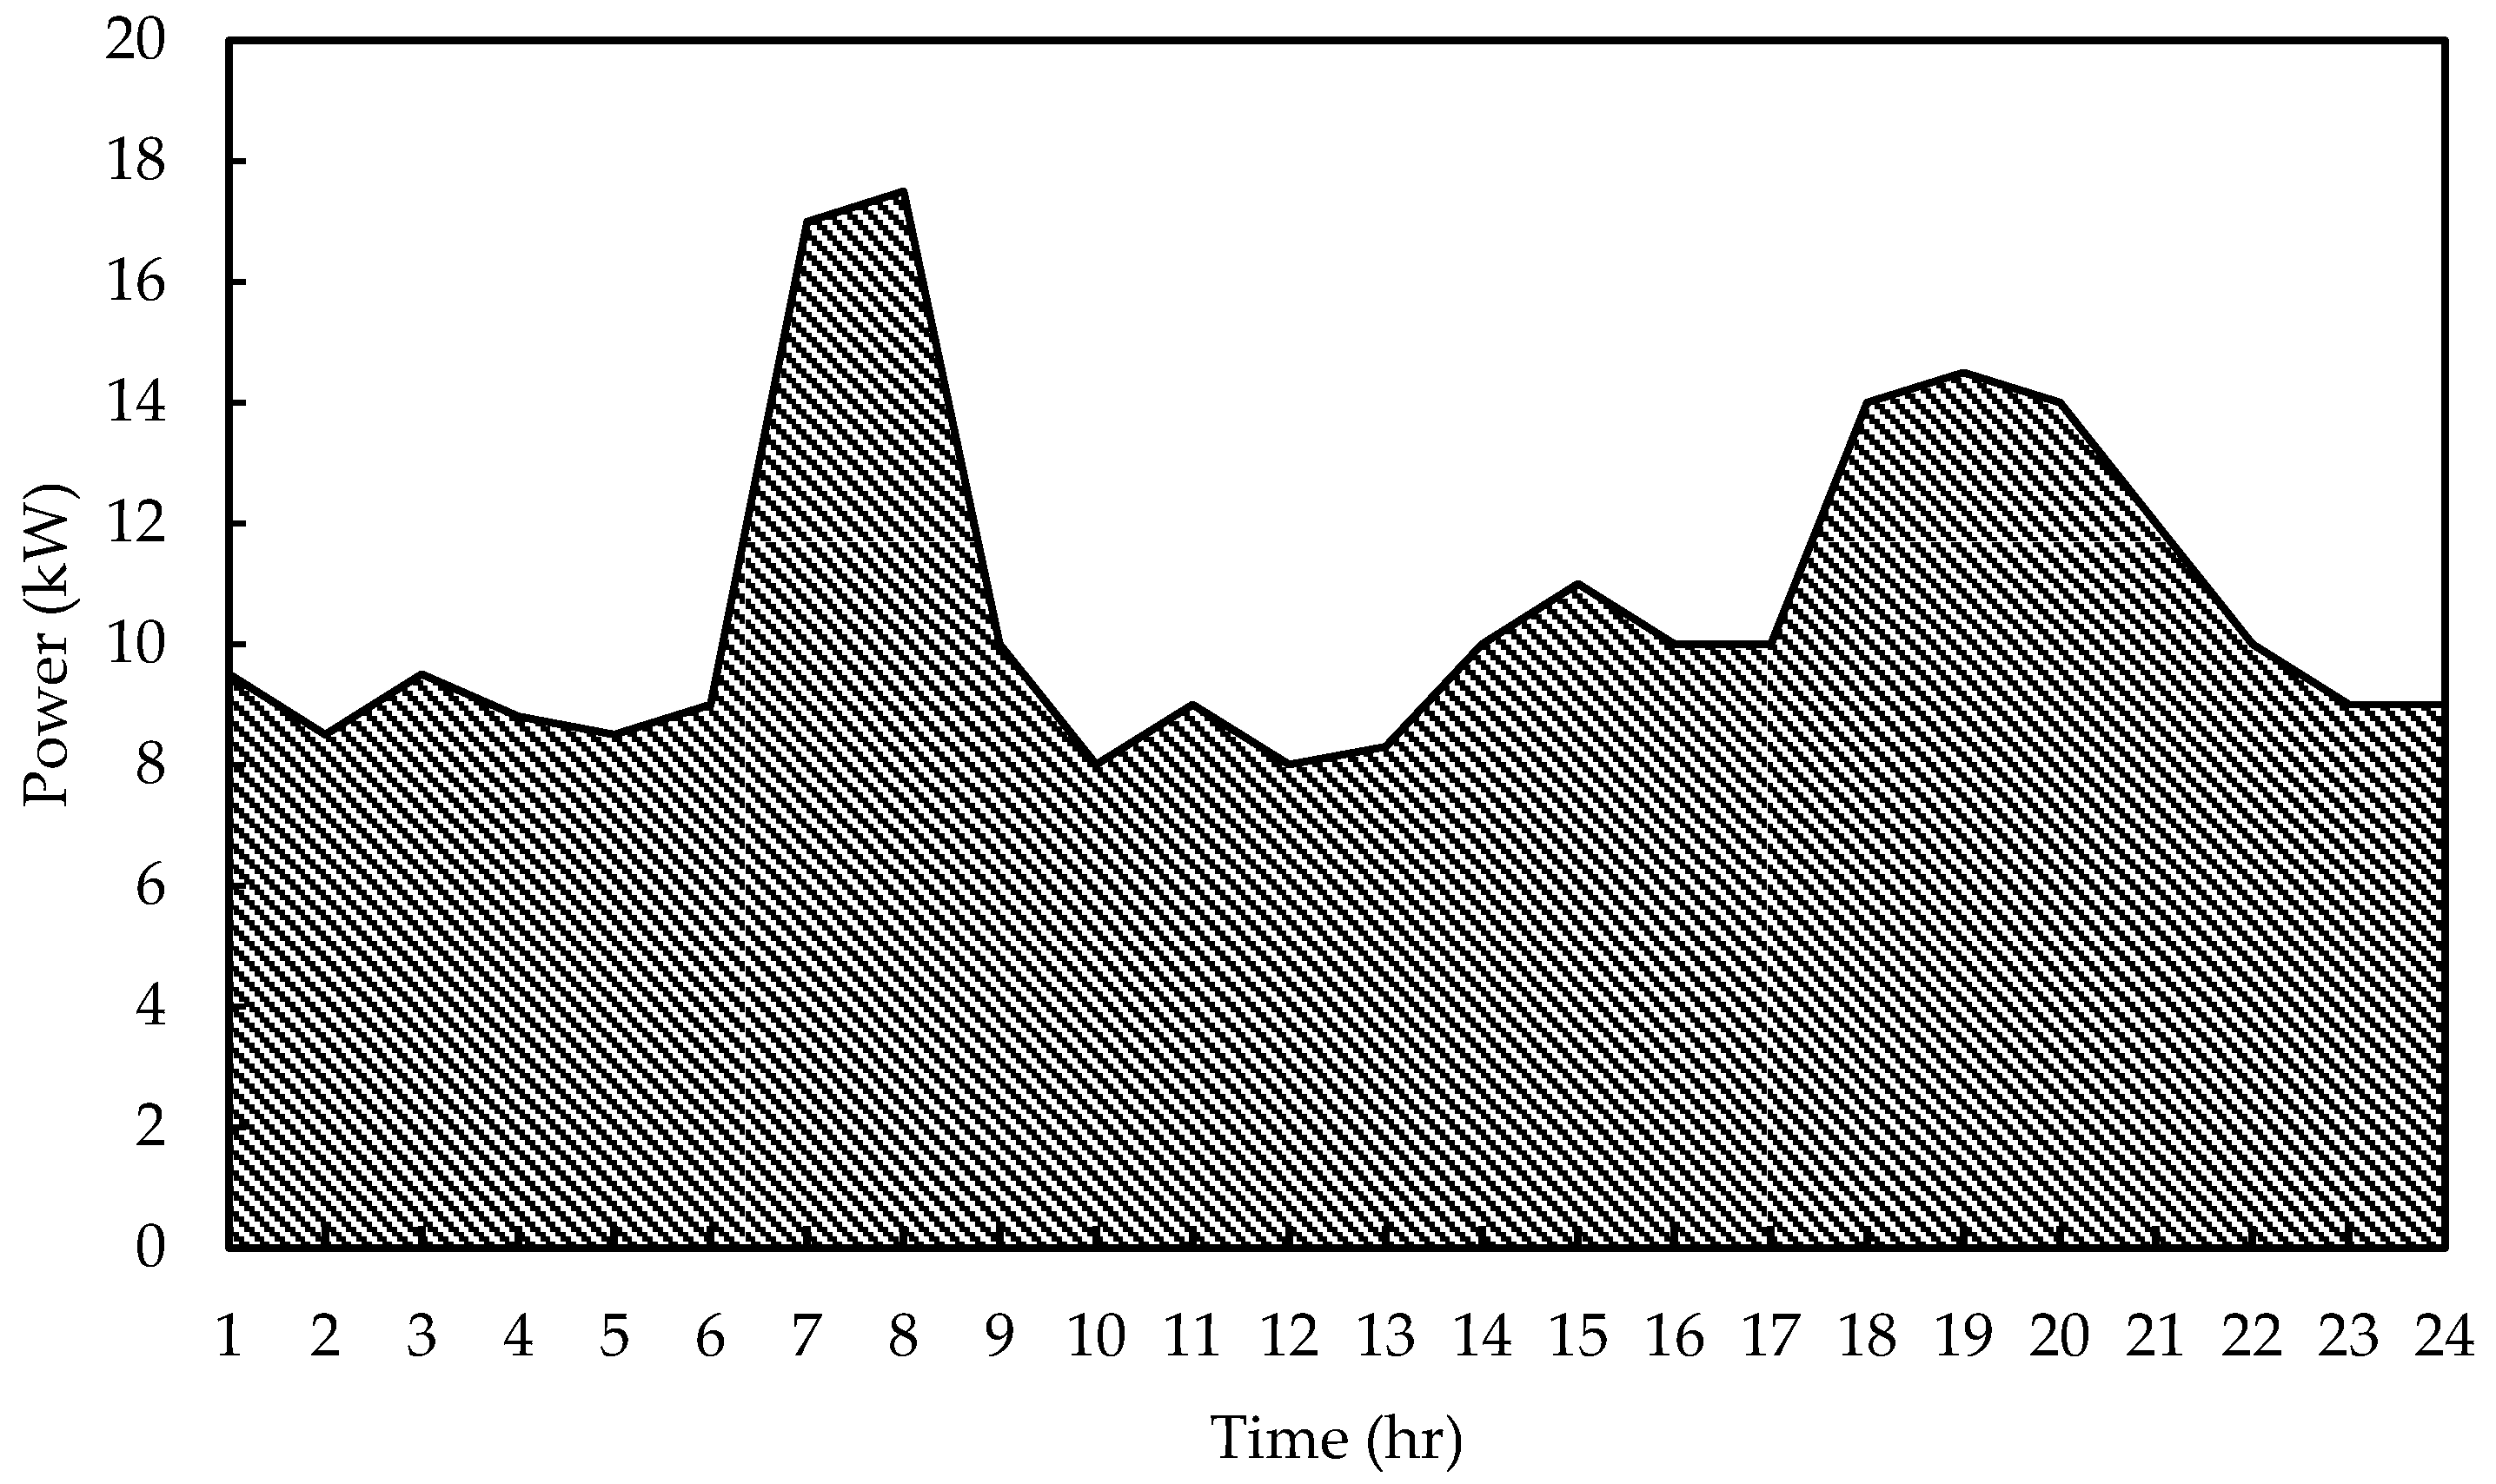
- Load demand;
- (d)
- System structure/
- III
- System configurations, mathematical formulation, and evaluation impact:
- (a)
- Photovoltaic model;
- (b)
- Hydro power model;
- (c)
- Battery model;
- (d)
- Power converter model;
- (e)
- Objective function formulation.
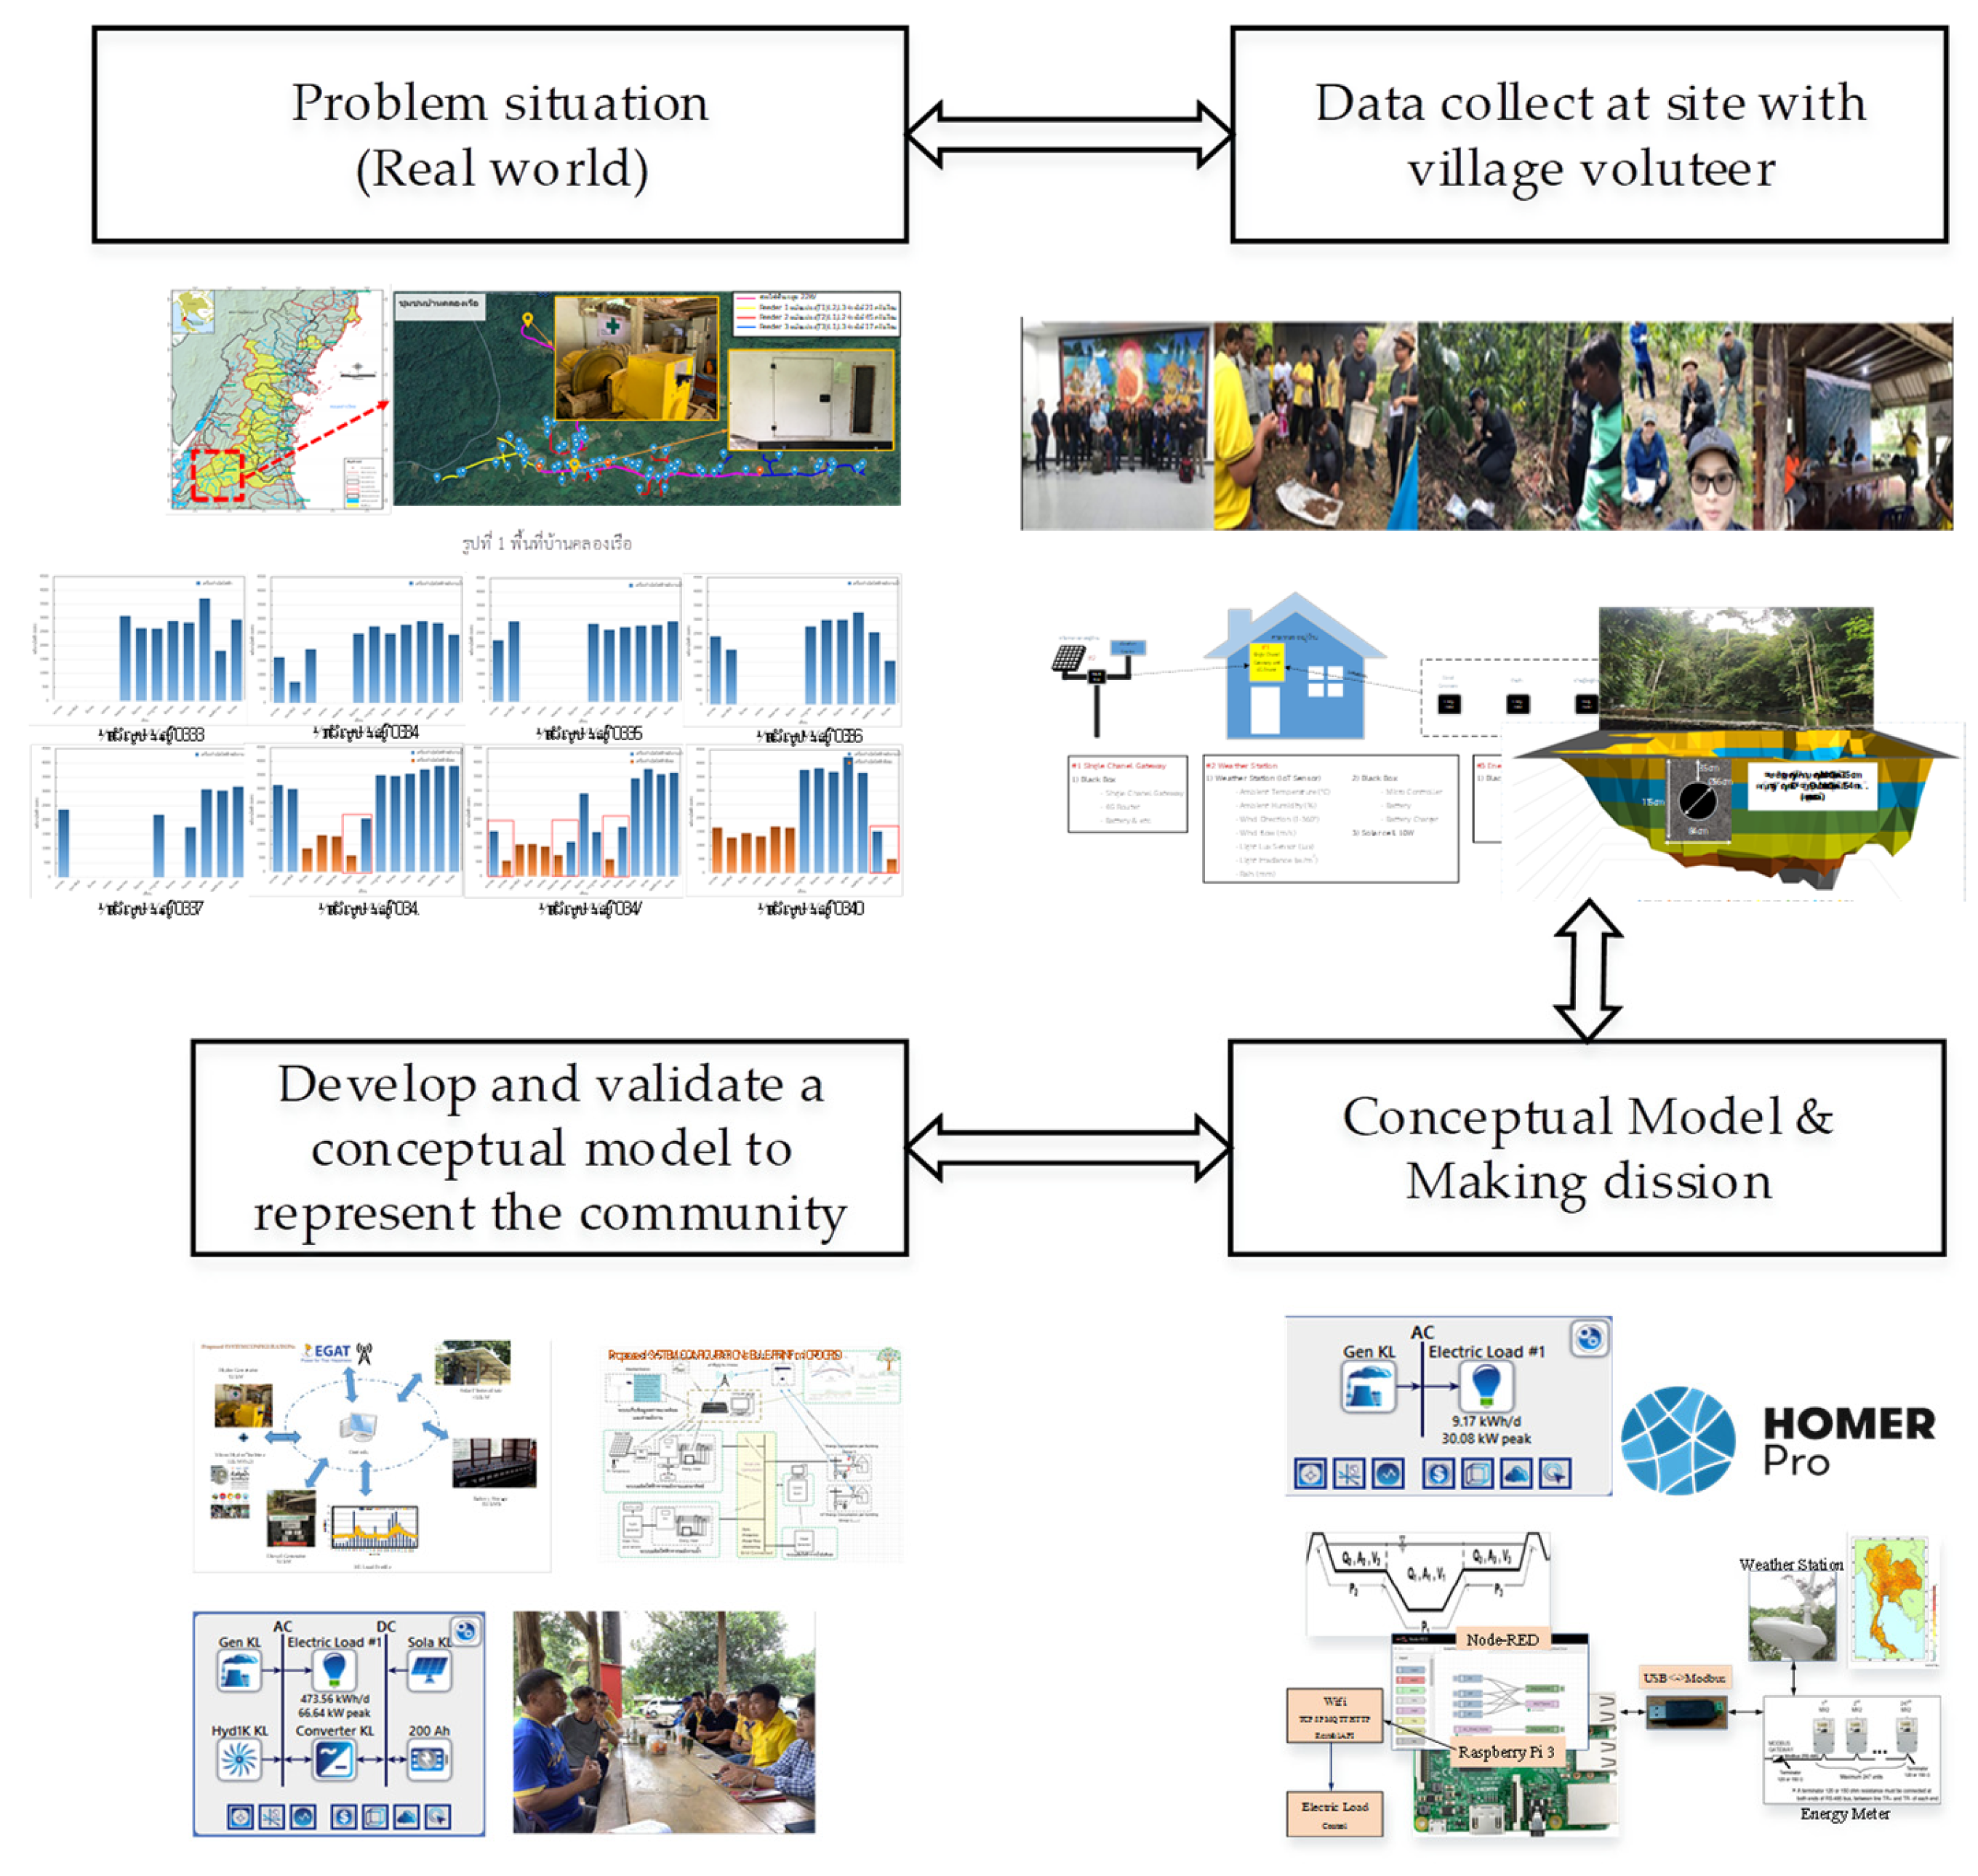
2.1. Site Specification
2.2. The Development and Validation of a Modeled Dataset
2.2.1. Global Horizontal Irradiation
2.2.2. Hydro Resource
2.2.3. Load Demand
2.2.4. Proposed System Structure
2.3. System Configurations, Mathematical Formulation, and Impact Evaluation
2.3.1. Photovoltaic Model
2.3.2. Hydro Power Model
2.3.3. Battery Model
2.3.4. Power Converter Model
2.3.5. Objective Function Formulation
2.3.6. Input Data

| System Component | Capital Cost (USD/kW) | Replacement Cost (USD/kW) [10,41,42] | O&M Cost (USD/kW/y) [41,43,44,45] | Lifetime (y) [10,44] | Efficiency (%) |
|---|---|---|---|---|---|
| PV array | 528 [40,44,46] | 528 | 11 | 25 | 95 |
| Li-ion Battery | 389 [37,39,41] | 389 | 8 | 10 | 80 |
| Pico-hydro | 972 [38,45] | 972 | 19 | 10 | 80 |
| Diesel Generator | 243 [47,48] | 243 | 5 | 10 | 70 |
| Bi-directional Inverter | 741 [29,44] | 741 | 15 | 10 | 95 |
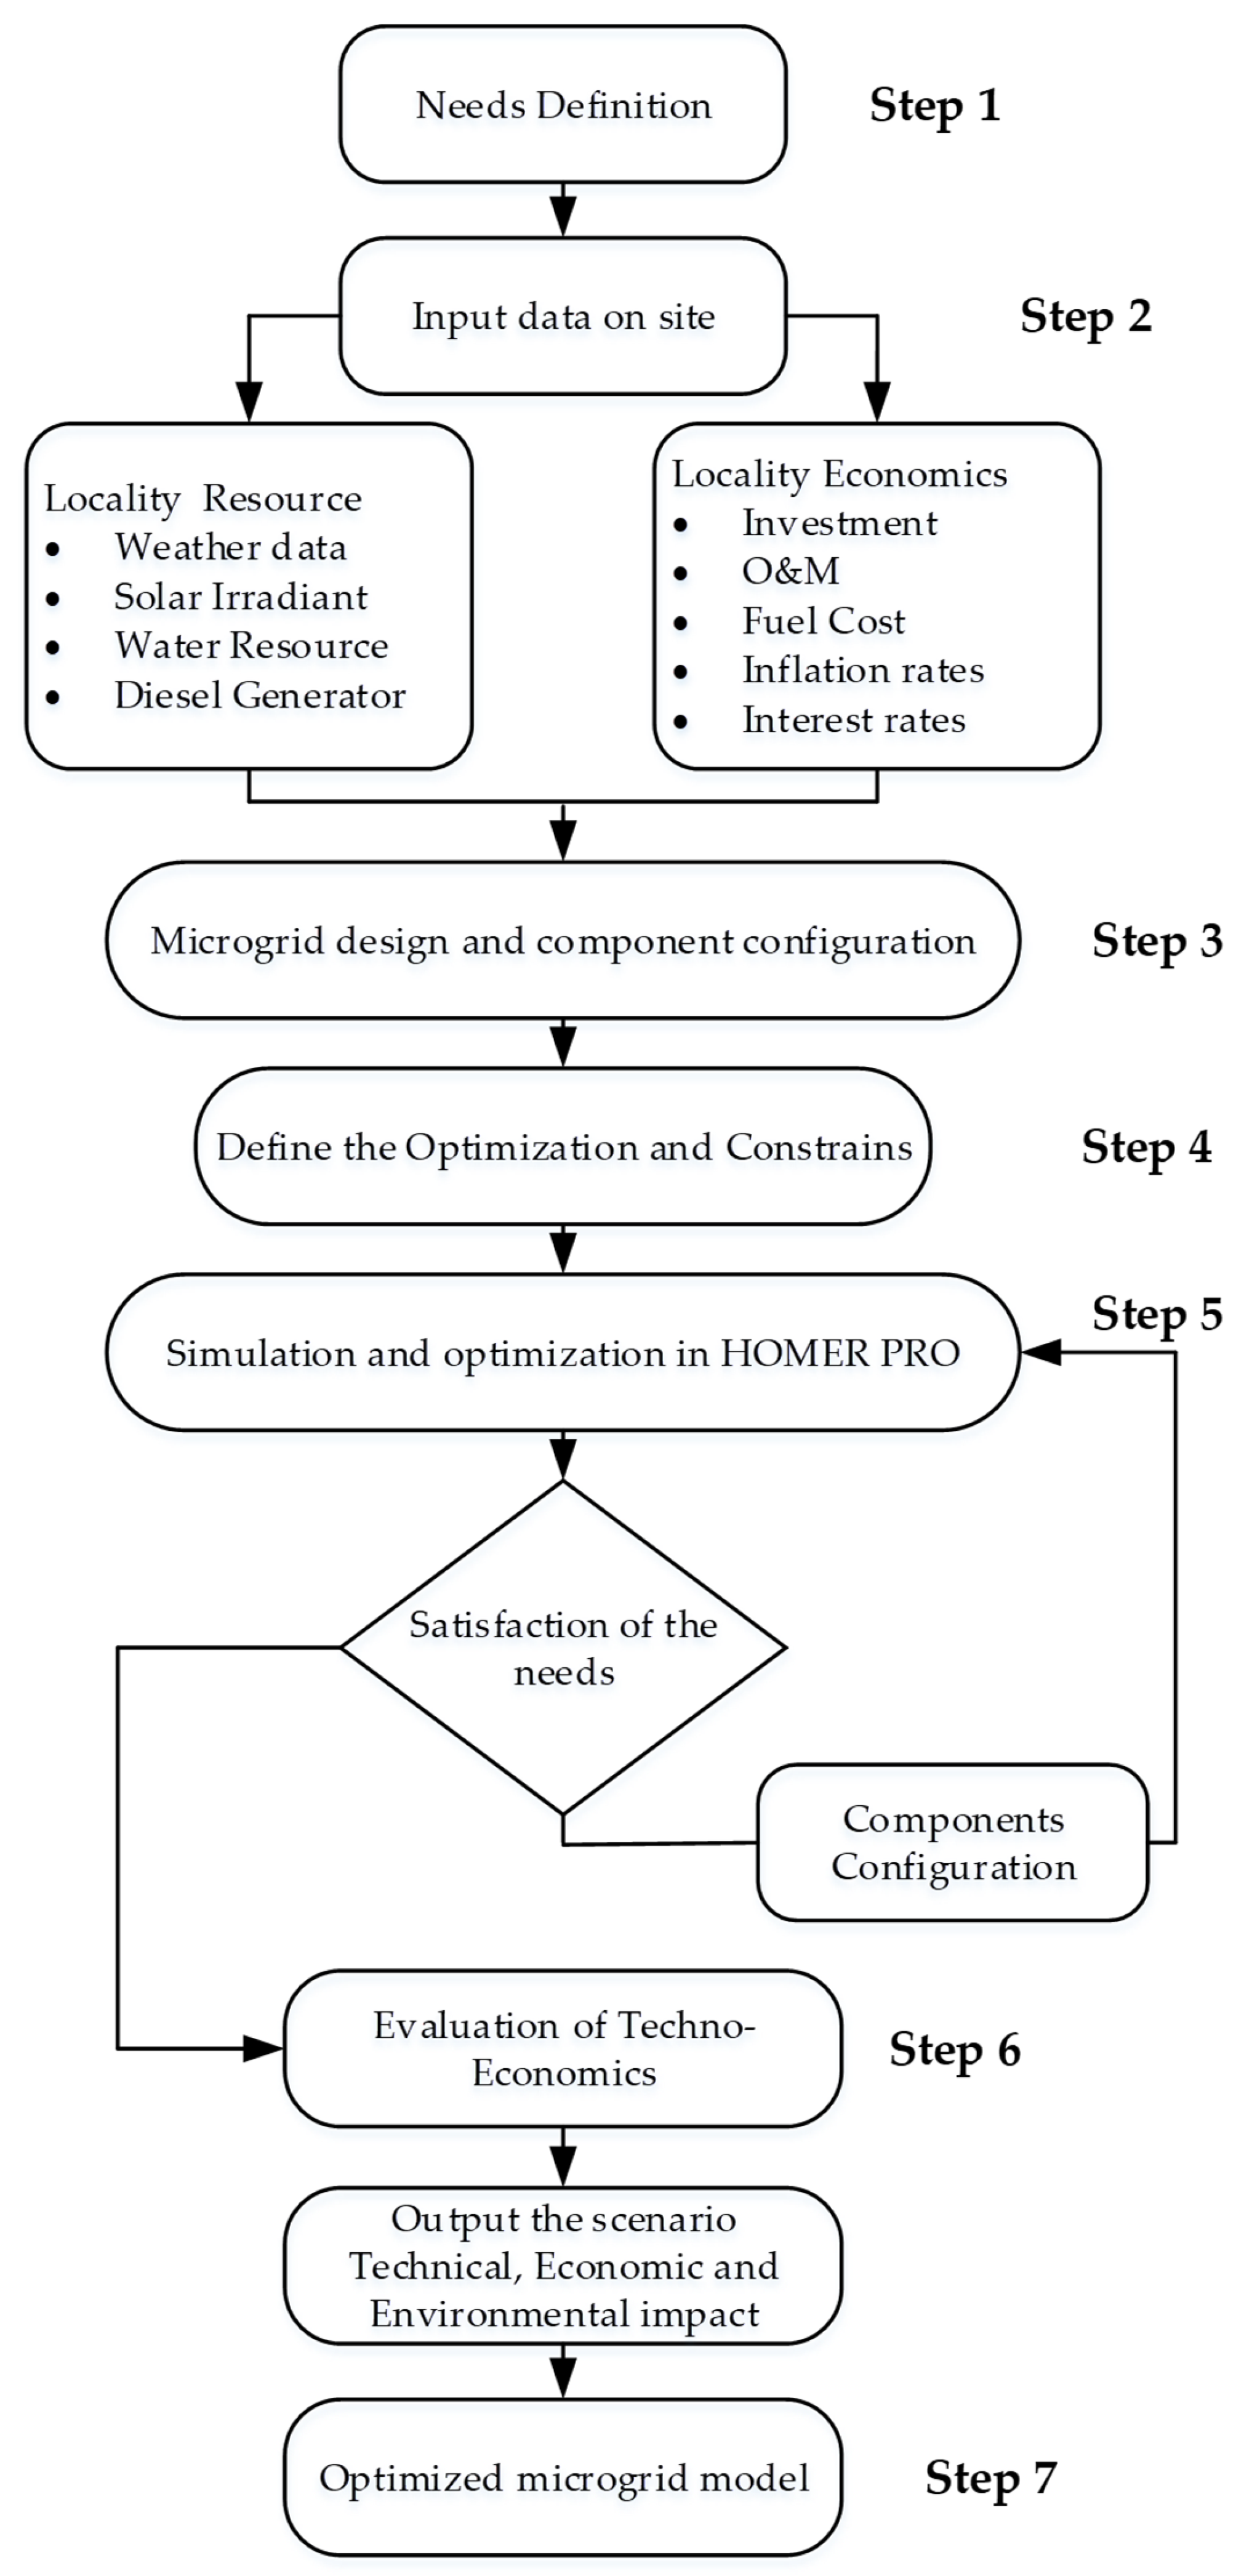
2.3.7. A Description of the Methodology for the Configuration Optimization
- Weather data, including temperature, which affects system efficiency (e.g., PV panel performance decreases at higher temperatures), as shown in Section 2.
- Diesel generator data, which, based on HOMER Pro input requirements, likely refers to fuel availability and costs, as diesel generators are components, but their fuel is a resource input.
- Investment costs for components, such as capital costs for PV panels or wind turbines.
- Operations and maintenance (O&M) costs, typically annual, in dollars per year (USD/yr).
- Fuel costs, especially for diesel or biomass, in dollars per liter (USD/l) or per kilogram (USD/kg).
- Inflation rates and interest rates, which affect the net present cost calculations over the project lifetime.
3. Results
3.1. Simulation Results of Integrated
3.2. Comparison of Present and Proposed Configuration
3.3. An Impact of Load Increase on Population vs. Economic and Sensitivity Analysis
3.3.1. An Impact of Load Increase
3.3.2. Sensitivity Analysis
3.3.3. Expanded Economic Sensitivity Analysis for Lithium-Ion Batteries and Diesel Fuel
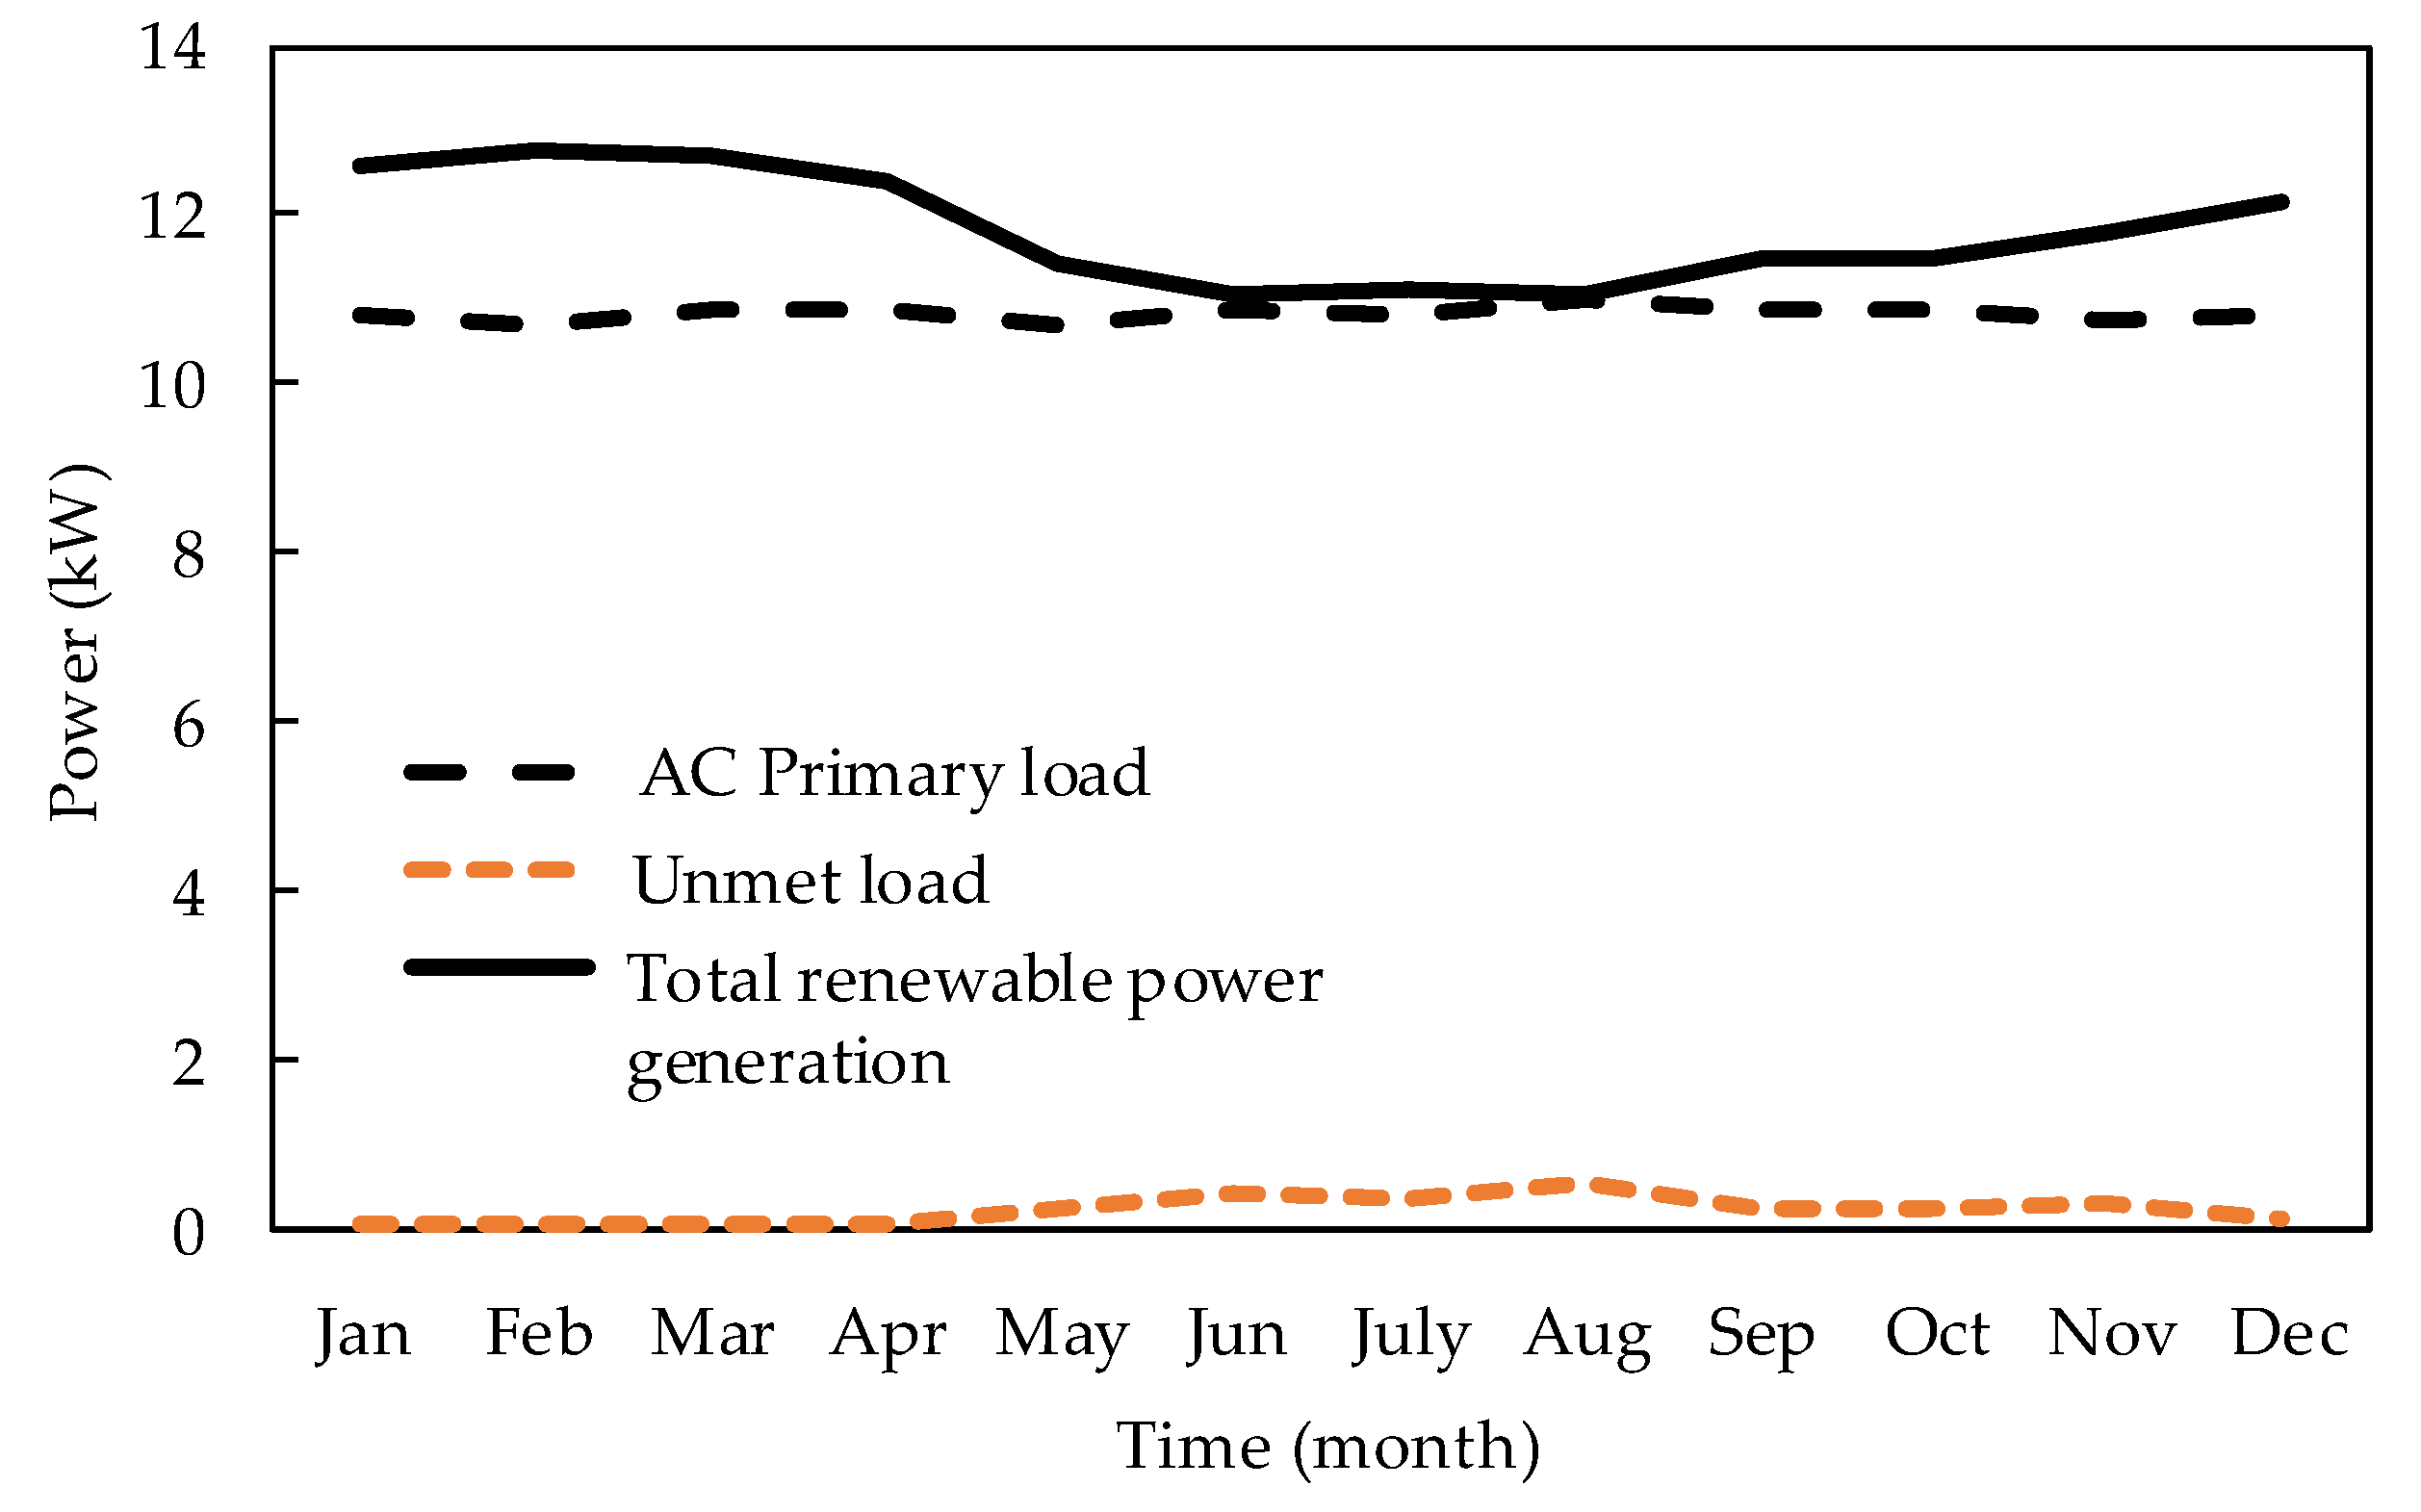
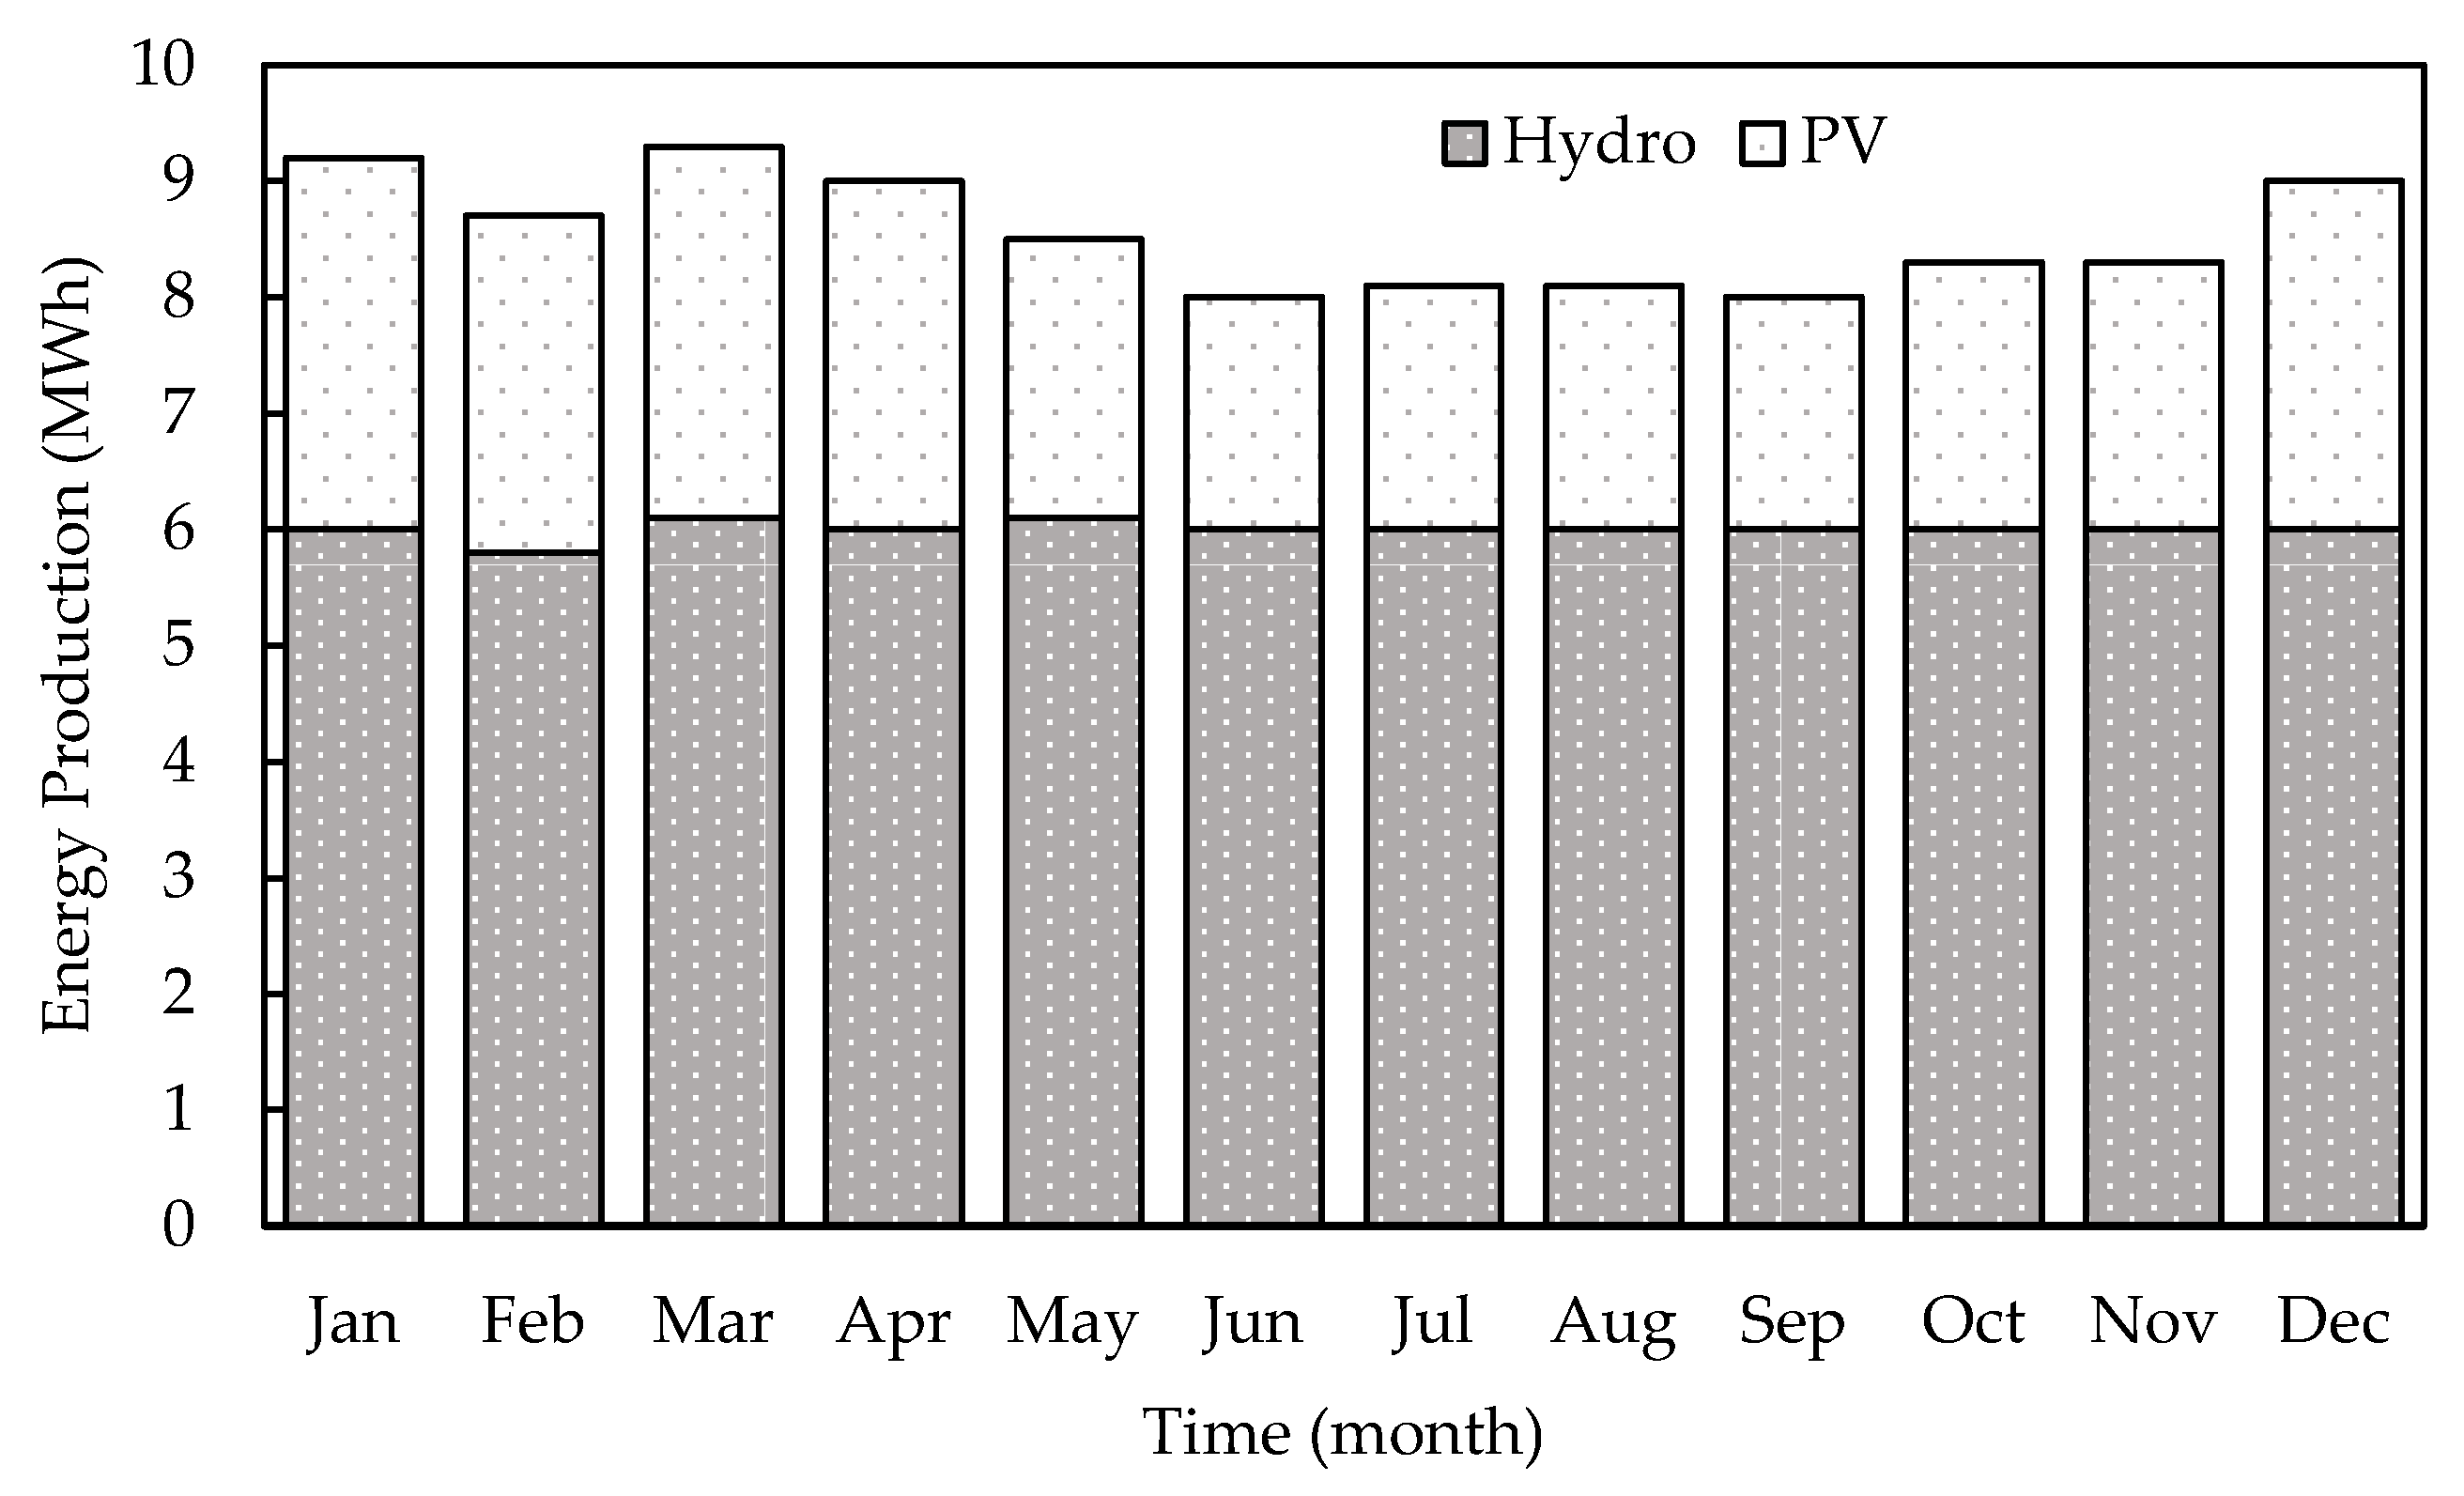
3.3.4. Detailed Analysis of Seasonal Variability and Battery Impact
3.3.5. Comparative Assessment of the Proposed System with Biomass Resource
3.3.6. Analysis and Justification of S1 Selection
4. Discussion
4.1. Technology and Policy Alignment Approach
4.2. A Rationale of 10-Year Simulation Timeframes
4.3. Comparative Analysis with Other Microgrid Hybrid Systems Implemented in Similar Geographic or Socioeconomic Conditions
4.4. The Environmental Impact of the Proposed System Assessed with Life Cycle Assessment (LCA)
4.5. Risk Assessment to Address Potential Technical, Financial, and Operational and Mitigation Strategies
4.6. Participation of Stakeholders
5. Conclusions
Author Contributions
Funding
Data Availability Statement
Acknowledgments
Conflicts of Interest
References
- International Energy Agency (IEA). World Energy Outlook 2024; IEA Publications: Paris, France, 2024; Available online: https://www.iea.org/reports/world-energy-outlook-2024 (accessed on 18 February 2025).
- Grand View Research. Renewable Energy Market Size, Share & Trends Analysis Report by Source, Product, Application, and Region, 2024–2030; Grand View Research: San Francisco, CA, USA, 2021; Available online: https://www.grandviewresearch.com/industry-analysis/renewable-energy-market (accessed on 18 February 2025).
- International Renewable Energy Agency. Renewable Energy and Jobs—Annual Review 2019; IRENA: Abu Dhabi, United Arab Emirates, 2019; Available online: https://www.irena.org/publications/2019/May/Renewable-energy-and-jobs-Annual-review-2019 (accessed on 18 February 2025).
- United Nations Environment Programme. Global Environment Outlook—GEO-6: Healthy Planet, Healthy People; UNEP: Nairobi, Kenya, 2019; Available online: https://www.unenvironment.org/resources/global-environment-outlook-6 (accessed on 18 February 2025).
- Ahmethodžić, L.; Musić, M.; Huseinbegović, S. Microgrid Energy Management: Classification, Review and Challenges. CSEE J. Power Energy Syst. 2023, 9, 1425–1437. [Google Scholar] [CrossRef]
- Agha Kassab, F.; Rodriguez, R.; Celik, B.; Locment, F.; Sechilariu, M. A Comprehensive Review of Sizing and Energy Management Strategies for Optimal Planning of Microgrids with PV and Other Renewable Integration. Appl. Sci. 2024, 14, 10479. [Google Scholar] [CrossRef]
- Gao, K.; Wang, T.; Han, C.; Xie, J.; Ma, Y.; Peng, R. A Review of Optimization of Microgrid Operation. Energies 2021, 14, 2842. [Google Scholar] [CrossRef]
- Konneh, K.V.; Adewuyi, O.B.; Lotfy, M.E.; Sun, Y.; Senjyu, T. Application Strategies of Model Predictive Control for the Design and Operations of Renewable Energy-Based Microgrid: A Survey. Electronics 2022, 11, 554. [Google Scholar] [CrossRef]
- Alzahrani, A.; Ferdowsi, M.; Shamsi, P.; Dagli, C.H. Modeling and Simulation of Microgrid. Procedia Comput. Sci. 2017, 114, 392–400. [Google Scholar] [CrossRef]
- Hafez, O.; Bhattacharya, K. Optimal Planning and Design of a Renewable Energy-Based Supply System for Microgrids. Renew. Energy 2012, 45, 7–15. [Google Scholar] [CrossRef]
- Borazjani, P.; Wahab, N.I.A.; Hizam, H.; Soh, A.C. A Review on Microgrid Control Techniques. In Proceedings of the 2014 IEEE Innovative Smart Grid Technologies—Asia (ISGT ASIA), Kuala Lumpur, Malaysia, 20–23 May 2014; pp. 749–753. [Google Scholar] [CrossRef]
- Altin, N.; Eyimaya, S.E. A Review of Microgrid Control Strategies. In Proceedings of the 10th IEEE International Conference on Renewable Energy Research and Applications (ICRERA), Istanbul, Turkey, 26–29 September 2021; IEEE: New York, NY, USA, 2021; pp. 412–417. [Google Scholar] [CrossRef]
- Jithin, K.; Haridev, P.P.; Mayadevi, N.; Harikumar, R.P.; Mini, V.P. A Review on Challenges in DC Microgrid Planning and Implementation. J. Mod. Power Syst. Clean Energy 2023, 11, 1375–1395. [Google Scholar] [CrossRef]
- Roy, S.; Das, D.C.; Sinha, N.; Shukla, R.D. A Systematic Review of Islanding Detection Approaches in Microgrids. In Proceedings of the 2023 IEEE Silchar Subsection Conference (SILCON), Silchar, India, 3–5 September 2023; Volume 1, pp. 1–6. [Google Scholar] [CrossRef]
- Ali, S.; Zheng, Z.; Aillerie, M.; Sawicki, J.-P.; Péra, M.-C.; Hissel, D. A Review of DC Microgrid Energy Management Systems Dedicated to Residential Applications. Energies 2021, 14, 4308. [Google Scholar] [CrossRef]
- Farkhani, J.S.; Zareein, M.; Najafi, A.; Melicio, R.; Rodrigues, E.M.G. The Power System and Microgrid Protection—A Review. Appl. Sci. 2020, 10, 8271. [Google Scholar] [CrossRef]
- Jian, C.; Yanbo, C.; Jijie, Z. Optimal Configuration and Analysis of Isolated Renewable Power Systems. In Proceedings of the 2011 4th International Conference on Power Electronics Systems and Applications, Hong Kong, China, 8–10 June 2011; pp. 1–8. [Google Scholar] [CrossRef]
- Kumar, P.; Pukale, R.; Kumabhar, N.; Patil, U. Optimal Design Configuration Using HOMER. Procedia Technol. 2016, 24, 499–504. [Google Scholar] [CrossRef]
- Jain, S.; Singh, P.; Pandit, M.; Chaudhary, V. Optimal Design of an Off-Grid Hybrid System Using HOMER Pro. In Proceedings of the 2023 International Conference on Computer, Electronics & Electrical Engineering & their Applications (IC2E3), Srinagar Garhwal, India, 8–9 June 2023. [Google Scholar] [CrossRef]
- Shifullah, K.M.; Rony, M.M.R.; Udoy, S.A.; Bhowmik, S.; Masuk, N.I.; Diganta, A.C.; Hasan, M.H.; Islam, M.; Islam, M.A.; Shariar, A.K.M.S.; et al. A Case Study on Hybrid Power Systems Using HOMER Pro: Design, Optimization, and Comparison of Different Configurations and Proposing the Best Configuration for a University Campus. In Proceedings of the International Conference on Mechanical, Industrial and Materials Engineering (ICMIME2022), Rajshahi, Bangladesh, 20–22 December 2022; Available online: https://www.researchgate.net/publication/366548432 (accessed on 10 February 2025).
- Ali, M.F.; Hossain, M.A.; Julhash, M.M.; Ashikuzzaman, M.; Alam, M.S.; Sheikh, M.R.I. A Techno-Economic Analysis of a Hybrid Microgrid System in a Residential Area of Bangladesh: Optimizing Renewable Energy. Sustainability 2024, 16, 8051. [Google Scholar] [CrossRef]
- Al Garni, H.Z.; Awasthi, A.; Ramli, M.A.M. Optimal Design and Analysis of Grid-Connected Photovoltaic under Different Tracking Systems Using HOMER. Energy Convers. Manag. 2018, 155, 42–57. [Google Scholar] [CrossRef]
- Khalil, L.; Bhatti, K.L.; Awan, M.A.I.; Riaz, M.; Khalil, K.; Alwaz, N. Optimization and Designing of Hybrid Power System Using HOMER Pro. Mater. Today Proc. 2020, 47, S110–S115. [Google Scholar] [CrossRef]
- Kangaji, L.M.; Raji, A.; Orumwense, E. Optimizing Sustainability Offshore Hybrid Tidal-Wind Energy Storage Systems for an Off-Grid Coastal City in South Africa. Sustainability 2024, 16, 9139. [Google Scholar] [CrossRef]
- Suriadi, S.; Daru, W.I.; Halid, R.S.; Syukri, M.; Gapy, M. The Optimization of Hybrid Power Generator System (PV-Wind Turbine) Using HOMER Software. IOP Conf. Ser. Mater. Sci. Eng. 2021, 1087, 012080. [Google Scholar] [CrossRef]
- Seedahmed, M.M.A.; Ramli, M.A.M.; Bouchekara, H.R.E.H.; Milyani, A.H.; Rawa, M.; Budiman, F.N.; Muktiadji, R.F.; Hassan, S.M.U. Optimal Sizing of Grid-Connected Photovoltaic System for a Large Commercial Load in Saudi Arabia. Alex. Eng. J. 2022, 61, 6523–6540. [Google Scholar] [CrossRef]
- Alabdul Salam, M.; Aziz, A.; Alwaeli, A.H.; Kazem, H.A. Optimal Sizing of Photovoltaic Systems Using HOMER for Sohar, Oman. Int. J. Renew. Energy Technol. 2013, 3, 302–307. Available online: https://www.researchgate.net/publication/260106045 (accessed on 18 February 2025).
- Melaibari, A.A.; Abdul-Aziz, A.M.; Abu-Hamdeh, N.H. Design and Optimization of a Backup Renewable Energy Station for Photovoltaic Hybrid System in the New Jeddah Industrial City. Sustainability 2022, 14, 17044. [Google Scholar] [CrossRef]
- Wahid, S.S.A.; Arief, Y.Z.; Mubarakah, N. Optimization of Hybrid Renewable Energy in Malaysia Remote Rural Area Using HOMER Software. In Proceedings of the International Conference on Electrical, Telecommunication and Computer Engineering (ELTICOM), Medan, Indonesia, 16–17 September 2019; pp. 111–115. [Google Scholar] [CrossRef]
- Hernandez, L.; Baladrón, C.; Aguiar, J.M.; Carro, B.; Sanchez-Esguevillas, A.; Lloret, J. Short-Term Load Forecasting for Microgrids Based on Artificial Neural Networks. Energies 2013, 6, 1385–1408. [Google Scholar] [CrossRef]
- Alhawsawi, E.Y.; Salhein, K.; Zohdy, M.A. A Comprehensive Review of Existing and Pending University Campus Microgrids. Energies 2024, 17, 2425. [Google Scholar] [CrossRef]
- Hasan, S.M.N.; Ahmad, S.; Liaf, A.F.; Mustayen, A.G.M.B.; Hasan, M.M.; Ahmed, T.; Howlader, S.; Hassan, M.; Alam, M.R. Techno-Economic Performance and Sensitivity Analysis of an Off-Grid Renewable Energy-Based Hybrid System: A Case Study of Kuakata, Bangladesh. Energies 2024, 17, 1476. [Google Scholar] [CrossRef]
- Pérez Uc, D.A.; de León Aldaco, S.E.; Aguayo Alquicira, J. Trends in Hybrid Renewable Energy System (HRES) Applications: A Review. Energies 2024, 17, 2578. [Google Scholar] [CrossRef]
- Dahiru, A.T.; Tan, C.W. Optimal Sizing and Techno-Economic Analysis of Grid-Connected Nanogrid for Tropical Climates of the Savannah. Sustain. Cities Soc. 2020, 52, 101824. [Google Scholar] [CrossRef]
- Bank of Thailand. Economic and Financial Statistics. 2022. Available online: https://www.bot.or.th (accessed on 18 February 2025).
- International Renewable Energy Agency (IRENA). Renewable Power Generation Costs in 2021; IRENA: Abu Dhabi, United Arab Emirates, 2022; Available online: https://www.irena.org/publications/2022/Jul/Renewable-Power-Generation-Costs-in-2021 (accessed on 18 February 2025).
- Electricity Generating Authority of Thailand (EGAT). Project Funding Data: 65-B502000-11-IO.SS03B3008629; Internal Report; EGAT: Bangkok, Thailand, 2022. [Google Scholar]
- Clean Energy System (CES-RMUTL). Pico-Hydro Project Cost Estimates; Rajamangala University of Technology Lanna: Chiang Mai, Thailand, 2022. [Google Scholar]
- Veilleux, G.; Potisat, T.; Pezim, D.; Ribback, C.; Ling, J.; Krysztofiński, A.; Ahmed, A.; Papenheim, J.; Mon Pineda, A.; Sembian, S.; et al. Techno-Economic Analysis of Microgrid Projects for Rural Electrification: A Systematic Approach to the Redesign of Koh Jik Off-Grid Case Study. Energy Sustain. Dev. 2020, 54, 1–13. [Google Scholar] [CrossRef]
- Asian Development Bank (ADB). Thailand Energy Sector Assessment, Strategy, and Road Map; ADB: Manila, Philippines, 2016; Available online: https://www.adb.org (accessed on 18 February 2025).
- International Renewable Energy Agency (IRENA). Electricity Storage and Renewables: Costs and Markets to 2030; IRENA: Abu Dhabi, United Arab Emirates, 2017; Available online: https://www.irena.org/publications/2017/Oct/Electricity-storage-and-renewables-costs-and-markets (accessed on 18 February 2025).
- HOMER Energy LLC. HOMER Pro 3.14 User Manual; HOMER Energy LLC: Boulder, CO, USA, 2020; Available online: https://homerenergy.com/products/pro/docs/index.html (accessed on 18 February 2025).
- Meenual, T.; Usapein, P. Microgrid Policies: A Review of Technologies and Key Drivers of Thailand. Front. Energy Res. 2021, 9, 591537. [Google Scholar] [CrossRef]
- International Renewable Energy Agency (IRENA). Battery Storage for Renewables: Market Status and Technology Outlook; IRENA: Abu Dhabi, United Arab Emirates, 2015; Available online: https://www.irena.org/Publications/2015/Jan/Battery-Storage-for-Renewables-Market-Status-and-Technology-Outlook (accessed on 18 February 2025).
- Muh, E.; Tabet, F. Comparative Analysis of Hybrid Renewable Energy Systems for Off-Grid Applications in Southern Cameroons. Renew. Energy 2019, 140, 299–314. [Google Scholar] [CrossRef]
- Ministry of Energy, Thailand. Alternative Energy Development Plan 2018–2037; Ministry of Energy: Bangkok, Thailand, 2018. Available online: https://www.eppo.go.th/index.php/th/plan-policy/stategyeppo (accessed on 18 February 2025).
- International Energy Agency (IEA). World Energy Outlook 2021; IEA Publications: Paris, France, 2021; Available online: https://www.iea.org/reports/world-energy-outlook-2021 (accessed on 18 February 2025).
- Odou, O.D.T.; Bhandari, R.; Adamou, R. Hybrid Off-Grid Renewable Power System for Sustainable Rural Electrification in Benin. Renew. Energy 2020, 145, 1266–1279. [Google Scholar] [CrossRef]
- BloombergNEF. Lithium-Ion Battery Pack Prices See Largest Drop Since 2017, Falling to $115 per Kilowatt-Hour. Available online: https://about.bnef.com/blog/lithium-ion-battery-pack-prices-see-largest-drop-since-2017-falling-to-115-per-kilowatt-hour-bloombergnef/ (accessed on 18 February 2025).
- BloombergNEF. Lithium-Ion Battery Pack Prices Hit Record Low of $139/kWh. Available online: https://about.bnef.com/blog/lithium-ion-battery-pack-prices-hit-record-low-of-139-kwh (accessed on 18 February 2025).
- Cano, Z.P.; Banham, D.; Ye, S.; Hintennach, A.; Lu, J.; Fowler, M.; Chen, Z. Historical and Prospective Lithium-Ion Battery Cost Trajectories. Joule 2023, 9, 31985. [Google Scholar] [CrossRef]
- Statista. U.S. Diesel Fuel Retail Price per Month. 2024. Available online: https://www.statista.com/statistics/204169/retail-prices-of-diesel-fuel-in-the-united-states-since-2009/ (accessed on 18 February 2025).
- Translogistics Inc. US Energy Forecast for 2025: Transportation Sector Overview. Available online: https://www.translogisticsinc.com/modes-of-transportation/us-energy-forecast-for-2025-transportation-sector-overview (accessed on 18 February 2025).
- OECD. Clean Energy Finance and Investment Roadmap of Thailand. In Green Finance and Investment; OECD Publishing: Paris, France, 2024. [Google Scholar] [CrossRef]
- Ferahtia, S.; Rezk, H.; Olabi, A.G.; Alhumade, H.; Bamufleh, H.S.; Doranehgard, M.H.; Abdelkareem, M.A. Optimal Techno-Economic Multi-Level Energy Management of Renewable-Based DC Microgrid for Commercial Buildings Applications. Appl. Energy 2022, 327, 120022. [Google Scholar] [CrossRef]
- Erdiwansyah, E.; Mahidin, M.; Mamat, R.; Zaki, M.S.; Sani, S.; Hamdani, H.; Muhibbuddin, M.; Sudhakar, K.; Alias, J.; Mat, N.; et al. An Overview of Renewable Energy in Southeast Asia: Current Status and Future Target. Int. J. Sci. Technol. Res. 2020, 9, 294–309. [Google Scholar]
- United Nations Economic and Social Commission for Asia and the Pacific (ESCAP). Financing Clean Energy Transitions in Asia and the Pacific; ESCAP: Bangkok, Thailand, 2023; Available online: https://www.unescap.org (accessed on 18 February 2025).
- International Renewable Energy Agency (IRENA). Renewable Energy in the Asia-Pacific; IRENA: Abu Dhabi, United Arab Emirates, 2019; Available online: https://www.irena.org (accessed on 18 February 2025).
- International Renewable Energy Agency (IRENA); ASEAN Centre for Energy (ACE). Renewable Energy Outlook for ASEAN: Towards a Regional Energy Transition, 2nd ed.; IRENA: Abu Dhabi, United Arab Emirates; ACE: Jakarta, Indonesia, 2022; ISBN 978-92-9260-467-7. Available online: www.irena.org/publications (accessed on 18 February 2025).
- Khamharnphol, R.; Kamdar, I.; Waewsak, J.; Chaichan, W.; Khunpetcha, S.; Chiwamongkhonkarn, S.; Kongruang, C.; Gagnon, Y. Microgrid Hybrid Solar/Wind/Diesel and Battery Energy Storage Power Generation System: Application to Koh Samui, Southern Thailand. Int. J. Renew. Energy Dev. 2023, 12, 216–226. [Google Scholar] [CrossRef]
- Kanna, R.R.; Singh, R.R. A Feasibility Study on Balarbhita for Advancing Rural Electrification with a Solar—Micro-Hydro Hybrid System. Front. Energy Res. 2022, 10, 960045. [Google Scholar] [CrossRef]
- Tarife, R.; Nakanishi, Y.; Chen, Y.; Zhou, Y.; Estoperez, N.; Tahud, A. Optimization of Hybrid Renewable Energy Microgrid for Rural Agricultural Area in Southern Philippines. Energies 2022, 15, 2251. [Google Scholar] [CrossRef]
- Dahllöf, L. Lithium-Ion Vehicle Battery Production: Status 2019 on Energy Use, CO2 Emissions, Use of Metals, Products, Environmental Footprint, and Recycling; IVL Swedish Environmental Research Institute, Stockholm, Sweden. 2019. Available online: https://www.ivl.se/english/ivl/publications/publications/lithium-ion-vehicle-battery-production----status-2019-on-energy-use-co2-emissions-use-of-metals-products-environmental-footprint-and-recycling.html (accessed on 18 February 2025).
- Choubey, P.K.; Zhao, Y.; Chung, W.; Lee, J. Environmental Challenges Associated with Lithium-Ion Battery Production: A Review. J. Clean. Prod. 2021, 297, 126621. [Google Scholar] [CrossRef]
- Gaines, L. Lithium-Ion Battery Recycling Processes: Research Towards a Sustainable Course. Sustain. Mater. Technol. 2018, 17, e00068. [Google Scholar] [CrossRef]
- Hawkins, T.R.; Singh, B.; Majeau-Bettez, G.; Strømman, A.H. Comparative Environmental Life Cycle Assessment of Conventional and Electric Vehicles. J. Ind. Ecol. 2013, 17, 53–64. [Google Scholar] [CrossRef]
- International Energy Agency (IEA); United Nations Environment Programme (UNEP); International Transport Forum (ITF); International Council on Clean Transportation (ICCT); Davis, U.C.; FIA Foundation. Global Fuel Economy Initiative 2021; IEA Publications: Paris, France, 2021; Available online: https://www.iea.org/reports/global-fuel-economy-initiative-2021 (accessed on 18 February 2025).
- Jeswani, H.K.; Chilvers, A.; Azapagic, A. Life Cycle Assessment of Biofuels: A Review of Key Challenges and Future Prospects. Renew. Sustain. Energy Rev. 2020, 130, 109937. [Google Scholar] [CrossRef]


| Category | Component | System | |||
|---|---|---|---|---|---|
| S1 | S2 | S3 | S4 | ||
| Architecture | Photovoltaic (kW) | 20.0 | 20.0 | - | 20.0 |
| Diesel Generator (kW) | - | 48.0 | 48.0 | 48.0 | |
| Li Battery (kWh) | 264.0 | 412.8 | 196.8 | 432.0 | |
| Pico Hydro (kW) | 9.42 | 9.42 | 9.42 | - | |
| Invertor (kW) | 21.3 | 29.70 | 29.90 | 30.00 | |
| Cost | NPC (USD) | 362,687 | 749,288 | 3,400,000 | 8,720,000 |
| COE (USD) | 0.19 | 0.4 | 1.85 | 4.69 | |
| Operating Cost (USD/y) | 11,078 | 26,782 | 168,727 | 433,059 | |
| Initial Capital (USD) | 144,922 | 223,126 | 125,199 | 219,441 | |
| Renewable Fraction (%) | 100 | 98 | 75 | 25 | |
| System | Total Fuel (L/y) | - | 431 | 6251 | 18,808 |
| CO2, (kg/y) | - | 1128 | 16,364 | 49,238 | |
| Categorize | Component | System | |
|---|---|---|---|
| Proposed | Present | ||
| S1 | |||
| Architecture | Photovoltaic (kW) | 20.0 | |
| Diesel Generator (kW) | - | ||
| Li Battery (kWh) | 264.0 | ||
| Pico Hydro (kW) | 9.42 | ||
| Invertor (kW) | 21.3 | ||
| COST | NPC ($) | 362,687 | |
| COE ($) | 0.19 | ||
| Operating Cost ($/y) | 11,078 | ||
| Initial Capital ($) | 144,922 | ||
| Renewable Fraction (%) | 100 | ||
| Emission | Total Fuel (L/y) | - | 11,172 |
| CO2, (kg/y) | - | 29,247 | |
| CO (kg/y) | 183.0 | ||
| Unburned Hydrocarbon (kg/y) | 8.04 | ||
| Particulate Matter (kg/y) | 1.09 | ||
| SO2 (kg/y) | 71.60 | ||
| NO (kg/y) | 172.0 | ||
| Load Demand (%) | AC Primary Load (kWh/y) | Lithium Battery (kWh) | COE (USD) | Operating Cost (USD/y) | NPC (USD) |
|---|---|---|---|---|---|
| S1 | 92,919.00 | 264.00 | 0.19 | 11,078.00 | 362,687.00 |
| 1% | 93,723.00 | 288.00 | 0.21 | 11,784.00 | 385,173.00 |
| 2% | 94,617.00 | 312.00 | 0.22 | 12,596.00 | 411,296.00 |
| 3% | 95,466.00 | 340.80 | 0.24 | 13,521.00 | 440,898.00 |
| 4% | 96,336.00 | 379.20 | 0.25 | 14,786.00 | 481,434.00 |
| 5% | 97,282.00 | 436.80 | 0.28 | 16,665.00 | 541,589.00 |
| Replacement Cost per kWh (USD) | Total NPC (USD) | LCOE (USD/kWh) |
|---|---|---|
| 389 | 444,719.44 | 0.159 |
| 200 | 421,559.72 | 0.1506 |
| 100 | 409,328.61 | 0.146 |
| Battery Lifespan (Years) | Replacement Timing | Total NPC (USD ) | LCOE (USD/kWh) |
|---|---|---|---|
| 10 | Year 10 | 444,719.44 | 0.159 |
| 15 | Year 15 | 429,497.13 | 0.1534 |
| 20+ | None | 397,097.50 | 0.142 |
| Month | Hydro Generation (kWh) | PV Generation (kWh) | Total Generation (kWh) | Load (kWh) | Net Energy Flow (kWh) |
|---|---|---|---|---|---|
| January | 2962.752 | 3462.7 | 6425.452 | 7440 | −1014.548 |
| February | 2676.416 | 3127.6 | 5804 | 6720 | −916 |
| March | 2962.752 | 3462.7 | 6425.452 | 7440 | −1014.548 |
| April | 2867.76 | 3351 | 6218.76 | 7200 | −981.24 |
| May | 5922.224 | 1884.8 | 7807 | 7440 | 367 |
| June | 8586.48 | 1824 | 10,410 | 7200 | 3210 |
| July | 10,856.944 | 1884.8 | 12,741 | 7440 | 5301 |
| August | 11,836.448 | 1884.8 | 13,721 | 7440 | 6281 |
| September | 9555.2 | 1824 | 11,379 | 7200 | 4179 |
| October | 7895.952 | 1884.8 | 9780 | 7440 | 2340 |
| November | 4769.6 | 3351 | 8120 | 7200 | 920 |
| December | 2962.752 | 3462.7 | 6425.452 | 7440 | −1014.548 |
| Component | S1 (PV–Pico Hydro–Battery) | S5 (PV–Battery) | S6 (PV–Battery–Biomass) |
|---|---|---|---|
| PV (kW) | 20.0 | 20.0 | 20.0 |
| Pico Hydro (kW) | 9.2 | ||
| Biomass (kW) | 10.0 | ||
| Battery (kWh) | 264.0 | 600.0 | 264.0 |
| Inverter (kW) | 21.3 | 25.0 | 22.0 |
| NPC ($) | 362,687.0 | 550,000.0 | 420,000.0 |
| COE ($/kWh) | 0.19 | 0.29 | 0.22 |
| Renewable Fraction (%) | 100.0 | 100.0 | 100.0 |
| CO2 Emissions (kg/y) | |||
| Operating Cost ($/y) | 11,078.0 | 15,000.0 | 13,500.0 |
| Initial Capital ($) | 144,922.0 | 262,770.0 | 169,698.0 |
| Policy Aspect | Alignment with Proposed System | Potential Challenges |
|---|---|---|
| AEDP 2018–2037 Targets | Supports solar and hydro expansion, 30% renewable goal | Ensuring capacity targets are met in rural contexts |
| Energy for All Plan | Community focus aligns, though energy sources differ | Regulatory focus on biomass/biogas, not solar/hydro |
| Grid Connection Standards | Likely compliant via EGAT involvement | Technical standards for microgrids may need updates |
| Environmental Regulations | Reduces emissions, aligns with net-zero goals | Permits for pico hydro, battery safety compliance |
| Incentives and Subsidies | Potential eligibility for FiT, rural subsidies | Navigating complex application processes |
| Benefits of a Longer Timeframe | Limitations and Challenges | Potential Insights |
|---|---|---|
| Long-Term Component Dynamics: A 25-year simulation would capture two replacement cycles for batteries, pico hydro, and inverters (at 10 and 20 years), revealing cumulative replacement costs (e.g., USD 205,392 for batteries alone in S1) and potential degradation beyond 10 years (e.g., PV output dropping 12.5–25% by year 25). This could refine NPC estimates, especially if component costs decline (e.g., IRENA predicts battery costs falling to USD 100/kWh by 2030). | Increased Uncertainty: Beyond 10 years, assumptions about discount rates (5%), inflation (3%), and resource availability (e.g., constant hydro flow, Section 2.2.2) become less reliable. Economic variables (e.g., fuel prices for S2–S4) and technological advancements (e.g., cheaper batteries) introduce variability that HOMER Pro’s static inputs struggle to model accurately without sensitivity analyses. | Extending to 25 years could reveal: Break-Even Points: If PV degradation or battery replacements accelerate costs, S1’s NPC might rise (e.g., to USD 400,000–USD 450,000), shifting COE closer to USD| 0.22/kWh, still competitive with the present system (USD 0.6–USD 0.8/kWh). |
| Economic Viability Under Growth: Section 4.5 validated a 1–5% demand growth (up to 97,282 kWh/y), but a 25-year simulation could model higher growth (e.g., 10–15% by 2050) due to economic development (2–5% annually), testing S1’s scalability beyond the current surplus (10,364 kWh/y). This would inform modular upgrades (e.g., additional 20 kW PV by year 15). | Computational Burden: Simulating 25 years increases runtime significantly (219,000 vs. 87,600 time steps), potentially limiting the number of configurations evaluated (1661) or requiring simplified assumptions, reducing granularity in optimization. | Sustainability Trade-Offs: Lower hydro flows or higher demand might necessitate diesel use (as in S2), compromising the 100% renewable claim after 15–20 years. |
| Environmental Resilience: Extended simulations could incorporate climate scenarios (e.g., a 20% hydro flow reduction by 2050 [4]), assessing S1’s zero-emission claim against long-term resource shifts. This aligns with Thailand’s Long-Term Low Greenhouse Gas Emission Development Strategy (LT-LEDS) to 2050. | Diminishing Returns: Discounting reduces the impact of costs beyond 10 years (e.g., the year 25 O&M of USD 11,078 is USD 3326 in present value), suggesting marginal gains in NPC accuracy. For S1, with no fuel costs and stable O&M (USD 11,078/y), the 10-year trend likely extrapolates reliably to 25 years. | Investment Planning: Identifying optimal upgrade timing (e.g., year 15 for 10 kW PV) could lower long-term NPC compared to reactive scaling (Section 4.4). |
| Policy Alignment: A 25-year horizon matches the AEDP 2018 (to 2037) and NEP 2023 (to 2040s) timelines, providing a full lifecycle perspective for policymakers evaluating rural microgrid investments. |
| Category | Component/Metric | Proposed (S1) | Present | Koh Samui, Thailand [60] | Balarbhita, India [35] | Southern Philippines [40] |
|---|---|---|---|---|---|---|
| Architecture | Photovoltaic (kW) | 20.0 | - | 10,000 | 118.0 | 25.0 |
| Diesel Generator (kW) | Variable | Variable | - | 13.0 | ||
| Li Battery (kWh) | 264.0 | - | Variable | 100.0 | ||
| Pico Hydro/Small Hydro (kW) | 9.42 | 50.0 | - | 11.0 | Not specified | |
| Inverter (kW) | 21.3 | - | Variable | 33.6 | Not specified | |
| Cost | NPC (USD) | 362,687 | - | 438,000,000 | 251,597 | Not specified |
| COE (USD/kWh) | 0.19 | 0.6–0.8 | 0.2 | 0.0953 | 0.1795 | |
| Operating Cost (USD/y) | 11,078 | Not specified | Not specified | Not specified | ||
| Initial Capital (USD) | 144,922 | Not specified | 149,724 | Not specified | ||
| Renewable Fraction | Renewable Fraction (%) | 100 | 61.4 | 89.4 | 100 | <100% |
| Emission | Total Fuel (L/y) | - | 11,172 | Variable | Not specified | Not specified |
| CO2 (kg/y) | - | 29,247 | 6339 | Not specified | Not specified | |
| SO2 (kg/y) | - | 71.6 | Not specified | Not specified | Not specified | |
| NOx (kg/y) | - | 172.0 | Not specified | Not specified | Not specified |
| Risk | Description | Mitigation Strategy |
|---|---|---|
| Technical Risks and Mitigations | ||
| Resource Variability | Fluctuations in solar irradiation and hydro flow rates affect power generation, especially seasonally (e.g., rainy vs. dry seasons). | Implement a hybrid system with PV, pico hydro, and battery storage to balance generation and load, ensuring stability. |
| Unmet Load | Small peaks in unmet load during rainy months due to reduced renewable generation efficiency. | Optimize system sizing using HOMER Pro, accepting a 5% annual capacity shortfall to manage fluctuations effectively. |
| Maintenance and Reliability | Current hydro system faces maintenance challenges; new components (batteries, inverters) require reliable upkeep. | Transition to a smaller, more manageable 9.42 kW pico hydro system, establish regular maintenance schedules, and provide training for local operators. |
| System Integration | Ensuring all components (PV, hydro, batteries, inverters) work seamlessly together without compatibility issues. | Conduct thorough system design, testing, and validation before full implementation to confirm compatibility and performance. |
| Grid Stability | Maintaining stable voltage and frequency to prevent power quality issues, especially with variable renewable inputs. | Use appropriate control systems and inverters with grid-forming capabilities to ensure stability and power quality. |
| Financial Risks and Mitigations | ||
| High Initial Capital Costs | The proposed system has an NPC of USD 362,687, with an initial cost of USD 360,000, posing a financial burden for implementation. | Secure funding from the Electricity Generating Authority of Thailand (EGAT) and involve community participation to reduce the financial burden. |
| Operating and Maintenance Costs | Ongoing costs for maintenance, especially battery replacements over the 25-year project lifespan, could strain budgets. | Incorporate lifecycle costing in planning, consider extended warranties for components, and allocate budgets for planned maintenance to manage expenses. |
| Economic Fluctuations | Inflation (3%), discount rates (5%), and potential currency fluctuations (if importing components) could increase costs. | Conduct sensitivity analysis to understand the impact of varying rates, plan contingencies, and consider purchasing components in local currency to mitigate currency risks. |
| Operational Risks and Mitigations | ||
| Load Demand Changes | Future increases in load demand (e.g., the 5% increase analyzed in the paper) may require system upgrades, risking overload. | Conduct scenario analysis for load increases, design the system with scalability in mind, and plan for potential expansions. |
| Natural Disasters | Floods, storms, and other natural events in Khlong Ruea could damage infrastructure, disrupting operations. | Design the system with robust construction, select appropriate site locations away from flood-prone areas, and develop disaster recovery plans. |
| Regulatory Changes | Changes in energy policies or regulations could affect operations, such as new permitting requirements or tariffs. | Stay informed about regulatory developments, maintain flexibility to adapt to new requirements, and engage with policymakers for support. |
| Community Engagement | Ensuring ongoing community support is crucial; lack of acceptance could hinder operations or maintenance. | Continue stakeholder engagement, involve the community in decision-making (as per participatory action research in the paper), and maintain open communication. |
| Training and Skill Development | Local operators need adequate training to manage the system effectively, especially for new technologies like batteries and inverters. | Implement comprehensive training programs, ensure knowledge transfer, and build local capacity for long-term sustainability. |
| Stakeholder | Role | Contribution |
|---|---|---|
| Researcher | Defines system based on local conditions | System design and adaptation to environment |
| Electrical Generating Authority of Thailand (EGAT) | Provides budget support | Financial support, resource data (geometric, billing) |
| Khlong Ruea Community | Beneficiary, data provider | Insights, perspectives, data (usage patterns, local knowledge) |
Disclaimer/Publisher’s Note: The statements, opinions and data contained in all publications are solely those of the individual author(s) and contributor(s) and not of MDPI and/or the editor(s). MDPI and/or the editor(s) disclaim responsibility for any injury to people or property resulting from any ideas, methods, instructions or products referred to in the content. |
© 2025 by the authors. Licensee MDPI, Basel, Switzerland. This article is an open access article distributed under the terms and conditions of the Creative Commons Attribution (CC BY) license (https://creativecommons.org/licenses/by/4.0/).
Share and Cite
Ngao-det, M.; Thongpron, J.; Namin, A.; Patcharaprakiti, N.; Muangjai, W.; Somsak, T. Systematic Optimize and Cost-Effective Design of a 100% Renewable Microgrid Hybrid System for Sustainable Rural Electrification in Khlong Ruea, Thailand. Energies 2025, 18, 1628. https://doi.org/10.3390/en18071628
Ngao-det M, Thongpron J, Namin A, Patcharaprakiti N, Muangjai W, Somsak T. Systematic Optimize and Cost-Effective Design of a 100% Renewable Microgrid Hybrid System for Sustainable Rural Electrification in Khlong Ruea, Thailand. Energies. 2025; 18(7):1628. https://doi.org/10.3390/en18071628
Chicago/Turabian StyleNgao-det, Montri, Jutturit Thongpron, Anon Namin, Nopporn Patcharaprakiti, Worrajak Muangjai, and Teerasak Somsak. 2025. "Systematic Optimize and Cost-Effective Design of a 100% Renewable Microgrid Hybrid System for Sustainable Rural Electrification in Khlong Ruea, Thailand" Energies 18, no. 7: 1628. https://doi.org/10.3390/en18071628
APA StyleNgao-det, M., Thongpron, J., Namin, A., Patcharaprakiti, N., Muangjai, W., & Somsak, T. (2025). Systematic Optimize and Cost-Effective Design of a 100% Renewable Microgrid Hybrid System for Sustainable Rural Electrification in Khlong Ruea, Thailand. Energies, 18(7), 1628. https://doi.org/10.3390/en18071628