Article

Numerical Investigations on the Effects of Inertia on the Startup Dynamics of a Multibladed Savonius Wind Turbine

1
School of Computing, Engineering and Technology, Robert Gordon University, Aberdeen AB10 7GJ, UK
2
Department of Mechanical Engineering, Glasgow Caledonian University, Glasgow G4 0BA, UK
3
Faculty of Science and Technology, Norwegian University of Life Sciences, 1430 Ås, Norway
*
Author to whom correspondence should be addressed.
Energies 2025, 18(7), 1638; https://doi.org/10.3390/en18071638
Submission received: 4 March 2025 / Revised: 19 March 2025 / Accepted: 23 March 2025 / Published: 25 March 2025
(This article belongs to the Section A3: Wind, Wave and Tidal Energy)

Abstract

:
The startup dynamics of wind turbines have a direct impact on their cut-in speed and thus their capacity factor, considering highly transient winds in urban environments. Due to the complex nature of the startup dynamics, the published research on it is severely lacking. Unless the startup dynamics and cut-in speed of a wind turbine are known, it is difficult to evaluate its capacity factor and levelized cost of energy (LCoE) for commercial viability. In this study, a Savonius vertical-axis wind turbine (VAWT) has been considered and its startup dynamics evaluated using numerical techniques. Moreover, the effects of turbine inertia, arising from bearing frictional losses, generator load, etc., on the startup dynamics have been studied. Advanced computational fluid dynamics (CFD)-based solvers have been utilized for this purpose. The flow-induced rotation of the turbine blades has been modeled using a six degree of freedom (6DoF) approach. Turbine inertia has been modeled using the mass moment of inertia of the turbine rotor and systematically increased to mimic the additional inertia and losses due to bearings and the generator. The results indicate that inertia has a significant impact on the startup dynamics of the VAWT. It was observed that as the turbine inertia increased, it took longer for the turbine to reach its steady or peak operational speed. Increasing the inertia by 10%, 20% and 30% increased the time taken by the turbine to reach its peak rotational speed by 13.3%, 16.7% and 23.2%, respectively. An interesting observation from the results obtained is that an increase in turbine inertia does not change the peak rotational speed. For the Savonius rotor considered, the peak rotational speed remained 122 rpm, and its tip speed ratio (TSR) remained 0.6 while increasing the turbine inertia.

1. Introduction

The startup dynamics of wind turbines are dictated by their inertia. There are several components of a wind turbine which contribute toward the total inertia of the turbine. The mass of the turbine is indeed the biggest contributor to its inertia. Among the other components which also contribute to this are shaft bearings, where the frictional losses generate inertia. Similarly, generator load is another contributing factor, while shaft misalignment, over long-time usage, also generates turbine inertia. For a realistic estimation of a wind turbine’s startup performance, it is essential to have a good understanding of how the frictional losses affect the startup dynamics of the turbine. This becomes even more imperative for small-scale vertical-axis wind turbines as they normally operate in urban environments, where the winds are generally highly turbulent in nature [1]. It is therefore important to evaluate the effects of turbine inertia on the startup dynamics of vertical-axis wind turbines.
There are only a few published studies on the startup dynamics of vertical-axis wind turbines (VAWTs), while the effect of inertia is seldom reported. Thus, one has to rely on new experiments or computational fluid dynamics (CFD)-based studies to have a thorough understanding and conduct extensive analyses on a VAWT’s startup dynamics. There are two potential reasons for the rather few studies on the startup dynamics of VAWTs. Firstly, there are many different types of VAWTs which exist, and carrying out a detailed investigation of every design is not possible. VAWTs are categorized into lift-based (Darrieus) [2] and drag-based (Savonius) [3] turbines, and then there are further variants of each. While Darrieus VAWTs use different NACA profile blades, Savonius VAWT blades are more commonly cup-shaped. There are more studies published on the startup dynamics of Darrieus VAWTs [4,5,6,7,8,9,10,11,12] compared with Savonius VAWTs. Secondly, the startup of a turbine is assumed to be known (i.e., the cut-in speed of the turbines is known). This is true for big horizontal-axis wind turbines (HAWTs) and, to some extent, for Darrieus VAWTs as well but not for Savonius VAWTs. As VAWTs are more suitable for micro power generation in urban environments, where the winds are expected to be more transient, it becomes important to analyze the startup dynamics of these turbines at lower wind speeds.
Savonius VAWTs’ startup dynamics are different from those of Darrieus VAWTs. In the case of Savonius VAWTs, the turbine experiences only one stage of acceleration (initial acceleration), which is followed by the plateau region (i.e., steady operation of the turbine). The details of Darrieus VAWTs’ startup dynamics are provided by Asim et al. [13]. Mu et al. [14] numerically investigated the startup dynamics and steady performance of a spiral blade design Savonius rotor, where the blades were twisted by 70°. The steady performance of this turbine was compared against the experimental data from wind tunnel tests and also the steady performance of a conventional Savonius rotor. The startup dynamics of the twisted blade design turbine were analyzed only numerically. While limiting the discussion to only the startup dynamics here, the numerical results obtained show that as the wind speed increases, the steady operation rotor speed also increases, as expected and reported by numerous other researchers as well. The study mentions that a conventional Savonius turbine failed to self-start between azimuthal angles of 120° and 170°, but this observation was based on the numerical torque coefficient rather than actual startup simulation(s). Please note that this is the only study we could find on the startup dynamics of Savonius VAWTs apart from the ones which the authors of this study have published, which will be discussed later in this section.
Kang et al. [15] investigated the startup dynamics of Savonius hydrokinetic turbines both experimentally and numerically. The turbines considered for investigation included a single-stage turbine and a two-stage turbine, where the second-stage rotor resembled the single-stage rotor and was put on top of the single-stage rotor while at the same time rotated by 90°. This was designed to minimize the impact of negative torque generated by the retreating blade, enhance the torque output and help the turbine to self-start, which was achieved and reported. From a startup dynamics point of view, the effect of turbine inertia was considered and reported as external loading on the turbine. The considered values of external loading were 0, 0.5, 1 and 1.5, where value of 0 represents that no external load is acting on the turbine and thus torque extraction from the turbine is zero. It has been reported that as the external load increases, the peak angular velocity of the turbine decreases. An interesting reported observation is that as the external load on the turbine increases, the turbine reaches steady operation faster (i.e., it takes less time to reach the peak or operational angular velocity). These observations are contrary to the findings of the present study, where we will discuss that increasing the turbine inertia delays the startup while having no impact on the steady operational speed of the turbine. However, one must note here that the inertia increase considered in the present study is not as drastic as that considered by Kang et al. [15]. Tigabu et al. [16] also numerically investigated the effects of inertia on the startup dynamics of a hydrokinetic turbine, but they used a Darrieus rotor. Their findings indicate that increasing the turbine inertia delays the startup while the peak angular speed of the turbine remains constant, which is in line with the findings of the present study.
There are some other studies that have reported the startup dynamics of Savonius hydrokinetic [17,18] turbines which we are not going to discuss here, as the focus of this study is on wind turbines only. Ushiyama [19] carried out experimental investigations on the startup dynamics and steady performance of several Savonius VAWT configurations. These investigations studied the effects of the rotor aspect ratio, overlap and gap between the blades, blade cross-section, number of blades, presence of end plates and stack of blades (multi-stage). It has been reported that as the blades’ aspect ratio increases, the peak angular velocity increases, while the startup takes less time. With increasing overlap between the blades, the peak angular speed increases, but the startup is delayed. With an increasing number of blades, the peak angular speed decreases, while there is no impact on the startup. These are all interesting findings, as this study is probably the first one which investigated the startup of a Savonius VAWT. Asim et al. numerically [20] and experimentally [21] investigated the startup dynamics of Savonius VAWTs, but instead of a conventional S-rotor, their VAWT comprised 12 rotor blades spread out in a circular pattern, but the effect of turbine inertia was not directly investigated. The numerical investigation of the effect of stator blades (guide vanes) on the startup of the turbine [20] showed that an aerodynamically designed stator can significantly increase the peak angular speed of the turbine, but it takes longer for the turbine to reach its peak rotational speed. Their experimental study [21] on the VAWT with a stator confirmed the numerical findings in [20] (i.e., the peak angular speed attained by the turbine was about 80 rpm, while the startup took about 30 s to complete).
From the above presented literature review focusing on the startup dynamics of Savonius rotors, it is clear that the effect of inertia on Savonius wind turbines has not yet been reported, and thus this is the main aim of the present study. It is important to investigate the effects of inertia contributions from the bearings, generator and shaft misalignment leading to frictional losses, as this has an impact on the cut-in speed of the turbine, especially in the context of urban environments.

2. Materials and Methods

This section provides details on the methodology used to conduct the investigations, along with the material properties used.

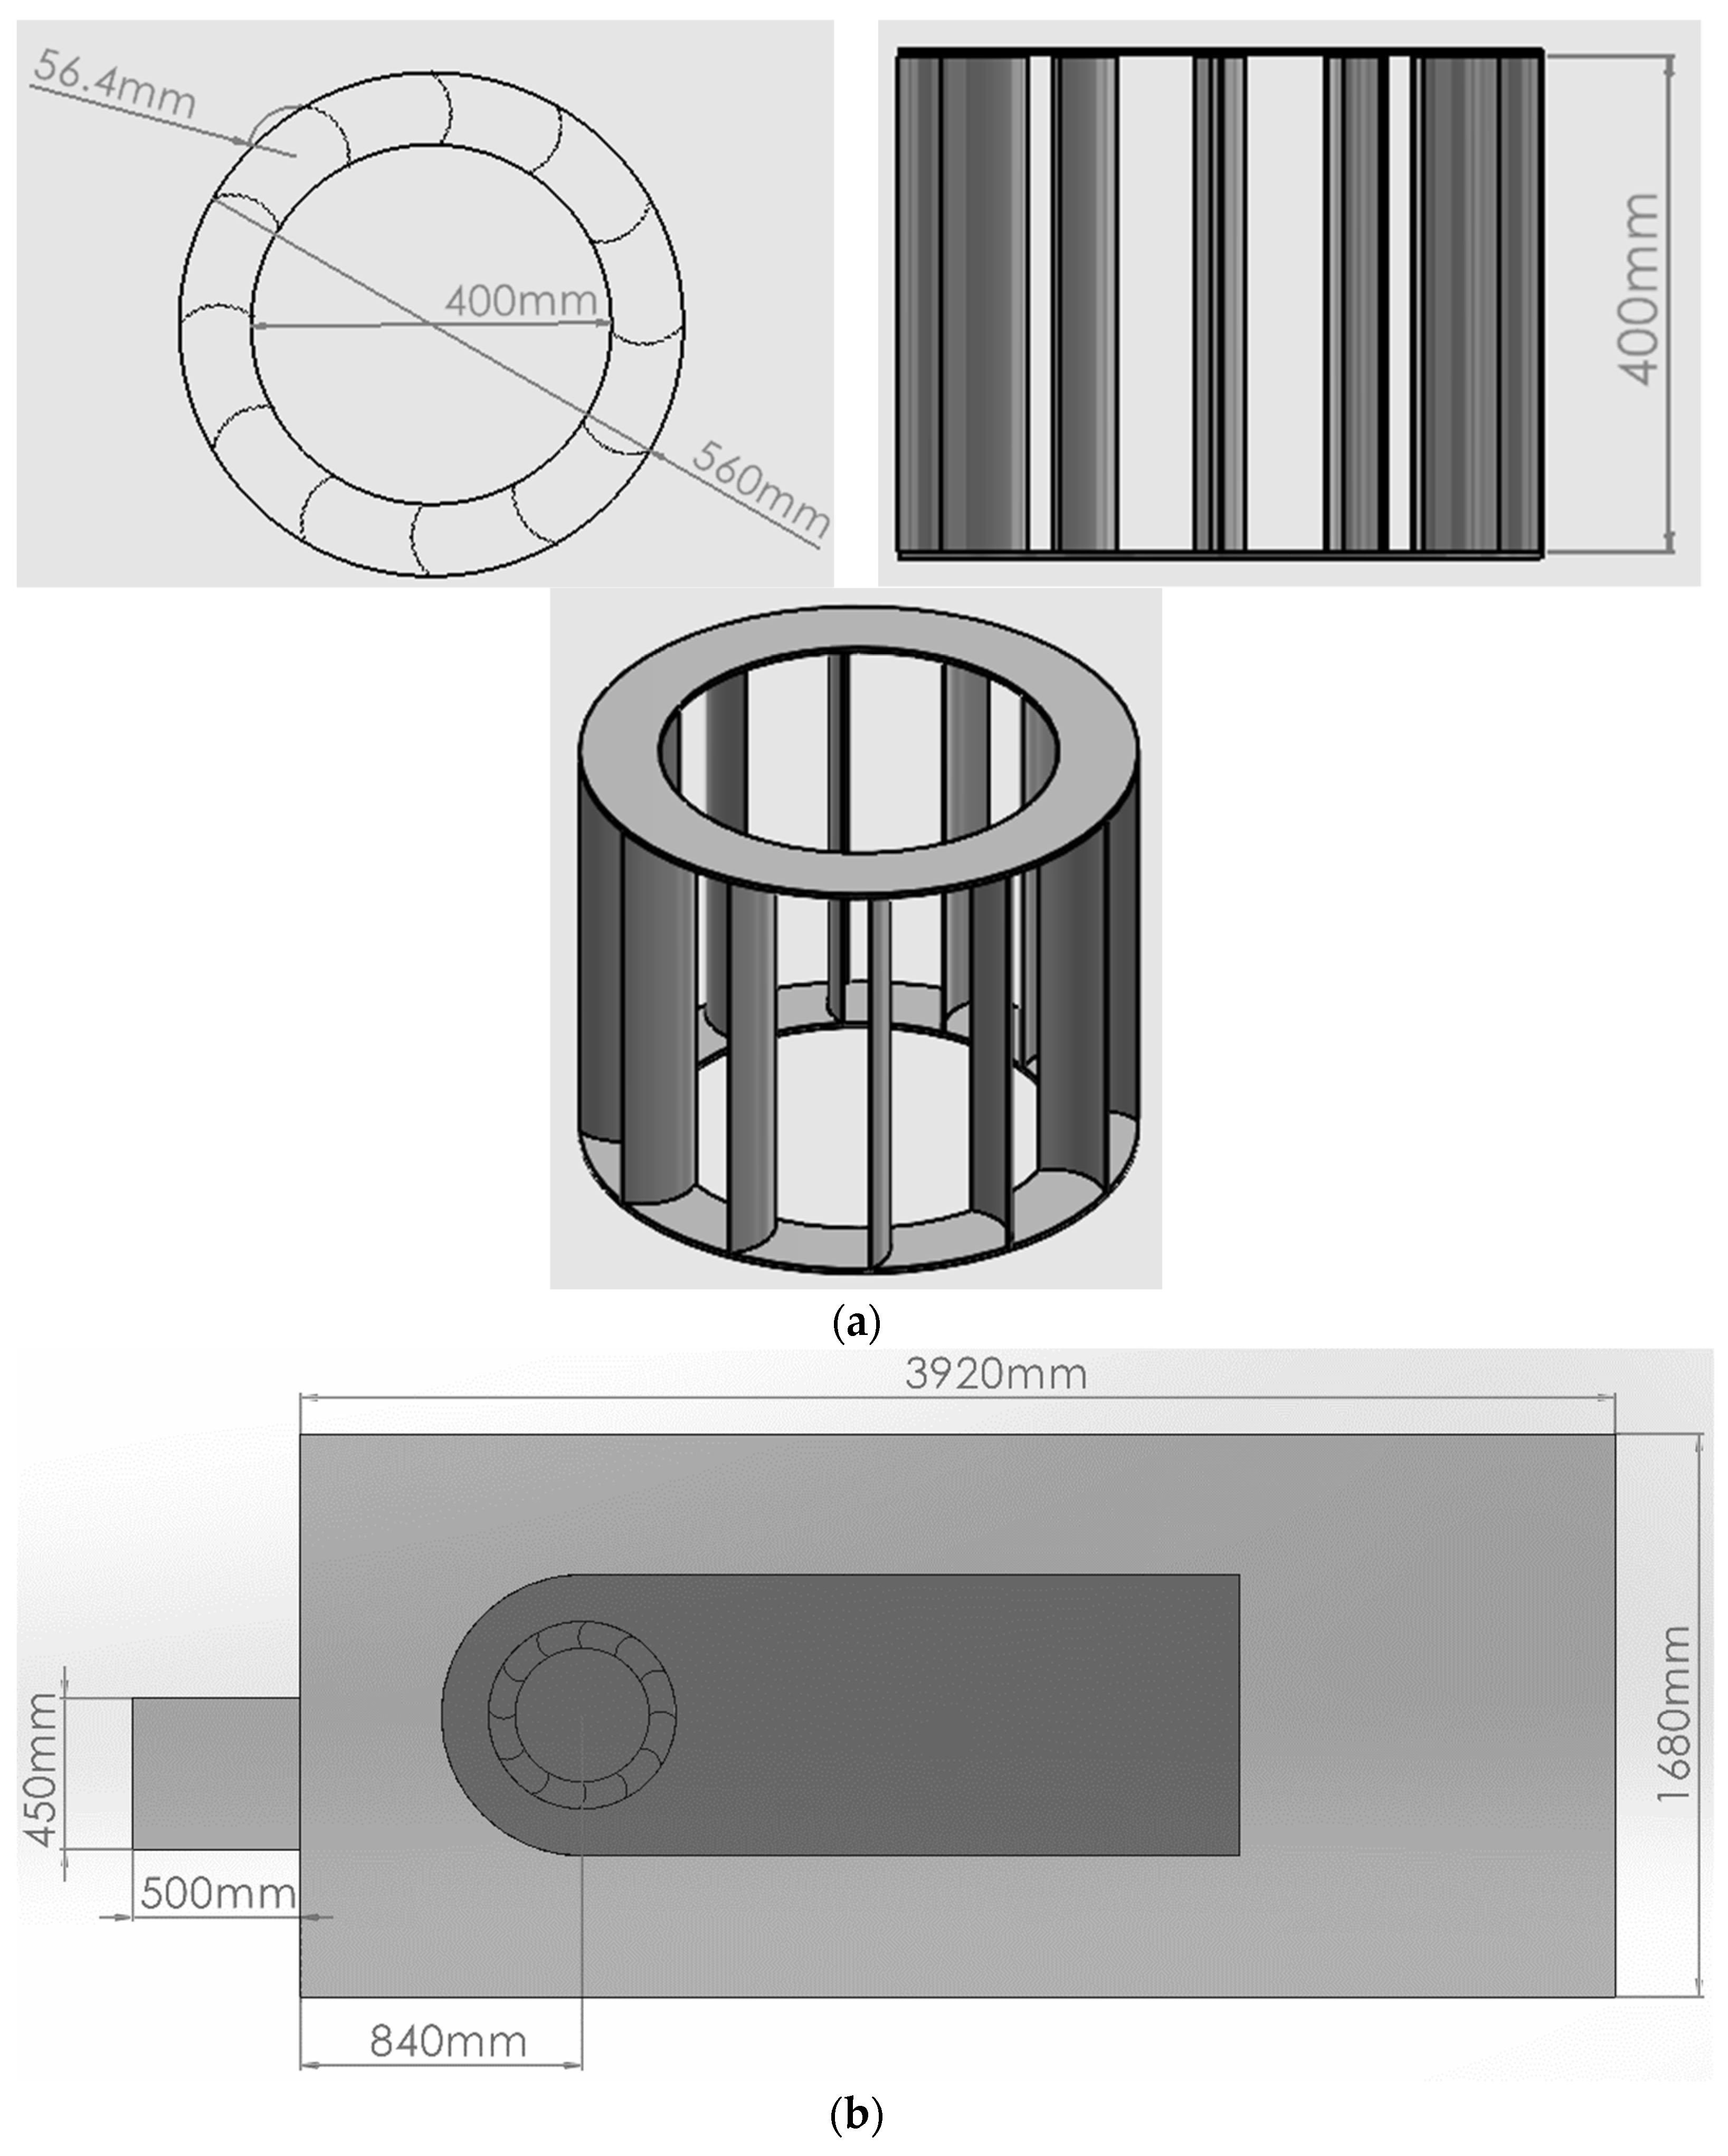
2.1. Geometry of the Multibladed Savonius Wind Turbine

A 12-bladed Savonios wind turbine was considered for a variety of reasons, like its simple and thus cheap design, its aerodynamic characteristics, especially in the context of urban winds, and easy installation and maintenance. The authors have studied this turbine’s performance and startup in a number of previous studies [22,23]. This study focuses on the effect of inertia originating from the different fixtures and generator load, which has not been reported in the literature for Savonius rotors.
The computer-aided design (CAD) model of the considered Savonius rotor is shown in Figure 1a. It can be seen that the rotor consisted of 12 blades, each with a thickness of 1.6 mm. Each blade was a cut section from a hollow cylinder with a diameter of 112.8 mm made from a cold-rolled aluminum sheet. The blades were evenly positioned from each other at an angle of 30°. The blades were fixed in place by adding end plates. The inner diameter of the rotor was 400 mm, while its outer diameter was 560 mm. The height of the turbine was 400 mm, resulting in the turbine’s aspect ratio being 0.714. Figure 1b depicts the flow domain in which the turbine was placed. The duct-shaped inlet was based on the wind tunnel available, having a cross-section of 450 mm × 450 mm. The turbine center was placed about 840 mm from the exit of the wind tunnel. The dimensions in the Y direction were such that there was a gap with a one-turbine diameter on either side of the turbine, while the gap downstream of the turbine was five turbine diameters.

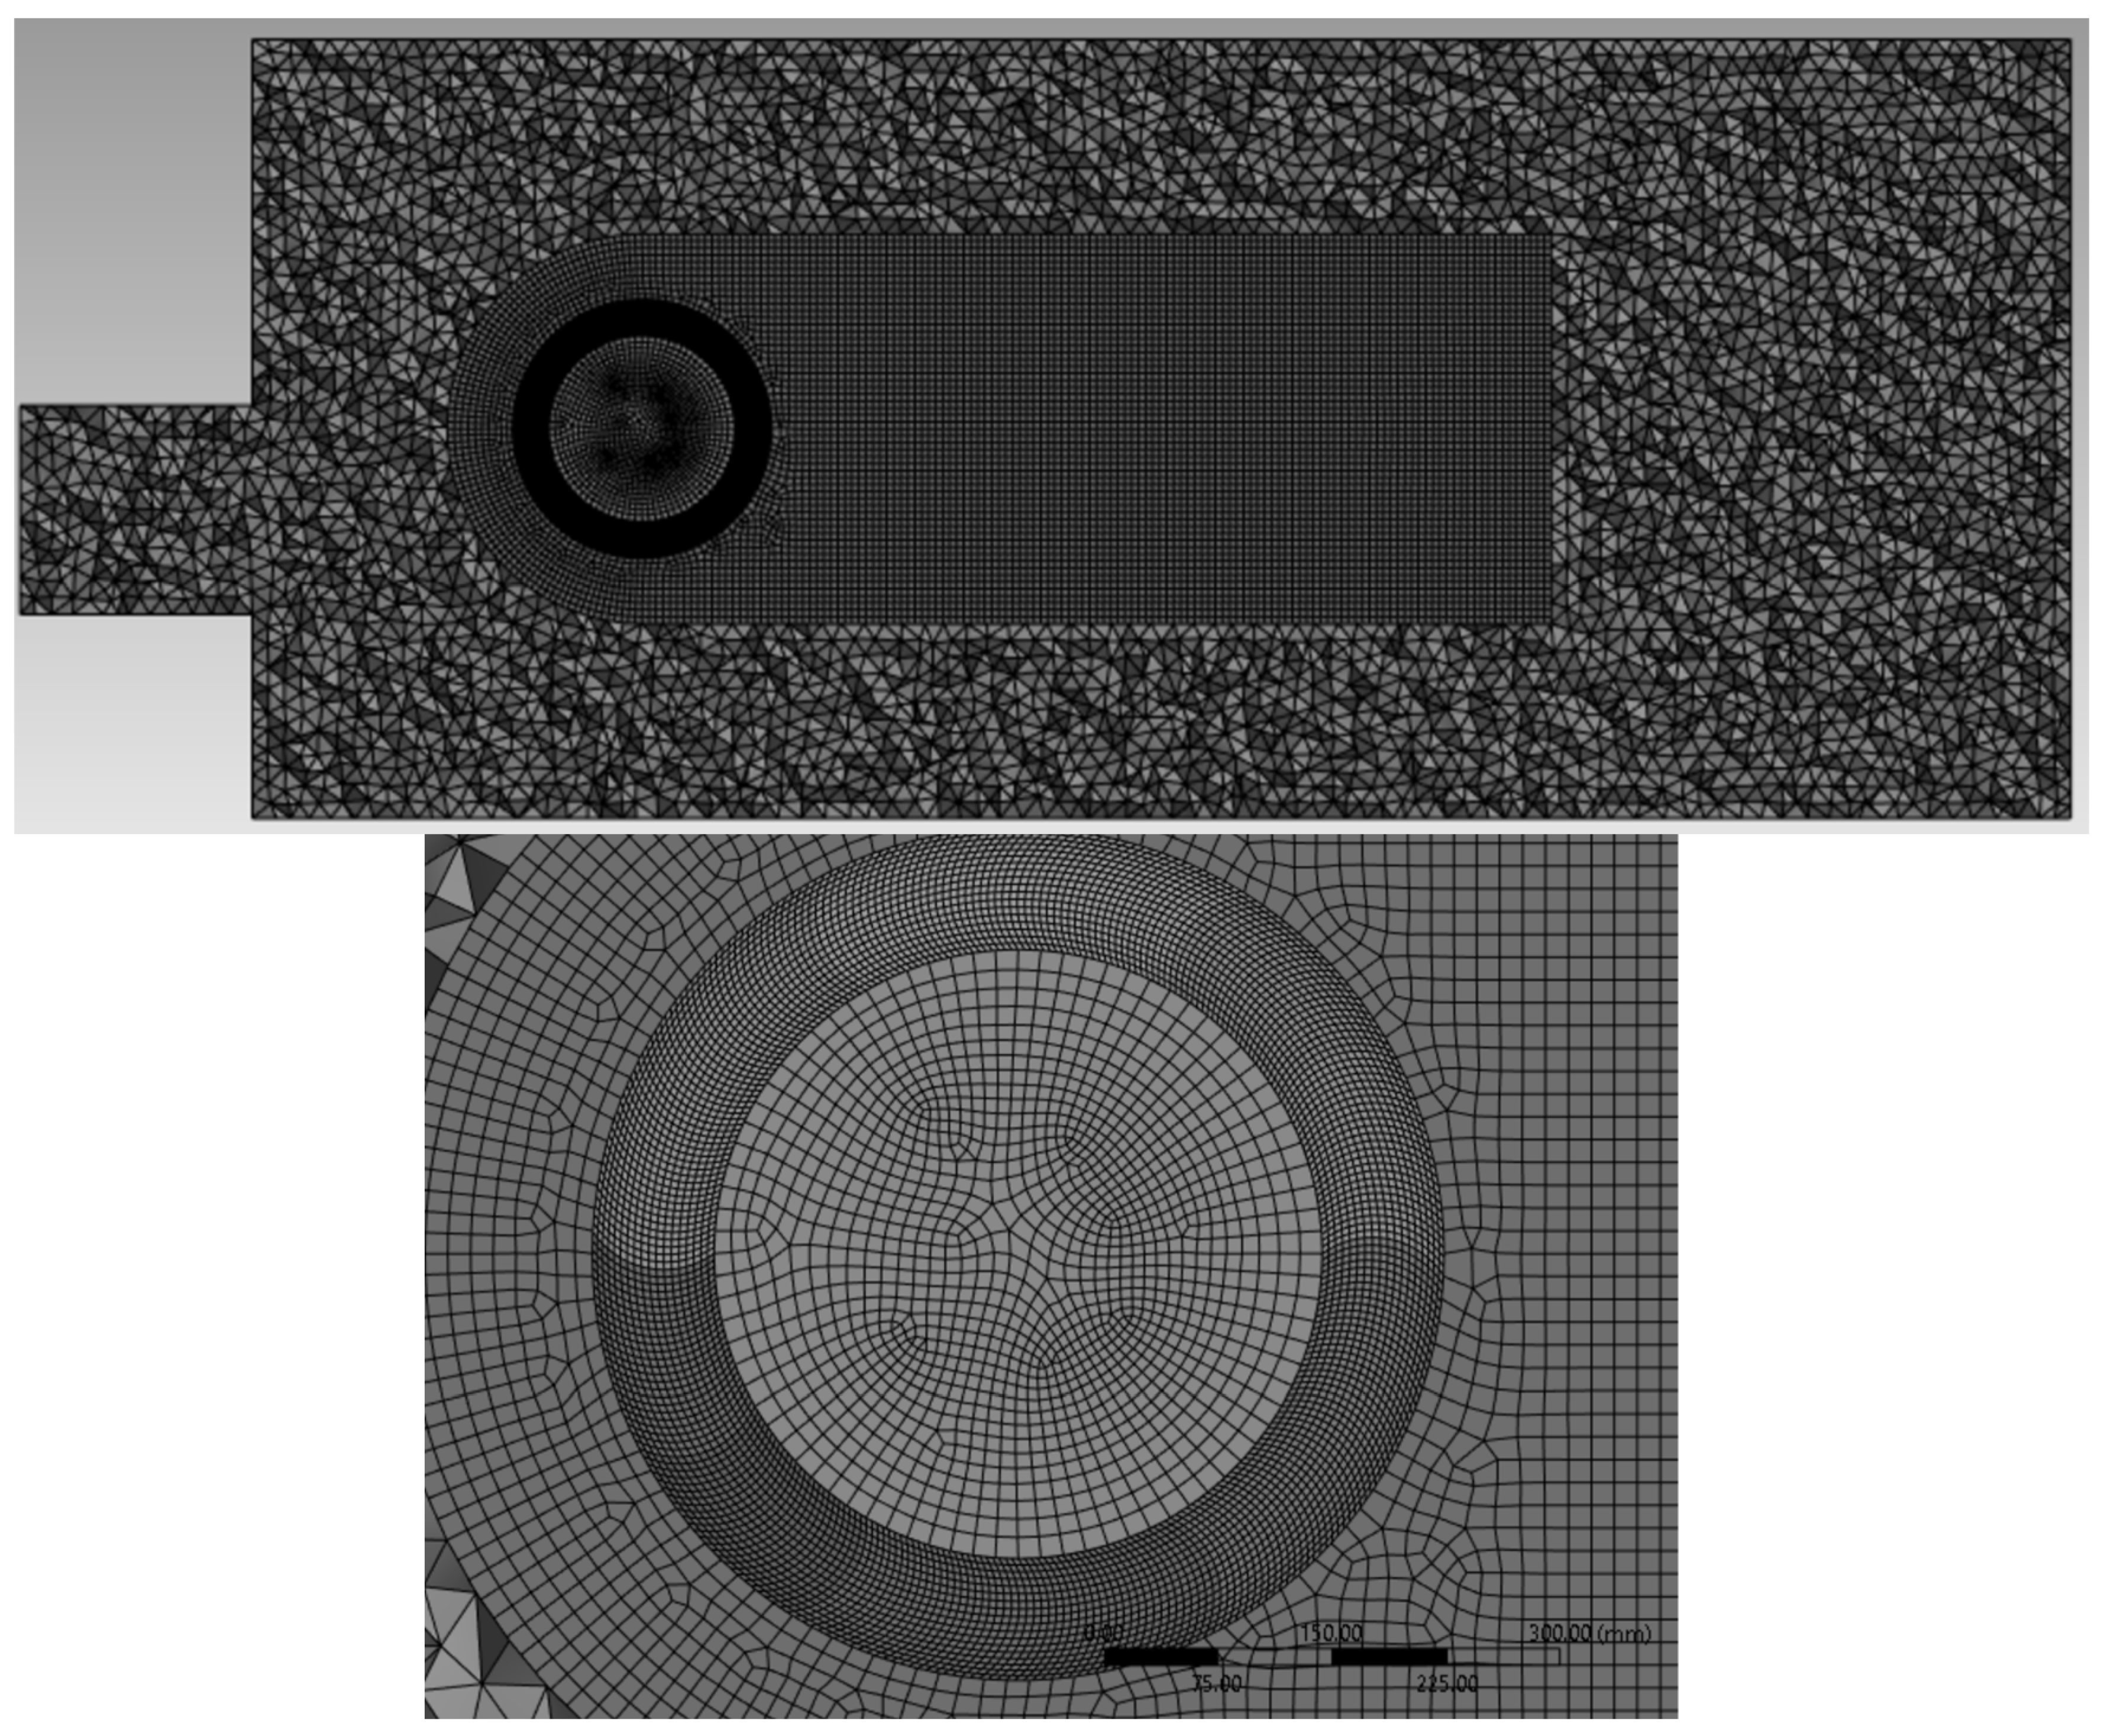
2.2. Meshing of the Flow Domain

The meshing of this flow domain has been reported several times previously [20,23], based on mesh independence test results. In summary, the flow domain was divided into three sections (i.e., the turbine region, the inner domain and the outer domain). The inner domain’s dimensions were such that there were three turbine diameters downstream of the turbine while the frontal hemispherical section was 1.5 times the turbine diameter. The specified element sizes were 5 mm for the turbine region, 15 mm for the inner domain and 45 mm for the outer domain. This way, the elements increased in size by three times when moving outward from the turbine. The resulting mesh is shown in Figure 2.
For the turbulence model employed in the present study, which is discussed in the next section, a y+ range of 30–100 is recommended for the wind turbine blade surface when using standard wall functions. Figure 3 depicts the local variations in the wall y+ on blades’ surfaces, and it can be clearly seen that the wall y+ did not exceed 53, which is well within the acceptable range. Thus, the mesh described above is suitable for conducting further analyses in this study.

2.3. Boundary Conditions and Turbulence Modeling

The boundary conditions used for the numerical solver are summarized in Table 1. A wind speed of 6 m/s was considered in the present study, specifically at the inlet boundary of the flow domain. The outlet boundary downstream of the turbine was modeled as a pressure outlet with atmospheric conditions. The four sides of the flow domain were modelled as symmetry to mimic zero-shear slip walls in the viscous flow of air inside domain. The turbine blades were modeled as no-slip walls, while their rotation is addressed in the next section.
The air flow turbulence was modeled using a Reynolds-averaged Navier–Stokes (RANS)-based shear stress transport (SST) k-ω model due to its superiority in modeling near-wall flows and its ability to switch to a standard k-ε model away from the wall [24]. The equations for the turbulent kinetic energy (k) and turbulence dissipation rate (ω) are
k t + U j k x j = P k β k ω + x j [ ( ϑ + σ k ϑ T ) k x j ]
ω t + U j ω x j = α S 2 β ω 2 + x j [ ( ϑ + σ w ϑ T ) ω x j ] + 2 ( 1 F 1 ) σ ω 2 1 ω k x i ω x i

2.4. Modeling the Rotation of the Turbine

For modeling the flow-induced rotation of the turbine rotor, a six degree of freedom (6DoF) solver was used in the present study [25]. The aerodynamic forces and moments applied by the wind on the rotor were computed numerically and then used to determine the resulting angular rotation to the rotor, based on Newton’s second law, as follows:
T   =   I α
where T represents the turbine torque, I is the turbine’s mass moment of inertia and α is the turbine’s angular acceleration. Based on the CAD model of the turbine shown in Figure 1a and the geometrical details provided earlier, the mass moment of inertia of the turbine was calculated to be 0.82 kg·m2. The angular velocity (ω) of the rotor kept increasing (α > 0) until the average T→0. Once T was computed at a particular time stamp (t), the angular position of the rotor (θ) was updated according to the following formula [26,27]:
θ i + 1 = 2 θ i θ i 1 + T I   Δ t 2
For analyzing the effects of inertia on the wind turbine’s startup, the mass moment of inertia of the turbine was increased by 10%, 20% and 30%. The wind turbine generator power is given by
P generator = P turbine × η mechanical × η generator
The mechanical efficiency is based on the frictional losses between the bearings and the shaft. The typical value for mechanical efficiency is 90% [28]. The generator efficiency is based on the type of generator. For micro power turbines like the one studied in the current study, permanent magnet generators and brushless DC generators are the most logical choice. Both of these generators have efficiencies of about 85–90% [29]. Thus, the mechanical losses and the generator losses combined are not more than 25–30%. Thus, additional inertia values of 10%, 20% and 30% were specified for the turbine in the present study. The mass moment of inertia values corresponding to these additional inertia values are 0.902 kg·m2, 0.984 kg·m2 and 1.006 kg·m2, respectively.

3. Results and Discussion

Numerical investigations on the startup dynamics of a multibladed Savonius rotor are carried in the following sections using ANSYS FLUENT 2024 R1. The effects of the turbine inertia are analyzed in detail, and comprehensive comparisons are made against the baseline case of 100% inertia (no frictional losses). The parameters utilized to study the startup dynamics of the turbine are the angular position of the rotor (θ) in degrees, angular velocity (ω) in rpm and the tip speed ratio (λ).

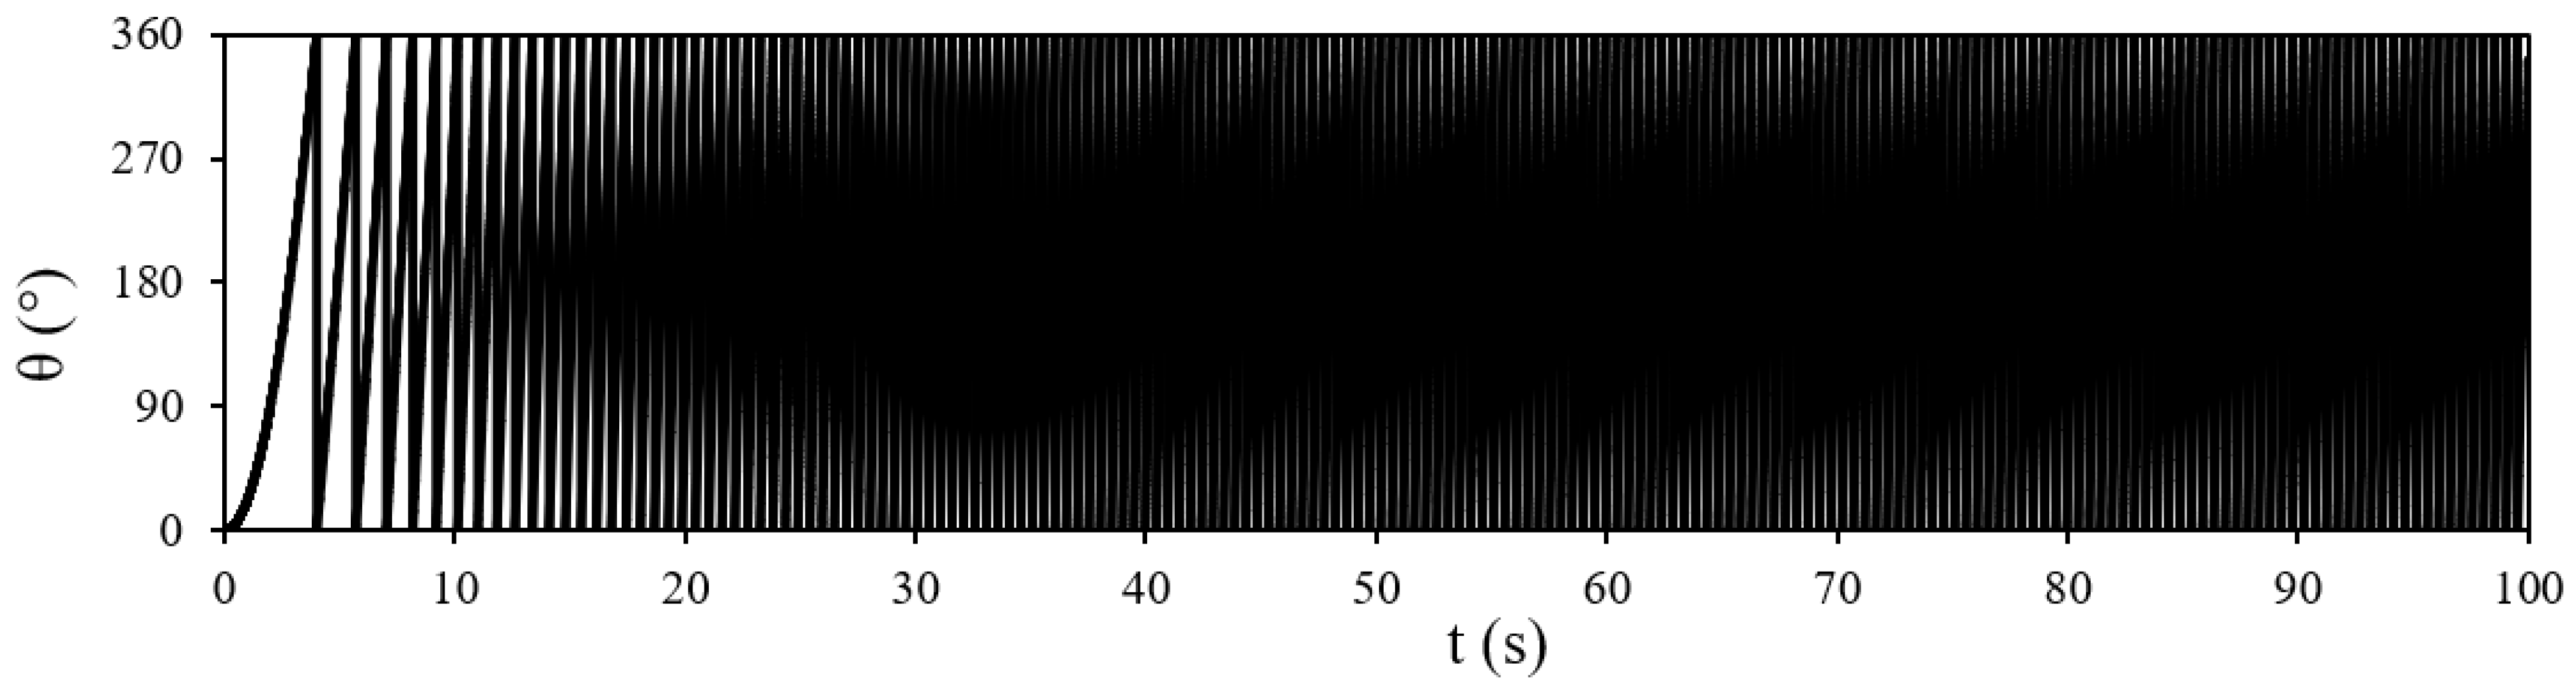
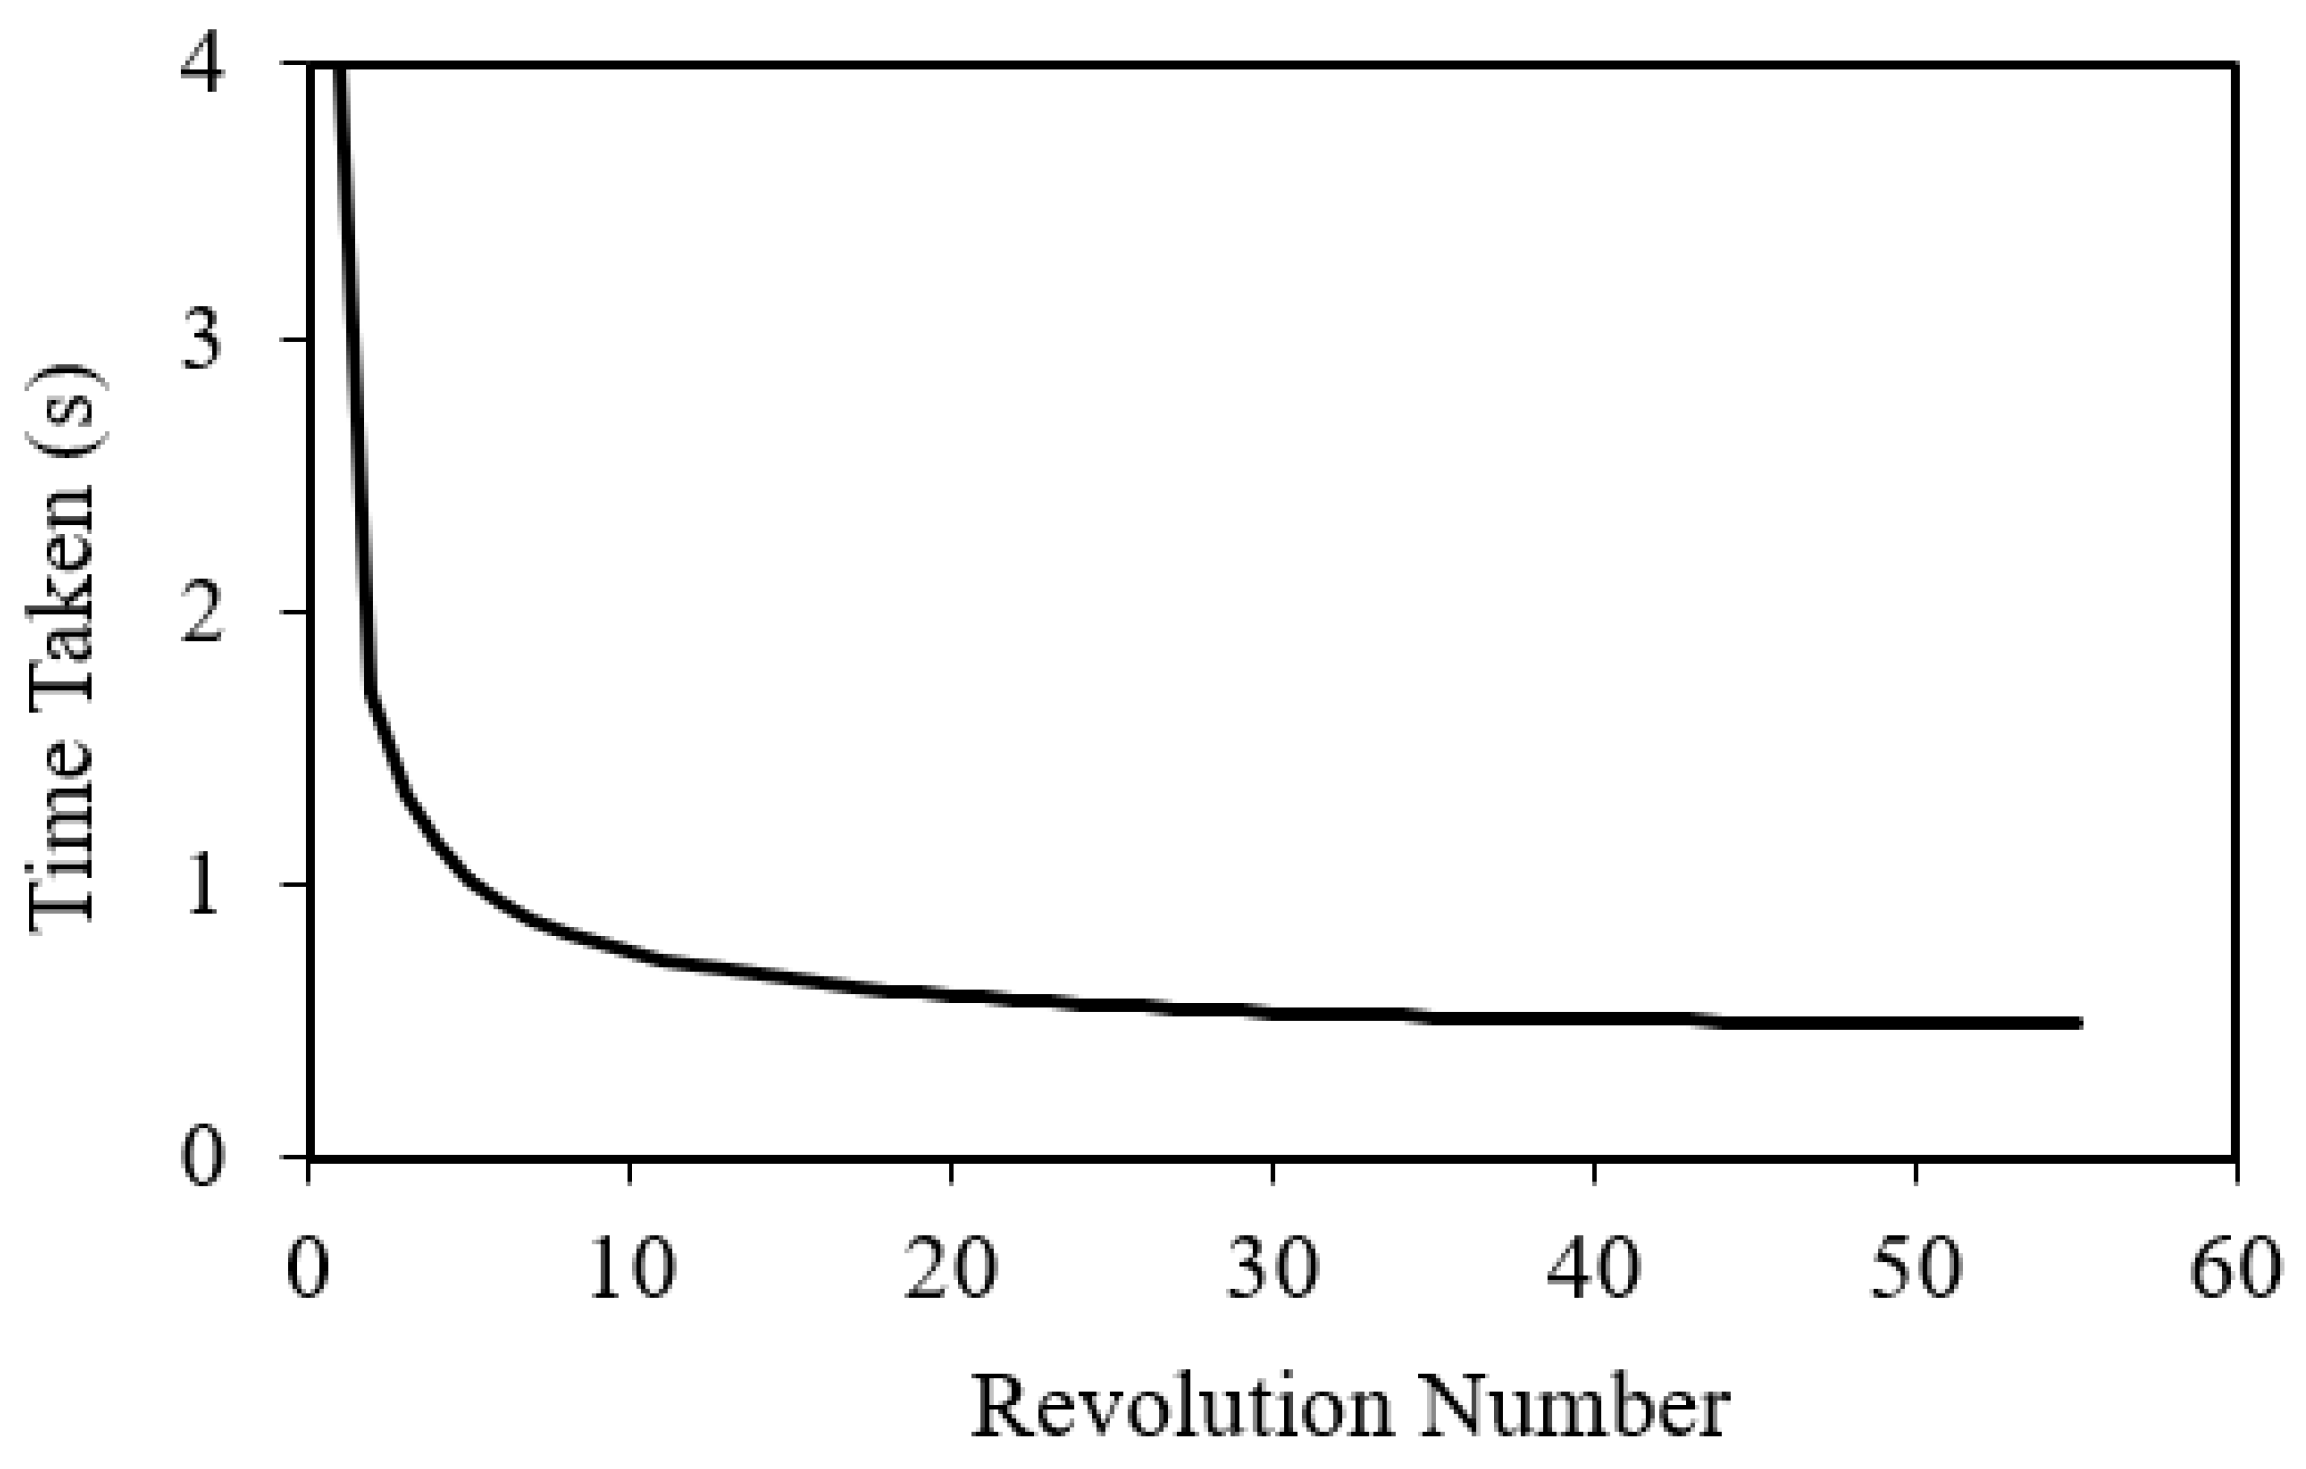
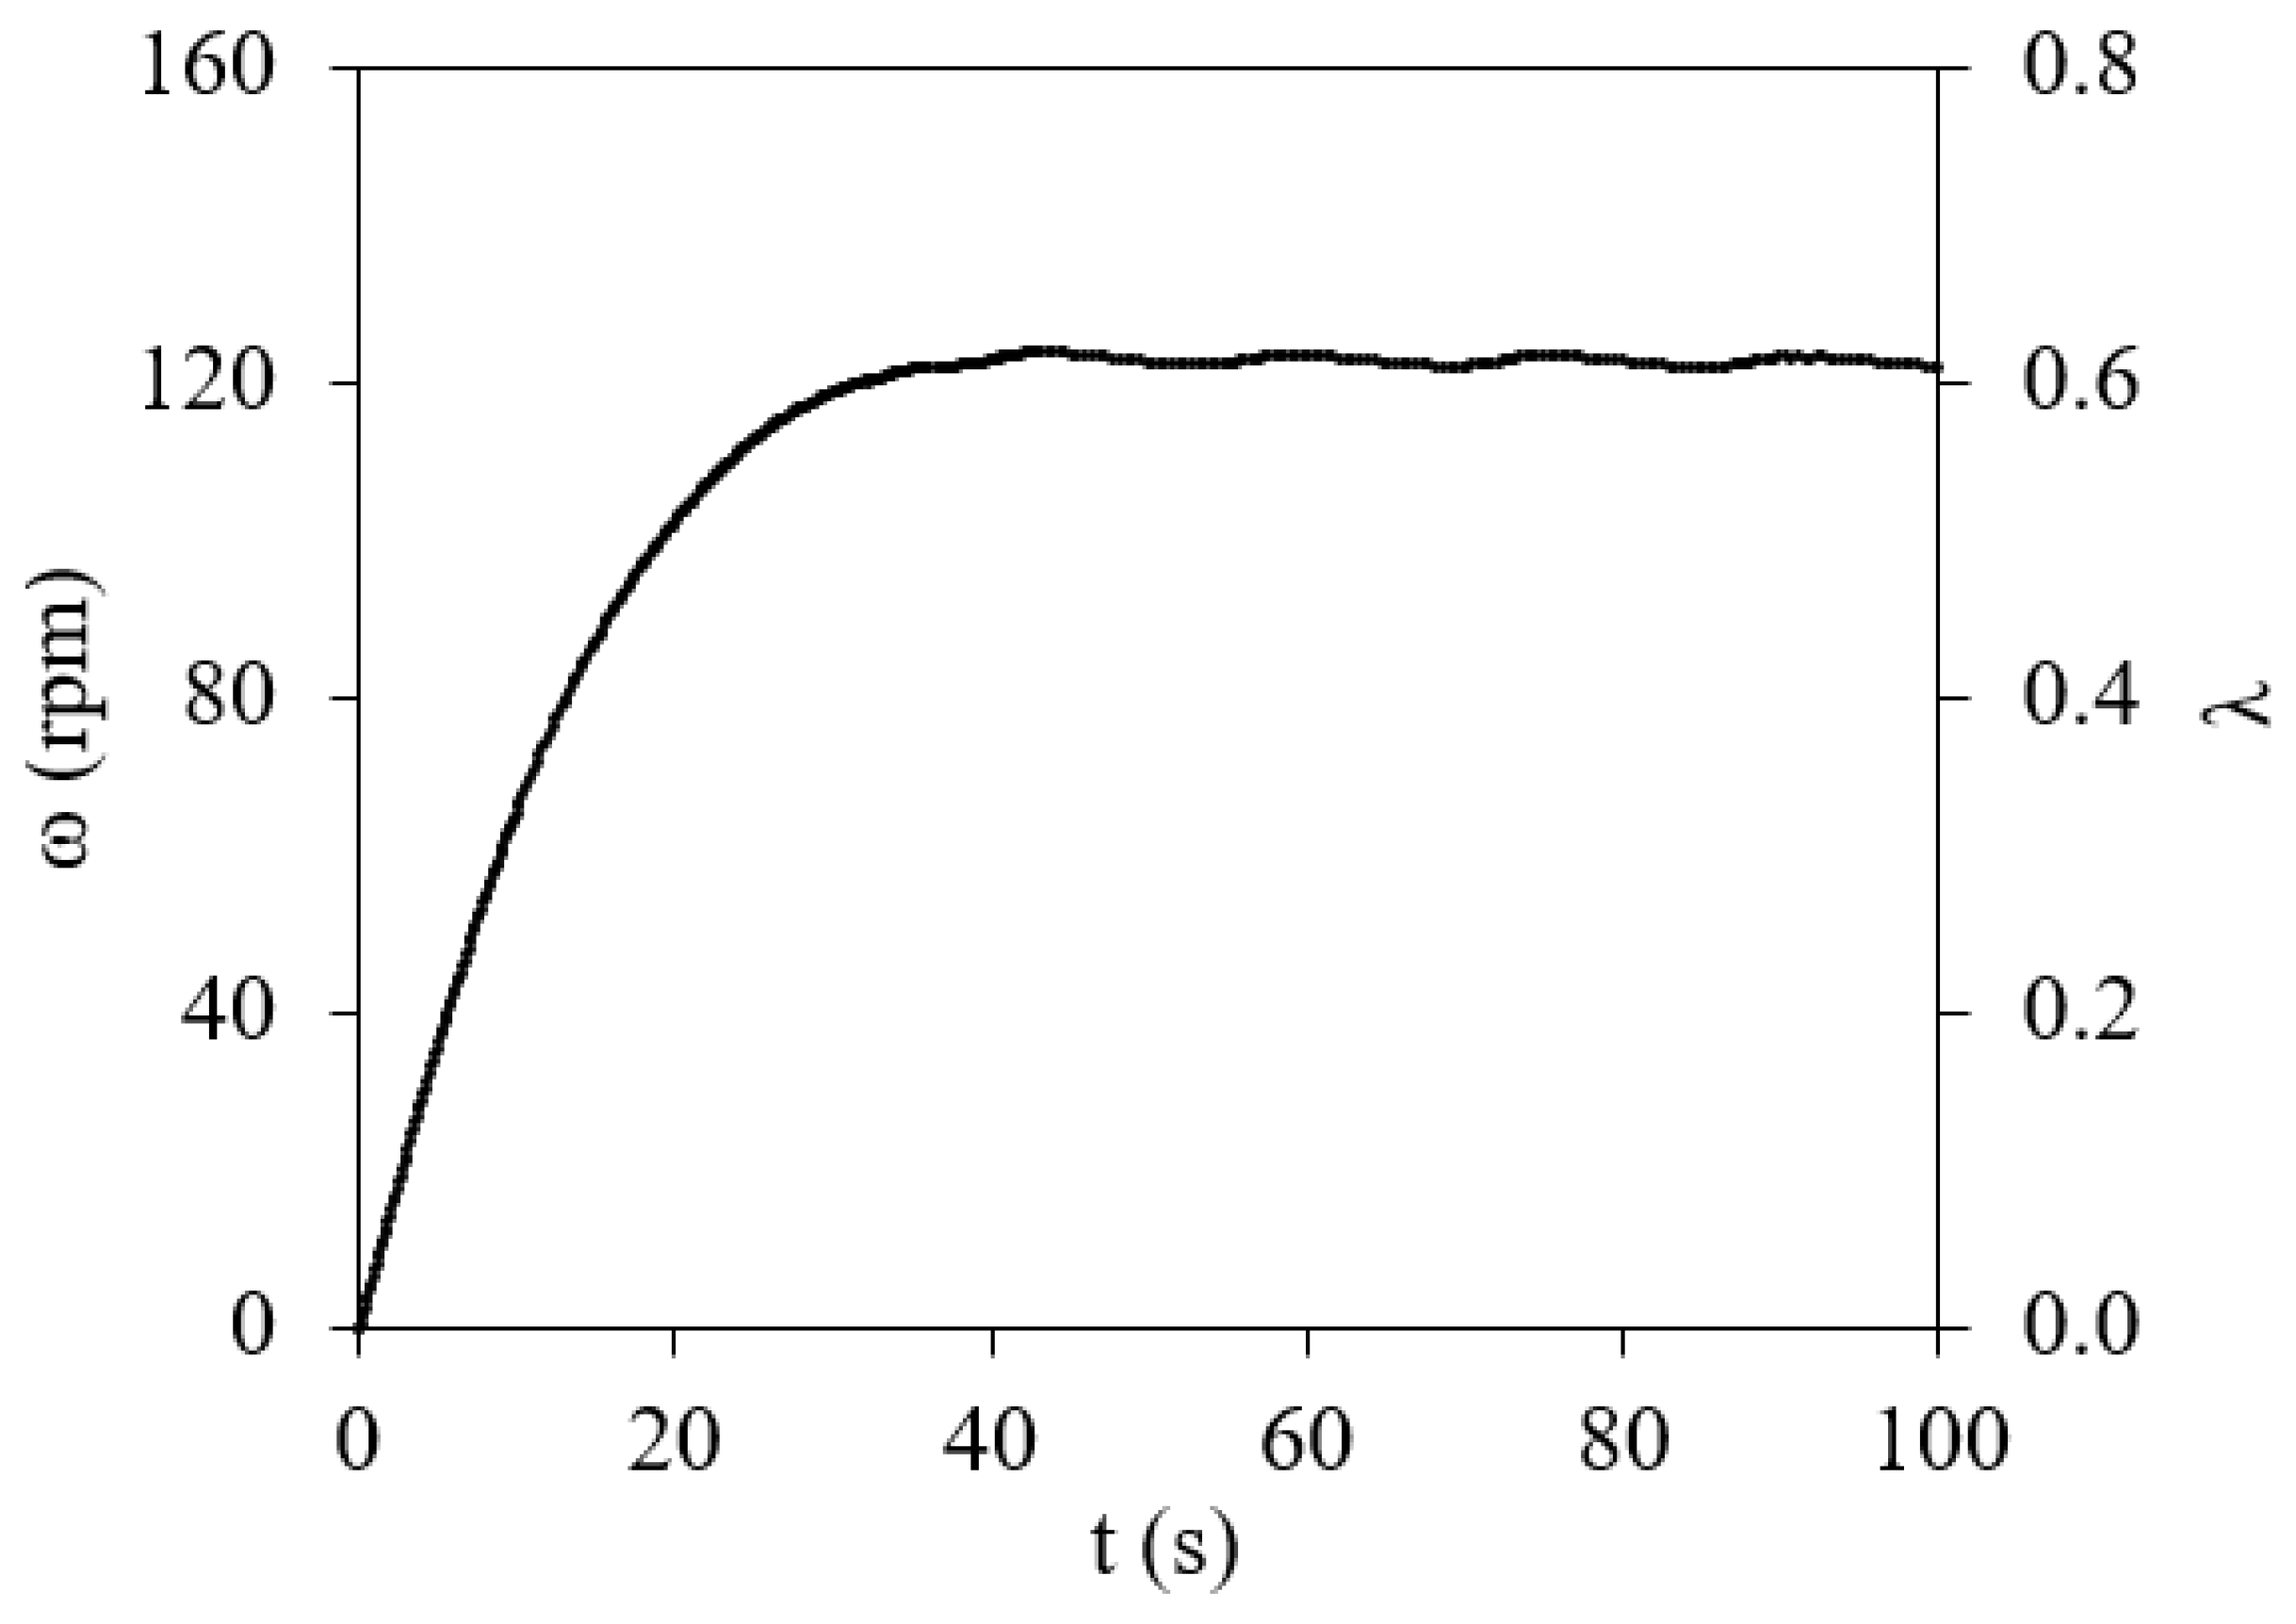
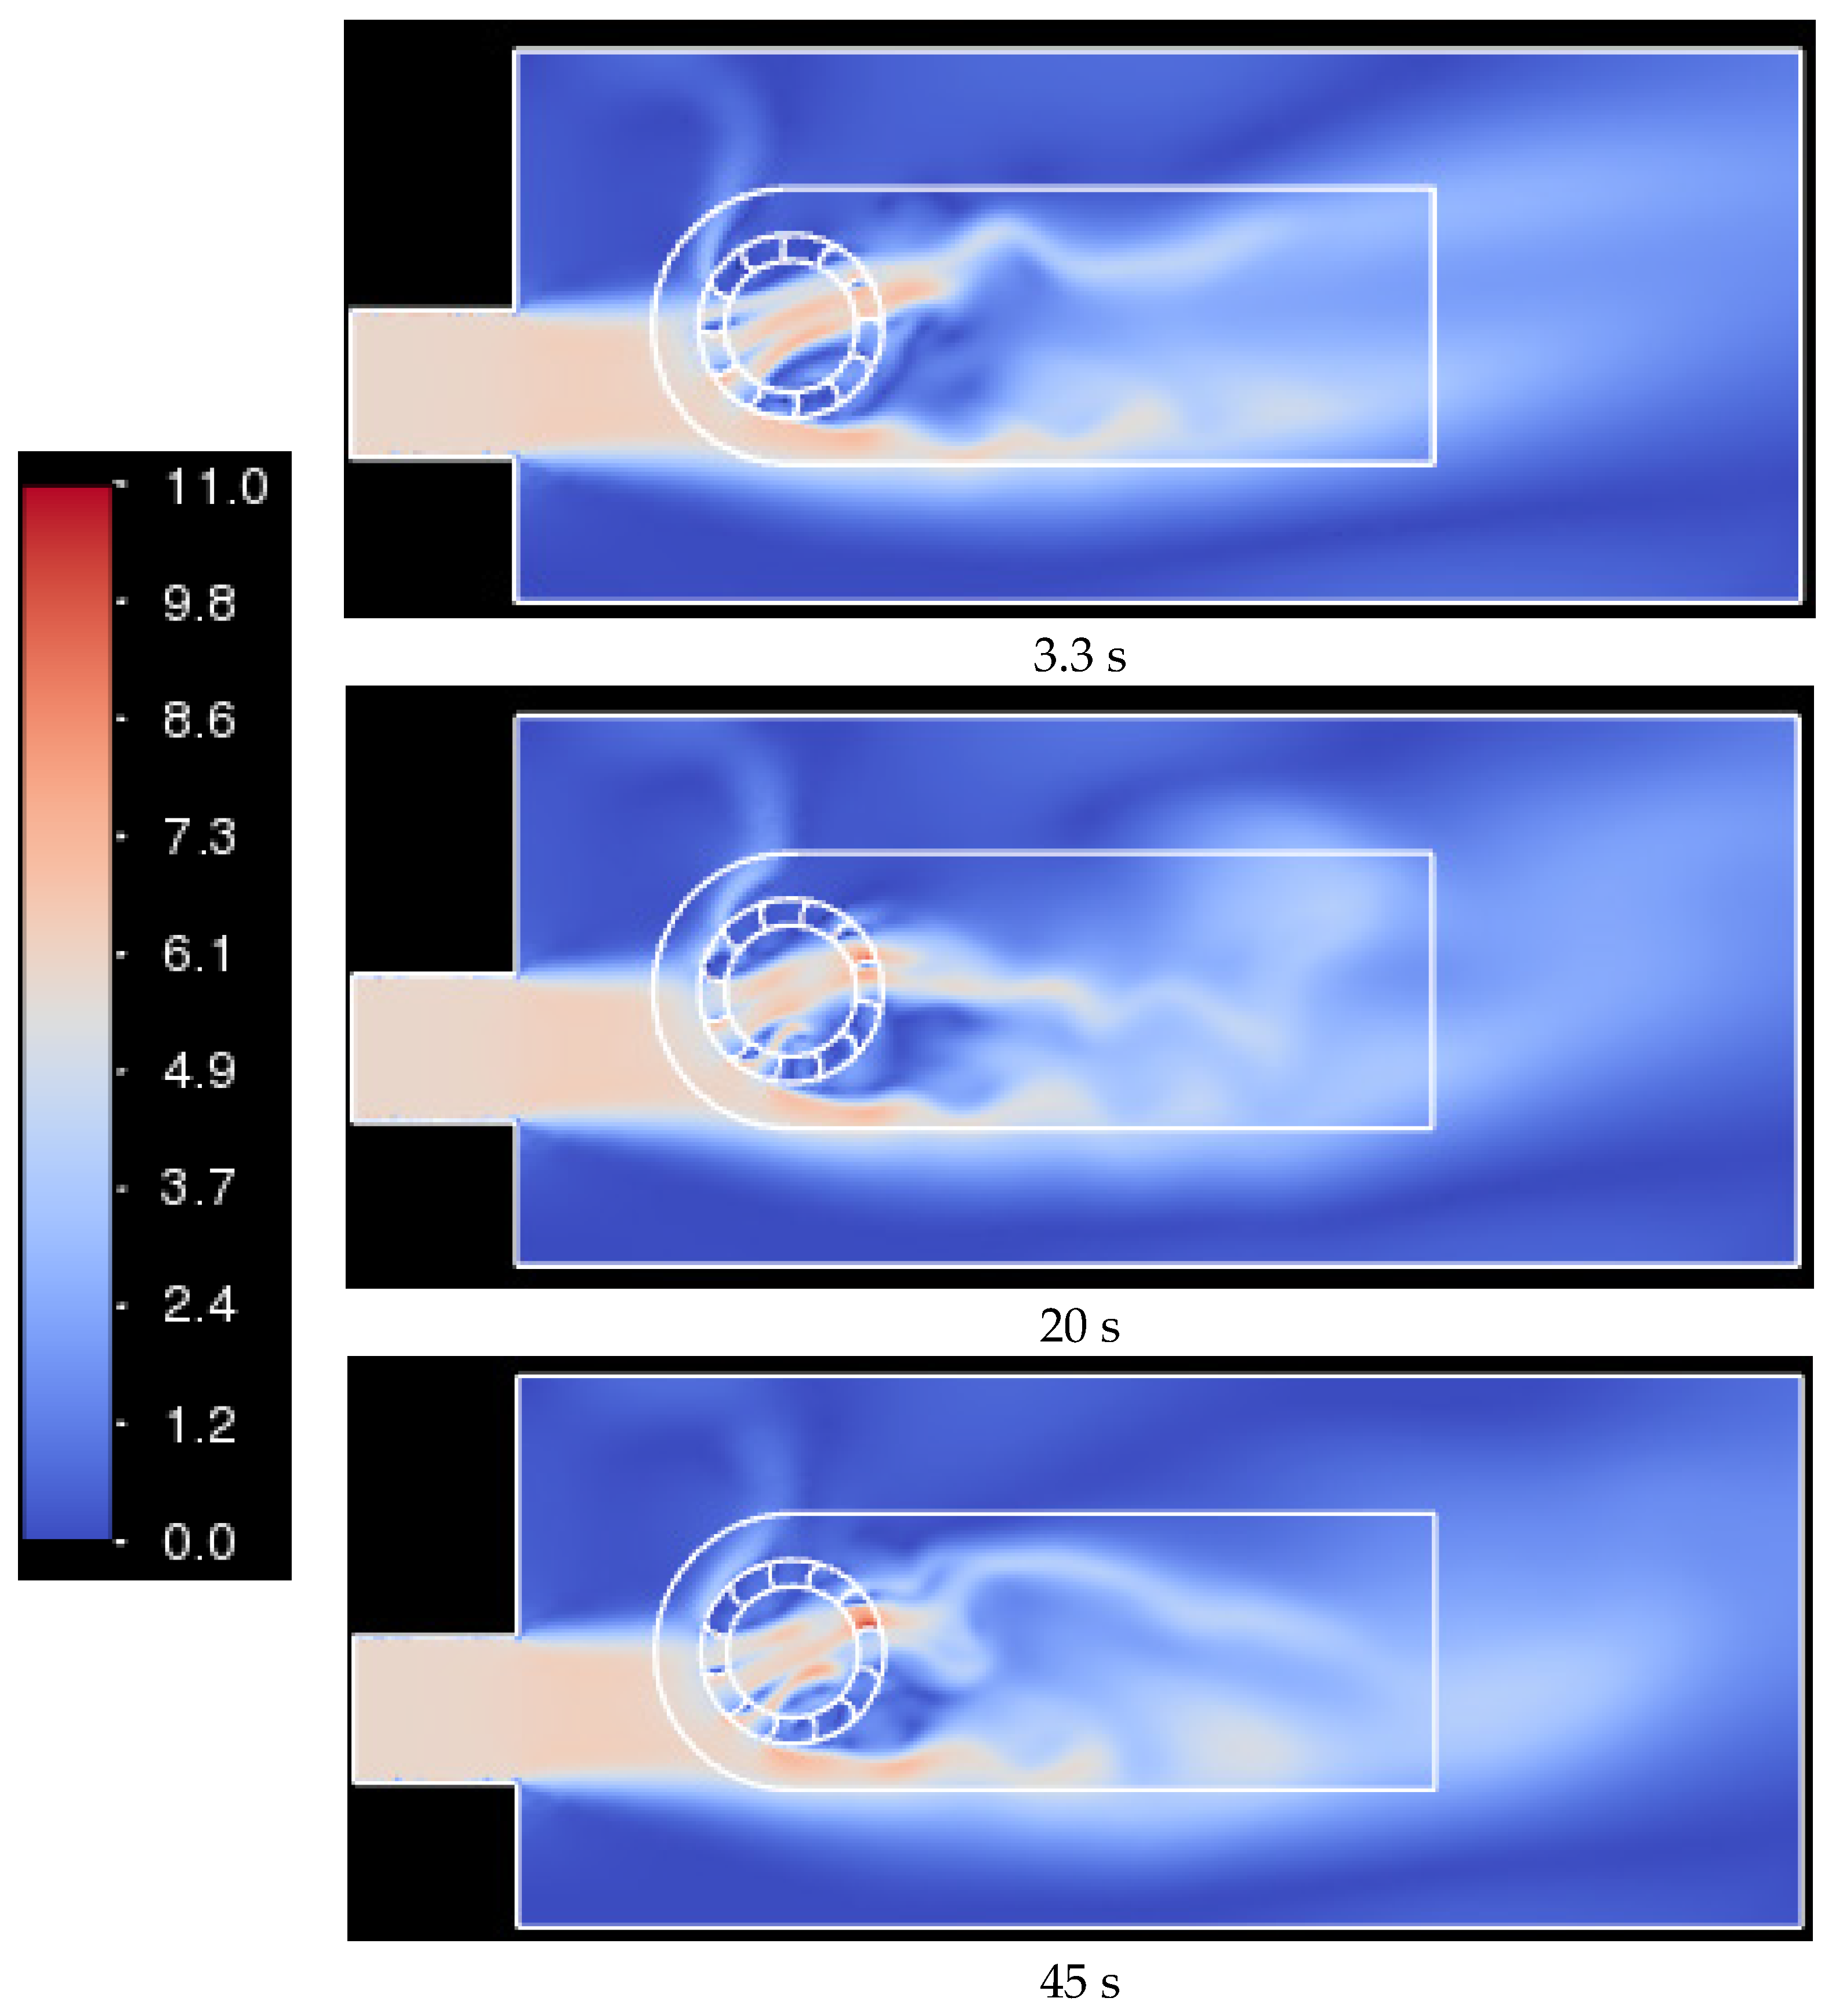
3.1. Startup Dynamics of Savonius Rotor with No Fricitional Losses (100% Inertia Case)

Figure 4 depicts the variation in the angular position (θ) of the turbine with time, starting from at rest (θ = 0° at t = 0 s) and increasing until t = 100 s, where the wind speed was kept constant at 6 m/s. It can be seen that the angular position of the turbine started to increase (i.e., turbine started to rotate) rather slowly initially. Once the rotary encoder recorded an angular position of 360°, it reset the counter to 0° and started recording the next revolution. From the figure, it is clear that the turbine took a long time to complete its first revolution. The following revolutions seemed to take less time progressively for the first few revolutions, suggesting a build-up of angular speed. The turbine completed a total of 180 revolutions during the 100 s time period considered.
In order to quantify the above discussion, the time taken for each revolution was computed, and they are summarized in Table 2. For the first revolution, the turbine took 4.02 s, while for the second revolution, it took 1.7 s. This clearly indicates that the turbine was under angular acceleration. The turbine took 1.33 s for the third revolution, 1.14 s for the fourth revolution and 1 s for the fifth revolution. Thus, progressively, the turbine sped up, taking less time to complete a revolution. For reference, the time taken by the turbine to complete its 30th and 40th revolutions were also included in the table.
An important question that is still unanswered is whether the time taken to complete a revolution keeps decreasing indefinitely (however small the change) or if it does attain a constant angular speed (i.e., zero angular acceleration). Figure 5 shows the variations in the time taken to complete each revolution of the turbine up until revolution number 55. It can be seen that initially (starting from rest), the time taken by the turbine to complete a revolution decreased substantially, as is evident in Table 2 as well. The decrease in time taken to complete a revolution reduced considerably from revolution number 10 onward, and it seems that from revolution number 45 or so onward, there was no appreciable change in the time taken by the turbine to complete a revolution.
In order to ascertain this observation, Table 3 summarizes the time taken by the turbine to complete revolution numbers 47–52. It can be clearly seen that the difference in the time taken by the turbine was insignificant from the 47th revolution onward. Thus, the angular acceleration of the turbine approached zero and the angular velocity remained almost constant from the 47th revolution onward. This can be seen in Figure 6, which shows the variation in the angular velocity (ω) and tip speed ratio (λ) over time. In Table 3 and Figure 6, it can be seen that the turbine reached its steady operational speed (peak ω value) at t = 34 s from rest, when the wind speed was 6 m/s and the only contribution toward the turbine inertia was its mass moment of inertia (no additional frictional losses).
At steady operational conditions, the turbine had a peak angular velocity of 122 rpm. Thus, the turbine completed 122 revolutions each minute at 6 m/s. This corresponds to a tip speed ratio (λ) of 0.6. From the startup dynamics point of view, an important point to note here is that the complete startup process of this turbine comprised two stages. These are the initial acceleration stage, shown in Figure 6 as increasing ω and λ values, and the following plateau region, shown as constant ω and λ values. The startup process actually concludes at the interface of these two stages (i.e., once the turbine achieved its peak angular velocity).
From a qualitative point of view, the flow field analysis is presented here, both during the startup and at steady operational conditions. Figure 7 depicts the variations in the flow velocity magnitude (in m/s) within the flow domain at different times during the 100 s operational window of the turbine. The first figure corresponds to a time of 3.3 s, which was at the start of the turbine’s startup. The second figure corresponds to a time of 20 s, which was closer to the end of the startup, while the third figure corresponds to a time of 45 s, which was during the steady operation of the turbine. For effective comparison, the scale of these variations was kept the same (i.e., from 0 m/s to 11 m/s). Please note that the peak flow velocity recorded at 3.3 s was 8.07 m/s, that at 20 s was 9.93 m/s, and that at 45 s was 10.6 m/s. Thus, for the constant wind speed, as the turbine went through its startup, the local flow velocity kept increasing. Apart from this, there were no other significant variations in the flow field which were observed.

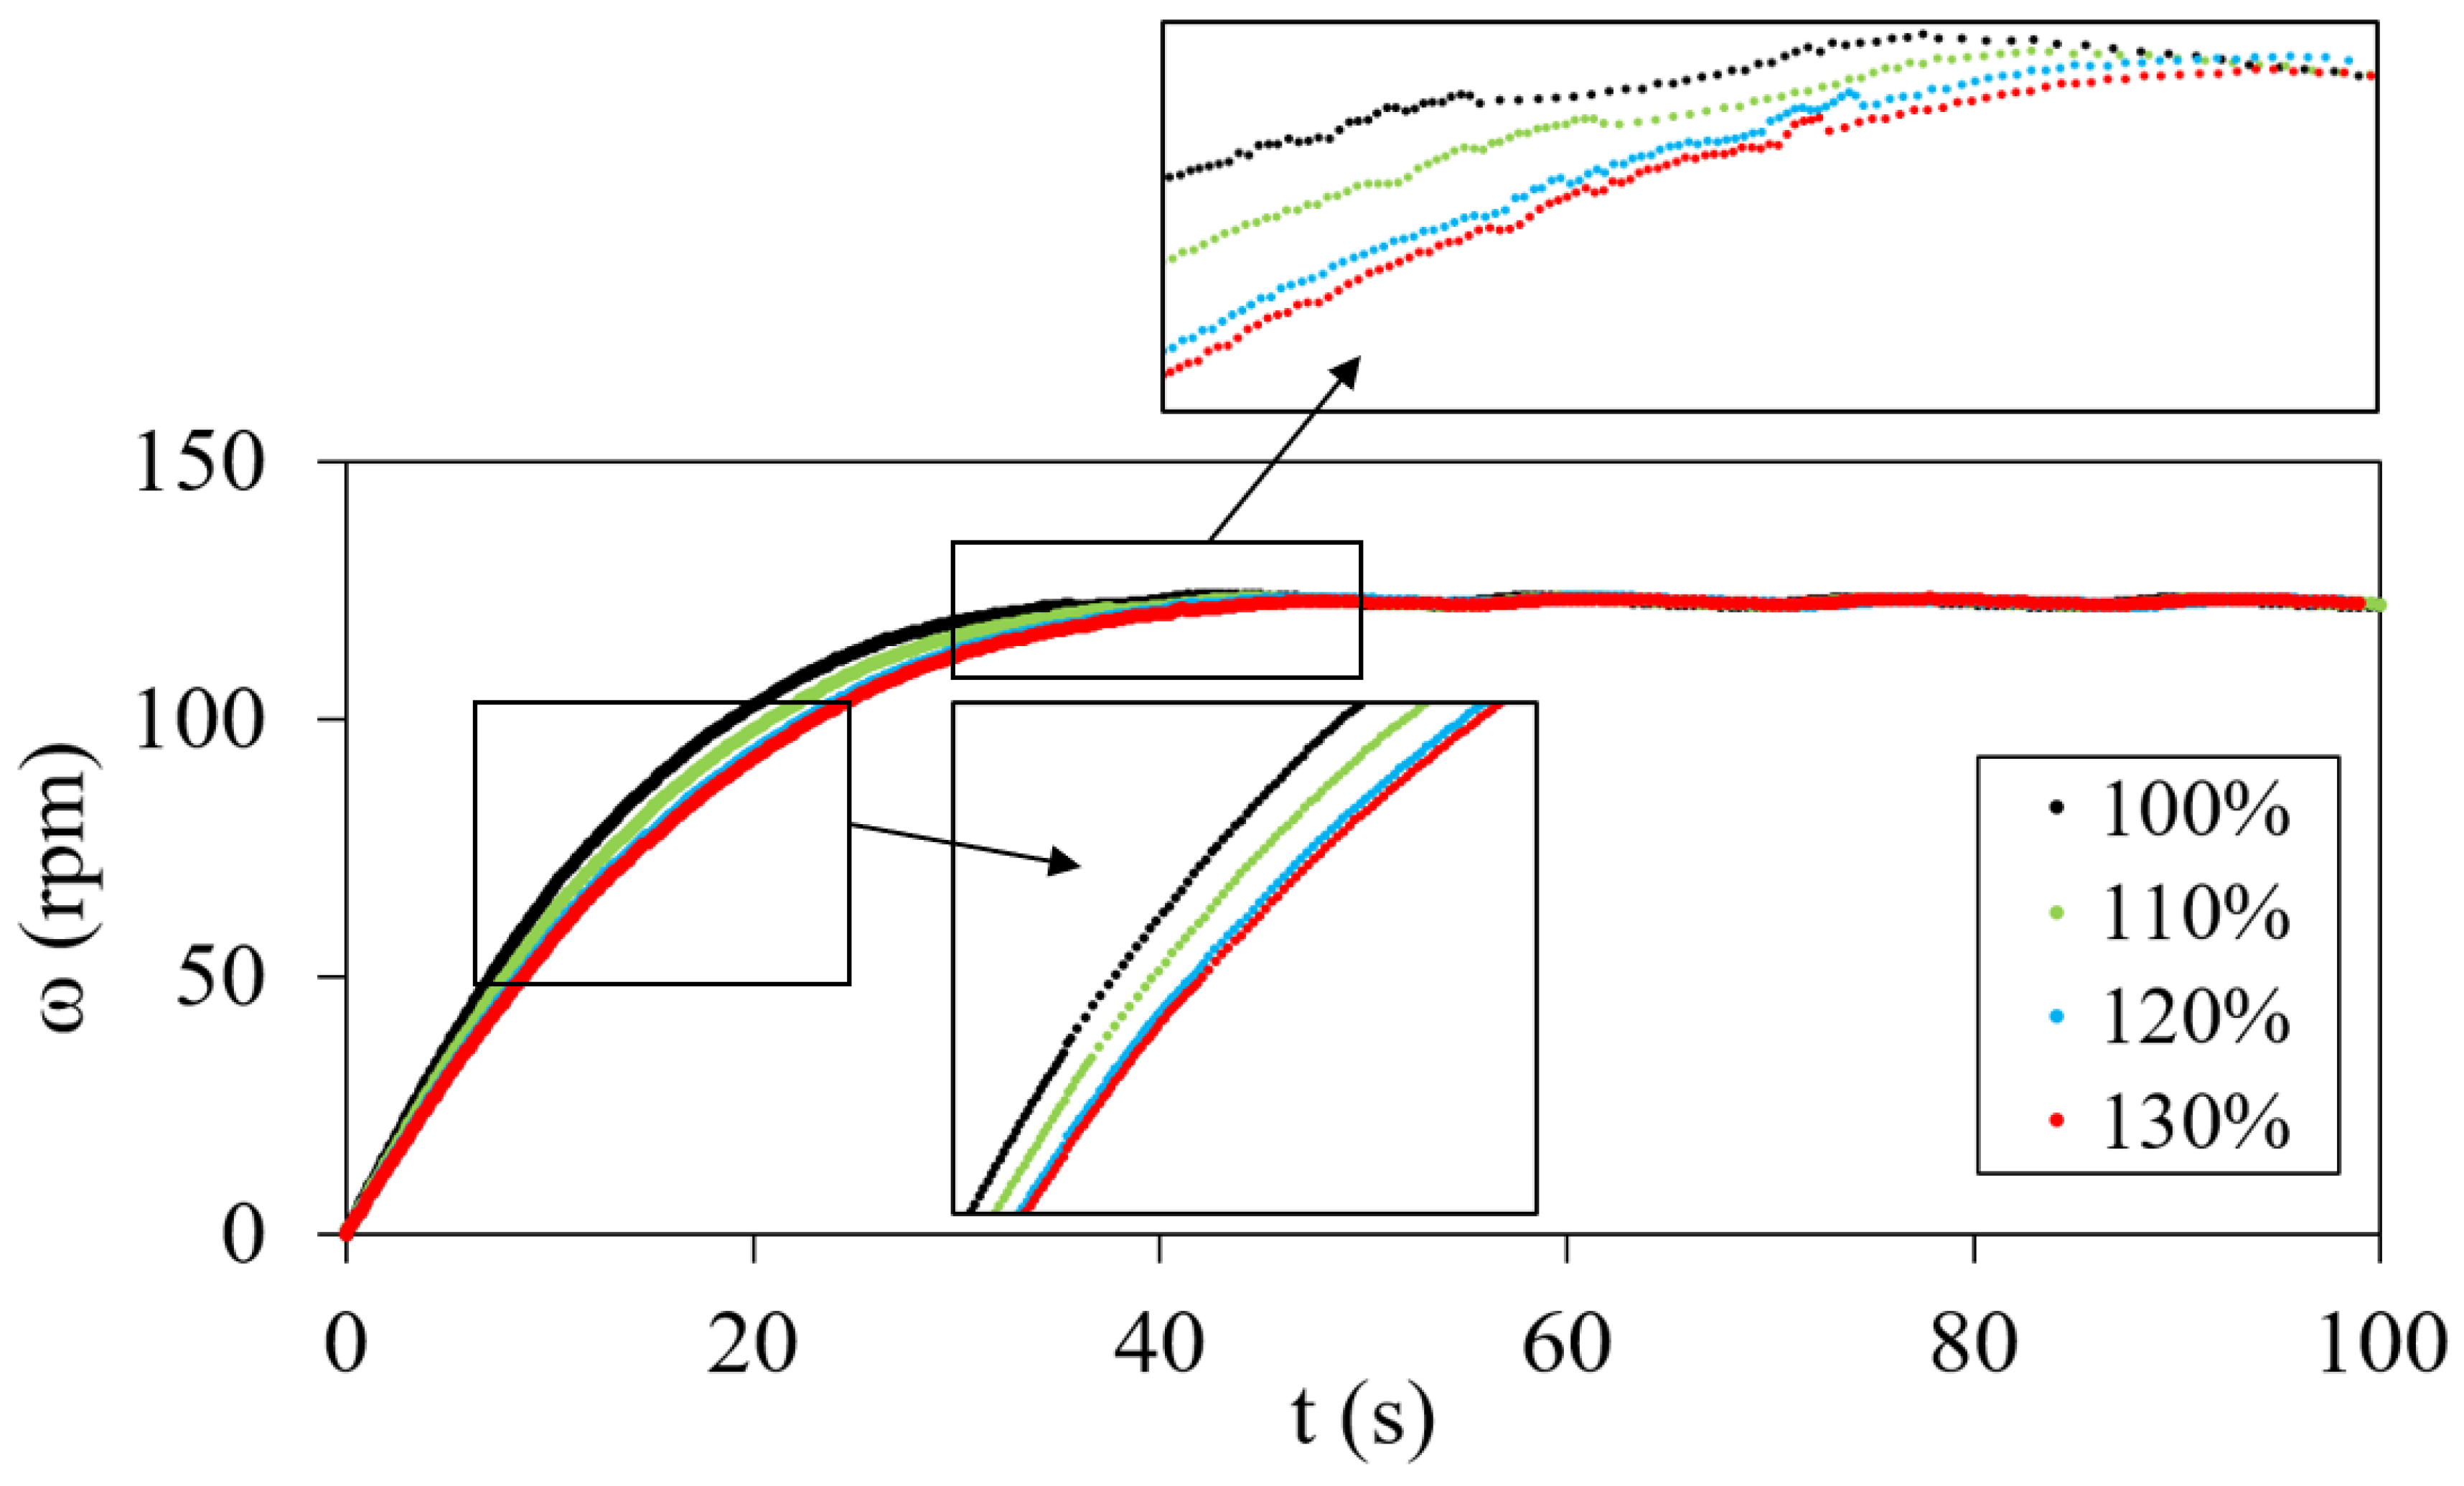
3.2. Effects of Inertia on the Startup Dynamics of a Savonius VAWT

When shaft bearings were taken into consideration, the inertia of the turbine increased due to the additional resistance and torque offered by the bearings. This is similar to cases with any other add-ons, like the generator or brakes. This real-world phenomenon can be replicated in the numerical domain by increasing the mass moment of inertia of the turbine. This is what was carried out in the present study. A mass moment of inertia of 110%, which means that the frictional losses accounted for 10% of the mass moment of inertia, originating from the design and the materials used in the construction of the turbine, was considered, along with 120% and 130% inertia. It was expected that with these additional inertial contributions, the turbine startup would be affected.
Figure 8 depicts the startup dynamics of the turbine with all of the inertia values considered for better comparison, including 100% inertia, which represents no frictional losses. The startup dynamics were represented in terms of varying the angular velocity of the turbine (ω) over time, which was set at 6 m/s wind speed and for a total duration of 100 s. The first observation from Figure 8 is that all of the curves (for different inertia values) followed the same trend as that observed in the previous section, which was expected. The red curve (130% inertia) at the same time (t) during the startup phase (i.e., increasing ω) was lowest on the Y scale, while the 100% inertia curve was the highest. The green curve (110% inertia) and the blue curve (120%) were consequently below the 100% inertia curve. This clearly indicates that with the addition of shaft bearings, leading to higher turbine inertia, the startup of the turbine was slower (i.e., at the same time stamp, the angular velocity was lower at higher inertia values). As the slope of the 130% inertia curve was lower than 100% inertia curve, the angular acceleration was expected to be lower for increased turbine inertia. This also means that the turbine would take more time to reach its peak angular velocity. Another rather interesting point to note in Figure 8 is that the peak angular velocity of the turbine remained unchanged by the increasing turbine inertia. Thus, the only effect turbine inertia had was the delayed startup, while the steady operating condition remained unchanged.
For further comparing the startup behavior of the turbine with varying inertia values, Table 4 summarizes the time taken to reach the peak angular velocity or, in other words, reach the point where the startup concluded and steady operation of the turbine at that particular wind speed started. It can be seen that as the turbine inertia increased, the time taken to reach steady operation also increased. An increase of 10% in turbine inertia increased the startup time by 13.3%, while inertia increases of 20% and 30% increased the startup time by 16.7% and 23.2%, respectively. It is also important to calculate the number of turbine revolutions it took to reach the steady operational condition. This is because two phenomena are occurring at the same time when turbine inertia increases (i.e., the total time for startup increases (suggesting more revolutions) and the instantaneous angular velocity decreases (suggesting fewer revolutions)). Thus, it is unclear whether the total number of revolutions would increase or decrease during the startup phase as the turbine inertia increased. It can be seen in Table 4 that as the turbine inertia increased, the number of revolutions of the turbine also increased during the startup stage. This indicates that the effect of increased time during startup dominated the lower instantaneous angular velocity.
When comparing the time taken by individual revolutions during startup, it can be seen in Table 5 that for the first three revolutions of the turbine from rest, as the turbine inertia increased, the time taken to complete each revolution increased. When increasing the turbine inertia by 10% (from 100% to 110%), on average, the turbine took 4.45% more time to complete the first three revolutions. Similarly, when increasing the turbine inertia by 20% and 30%, the turbine took on average 8.6% and 9.8% more time to complete the first three revolutions, respectively. Thus, the startup was delayed as the turbine inertia increased. In terms of the total time taken by the turbine to reach a steady operational speed, increasing the turbine inertia by 10%, 20% and 30% increased the time to reach steady operation by 13.4%, 16.7% and 23.2%, respectively.
For completing the discussion on the effects of the turbine inertia on the startup dynamics of a multibladed Savonius turbine, Figure 9 depicts the variation in the tip speed ratio of the turbine at different considered inertia values. It can be seen that the trends followed by the turbine were the same as those observed in case of Figure 8 for the angular velocity of the turbine. Again, the peak tip speed ratio of the turbine (λ = 0.6) was unaffected by the turbine inertia.

4. Conclusions

Detailed numerical investigations on the effects of a turbine’s inertia on its startup dynamics were conducted in this study. A multibladed Savonius rotor was considered for these investigations due to their simpler and cheaper design and easier maintenance. Advanced computational fluid dynamics-based algorithms were employed to numerically model the Savonius rotor, and testing was carried out at a 6 m/s wind speed. The effects of turbine inertia were investigated through changing the values of the mass moment of inertia of the turbine. Flow-induced rotation of the rotor was modeled through use of the six degree of freedom modeling approach. The angular position of the turbine as well as its angular velocity and tip speed ratio were recorded and computed over time to evaluate the turbine’s startup dynamics.
Based on the results obtained in this study, it can be concluded that the startup of a Savonius rotor comprises two stages (i.e., an initial acceleration followed by a plateau region which corresponds to a nearly constant angular velocity for the turbine). During the initial acceleration of the turbine, it gradually sped up until it reached a steady operational speed. Thus, the time taken to complete a revolution kept decreasing during the acceleration stage of the startup. The turbine inertia was observed to have a significant impact on its startup. Increasing the turbine inertia increased the time taken by the turbine to reach its steady operational condition but did not affect the turbine’s peak angular velocity or tip speed ratio. As the turbine inertia increased, it took longer for the turbine to reach its steady operational speed. Increasing the inertia by 10%, 20% and 30% increased the time taken by the turbine to reach its peak rotational speed by 13.3%, 16.7% and 23.2%, respectively. Thus, the frictional losses delayed the startup of the turbine. As the peak angular velocity did not change, there was no anticipated impact on the power-generating capability of the turbine.

Author Contributions

Conceptualization, T.A. and D.S.; Methodology, T.A., D.S. and M.S.S.; Software, T.A.; Validation, T.A.; Formal analysis, T.A.; Investigation, T.A. and D.S.; Data curation, D.S.; Writing—original draft, T.A., I.A., D.S. and M.S.S.; Writing—review & editing, D.S. and M.S.S.; Visualization, T.A., I.A. and M.S.S.; Project administration, T.A. and I.A.; Funding acquisition, I.A. All authors have read and agreed to the published version of the manuscript.

Funding

The research received no external funding.

Data Availability Statement

The original contributions presented in this study are included in the article. Further inquiries can be directed to the corresponding author.

Conflicts of Interest

The authors declare no conflicts of interest.

References

  1. Gerrie, C.; Islam, S.Z.; Gerrie, S.; Turner, N.; Asim, T. 3D CFD modelling of performance of a vertical axis turbine. Energies 2023, 16, 1144. [Google Scholar] [CrossRef]
  2. Darrieus, G.J.M. Turbine Having Its Rotating Shaft Transverse to the Flow of the Current. U.S. Patent 1,835,018, 8 December 1931. [Google Scholar]
  3. Savonius, S.J. The S-rotor and its applications. Mech. Eng. Am. Soc. Mech. Eng. 1931, 53, 333. [Google Scholar]
  4. Asr, M.T.; Nezhad, E.Z.; Mustapha, F.; Wiriadidjaja, S. Study on start-up characteristics of H-Darrieus vertical axis wind turbines comprising NACA 4-digit series blade airfoils. Energy 2016, 112, 528–537. [Google Scholar] [CrossRef]
  5. Hill, N.; Dominy, R.; Ingram, G.; Dominy, J. Darrieus turbines: The physics of self-starting. Proc. Inst. Mech. Eng. Part A J. Power Energy 2008, 223, 21–29. [Google Scholar] [CrossRef]
  6. Celik, Y.; Ma, L.; Ingham, D.; Pourkashanian, M. Aerodynamic investigation of the start-up process of H-type vertical axis wind turbines using CFD. J. Wind. Eng. Ind. Aerodyn. 2020, 204, 104252. [Google Scholar] [CrossRef]
  7. Kirke, B.; Lazauskas, L. Variable Pitch Darrieus Water Turbines. J. Fluid Sci. Technol. 2008, 3, 430–438. [Google Scholar]
  8. Mitchell, S.; Ogbonna, I.; Volkov, K. Improvement of Self-Starting Capabilities of Vertical Axis Wind Turbines with New Design of Turbine Blades. Sustainability 2021, 13, 3854. [Google Scholar] [CrossRef]
  9. Zhu, J.; Huang, H.; Shen, H. Self-starting aerodynamics analysis of vertical axis wind turbine. Adv. Mech. Eng. 2015, 7, 1687814015620968. [Google Scholar]
  10. Dominy, R.; Lunt, P.; Bickerdyke, A.; Dominy, J. Self-starting capability of a Darrieus turbine. Proc. Inst. Mech. Eng. Part A J. Power Energy 2007, 221, 111–120. [Google Scholar]
  11. Zhu, J.; Tian, C. Effect of Rotation Friction Ratio on the Power Extraction Performance of a Passive Rotation VAWT. Int. J. Rotating Mach. 2019, 2019, 6580345. [Google Scholar]
  12. Chegini, S.; Asadbeigi, M.; Ghafoorian, F.; Mehrpooya, M. An investigation into the self-starting of darrieus-savonius hybrid wind turbine and performance enhancement through innovative deflectors: A CFD approach. Ocean Eng. 2023, 287, 115910. [Google Scholar]
  13. Lough, J.; Asim, T.; Coull, S.; Marshall, A.; Islam, S.Z.; Amber, I. Start-up dynamics of vertical axis wind turbines: A Review. J. Phys. Conf. Ser. 2023, 2626, 012006. [Google Scholar] [CrossRef]
  14. Mu, Z.; Tong, G.; Xiao, Z.; Deng, Q.; Feng, F.; Li, Y.; Arne, G.A. Study on aerodynamic characteristics of a Savonius wind turbine with a modified blade. Energies 2022, 15, 6661. [Google Scholar] [CrossRef]
  15. Kang, C.; Zhao, H.; Li, B.; Gong, W.; Zhu, Y. Improvement of startup performance of the drag-type hydrokinetic rotor through two-stage configuration. Ocean Eng. 2021, 238, 109677. [Google Scholar] [CrossRef]
  16. Tigabu, M.T.; Khalid, M.S.U.; Wood, D.; Admasu, B.T. Some effects of turbine inertia on the starting performance of vertical-axis hydrokinetic turbine. Ocean Eng. 2022, 252, 111143. [Google Scholar]
  17. Zhao, H.; Kang, C.; Ding, K.; Zhang, Y.; Li, B. Transient startup characteristics of a drag-type hydrokinetic turbine rotor. Energy Convers. Manag. 2020, 223, 113287. [Google Scholar] [CrossRef]
  18. Mosbahi, M.; Ayadi, A.; Chouaibi, Y.; Driss, Z.; Tucciarelli, T. Performance study of a Helical Savonius hydrokinetic turbine with a new deflector system design. Energy Convers. Manag. 2019, 194, 55–74. [Google Scholar]
  19. Ushiyama, I.; Nagai, H.; Shinoda, J. Experimentally Determining the Optimum Design Configuration for Savonius Rotors. JSME Int. J. Ser. B-Fluids Therm. Eng. 1986, 29, 4130–4138. [Google Scholar]
  20. Asim, T.; Singh, D.; Siddiqui, M.S.; McGlinchey, D. Effect of Stator Blades on the Startup Dynamics of a Vertical Axis Wind Turbine. Energies 2022, 15, 8135. [Google Scholar] [CrossRef]
  21. Asim, T.; Osame, P. Startup Dynamics of Drag-Based Multibladed Vertical Axis Wind Turbine. Eng. Proc. 2024, 71, 5. [Google Scholar] [CrossRef]
  22. Asim, T.; Mishra, R.; Kaysthagir, S.N.; Aboufares, G. Performance comparison of a vertical axis wind turbine using commercial and open source computational fluid dynamics based codes. In Proceedings of the 5th International Conference on Jets, Wakes and Separated Flows; Springer Proceedings in Physics; Springer: Aachen, Germany, 2016; Volume 185, pp. 589–594. [Google Scholar]
  23. Asim, T.; Islam, S.Z. Effects of damaged rotor on wake dynamics of vertical axis wind turbines. Energies 2021, 14, 7060. [Google Scholar] [CrossRef]
  24. Versteeg, H.K.; Malalasekera, W. An Introduction to Computational Fluid Dynamics: The Finite Volume Method, 2nd ed.; Pearson: London, UK, 2007. [Google Scholar]
  25. ANSYS, Inc. ANSYS Fluent User’s Guide; Release 2021 R2; ANSYS, Inc.: Canonsburg, PA, USA, 2021. [Google Scholar]
  26. Sun, X.; Zhu, J.; Li, Z.; Sun, G. Rotation improvement of vertical axis wind turbine by offsetting pitching angles and changing blade numbers. Energy 2021, 215, 119177. [Google Scholar] [CrossRef]
  27. Zhu, J.; Jiang, L.; Zhao, H. Effect of wind fluctuating on self-starting aerodynamics characteristics of VAWT. J. Cent. South Univ. 2016, 23, 2075–2082. [Google Scholar]
  28. Li, L.; Xu, P.; Li, Q.; Yin, Z.; Zheng, R.; Wu, J.; Bao, J.; Bai, W.; Qi, H.; Tan, D. Multi-field coupling particle flow dynamic behaviors of the microreactor and ultrasonic control method. Powder Technol. 2025, 454, 120731. [Google Scholar]
  29. Tan, Y.; Ni, Y.; Xu, W.; Xie, Y.; Li, L.; Tan, D. Key technologies and development trends of the soft abrasive flow finishing method. J. Zhejiang Univ. Sci. A 2023, 24, 1043–1064. [Google Scholar]
Figure 1. (a) CAD model of the Savonius VAWT. (b) Dimensions of the numerical model.
Energies 18 01638 g001
Figure 2. Meshing of the flow domain.
Energies 18 01638 g002
Figure 3. The y+ variations on the turbine blades’ surfaces.
Energies 18 01638 g003
Figure 4. Rotational history of the Savonius VAWT.
Energies 18 01638 g004
Figure 5. Variation in time taken by the turbine to complete each revolution.
Energies 18 01638 g005
Figure 6. Temporal variations in the angular velocity and tip speed ratio of the Savonius VAWT.
Energies 18 01638 g006
Figure 7. Velocity magnitude variations within the flow domain at different times.
Energies 18 01638 g007
Figure 8. Variation in the angular velocity of the Savonius VAWT for different turbine inertia values.
Energies 18 01638 g008
Figure 9. Variation in the tip speed ratio of the Savonius VAWT w.r.t. the turbine inertia.
Energies 18 01638 g009
Table 1. Boundary conditions.
BoundaryTypeValue
InletVelocity6 m/s
OutletPressure0 Pa
Sides of the outer domainSymmetry-
BladesWallsNo-slip
Table 2. Time taken by the Savonius VAWT to complete each revolution.
RevolutionCumulative Time (s)Time Taken (s)
1st4.01974.0197
2nd5.71681.6971
3rd7.04731.3305
4th8.18601.1387
5th9.20431.0183
30th25.4273
40th30.5805
Table 3. Time taken by the Savonius VAWT to complete revolutions 47–52.
RevolutionCumulative Time (s)Time Taken (s)
47th34.0768
48th34.57110.4943
49th35.06600.4949
50th35.55880.4928
51st36.05140.4926
52nd36.54300.4916
Table 4. Effect of turbine inertia on the number of revolutions and time taken by the Savonius VAWT to reach its peak angular velocity.
Turbine InertiaNo. of Revs to Peak ω of 122 rpm (s)Time Taken to Peak ω of 122 rpm (s)
100%5035.5588
110%5440.3150
120%5741.4951
130%6143.8009
Table 5. Effect of turbine inertia on the time taken by the Savonius VAWT to complete the first 3 revolutions.
InertiaTime Taken for 1st Revolution (s)Time Taken for 2nd Revolution (s)Time Taken for 3rd Revolution (s)
100%4.01971.69711.3305
110%4.20651.77111.3886
120%4.37881.84291.4436
130%4.42561.86111.4586
Disclaimer/Publisher’s Note: The statements, opinions and data contained in all publications are solely those of the individual author(s) and contributor(s) and not of MDPI and/or the editor(s). MDPI and/or the editor(s) disclaim responsibility for any injury to people or property resulting from any ideas, methods, instructions or products referred to in the content.

