Article

Influence of Compression Ratio on Combustion and Emission Characteristics of Hydrogen Internal Combustion Engines Under Different Excess Air Coefficients

by
Diming Lou
,
Yixuan Liu
and
Yunhua Zhang
*
School of Automotive Studies, Tongji University, Shanghai 201804, China
*
Author to whom correspondence should be addressed.
Energies 2025, 18(7), 1656; https://doi.org/10.3390/en18071656
Submission received: 9 March 2025 / Revised: 21 March 2025 / Accepted: 21 March 2025 / Published: 26 March 2025
(This article belongs to the Section A5: Hydrogen Energy)

Abstract

:
Hydrogen internal combustion engines (H2-ICEs) are a promising solution for decarbonizing heavy-duty transportation. This study investigates the effects of compression ratio (CR: 9, 11, 13) and excess air ratio (λ: 1–5) on the performance, emissions, and combustion characteristics of a turbocharged direct-injection H2-ICE under lean-burn conditions. A validated one-dimensional GT-POWER model, calibrated using experimental data (1500 rpm, 0.6 bar intake pressure), was employed to analyze volumetric efficiency (VE), indicated thermal efficiency (ITE), NOx emissions, and combustion stability. Results demonstrate that increasing λ reduces VE and indicated mean effective pressure (IMEP) but enhances ITE, peaking at 41.25% (CR = 13, λ = 2.5). NOx emissions exhibit a non-monotonic trend, reaching 1850 ppm at λ = 1.5 (CR = 13) before declining under leaner conditions. Higher CR extends the lean-burn limit (λ = 5.0 for CR = 13) and advances combustion phasing, though it elevates risks of abnormal combustion. Trade-offs between power, efficiency, and emissions highlight λ = 2.5 as optimal for balancing ITE and NOx control, while λ = 1 maximizes power output. This work provides critical insights into optimizing H2-ICE operation through CR and λ adjustments, supporting the transition toward sustainable heavy-duty transport systems.

1. Introduction

Global energy scarcity and climate change remain critical challenges in the contemporary era. Fossil fuels—primarily natural gas, coal, and petroleum—dominate industrial and power generation activities, accounting for approximately 73% of global carbon dioxide (CO2) emissions. Notably, internal combustion engines (ICEs) provide approximately 90% of the power sources in the transportation sector, contributing to around 20% of total global carbon emissions, thereby highlighting their significant environmental impact [1]. To mitigate the greenhouse effect, it is necessary to develop more efficient and clean ICEs that can reduce emissions from fossil fuel combustion. Adopting low-carbon alternative fuels represents an effective approach to addressing these issues [2,3]. Recent studies on low-carbon energy transitions demonstrate that significant progress has been achieved in the applications of various alternative fuels, including hydrogen fuel, methanol, and ammonia combustion, offering viable pathways to decarbonize heavy-duty transport systems [4,5,6]. Due to hydrogen’s zero-carbon and renewable characteristics, hydrogen internal combustion engines possess tremendous development potential for addressing the global energy crisis and reducing the greenhouse effect [7].
The hydrogen supply methods for internal combustion engines are primarily categorized into two types: port fuel injection (PFI) and direct injection (DI) [8]. The PFI engine exhibits superior mixture homogeneity and demonstrates excellent combustion stability [9]. Direct injection (DI) engines effectively mitigate backfire risks, enable compression ratios exceeding 14:1, and significantly enhance power density compared to conventional PFI configurations [10]. Recent advancements in high-pressure-resistant injector design and precision combustion control strategies have propelled lean-burn direct-injection hydrogen internal combustion engines (H2-ICEs) to the forefront of sustainable powertrain research [11,12]. Beyond injection strategies, combustion system design parameters such as compression ratio and turbocharging further influence engine performance. Increasing the compression ratio (CR) enhances power output and thermal efficiency. Hydrogen’s wide flammability range enables lean combustion, while elevated CR further extends the lean-burn limit in hydrogen ICEs [13]. The pressurization system can increase the amount of intake air, achieving higher volumetric efficiency, thereby enabling more fuel to undergo complete combustion. Lee et al. have demonstrated that, in comparison to naturally aspirated conditions, turbocharging a hydrogen internal combustion engine significantly boosts engine power output by 41% [14]. Nguyen et al. have proven that a high compression ratio can significantly improve the thermal efficiency of the engine while maintaining good combustion stability [13].
Due to hydrogen’s high octane number, hydrogen internal combustion engines exhibit excellent knock resistance [15]. However, because of hydrogen’s extremely low ignition energy, hydrogen internal combustion engines are prone to abnormal and unstable combustion at high compression ratios. This necessitates the optimization and control of relevant engine parameters [16]. To achieve efficient and stable combustion in hydrogen-fueled internal combustion engines (ICEs), coordinated optimization of critical operational parameters is imperative. Specifically, the synergistic adjustment of the exhaust gas recirculation (EGR) rate, precise calibration of ignition timing, and dynamic control of air-fuel ratio (λ) collectively optimize the trade-off between thermal efficiency and emission characteristics. Leveraging hydrogen’s broad flammability limits, the combustion system can implement a lean combustion strategy coupled with an elevated compression ratio design [17]. This technical approach not only extends the lean-burn operating envelope but also enhances knock resistance—a critical advantage that fundamentally improves thermodynamic cycle efficiency and holds significant engineering value for advanced combustion system development.
This study aims to investigate the effects of compression ratio and excess air ratio on the performance and combustion characteristics of hydrogen engines under lean-burn conditions. A one-dimensional hydrogen engine simulation model was established using GT-POWER v2022 software to achieve this goal. The turbocharger and engine were initially calibrated based on experimental data to validate the model’s accuracy. Subsequently, the impacts of compression ratio and excess air ratio on various parameters including volumetric efficiency, indicated mean effective pressure, indicated thermal efficiency, torque, power, specific fuel consumption, NOx emissions, exhaust temperature, and the combustion process were studied. Furthermore, the influence of compression ratio on the lean-burn limit was explored. This research aims to enhance the performance of direct-injection hydrogen internal combustion engines and provide combustion control strategies.

2. Materials and Methods

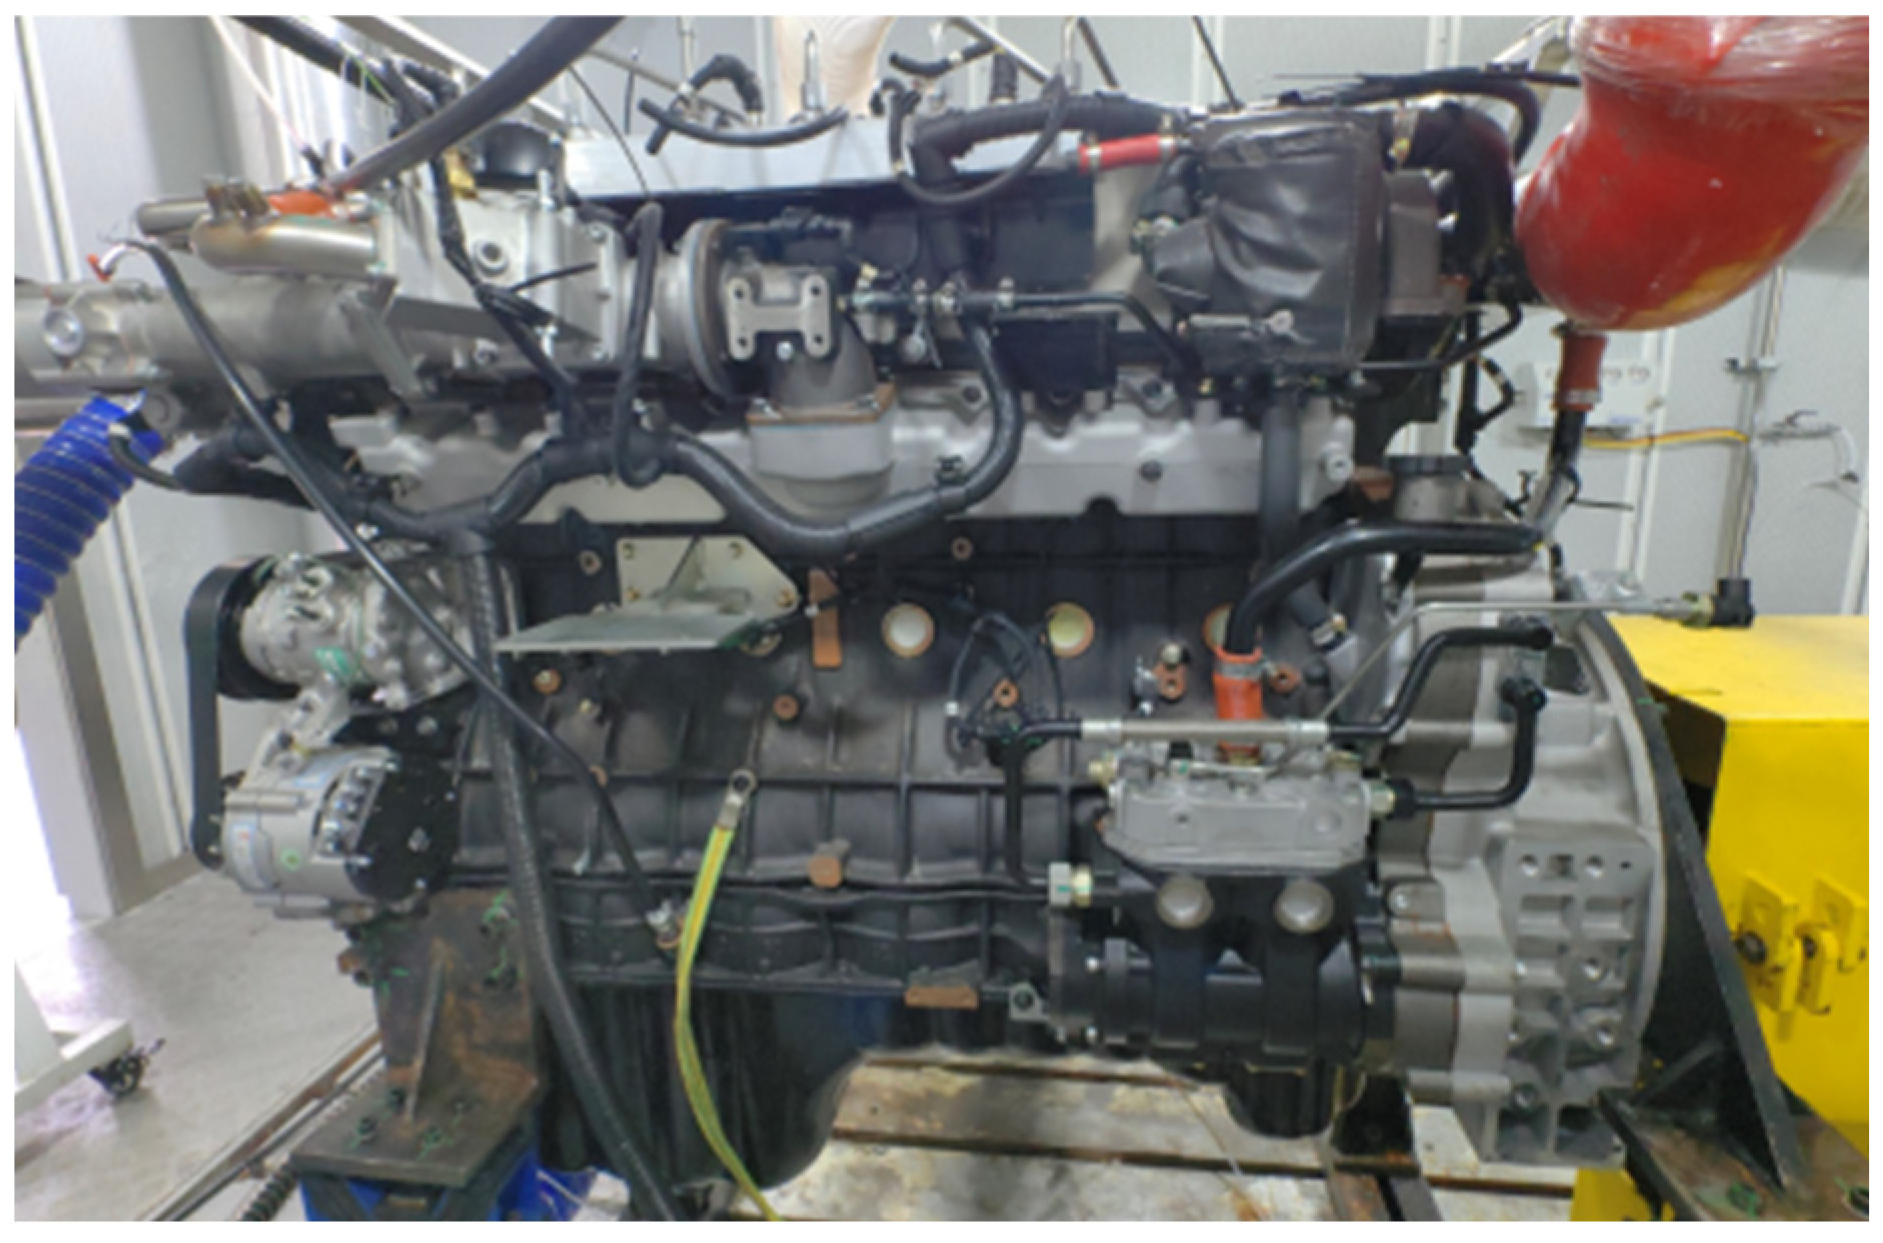
2.1. Experiment Setup

The experiments were conducted on a six-cylinder, four-stroke, turbocharged direct-injection hydrogen internal combustion engine equipped with an AMP 280-4C electric dynamometer (0–3200 rpm speed range) and a T40-F flange torque sensor for torque measurement. The engine featured an adjustable compression ratio (8:1–15:1, mechanically set to 9, 11, and 13 during testing), a displacement of 12.82 L, and a Bosch HDi-800 high-pressure direct injection system. Hydrogen was supplied from a 70 MPa storage tank through a Sierra C100 mass flow controller (±0.5% RD accuracy), while air intake was regulated by a Bronkhorst EL-FLOW Select thermal mass flowmeter (0–500 SLM range) in a closed-loop system. Tests were performed under controlled ambient (25 ± 1 °C) and coolant (80 °C) temperatures, with fixed ignition timing (15 °CA BTDC) and injection pressure (200 bar). λ spanned 1.0–5.0 in 0.5 increments. In-cylinder pressure was measured using a Kistler 6125C high-frequency sensor (0–250 bar range) sampled at 0.1 °CA resolution (±0.1% FS accuracy), complemented by a Horiba MEXA-7100DEGR multi-component analyzer for exhaust emissions (H2, NOx, COx; NOx resolution: 1 ppm). Engine speed was tracked via a Hengstler RVI58 photoelectric encoder, exhaust temperature monitored with an Omega KQXL-12G-K thermocouple, and data were collected over 50 consecutive cycles after 5-min stabilization periods. Each condition was tested thrice for statistical reliability, with trials terminated if the coefficient of variation of indicated mean effective pressure (COV_IMEP) exceeded 10% or abnormal combustion occurred. The main parameters of the engine are shown in Table 1. Figure 1 depicts the photograph of the test engine.

2.2. Numerical Models

2.2.1. One-Dimensional Simulation Model of Engine

Figure 2 provides a detailed, one-dimensional representation of a sophisticated six-cylinder, four-stroke, direct injection, turbocharged hydrogen internal combustion engine. The model itself is quite comprehensive, and it includes multiple components that play pivotal roles in the engine’s function. These components range from the intake and exhaust manifolds, which are integral to the intake and exhaust processes, to the valves that regulate the inflow and outflow of gases, the throttle that controls the engine’s power, the hydrogen injector that facilitates the injection of hydrogen, and the turbocharger that boosts the engine’s performance. The model also includes a cylinder, which is the chamber in which combustion occurs, and the crank-connecting rod mechanism, which is responsible for converting the linear motion of the piston into the rotational motion of the crankshaft. To enhance the realism of the model, monitoring points have been strategically positioned within the cylinder. These points enable the in-cylinder pressure and temperature to be observed closely, thereby providing critical insights into the engine’s performance. The model is no simple construct; it is established using the industry-standard GT-POWER v2022 software. This software is renowned for its capability to create intricate models that reflect real-world scenarios. In the creation of this model, Woschni’s heat transfer correlation, a highly regarded and validated correlation, was incorporated [18]. In GT-POWER, the implementation steps of the Woschni model are as follows:
  • Based on experimental data (such as cylinder pressure curves and exhaust temperature), the correction coefficient C1 related to the combustion phase and the heat transfer multiplier are adjusted. Through iterative optimization, the simulated in-cylinder temperature and pressure are matched with the experimental values.
  • C1 is dynamically adjusted according to the combustion phase (compression, combustion, expansion) to reflect the rapid heat release characteristics of hydrogen combustion. Considering hydrogen’s high thermal diffusivity, the heat transfer multiplier is set to 0.9–1.1 to correct the deviation of the traditional model for hydrogen.
  • The convective heat transfer coefficient in the cylinder is calculated using the Woschni model and then substituted into the energy conservation equation to calculate the in-cylinder temperature distribution and wall heat loss.
The correction coefficient C1 is dynamically correlated with piston velocity and turbulence intensity, which is applicable to the high-turbulence environment of hydrogen combustion (such as strong turbulence caused by a direct-injection strategy). As shown in Figure 3a, the R2 value between the simulated and experimental cylinder pressure curves is greater than 0.98, which validates the prediction capability of the heat transfer model for combustion phasing. This correlation offers a precise calculation of heat transfer rates, a crucial aspect of internal combustion engines. Additionally, the model employs the concept of two-zone combustion to simulate the engine’s behavior. This concept divides the combustion process into two zones, the premix zone and the diffusion zone, allowing for a more accurate simulation of the combustion process. It is important to note that the model’s validity is contingent on the accuracy of the input data and the appropriateness of the selected correlations. To ensure the model’s accuracy, the intake and exhaust pipes, as well as the intake and exhaust manifolds of the engine model, were meticulously modeled in complete alignment with the actual engine scenario. The SIWiebe model is utilized for simulating the combustion process, and its validity is subsequently verified through experimental data. It is noteworthy that when utilizing the SIWiebe and Woschni heat transfer models to investigate the combustion and heat transfer processes, it is crucial to ensure the accuracy of the models by incorporating real experimental data as input parameters. Specifically, data such as intake manifold pressure, intake manifold temperature, hydrogen mass flow rate, and injection phase must be used. Based on these inputs, the heat release rate is calculated, which in turn provides the necessary parameters for the SIWiebe model. Furthermore, the temperatures of the cylinder wall, cylinder head, and piston are input as experimental data, ensuring a holistic representation of the engine’s conditions.
The GT-POWER flow modeling framework fundamentally relies on solving the Navier–Stokes equations through one-dimensional resolution of continuity, momentum, and energy conservation principles [19].

2.2.2. Combustion Model

In GT-POWER software, the Wiebe function is indeed widely used to simulate the heat release characteristics during the engine combustion process. This method approximates the relationship between combustion rate and crankshaft angle through a mathematical formula, effectively characterizing the phased features of both premixed and diffusion combustion. The formula is presented as follows:
  d Q d θ = α m + 1 Δ θ ( θ θ 0 Δ θ ) m e [ α ( θ θ 0 Δ θ ) m + 1 ]
The cumulative heat release is denoted by  Q   θ  represents the current crank angle;  θ 0  indicates the combustion initiation angle;  Δ θ  corresponds to the combustion duration (span in crank angle degrees);    m  is the shape factor governing the steepness of the combustion rate curve; and    α  denotes the combustion efficiency factor, typically set to 6.908 to ensure 99.9% of the fuel is consumed within  Δ θ  [20]. In GT-POWER, the implementation steps of the Wiebe model are as follows: Based on the experimental cylinder pressure curve (Figure 3a), the values of θ0, Δθ, and m are determined through nonlinear fitting. The value of m is set between 2.5 and 3.0. Separate Wiebe functions are defined for premixed combustion (turbulent flame propagation) and diffusion combustion (after burning). These functions are then weighted and superimposed before being incorporated into the energy equation to calculate the instantaneous heat release rate. The Wiebe function flexibly characterizes the short duration and high heat release rate of hydrogen combustion through the exponential term (θθ0)/Δθ and the shape factor m. The Wiebe function, through the combination of exponential and power-law terms, provides a mathematical description of the typical heat release pattern characterized by slow initial growth, rapid mid-stage release, and gradual decay in the later phase of combustion. This function is an essential tool for the calibration and optimization of combustion systems.

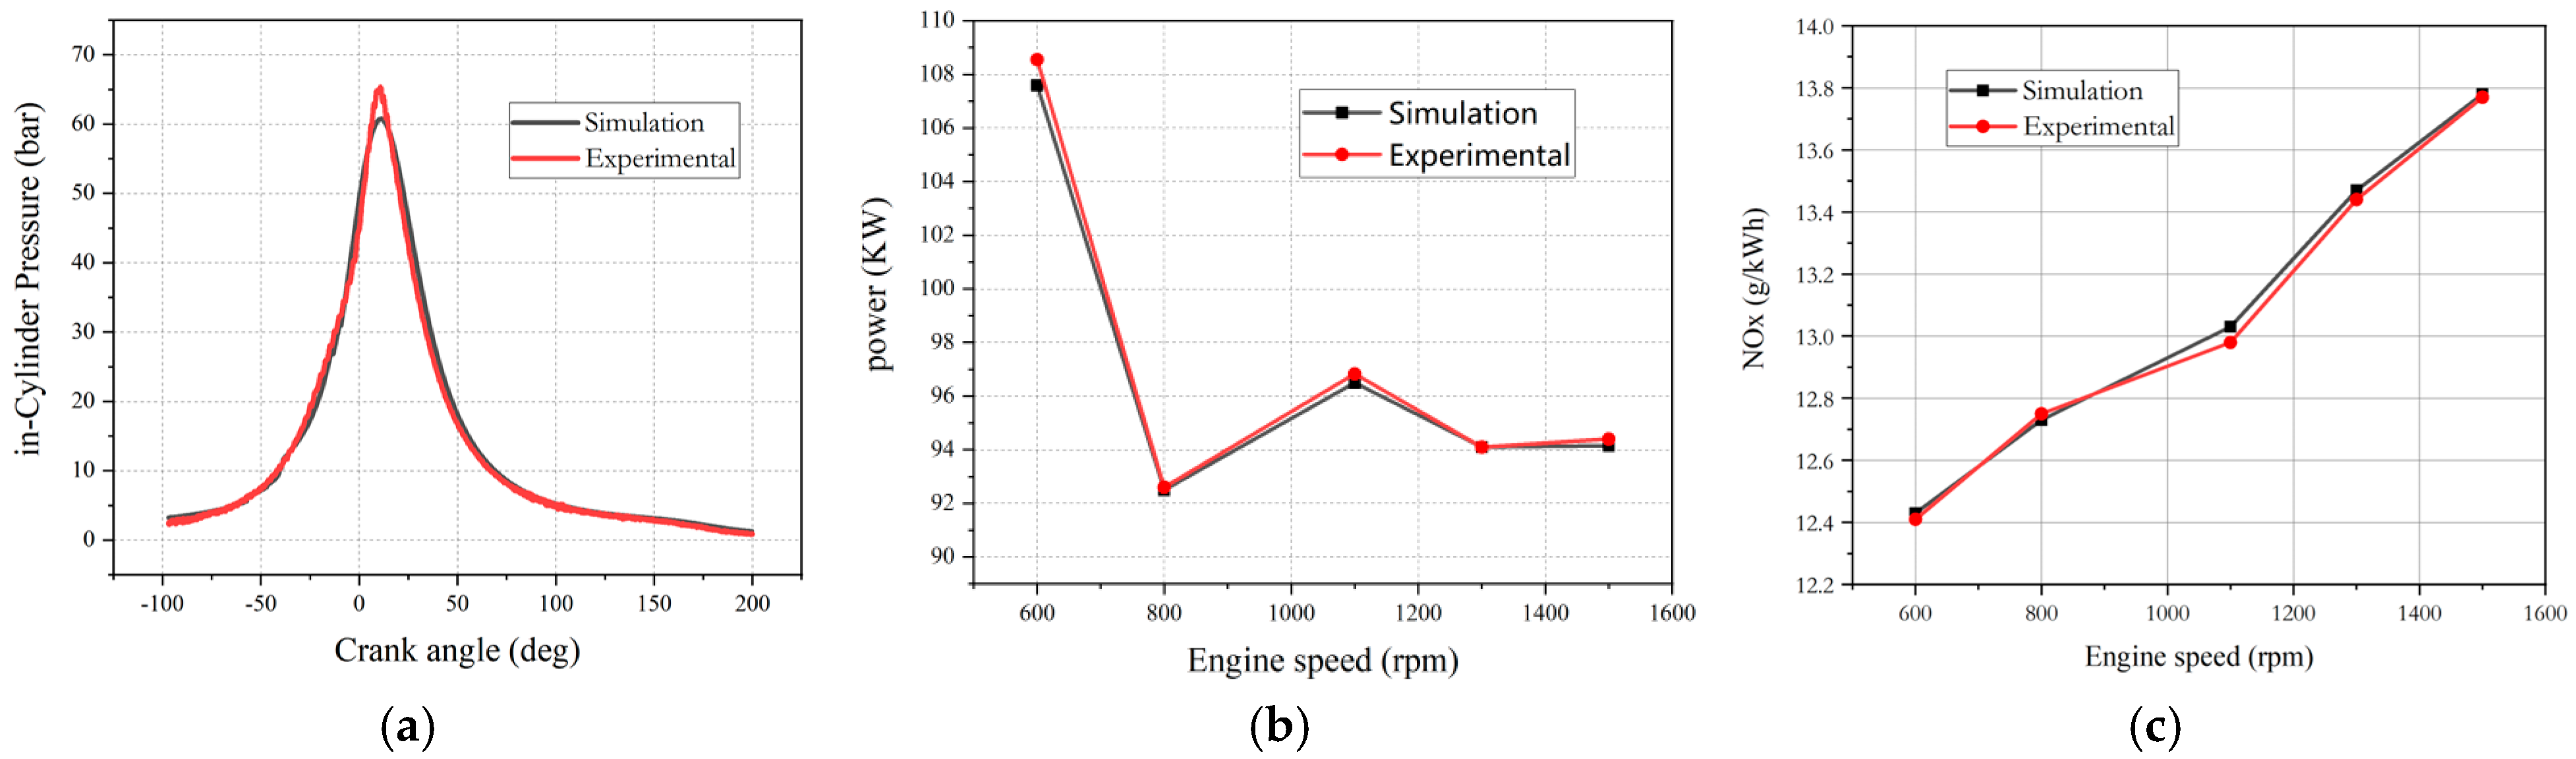
2.3. Model Validation

Due to the insufficient number of boundary conditions employed in experimental data, ensuring the accuracy of the one-dimensional model is critical for investigating performance variations of this hydrogen engine under different conditions. Initially, the turbocharger was calibrated under an ambient pressure of 0.6 bar and temperature of 313 K. For compressor calibration, the turbine is removed, and the compressor is driven at an experimental rotational speed using the “SpeedBoundaryRot” module. The actual intake flow rate after supercharging is compared with the simulated value. By continuously adjusting various parameters until the simulated value approaches the experimental value, the calibration of the compressor is completed. Calibration of the overall engine model necessitates validation based on combustion simulation. In this study, validation was conducted through engine experiments at 1500 rpm, mean effective pressure of 0.6 bar, excess air coefficient λ of 1.5, and a temperature of 313 K. After completing turbocharger calibration, experimental data including intake manifold pressure, temperature, hydrogen mass flow rate, and combustion duration were input into the model. Parameters were continuously adjusted based on errors between simulation results and experimental values until errors fell within an acceptable range. Figure 3 compares simulated and experimental values of in-cylinder pressure (left) and the power (right) of the engine. The accuracy of the engine simulation model can be validated using the goodness-of-fit metric (R2) from statistical methods. The specific formula is presented as follows:
    R 2 = i = 1 n ( y ^ i y ¯ ) 2 i = 1 n ( y i y ¯ ) 2
A higher R-squared coefficient (approaching 1) indicates improved congruence between computational results and experimental measurements [21]. As shown in the figure, the goodness of fit (R2) between the simulated and experimental values of in-cylinder pressure is 0.989, and the R2 for the simulation and experimental values of power is 0.991, and the R2 for the simulation and experimental values of NOx is 0.982. The NOx model was calibrated under experimental bench constraints: Initial wall temperature, intake pressure (0.6 bar), and coolant temperature (80 °C) were fixed according to experimental measurements without manual modification. The Woschni heat transfer coefficient C1 was dynamically optimized by matching in-cylinder pressure traces (R2 > 0.98), while parameters in the Zeldovich mechanism were iteratively adjusted within physically permissible ranges (±10% of default values) using 15 experimental datasets (λ = 1–3). The calibrated model achieved a NOx prediction deviation < 8% (R2 = 0.982) within the tested operating range. For ultra-lean conditions (λ > 3), predictions were extrapolated based on exhaust temperature trends and cross-validated to avoid overfitting. Based on these results, it can be concluded that the simulation outcomes are basically consistent with the experimental results. The reliance on simulation results stems from experimental limitations in safely exploring ultra-lean (λ > 2.5) and high compression ratio (CR > 11) conditions due to risks of misfire, knock, and hardware damage. While experimental data validated the model’s accuracy, simulations enabled systematic, risk-free analysis of 45 parameter combinations (3 CR × 15 λ) with 0.1 °CA resolution, providing insights beyond physical testing constraints.

3. Results and Discussion

To facilitate readers’ understanding of the effects of CR and λ on performance metrics, Table 2 (a comparative summary of performance metrics (ITE, BSFC, peak pressure, emissions) under different compression ratios) has been added.

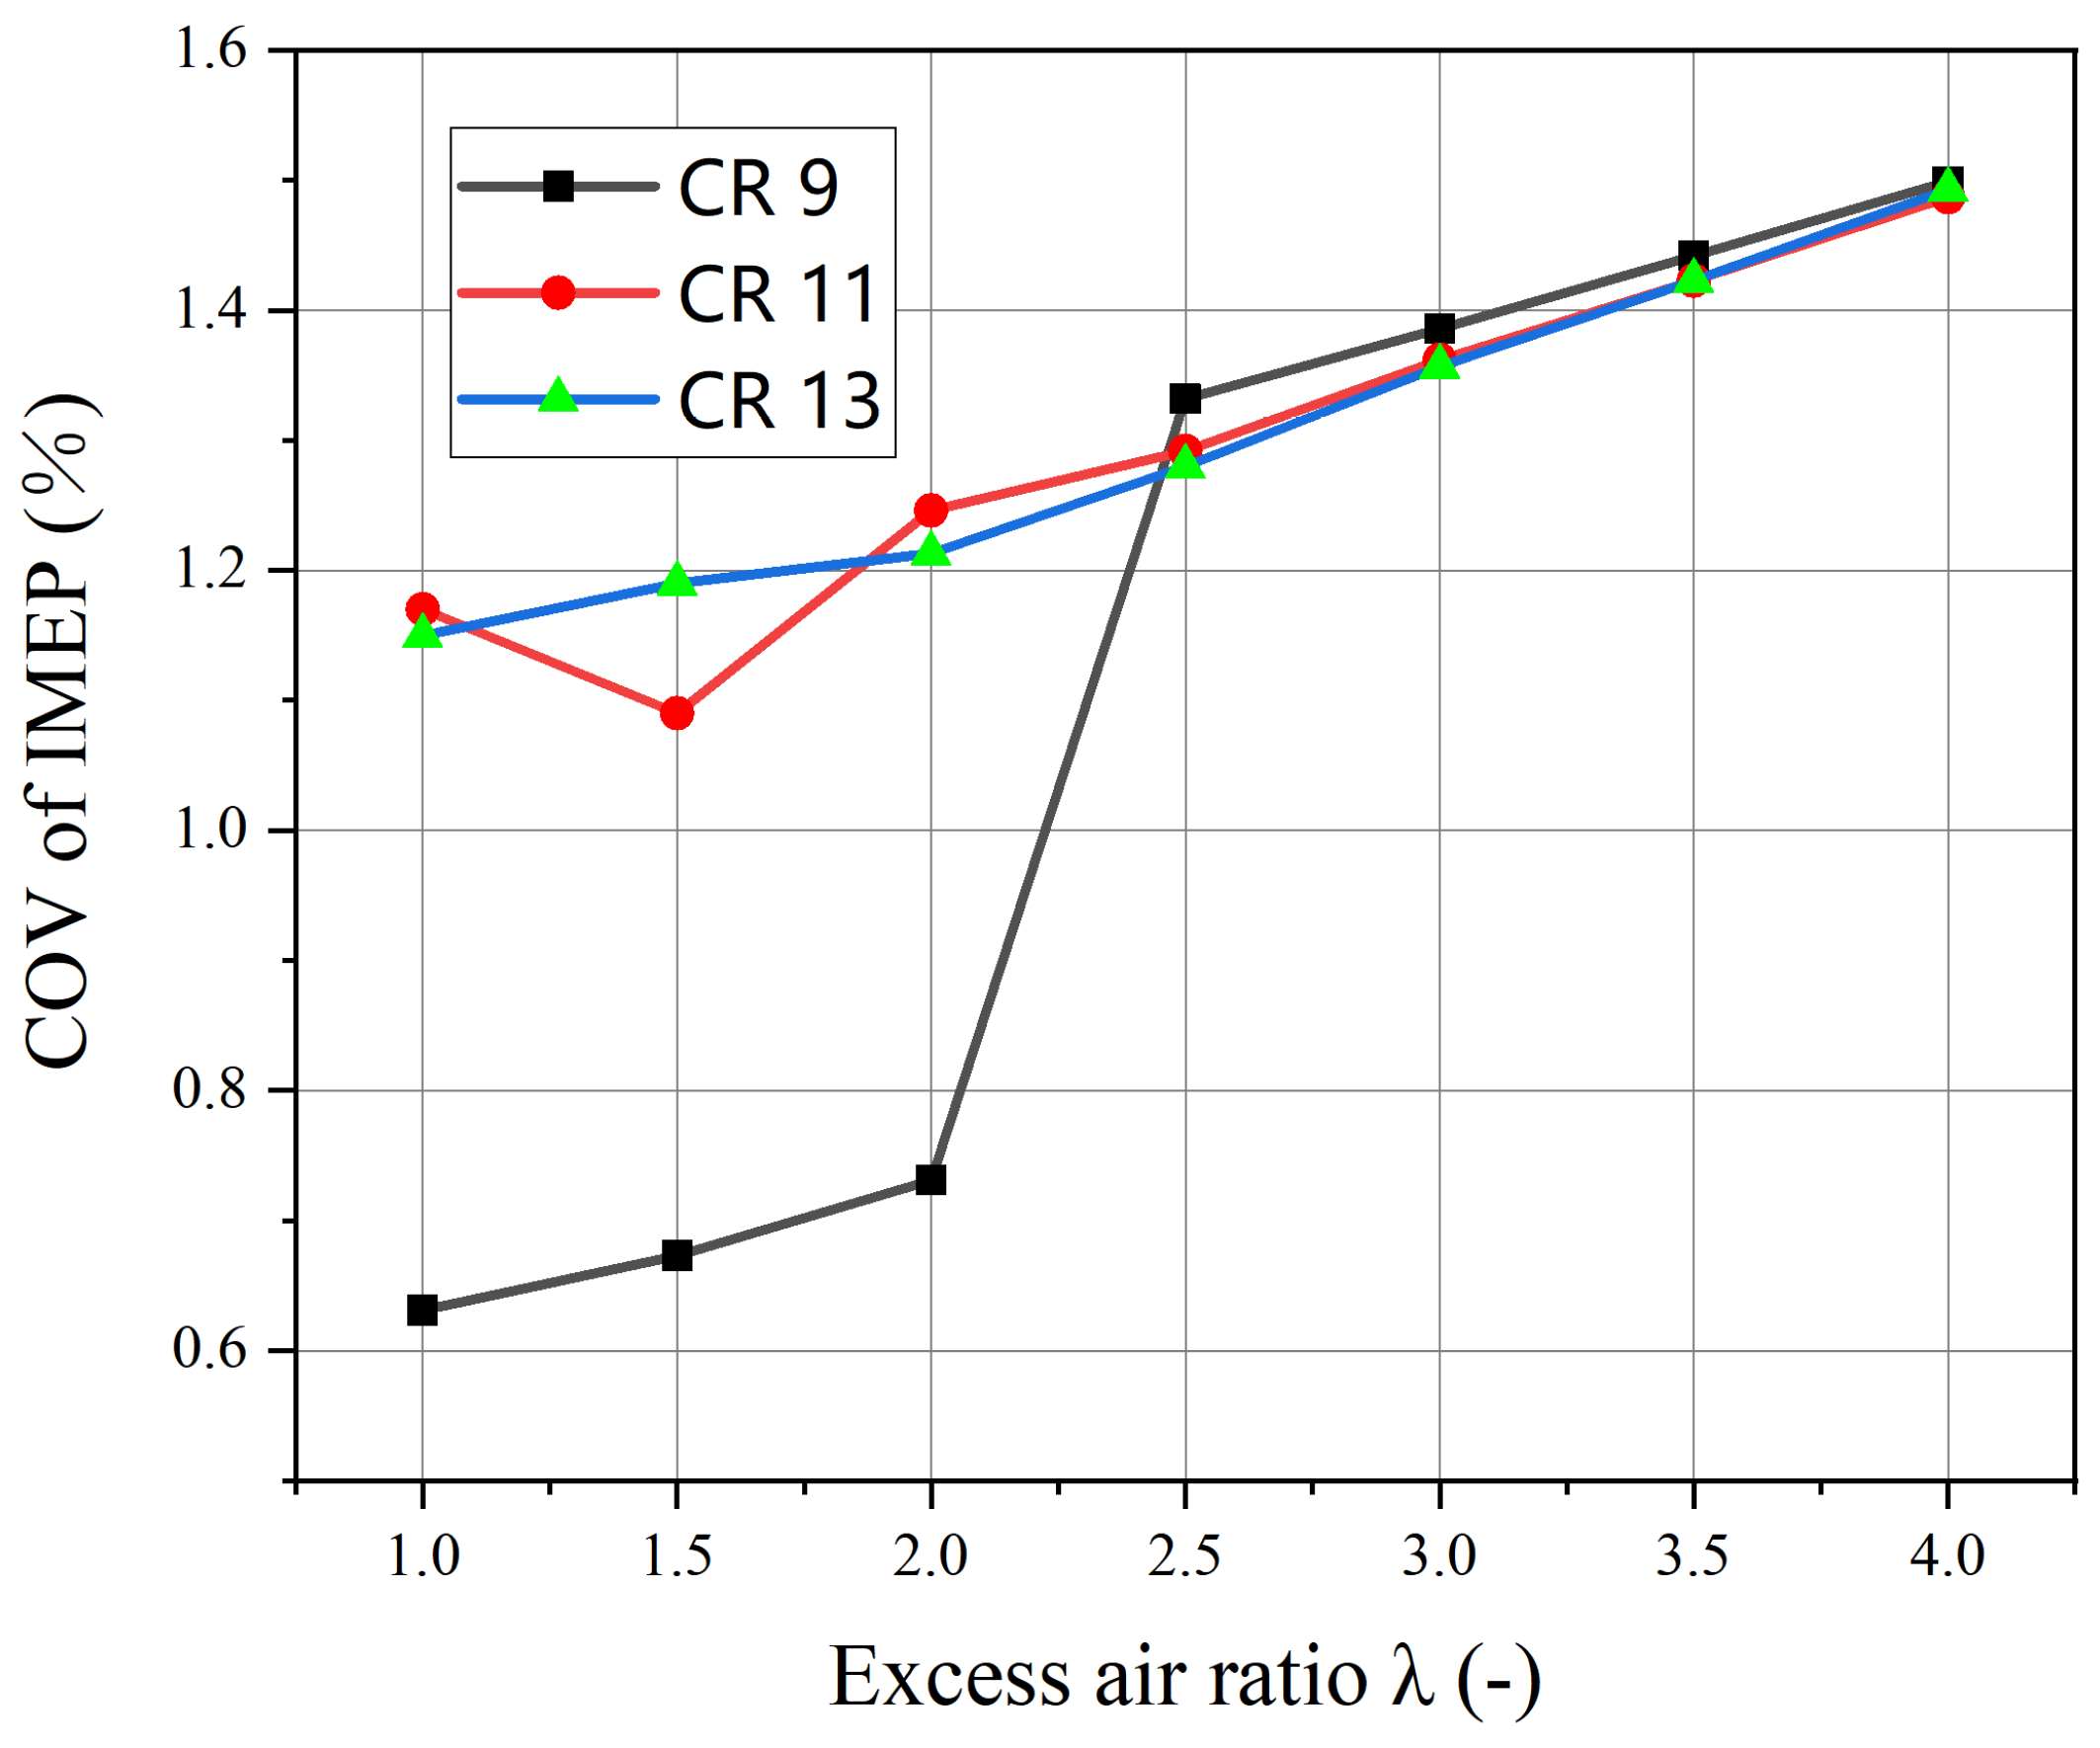
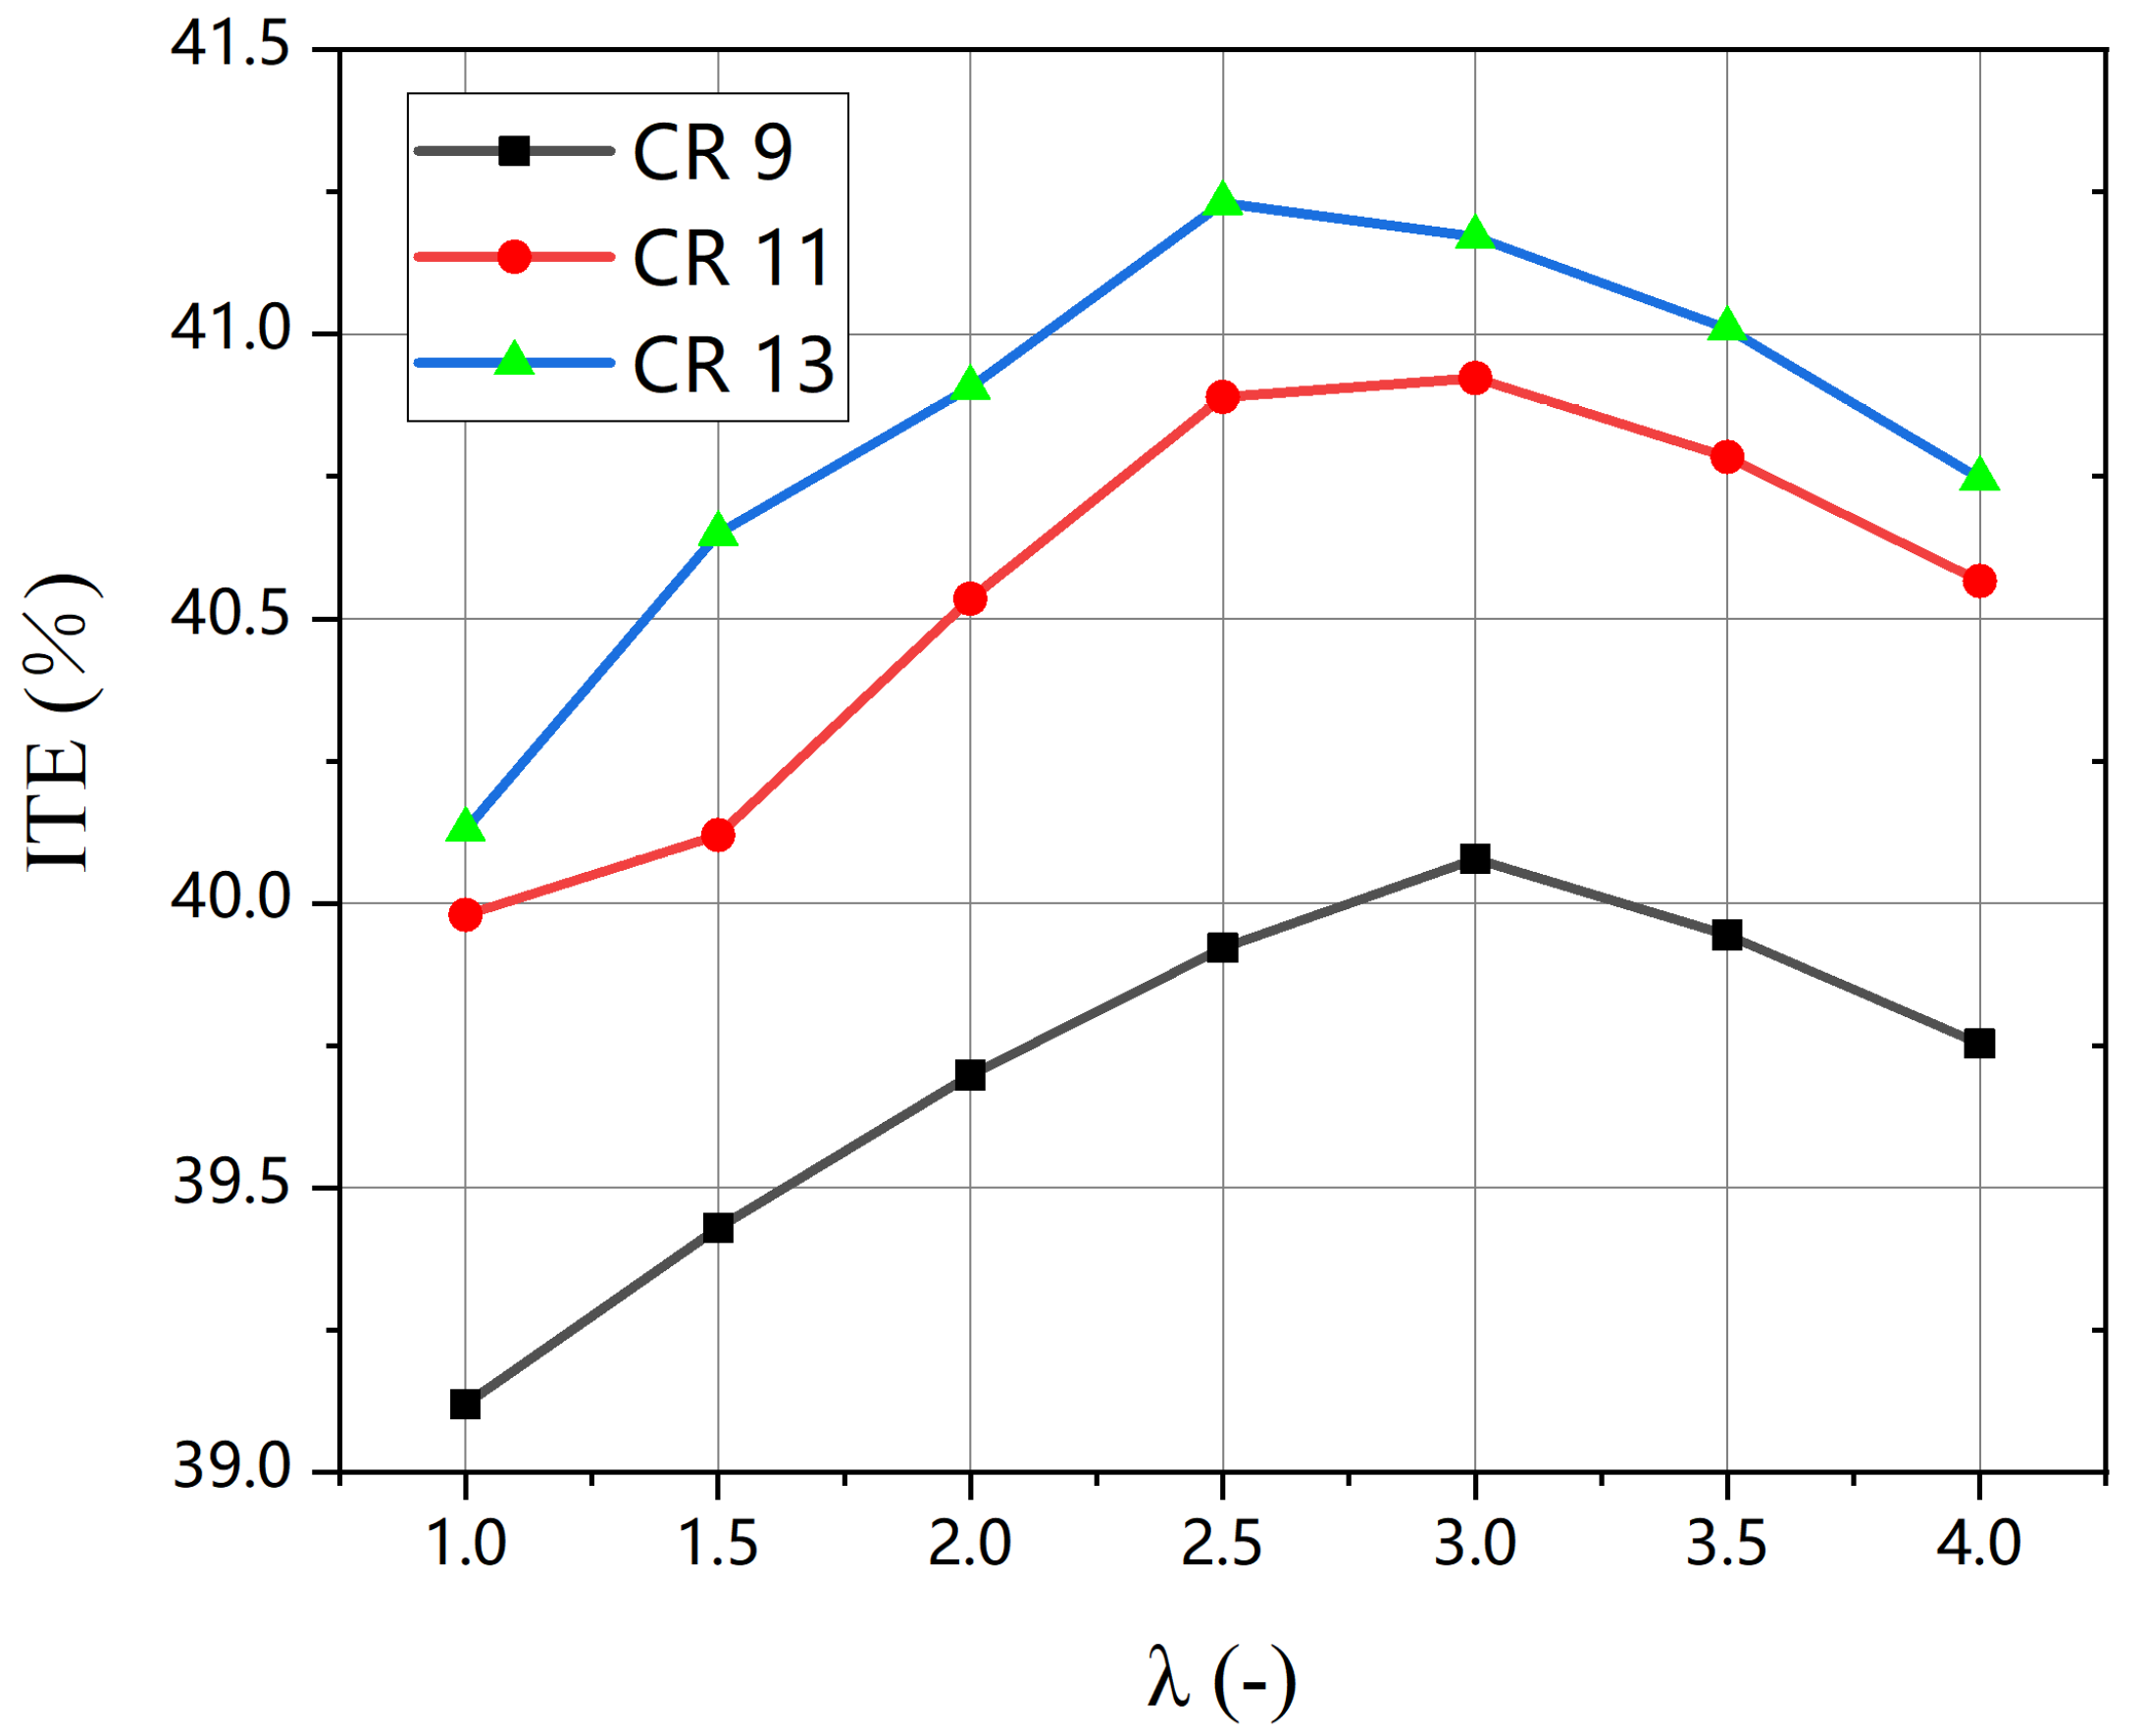
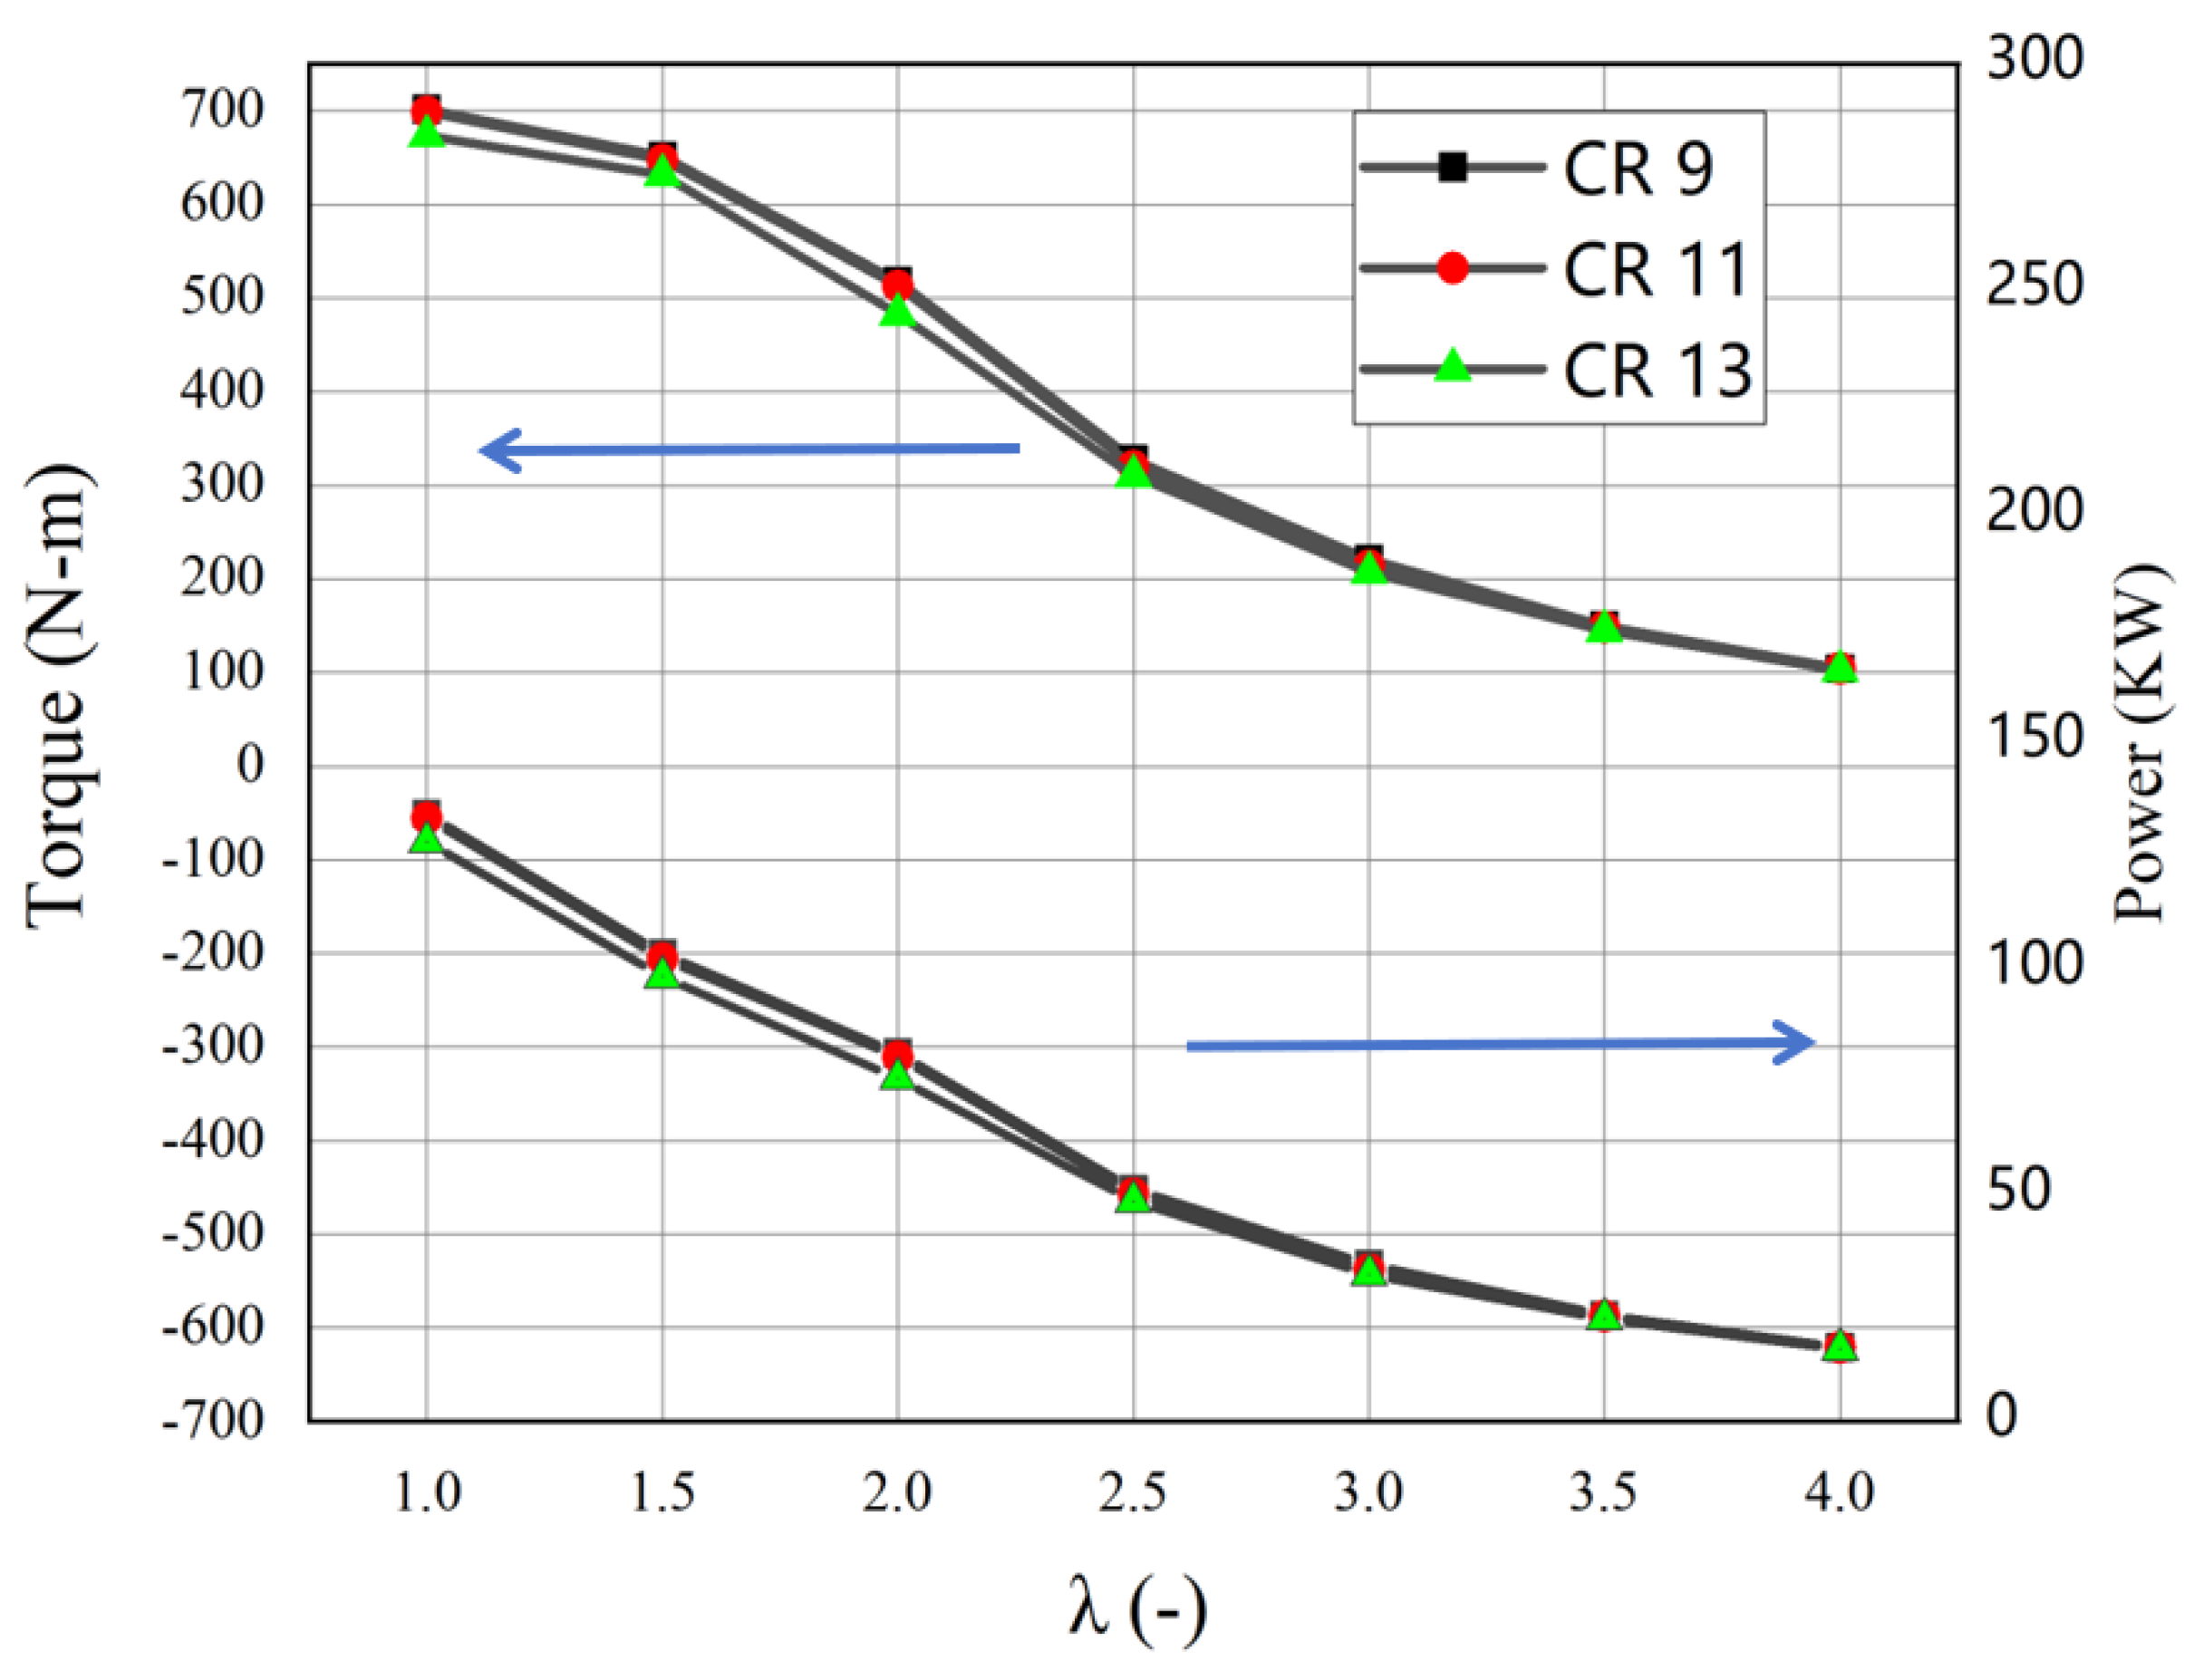
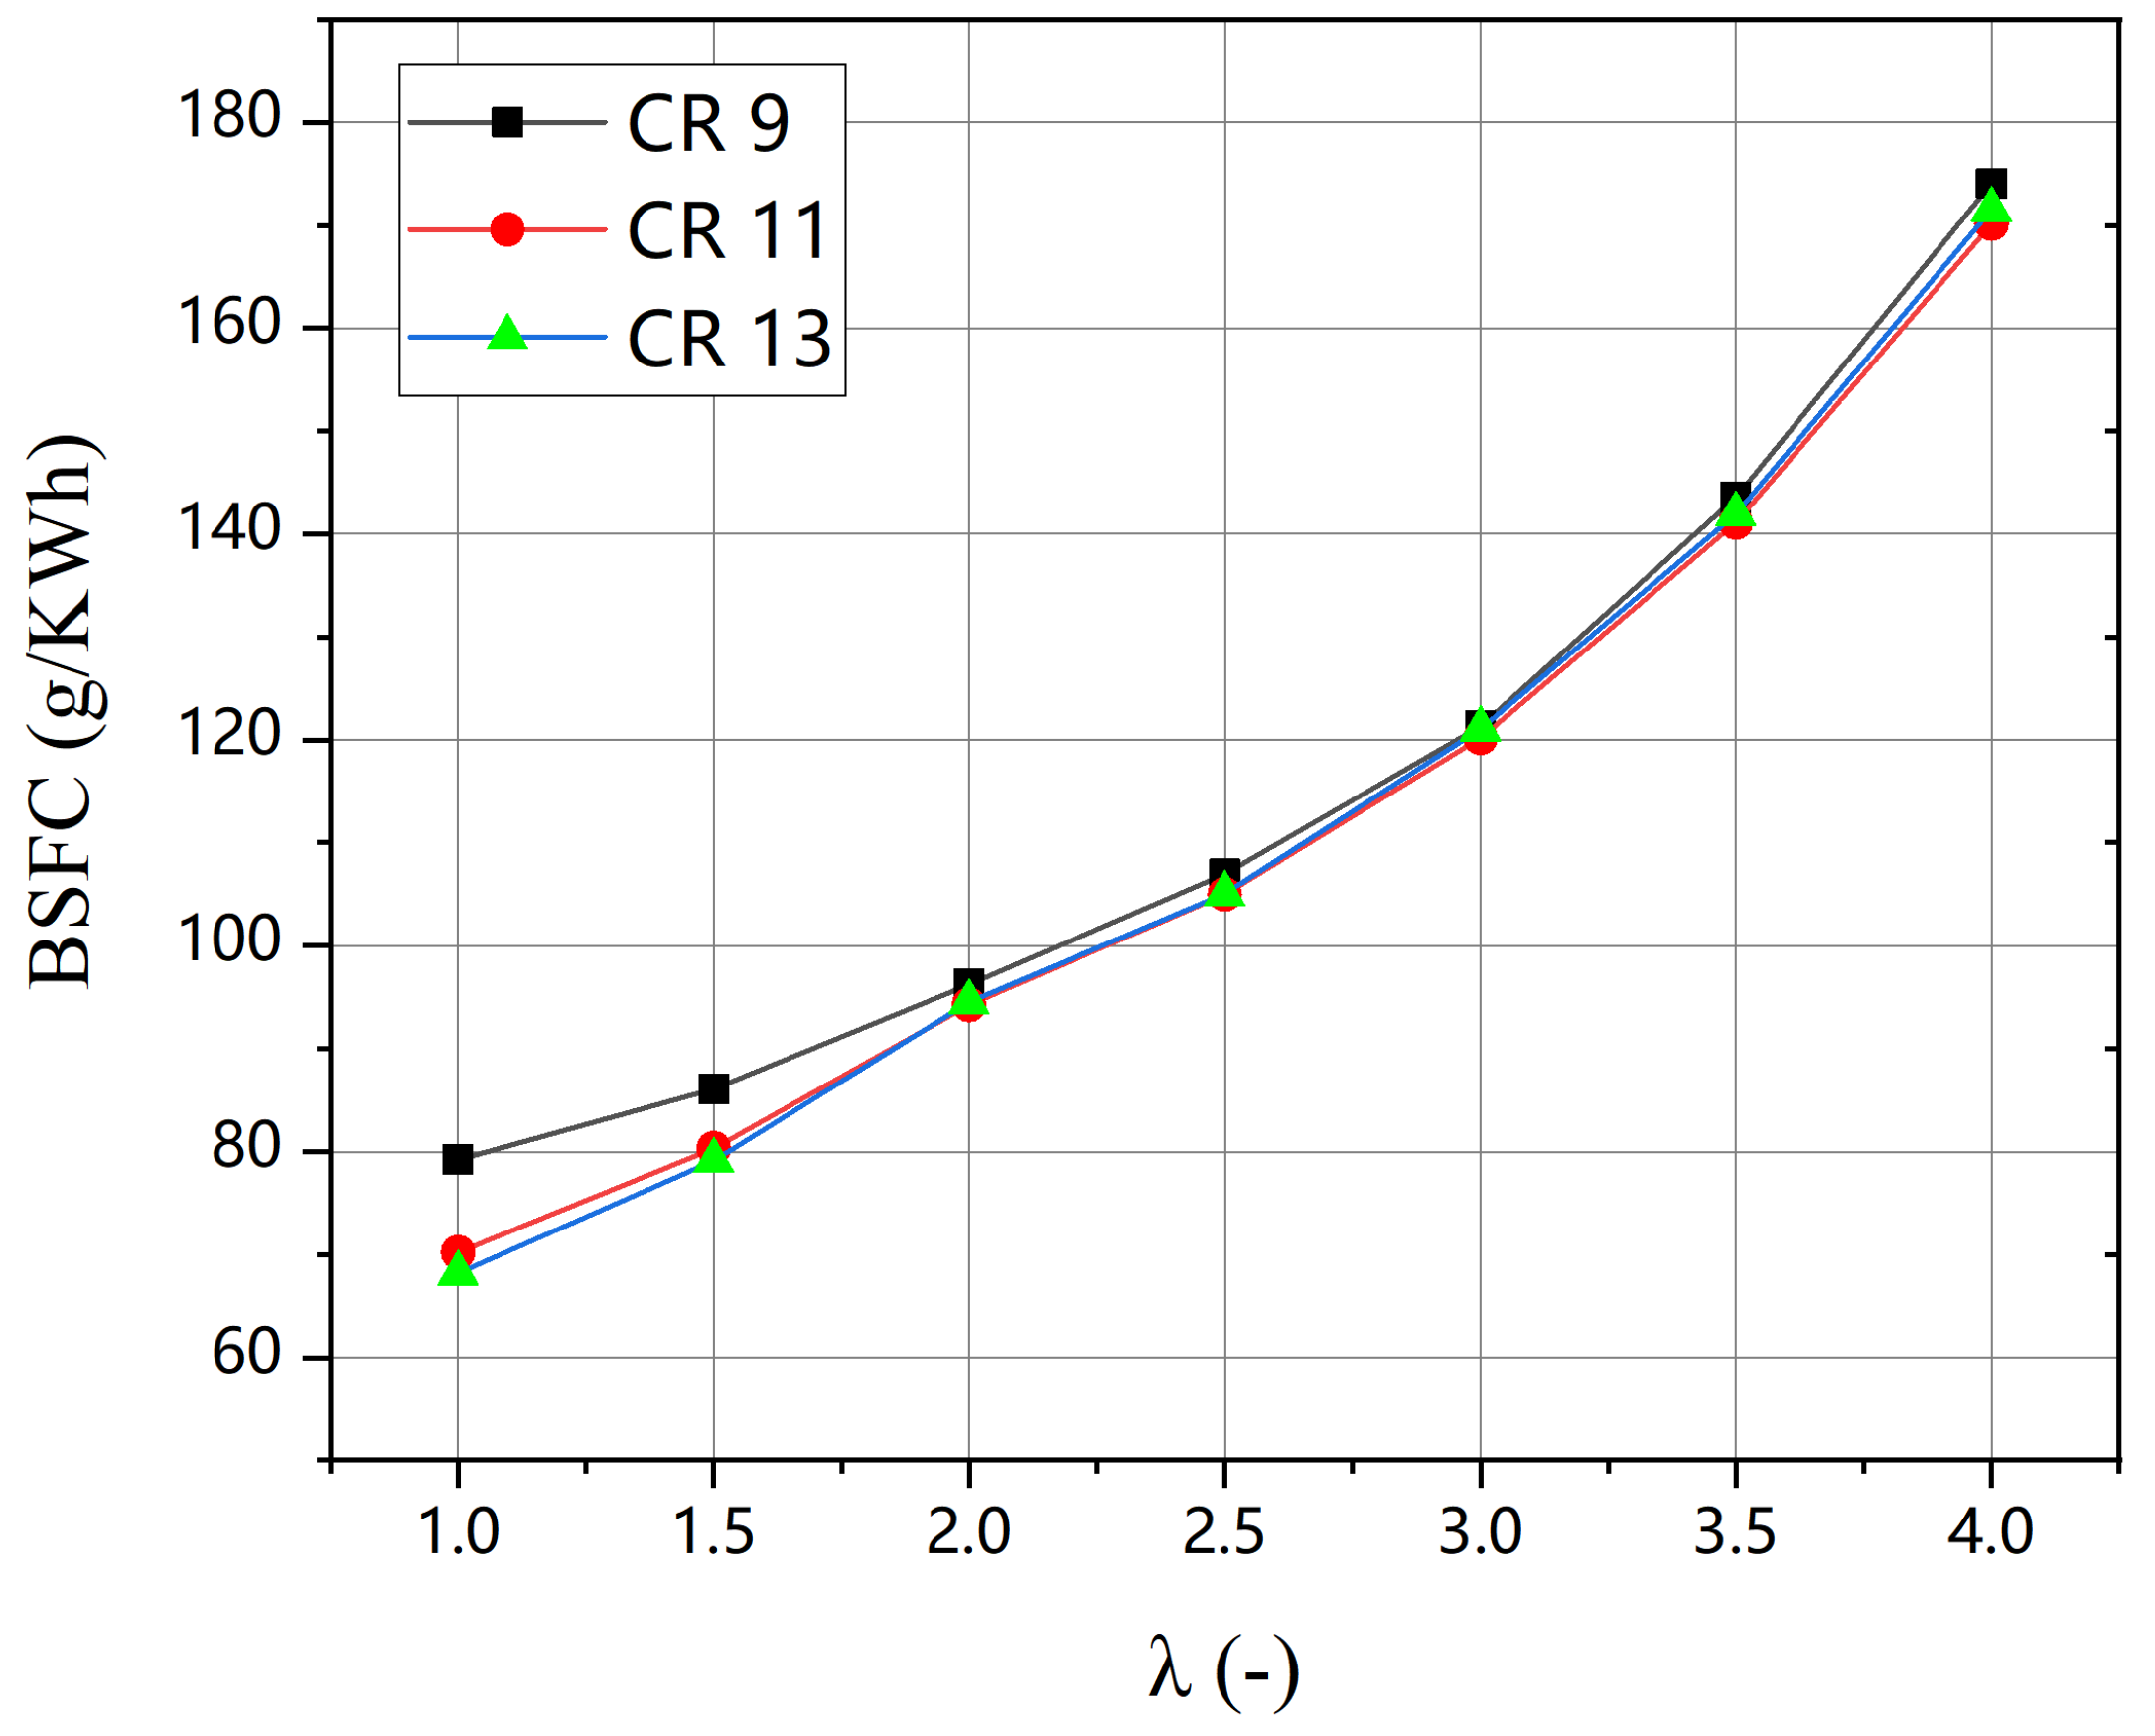
3.1. Engine Performance

The present study comprehensively investigates the operational characteristics of the engine across varying λ, a key parameter determining combustion dynamics, under compression ratios of 9, 11, and 13. These compression ratios are consistent with those used in the experimental settings to ensure the accuracy of the simulation model. As depicted in Figure 4, the volumetric efficiency (VE), a key indicator of air intake performance, exhibits a pronounced dependency on λ under the predefined experimental configuration (intake pressure: 0.6 bar). A notable trend emerges wherein volumetric efficiency (VE) progressively declines as the λ increases from lean combustion conditions. The peak VE value coincides with stoichiometric combustion (λ = 1), aligning with theoretical expectations of optimal air utilization under balanced reactant proportions [22]. To illustrate, at a CR of 9, the maximum volumetric efficiency can reach 89.7%, a high efficiency rate indicating optimized engine performance. However, the minimum volumetric efficiency decreases to a lower rate of approximately 55%, signifying a substantial decrease of about 35%. This noteworthy decrease can be attributed to the fact that, although an increased excess air ratio positively impacts hydrogen combustion, facilitating complete combustion, the excessive air entering the intake port and the elevated gas flow velocity resulting from this complete combustion both contribute to the formation of turbulence or vortices in the intake system. These turbulences or vortices, in turn, increase the flow resistance, making it harder for air to enter the cylinder smoothly and ultimately reducing the volumetric efficiency of the engine [23]. Moreover, this decrease in volumetric efficiency becomes more pronounced as the compression ratio increases for the same λ. This is because the elevated cylinder pressure and temperature, which are inherent consequences of a higher compression ratio, create a greater impedance to the inflow of the air–fuel mixture into the cylinder, thereby reducing volumetric efficiency. These findings underscore the complex interplay of parameters in determining engine performance and highlight the need for precise control of air–fuel ratios for optimal engine functioning [24]. Compared with the hydrogen internal combustion engine with a CR of 10 in reference [13], the volumetric efficiency peak at λ = 1 in this study with CR = 13 (89.7%) is significantly higher than the reported value (82.3%), which is attributed to the optimized design of the turbocharging system. However, when λ > 3, the rate of decrease in volumetric efficiency (ΔVE/Δλ = −8.2%) is consistent with the observation by Nguyen et al. [13] (−7.5%), which validates the amplifying effect of the high compression ratio on the flow resistance of lean mixtures.
Figure 5 and Figure 6, respectively, illustrate the net indicated mean effective pressure (IMEP) and its coefficient of variation (COV) under varying operating conditions. As evidenced in Figure 5, the IMEP attains a maximum value of 8.4 bar under stoichiometric combustion. However, a consistent reduction in IMEP is observed with a rising λ at fixed compression ratios. This trend stems from combustion dynamics: when λ exceeds unity, the augmented air mass inducted into the cylinder dilutes the air–fuel mixture, thereby diminishing charge energy density and combustion stability [25]. Consequently, the combustion speed slows down, resulting in incomplete combustion, which affects the IMEP value. When the excess air ratio λ falls within the range of 1–3, IMEP gradually decreases with a less significant impact. This is because, under conditions of a richer mixture, hydrogen engines face the risks of incomplete combustion and knock. As the compression ratio increases, the temperature and pressure within the cylinder rise rapidly, but due to insufficient oxygen supply, hydrogen cannot be fully burned. This results in the inability to release part of the fuel energy, thus reducing IMEP [26]. Furthermore, a high compression ratio may exacerbate knock phenomena, further diminishing engine efficiency and IMEP. Nevertheless, under lean burn conditions, the situation changes. At this point, the oxygen content in the mixture is relatively high, supporting the combustion of more hydrogen. Therefore, even with an increased compression ratio, the engine can fully utilize these oxygen molecules for combustion, releasing more energy. Furthermore, lean burn itself exhibits lower combustion temperatures and pressures, helping to reduce the risk of knock. Consequently, the compression ratio has a relatively minor impact on the IMEP during lean burn [27]. In the evaluation of combustion stability in engines, the coefficient of variation of the indicated mean effective pressure (IMEP of COV) serves as a critical performance metric. Experimental data demonstrate that combustion processes are deemed stable when this parameter remains below 3% [28]. As shown in Figure 6, the COV of the tested prototype consistently stayed below the 3% threshold across all operating conditions, confirming the reliability of the combustion system and highlighting its superior capability in controlling cyclic variability. When λ > 4, the rate of increase of COV for CR = 13 (0.8%/λ) is significantly lower than that for CR = 9 (1.2%/λ), which is consistent with the conclusion in Ref. [29] that high compression ratios extend the lean-burn limit.
The correlation between indicated thermal efficiency (ITE) and λ is presented in Figure 7. The ITE curve exhibits a unimodal distribution, achieving its maximum value at λ ≈ 2.5 before diminishing at both higher and lower λ ranges. Under fuel-rich conditions (λ < 2.5), the degradation of ITE is primarily attributed to elevated heat transfer losses to combustion chamber walls and incomplete combustion induced by oxygen deficiency. Conversely, over-lean mixtures (λ > 2.5) result in reduced flame propagation rates and increased cyclic variation, collectively impairing thermal efficiency [30]. While lean mixtures (λ > 2.5) demonstrate enhanced specific heat-capacity ratios, this thermodynamic advantage is counterbalanced by progressively diminishing ITE values as λ increases. The efficiency reduction stems from two coupled mechanisms: decelerated flame front propagation that prolongs combustion duration, and amplified cycle-to-cycle variations that compromise energy-conversion consistency [31]. Consequently, emission of unburned hydrogen increases, lowering ITE. This aspect will be further discussed in the subsequent section on emissions. Additionally, as can be observed, as the compression ratio (CR) increases, the ITE of the hydrogen-fueled engine under the same excess air coefficient also rises. Furthermore, with the augmentation of CR, the peak point of ITE shifts towards lower values of λ. This is because an increased compression ratio enhances the temperature and pressure of the mixture within the cylinder. A higher compression ratio enables the fuel to reach a higher temperature and pressure prior to ignition, accelerating the combustion speed and improving combustion efficiency. Additionally, the elevated temperature and pressure contribute to the earlier arrival of the optimal combustion state. Figure 7 illustrates the variation of indicated thermal efficiency (ITE) with the λ. As depicted, ITE peaks at λ ≈ 2.5 and declines on either side. When λ is less than 2.5, the mixture becomes richer, resulting in lower ITE. This is because an overly rich mixture increases wall losses and promotes incomplete combustion, reducing combustion efficiency. Conversely, when λ exceeds 2.5, ITE declines despite increasing the lean-mixture-specific heat-capacity ratio. This is due to the excessively slow combustion speed when the mixture is too lean, leading to incomplete combustion and increased unburned hydrogen emission. This aspect will be further discussed in the subsequent section on emissions. Additionally, as can be observed, ITE increases with the compression ratio (CR) under the same λ. Furthermore, with an increasing CR, the ITE peak shifts towards a lower λ. This is because a higher CR enhances the temperature and pressure within the cylinder, accelerating the combustion speed and improving combustion efficiency. The elevated temperature and pressure also facilitate the earlier arrival of the optimal combustion state. The thermal efficiency of liquefied petroleum gas (LPG) engines typically ranges from 30% to 40% [32]. In contrast to this alternative fuel, hydrogen engines not only achieve higher thermal efficiencies (reaching 42–45%) but also realize true zero emissions, thereby offering significant advantages in reducing air pollution and greenhouse gas emissions [33].
Figure 8 presents the variations of torque and power with the excess air coefficient, while Figure 9 demonstrates the changes in brake-specific fuel consumption (BSFC) as the excess air coefficient varies. As shown in Figure 8, torque and power gradually decrease as the excess air coefficient increases. Furthermore, under the same excess air coefficient, the power and torque values remain relatively consistent across different compression ratios, indicating that the compression ratio has minimal impact on power and torque. Conversely, Figure 9 reveals that fuel consumption initially reaches a minimum and then gradually increases with the increasing excess air coefficient. In conjunction with Figure 7, it can be observed that initial ITE variations are minor, but as the excess air coefficient increases, reaching the state of lean combustion, ITE, torque, power, and BSFC all deteriorate rapidly. Therefore, it can be concluded that excessively low excess air coefficients significantly reduce the fuel economy and power performance of hydrogen-fueled engines. As λ approaches the lean combustion limit, the thermal efficiency, torque, power, and BSFC across all compression ratios decrease significantly. This is attributed to the close proximity of the COV of IMEP values for CR13, CR11, and CR9.The arrow shows that the upper broken line stands for the torque chart, while the lower broken line represents the power chart.

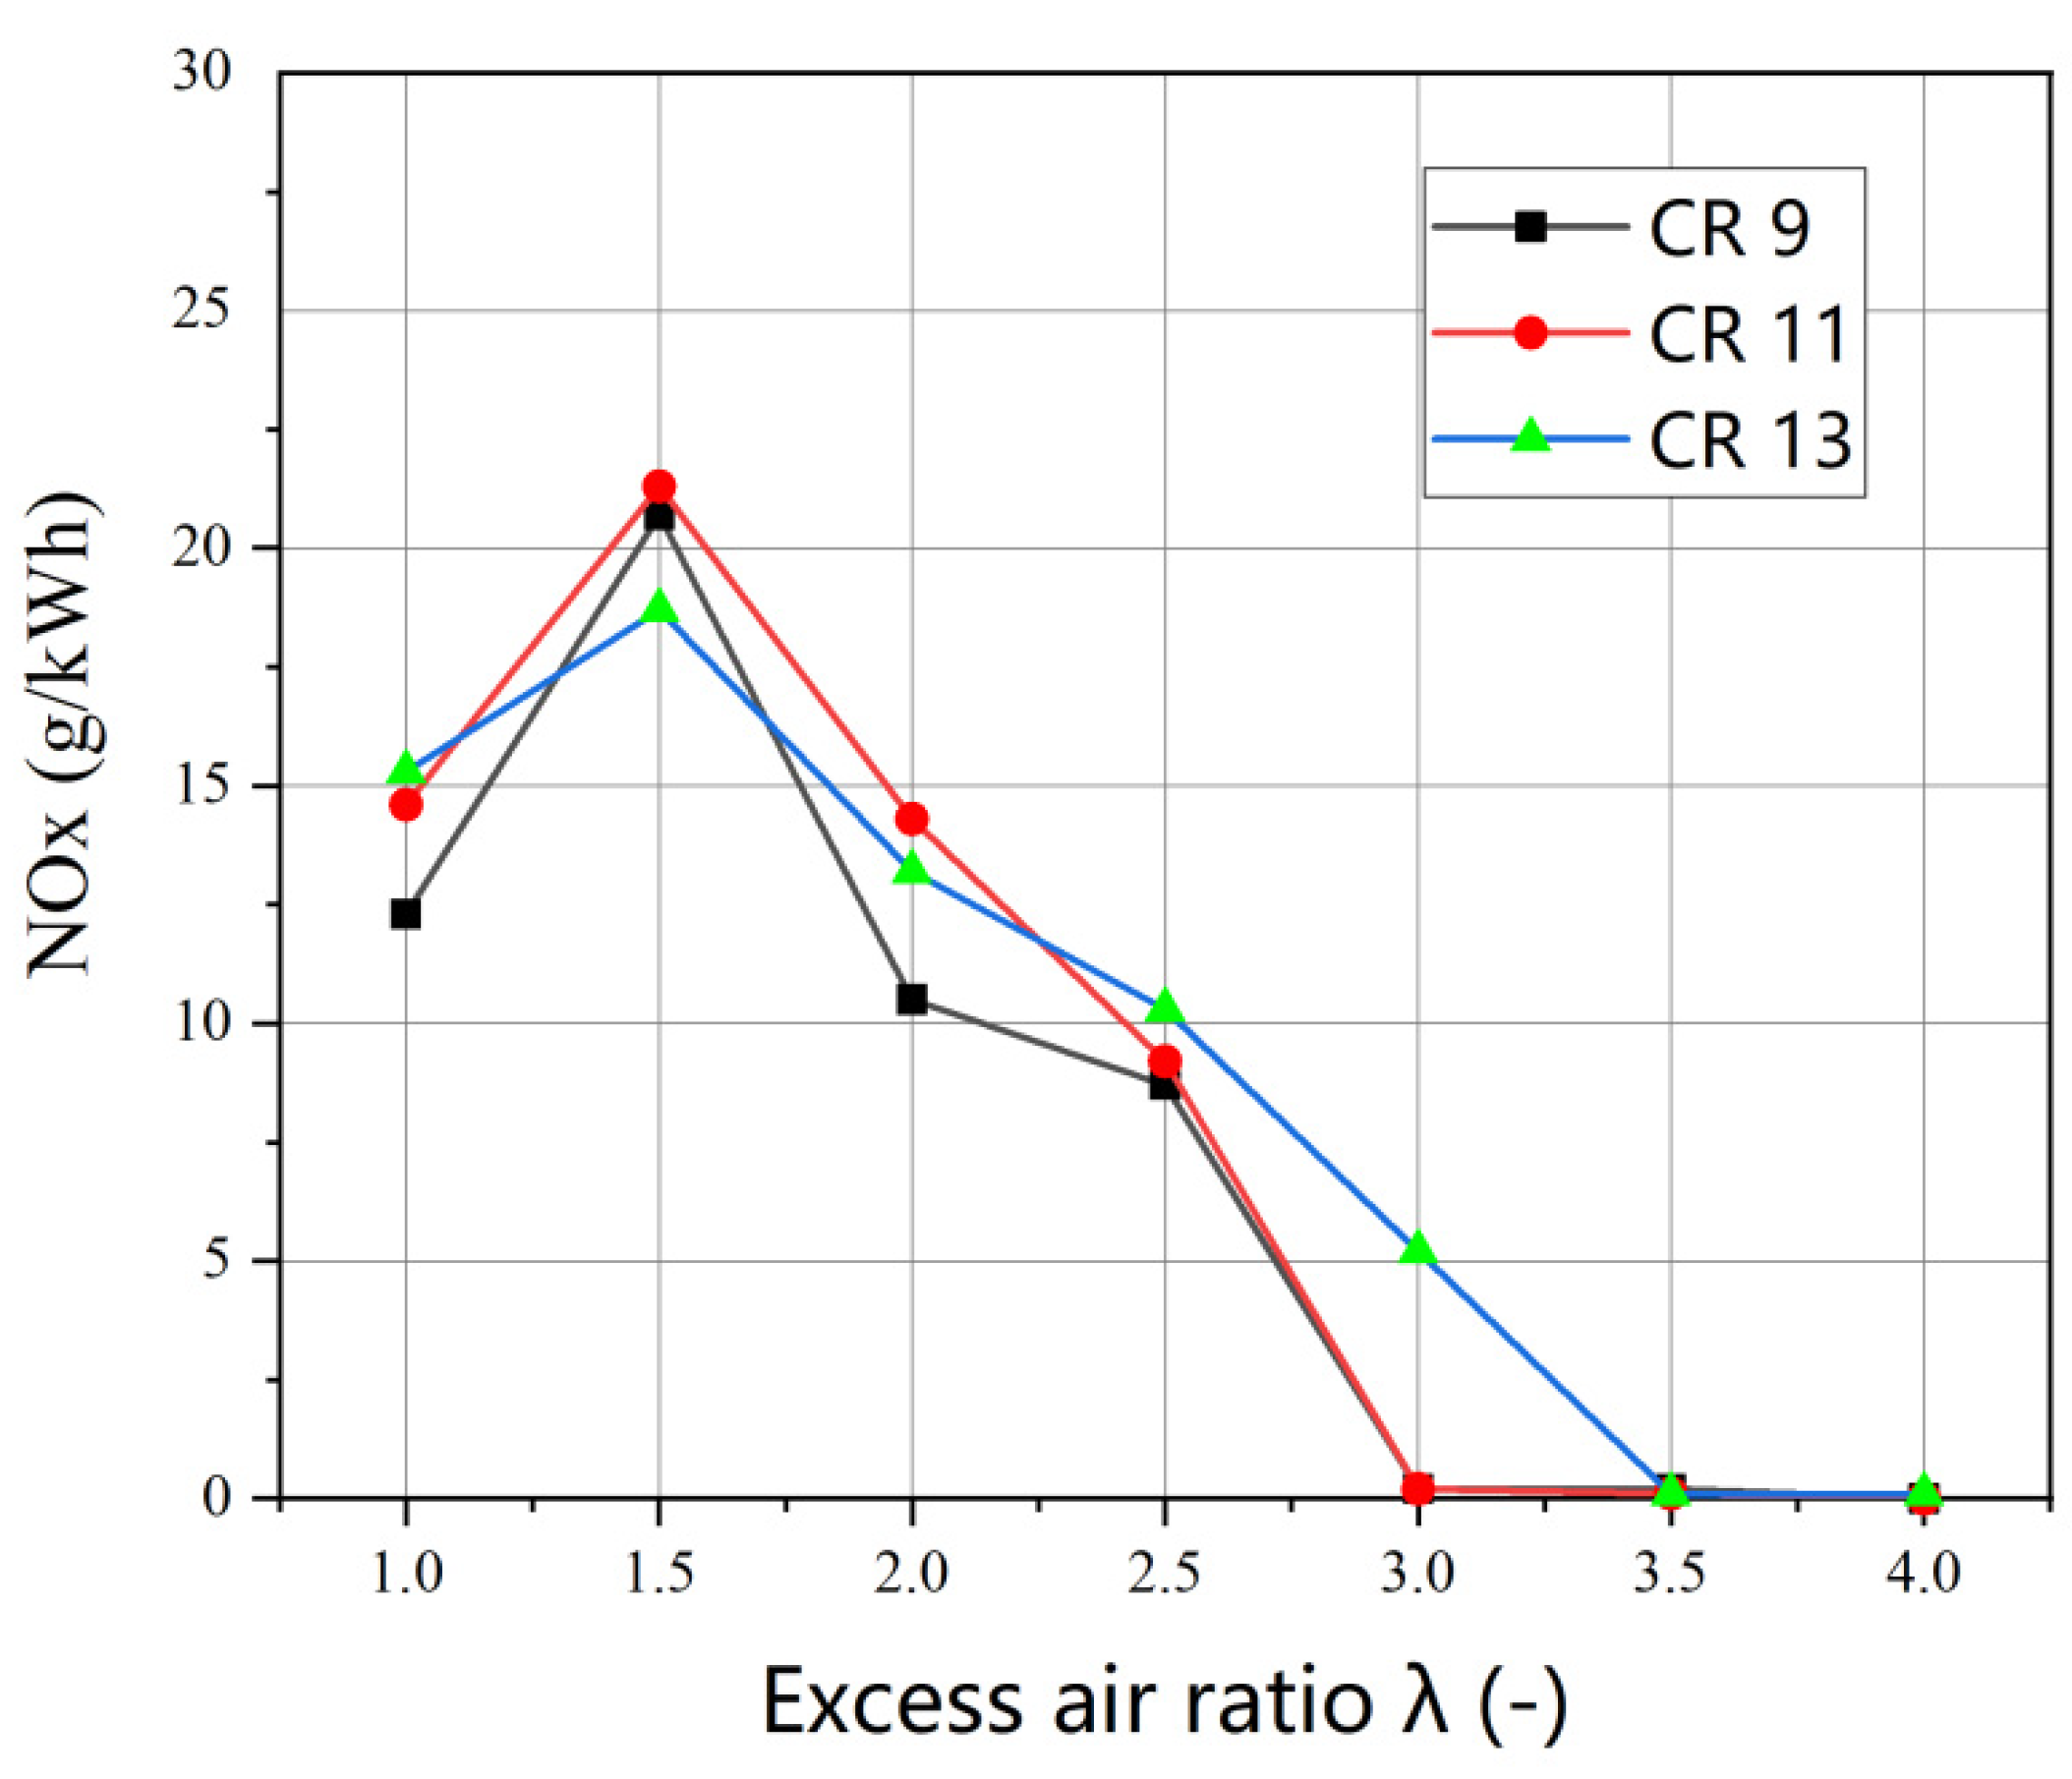
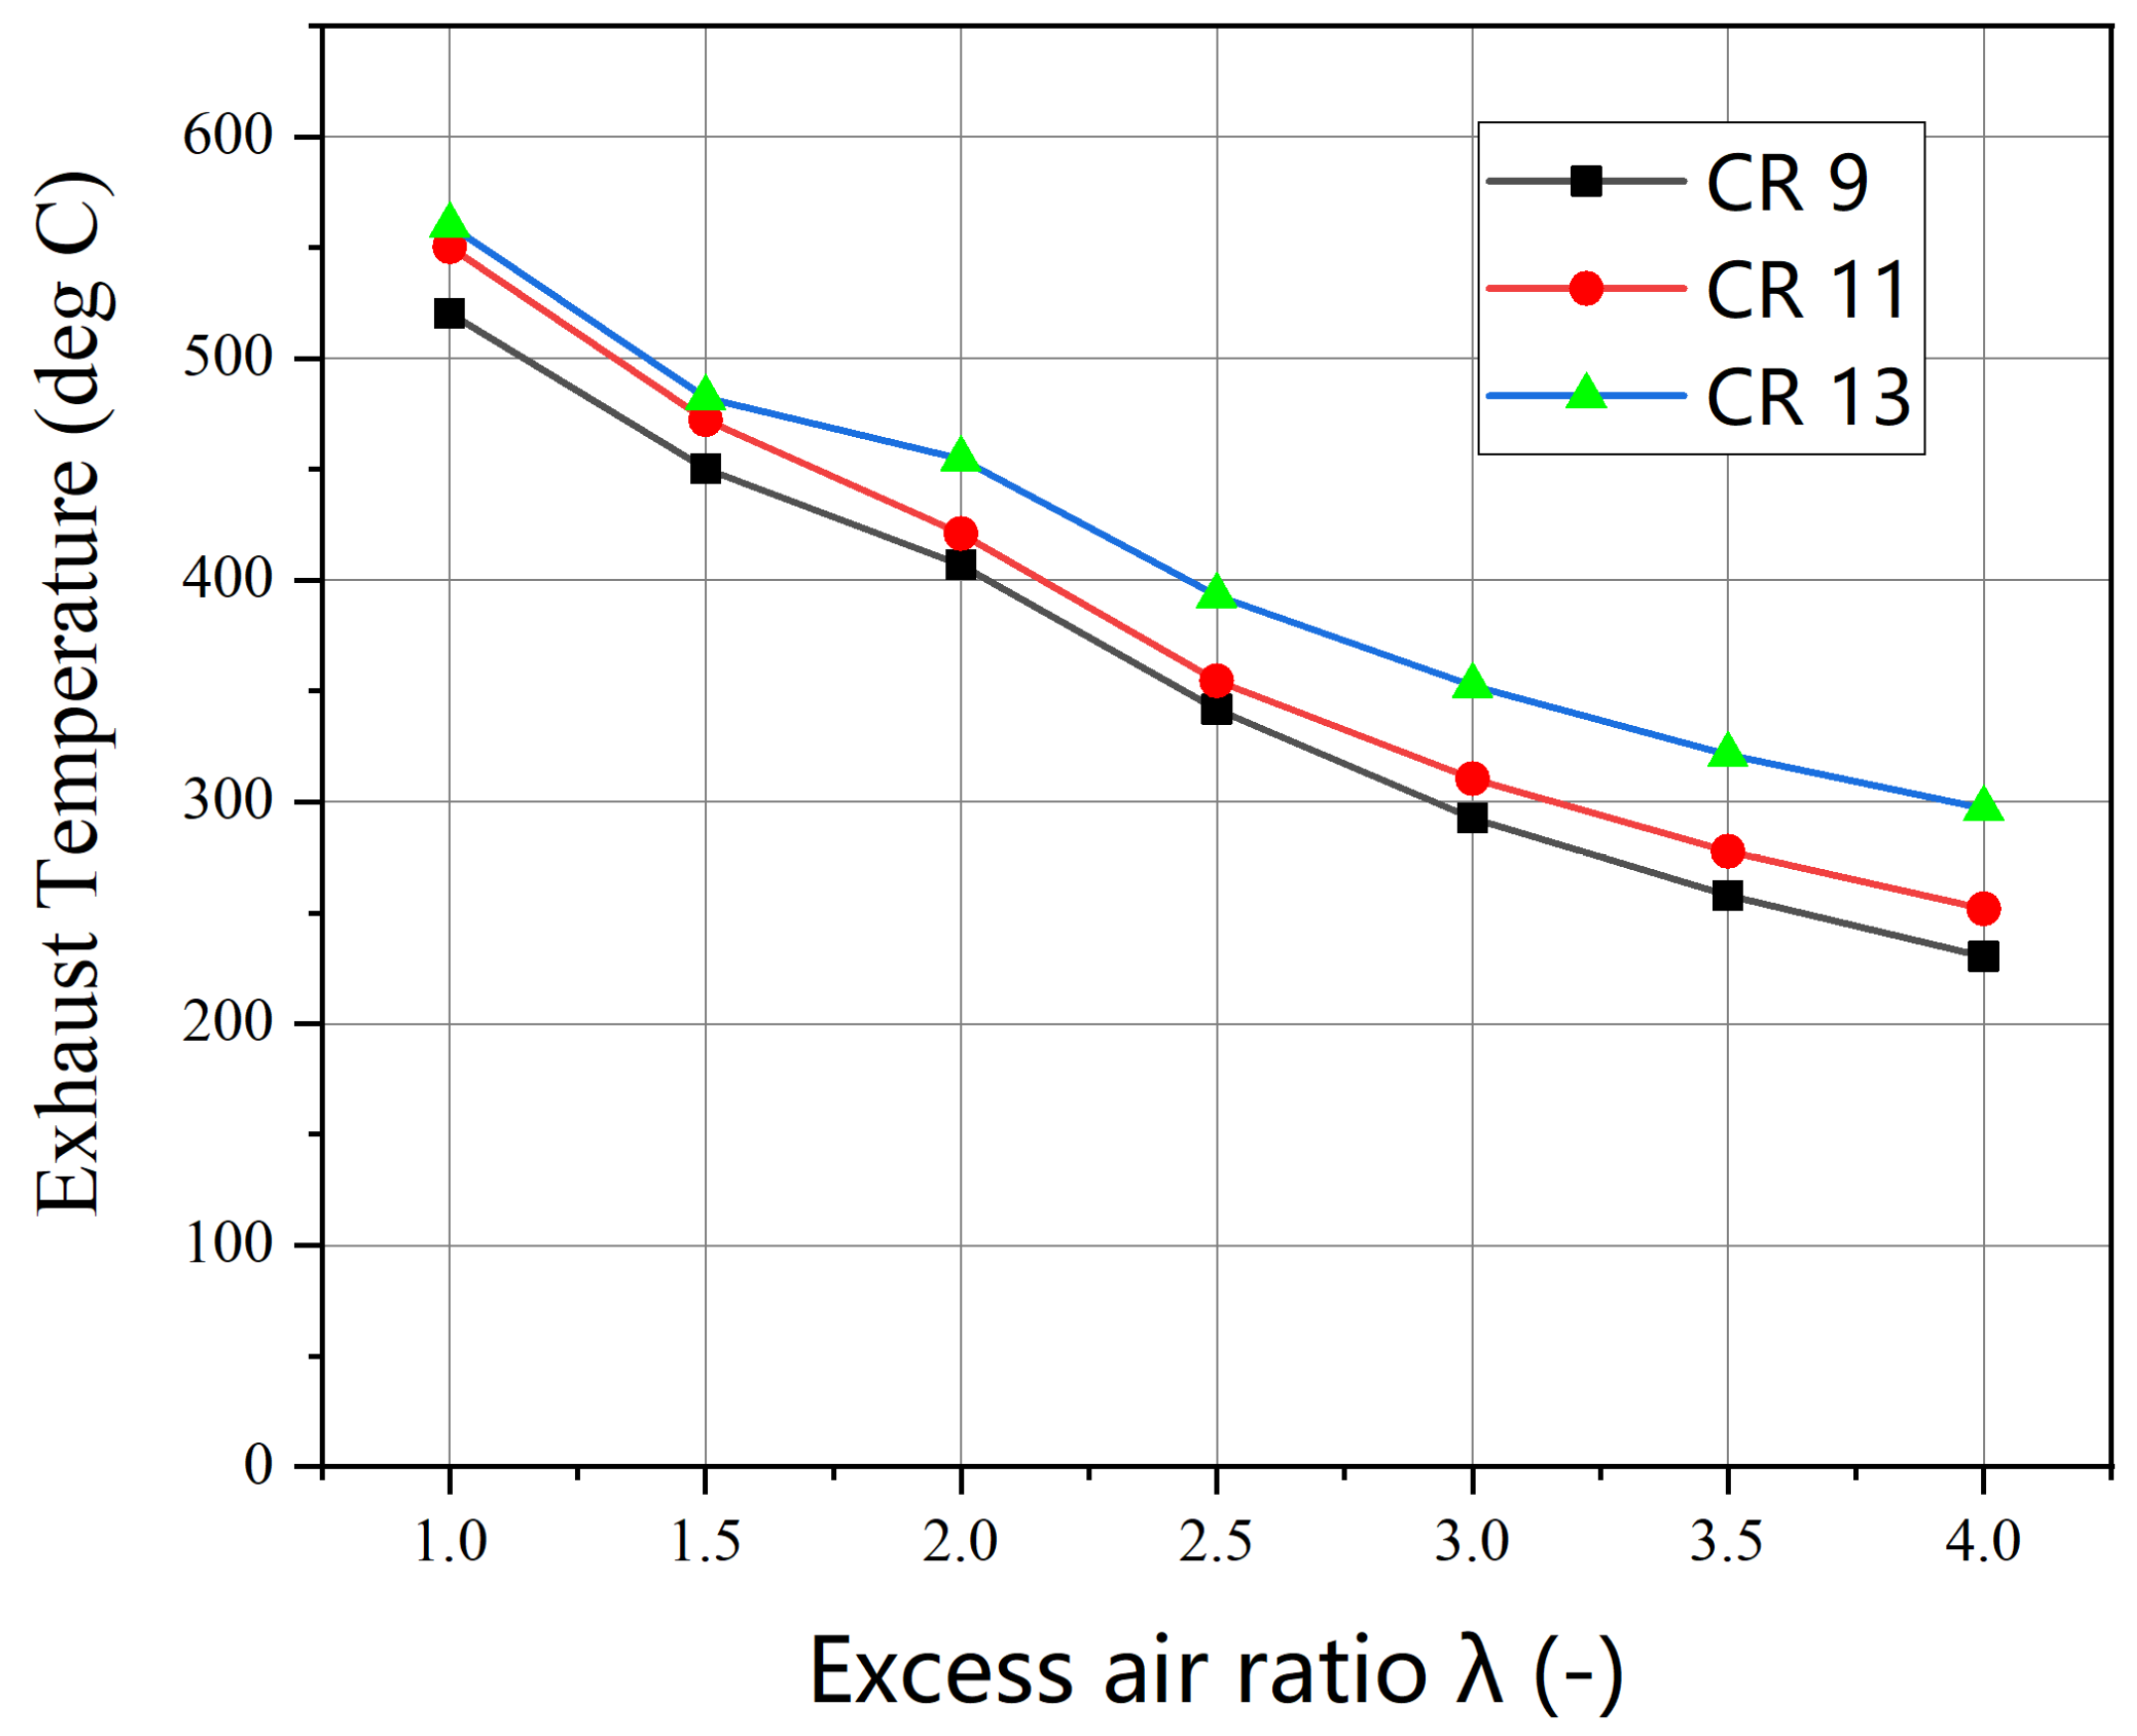
3.2. Engine Emissions

Figure 10 depicts NOx emissions from an engine, primarily depending on combustion temperature and intake air conditions. As illustrated, the NOx emissions initially rise and then decline, peaking around λ = 1.5. Beyond the critical threshold (λ > 2.5), NOx emissions exhibit a marked inverse correlation with the air–fuel equivalence ratio. This phenomenon arises from dual-phase thermal mechanisms: At moderate λ increments (1.0 < λ ≤ 2.5), enhanced oxidizer availability elevates both the adiabatic flame temperature and oxygen participation in nitrogen oxidation pathways. Conversely, when λ surpasses 2.5, the disproportionate oxygen-to-fuel ratio induces thermal quenching through two mechanisms—suppressed chain-branching reactions due to diluted reactant concentrations and accelerated heat dissipation from extended flame residence times in lean combustion regimes [34]. Since NOx formation is closely related to combustion temperature, a decrease in combustion temperature can effectively reduce NOx emissions. Furthermore, an increased excess air ratio aids in improving combustion stability, minimizing fluctuations and instabilities during combustion, reducing NOx emissions. Under fuel-rich combustion conditions (λ < 1.0), transition metal catalysts demonstrate effective NOx abatement through surface-mediated redox reactions. This catalytic strategy leverages the inherent chemical potential of unburned hydrocarbons in oxygen-deficient environments, where the catalyst substrate facilitates NOx decomposition into molecular nitrogen via selective oxidation pathways [35]. The increase in NOx emissions with higher compression ratios is closely related to the rise in in-cylinder temperature and changes in oxygen concentration distribution. Although thermal NOx (via the Zeldovich mechanism) is likely to be the dominant contributor, detailed reaction kinetics analysis combined with more refined CFD simulations will be a focus of future work.
As shown in Figure 11, with an increased λ, a continuous exhaust temperature decrease is observed, and a higher compression ratio results in a greater exhaust temperature. When λ exceeds 2.5, exhaust temperatures under various compression ratios are all below 300 °C, during which NOx emissions significantly decline. Hydrogen-powered engines operating under stoichiometric conditions (λ ≈ 1) exhibit minimal NOx formation due to combustion characteristics. Residual hydrogen in exhaust streams functions as an active reductant in three-way catalytic systems, enabling synergistic emission control through in situ chemical utilization. This integrated approach enhances both pollutant conversion efficiency and the thermodynamic performance of hydrogen combustion systems [36].

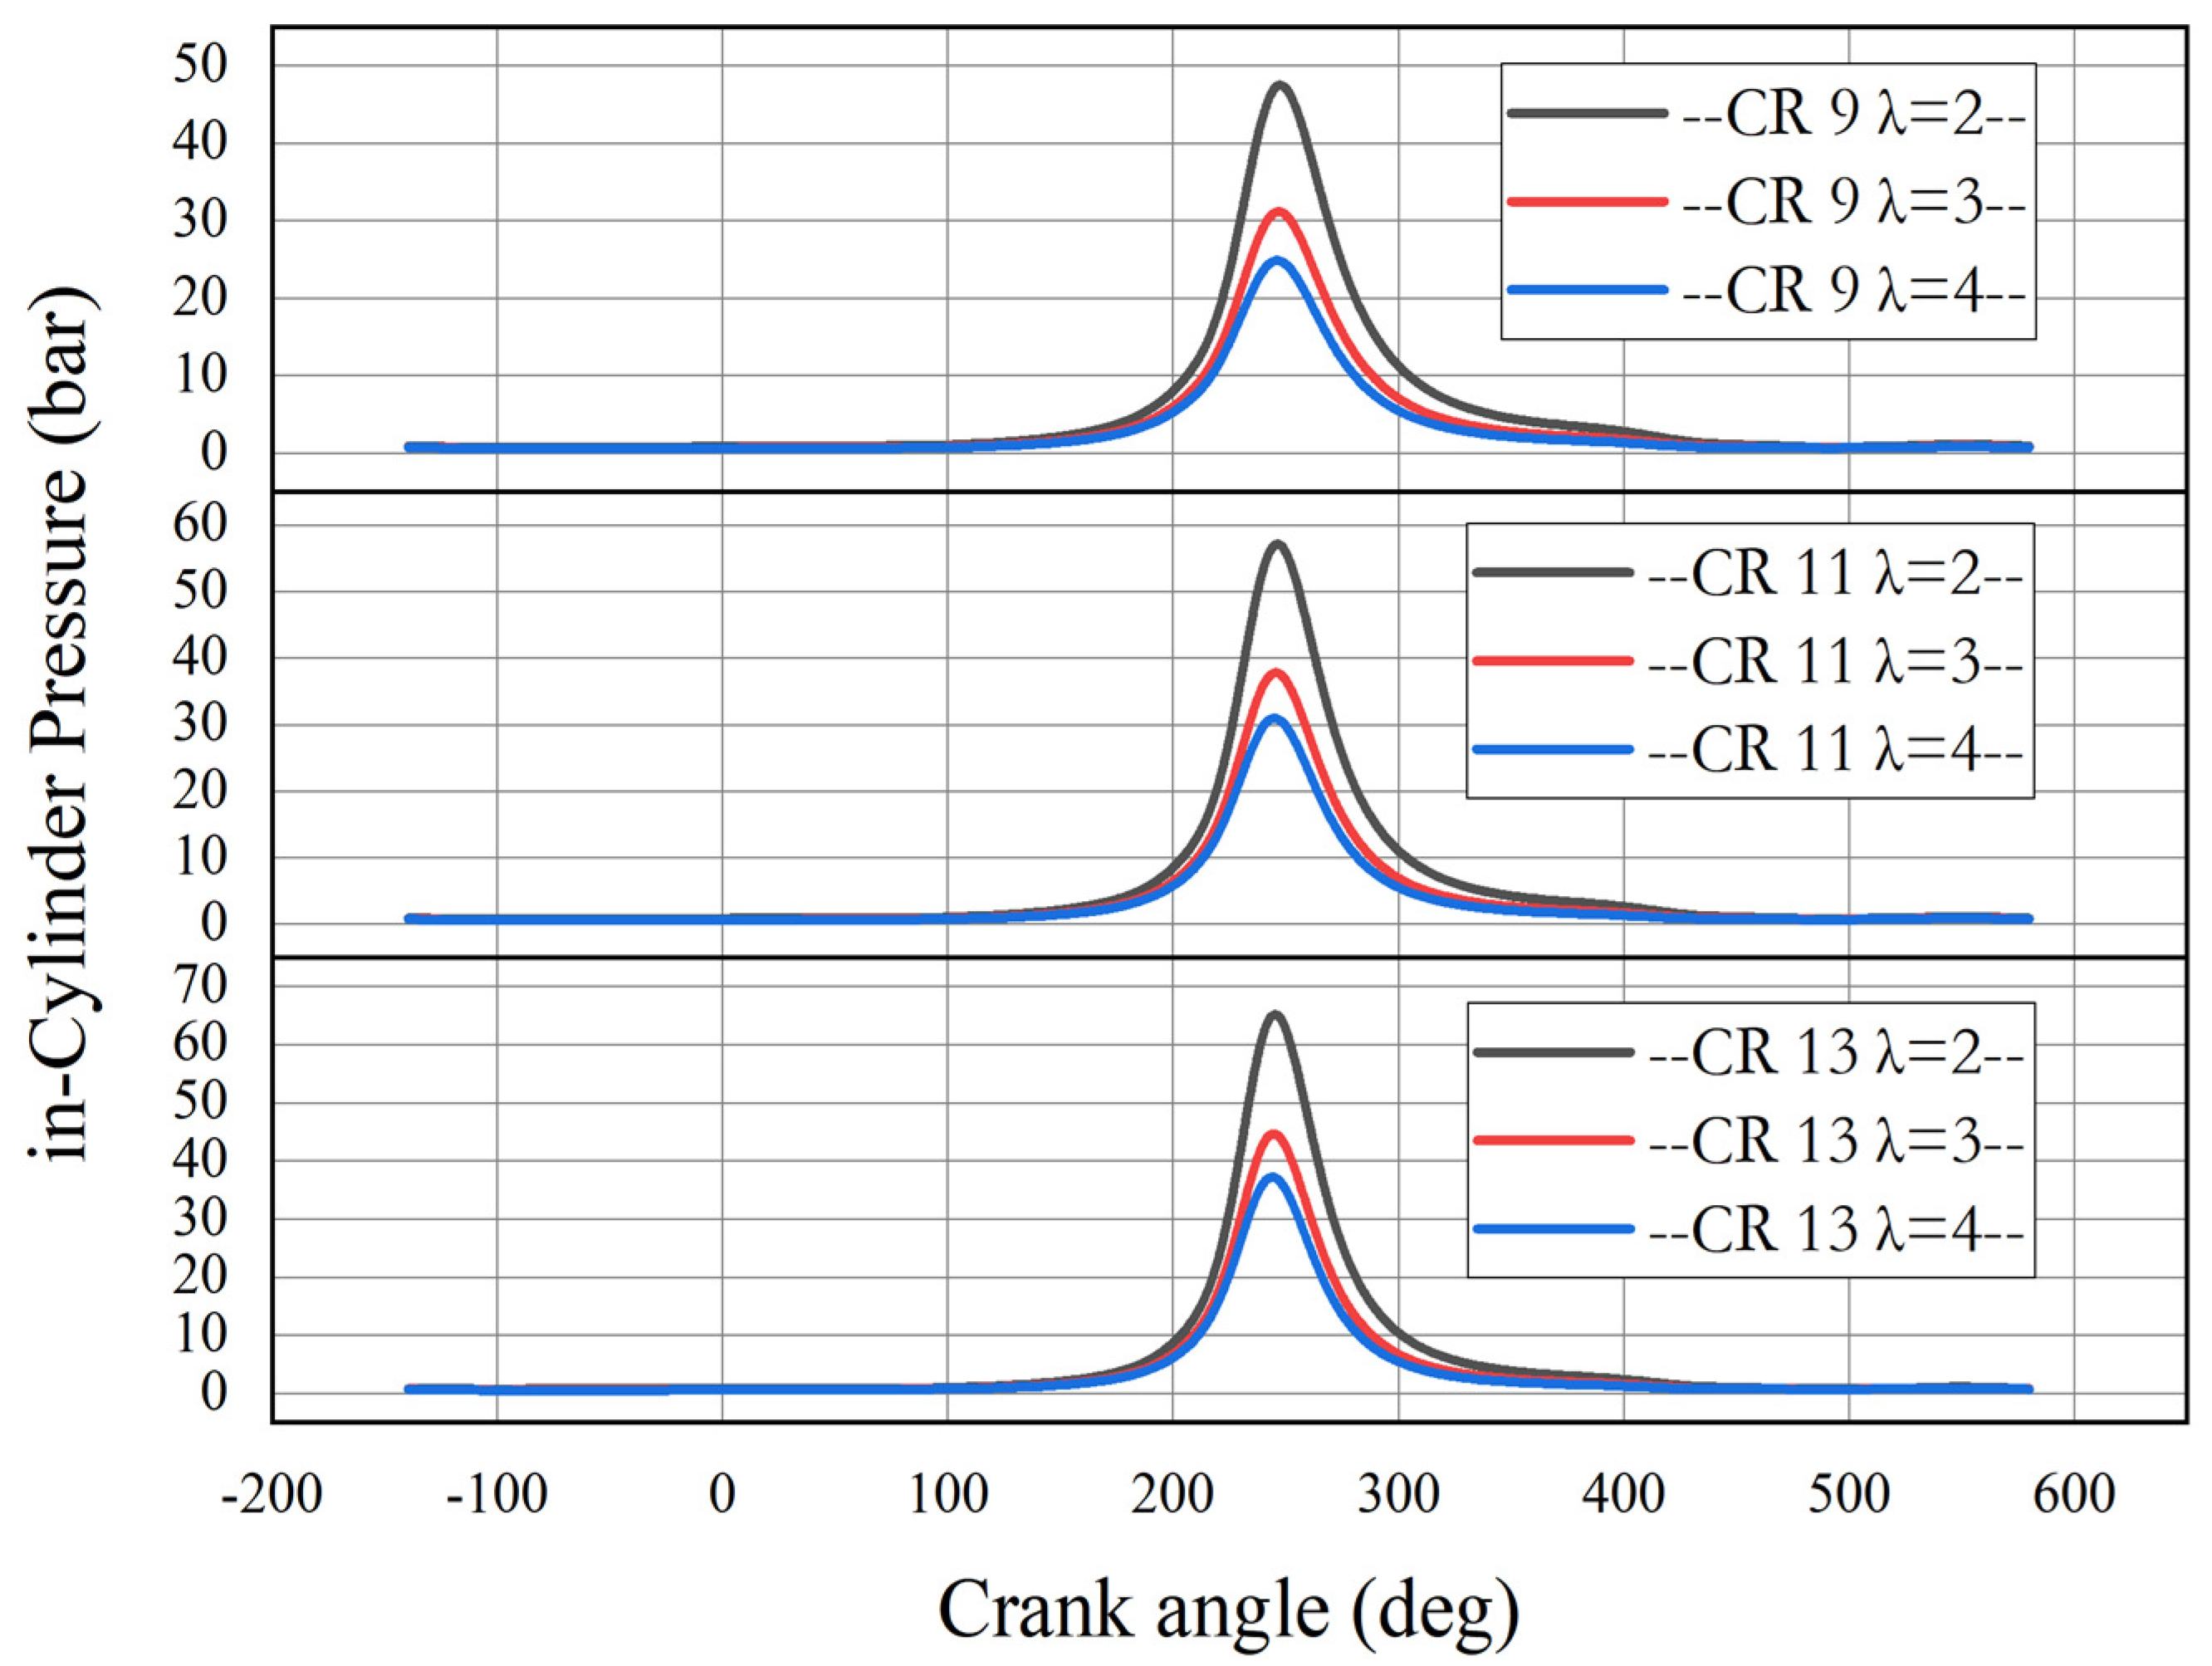
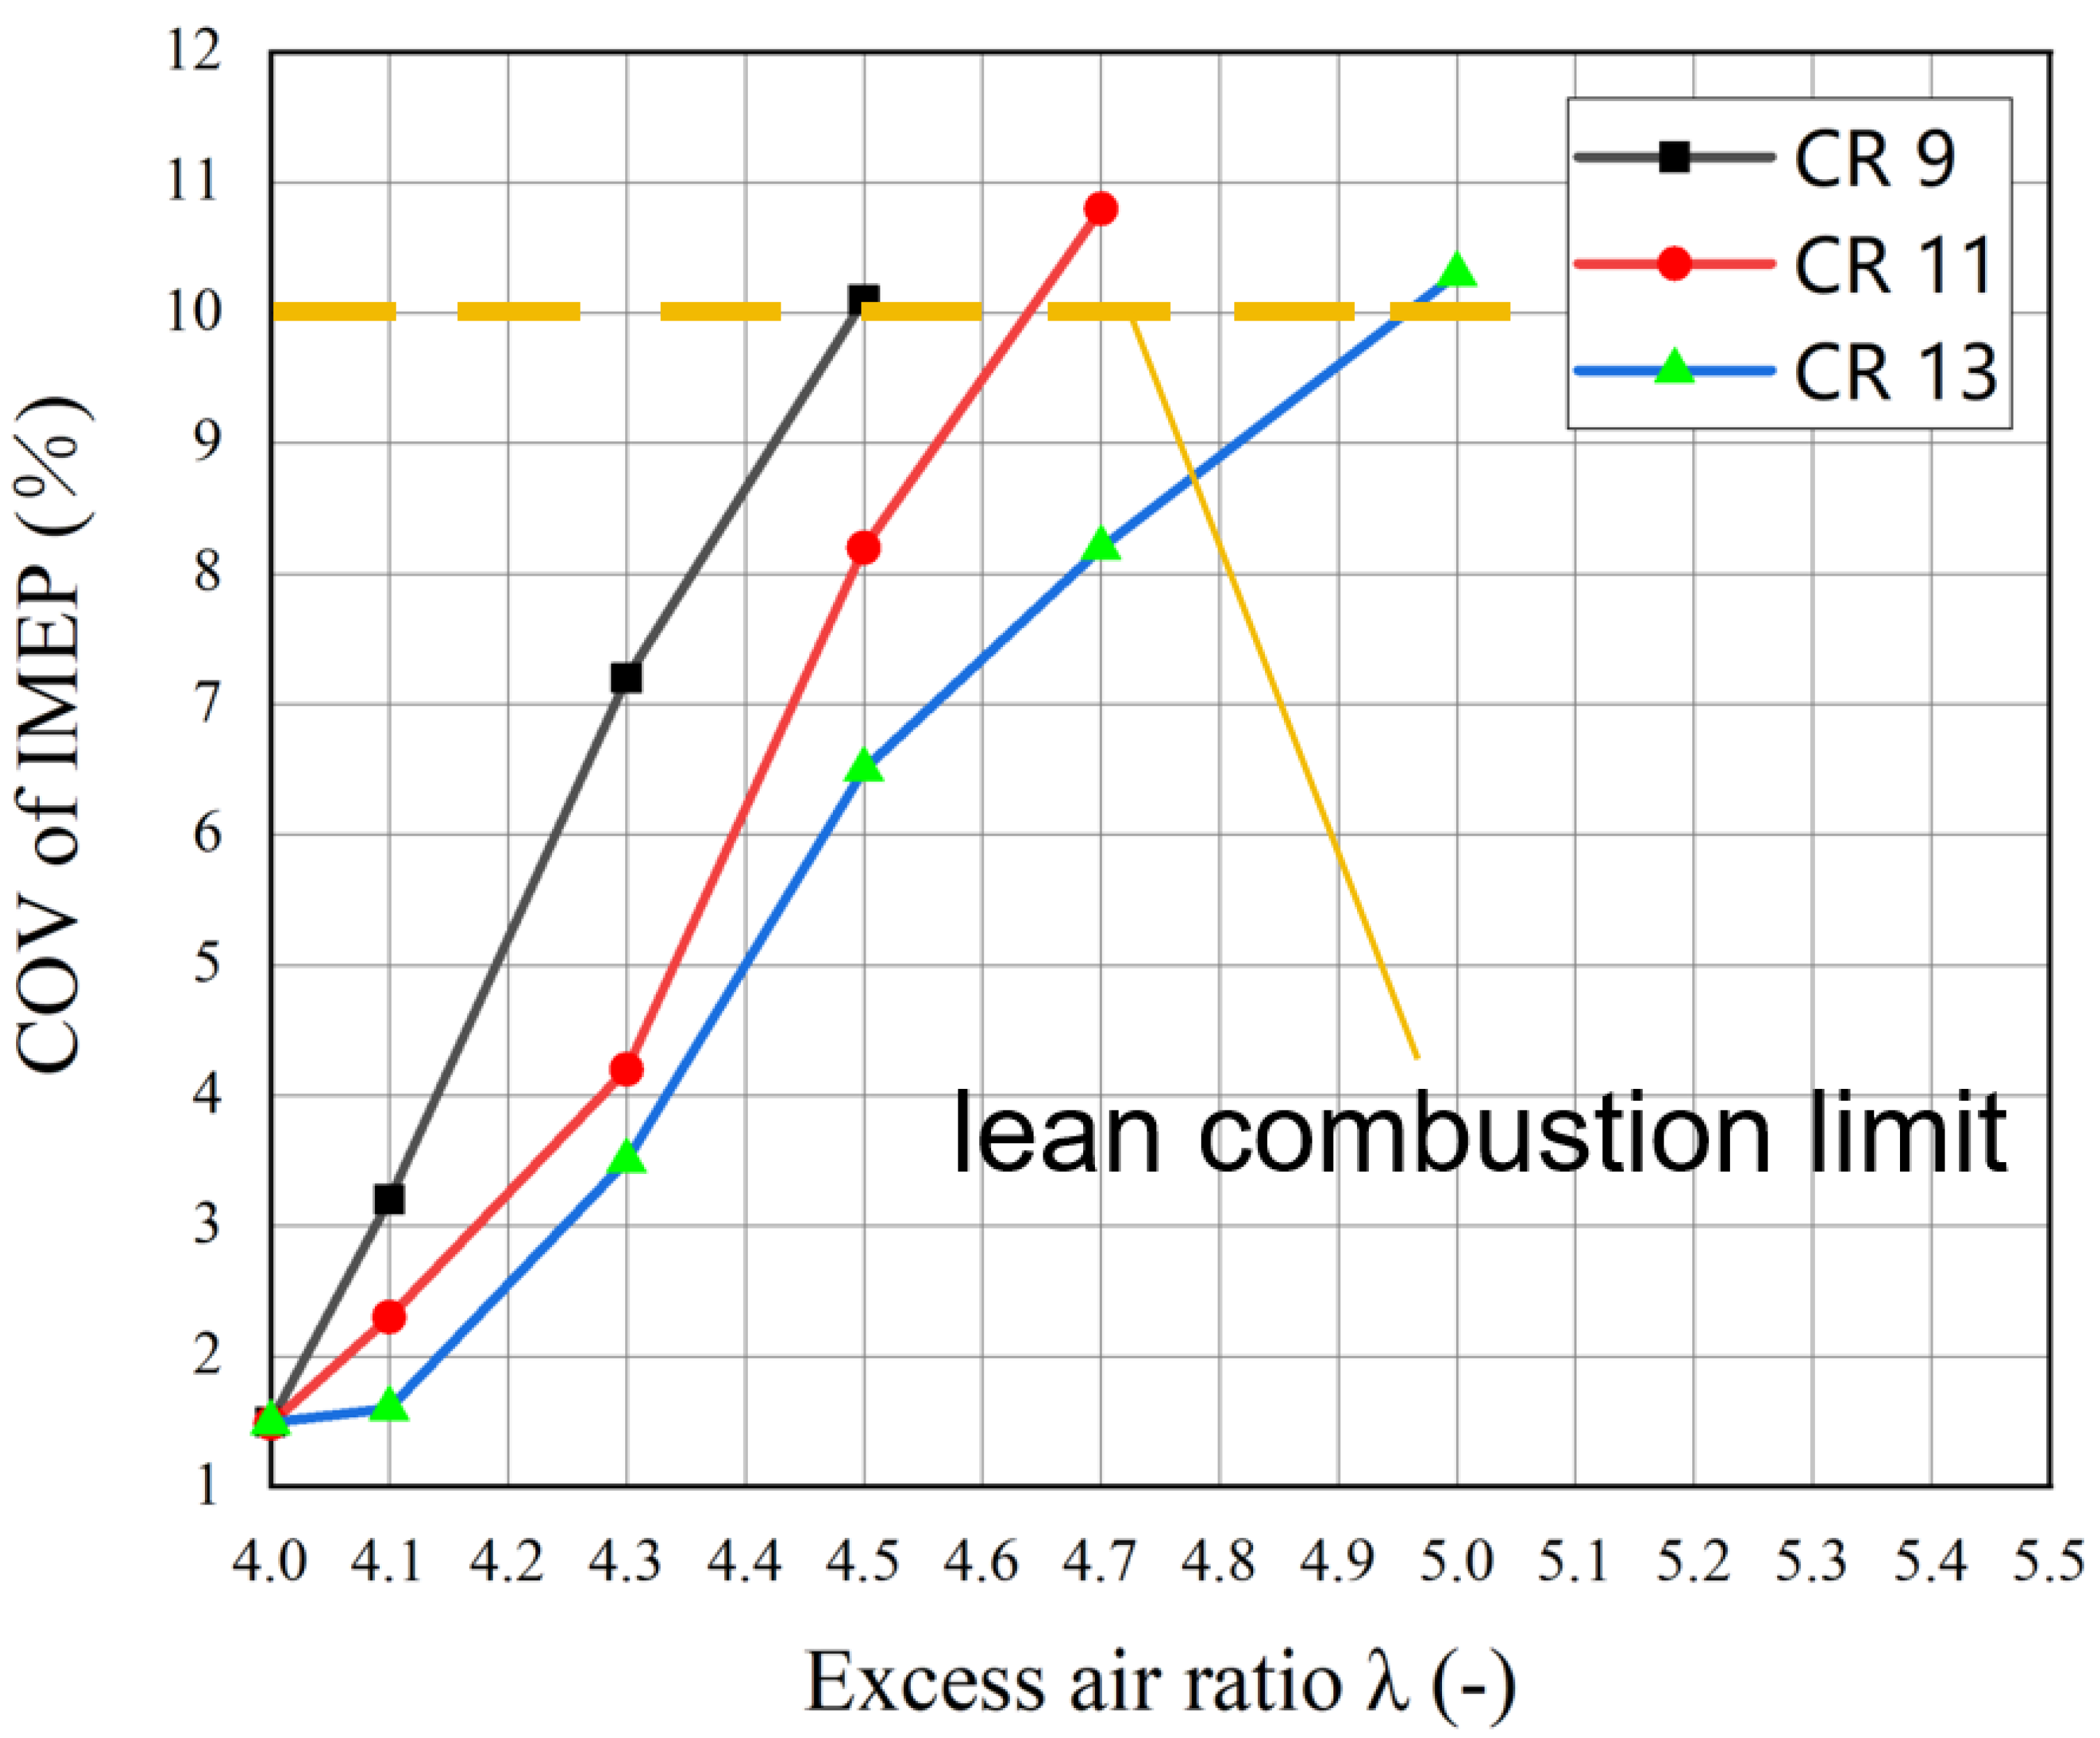
3.3. Combustion Characteristics

As depicted in Figure 12, elevated compression ratios (CRs) induce a 23% rise in peak combustion pressure and a 8.5 °CA advancement in pressure phasing. These trends correlate with intensified thermodynamic conditions within the chamber, where higher CR values enhance end-gas reactivity, thereby achieving near-complete fuel conversion. Additionally, elevated λ correlates with diminished maximum combustion chamber pressures and retarded peak phasing. This thermal attenuation stems from over-lean mixtures lowering reaction intensities, as evidenced in Figure 13’s heat release profiles mirroring pressure characteristics. The analysis further reveals compressed ignition dwell periods and advanced combustion timing under heightened compression ratios. Notably, heat release trajectories display nonlinear progression with abrupt escalation phases, which attenuate markedly under lean-burn configurations. These combustion dynamics suggest that while elevated compression ratios intensify thermal–mechanical loads, they concurrently impair hydrogen–air mixing homogeneity, elevating risks of localized fuel enrichment and combustion anomalies like post-ignition detonation. However, an increased excess air ratio suppresses the likelihood of hydrogen accumulation in certain regions, thus reducing the occurrence of abnormal combustion.
Figure 14 illustrates the influence of compression ratio on broadening the lean combustion limit, which is generally characterized by the COV of IMEP. When the COV of IMEP exceeds 10%, it indicates that the engine cannot operate normally, thus determining the lean combustion limit of the engine [37]. According to Figure 6, when λ < 4, the COV of IMEP remains well below 10%. However, when λ > 4.1, the rate of increase in the COV of IMEP rises significantly. Referring to Figure 14, it can be observed that at a compression ratio (CR) of 9, the lean combustion limit of the engine is approximately at λ = 4.5. When CR = 11, the lean combustion limit is around λ = 4.7, and at CR = 13, the limit shifts to approximately λ = 5.0. Therefore, it can be inferred that a higher compression ratio can broaden the lean combustion limit [29].

4. Conclusions

This experimental investigation employs a six-cylinder direct-injection hydrogen engine platform to systematically analyze combustion dynamics. Utilizing computational modeling, the study quantifies thermodynamic performance, emission profiles, and combustion-phasing variations across multiple compression ratios and air–fuel equivalence conditions [38]. Variations in the compression ratio significantly influence the combustion efficiency, emission characteristics, and overall performance of an engine. Key insights reveal the following:
(1) The λ critically governs thermodynamic performance and emission characteristics in hydrogen-powered engines. Experimental data demonstrate an inverse correlation between λ elevation and both air-charging capacity (volumetric efficiency) and work output (IMEP). Thermal efficiency (ITE) manifests non-monotonic behavior, achieving a maximum conversion efficiency at λ ≈ 2.5. Compression ratio variations exhibit pronounced modulation effects on ITE, while engine torque and power outputs show progressive attenuation with leaner combustion conditions.
(2) NOx emissions first increase and then decrease as the λ increases. Combining this with thermal efficiency, we observe that at λ = 2.5, the engine exhibits the highest thermal efficiency along with low NOx emissions, but the power output at this point is only half of the peak value. Conversely, near λ = 1, the engine achieves the maximum power output but with the lowest thermal efficiency and relatively high NOx emissions. Therefore, a trade-off needs to be made based on the actual requirements of the application.
(3) Elevating compression ratios enhances combustion efficiency while raising risks of combustion anomalies. Conversely, a higher λ diminishes chamber pressures and thermal loads while substantially lowering the occurrence of fuel-rich zones. Compression ratio elevation also expands the lean flammability boundary, yielding triple benefits: optimized fuel utilization, emission mitigation, and combustion stability enhancement. This interdependence necessitates precise calibration of these operational parameters to balance thermal efficiency and combustion stability.
This investigation demonstrates hydrogen’s capability to serve as a sustainable substitute for conventional hydrocarbon-based energy sources, exhibiting reduced environmental impact and superior energy conversion rates relative to existing combustion fuels. However, the findings of this research on the direct-injection engine reveal that the combustion process of hydrogen-fueled internal combustion engines requires precise control. It is necessary to balance parameters such as the λ and compression ratio based on specific requirements to achieve better engine performance while minimizing emissions and abnormal combustion. For instance, according to the numerical results, selecting λ = 2.5 initially results in the highest thermal efficiency and lowest emissions. However, further research is still required to investigate the influence of various parameters on the combustion process, such as the study of hydrogen-fueled engines with port injection. Additionally, adopting effective control strategies can significantly reduce the occurrence of abnormal combustion.
As highlighted in recent combustion science reviews [39], transitioning to hydrogen-based propulsion systems requires overcoming critical challenges such as flame anchoring, knock prediction, and emission control under ultra-lean combustion. Our research on extending lean limits via CR enhancement, coupled with λ-dependent NOx/ITE trade-off analysis, provides empirical support for theoretical frameworks while revealing specific engineering challenges in high-CR hydrogen ICE implementation.
This study confirms that a hydrogen ICE can achieve an ITE of 41.25% at λ = 2.5 and CR = 13, with NOx emissions reduced to below 500 ppm, demonstrating significant low-carbon advantages. However, practical application still faces economic challenges from the cost of green H2 production (currently around 4–6 USD/kg) and the 700 bar H2 storage system, as well as the risk of knock due to H2’s low ignition energy (0.02 mJ) under high CR (CR > 11). Future research needs to focus on the co-optimization of multiple parameters: developing a dynamic λ-CR–EGR coupling control system to expand the high-efficiency range (λ = 2.5–3.0) and creating a pre-chamber ignition system to enhance the stability of ultra-lean combustion (λ > 5.0). Optimizing combustion-phasing control through machine learning is expected to further narrow the efficiency gap with fuel cells (currently about 30–40%) while maintaining the cost advantages of hydrogen ICEs, thereby promoting the decarbonization of heavy-duty transportation.

Author Contributions

Conceptualization, D.L.; methodology, Y.Z.; software, Y.L.; validation, Y.L. All authors have read and agreed to the published version of the manuscript.

Funding

This research received no external funding.

Data Availability Statement

For privacy considerations, the data provided in this study can be obtained from the corresponding author.

Acknowledgments

This work was supported by the School of Automotive Studies, Tongji University through both financial funding and technical assistance. The authors gratefully acknowledge the resources and expertise provided by the institution, which were instrumental in conducting the experiments described in this study.

Conflicts of Interest

The authors declare no conflicts of interest.

References

  1. Karlilar Pata, S.; Balcilar, M. Decarbonizing energy: Evaluating fossil fuel displacement by renewables in OECD countries. Environ. Sci. Pollut. Res. Int. 2024, 31, 31304–31313. [Google Scholar] [CrossRef]
  2. Fernandez-Dacosta, C.; Shen, L.; Schakel, W.; Ramirez, A.; Kramer, G.J. Potential and challenges of low-carbon energy options: Comparative assessment of alternative fuels for the transport sector. Appl. Energy 2019, 236, 590–606. [Google Scholar] [CrossRef]
  3. Folkson, R. Alternative Fuels and Advanced Vehicle Technologies for Improved Environmental Performance: Towards Zero Carbon Transportation; Elsevier: Amsterdam, The Netherlands, 2014. [Google Scholar]
  4. Wang, L.; Song, R.; Zou, H.; Liu, S.; Zhou, L. Study on combustion characteristics of a methanol—Diesel dual-fuel compression ignition engine. Proc. Inst. Mech. Eng. Part D J. Automob. Eng. 2008, 222, 619–627. [Google Scholar] [CrossRef]
  5. Utomo, O.; Abeysekera, M.; Ugalde-Loo, C.E. Optimal operation of a hydrogen storage and fuel cell coupled integrated energy system. Sustainability 2021, 13, 3525. [Google Scholar] [CrossRef]
  6. Yao, N.; Pan, W.; Zhang, J.; Wei, L. The advancement on carbon-free ammonia fuels for gas turbine: A review. Energy Convers. Manag. 2024, 315, 118745. [Google Scholar]
  7. Hosseini, S.E.; Butler, B. An overview of development and challenges in hydrogen powered vehicles. Int. J. Green Energy 2020, 17, 13–37. [Google Scholar]
  8. Das, L. Hydrogen engines: A view of the past and a look into the future. Int. J. Hydrogen Energy 1990, 15, 425–443. [Google Scholar]
  9. White, C.; Steeper, R.; Lutz, A.E. The hydrogen-fueled internal combustion engine: A technical review. Int. J. Hydrogen Energy 2006, 31, 1292–1305. [Google Scholar]
  10. Kawahara, N.; Tomita, E. Visualization of auto-ignition and pressure wave during knocking in a hydrogen spark-ignition engine. Int. J. Hydrogen Energy 2009, 34, 3156–3163. [Google Scholar]
  11. Hu, Z.; Yuan, S.; Wei, H.; Huang, Z.; Wei, H.; Chan, S.H.; Zhou, L. High-pressure injection or low-pressure injection for a direct injection hydrogen engine? Int. J. Hydrogen Energy 2024, 59, 383–389. [Google Scholar] [CrossRef]
  12. Boretti, A. Hydrogen internal combustion engines to 2030. Int. J. Hydrogen Energy 2020, 45, 23692–23703. [Google Scholar]
  13. Nguyen, D.; Kar, T.; Turner, J.W. Performance, Emissions, and Combustion Characteristics of a Hydrogen-Fueled Spark-Ignited Engine at Different Compression Ratios: Experimental and Numerical Investigation. Energies 2023, 16, 5730. [Google Scholar] [CrossRef]
  14. Lee, J.; Park, C.; Kim, Y.; Choi, Y.; Bae, J.; Lim, B. Effect of turbocharger on performance and thermal efficiency of hydrogen-fueled spark ignition engine. Int. J. Hydrogen Energy 2019, 44, 4350–4360. [Google Scholar]
  15. Poursadegh, F.; Brear, M.; Hayward, B.; Yang, Y. Autoignition, knock, detonation and the octane rating of hydrogen. Fuel 2023, 332, 126201. [Google Scholar] [CrossRef]
  16. Qiang, Y.; Jin, K.; Zhao, S.; Cai, J.; Su, F.; Wang, S.; Ji, C. Optimization of power performance and combustion stability of ultra-lean combustion in hydrogen fuel engines through combined turbulent jet ignition and variable valve timing. Fuel 2025, 381, 133493. [Google Scholar]
  17. Novella, R.; Gomez-Soriano, J.; González-Domínguez, D.; Olaciregui, O. Optimizing hydrogen spark-ignition engine performance and pollutants by combining VVT and EGR strategies through numerical simulation. Appl. Energy 2024, 376, 124307. [Google Scholar]
  18. Liu, X.R.; Li, G.X.; Hu, Y.P.; Bai, S.Z.; Deng, K.Y. In-Cylinder Heat Transfer Model for Diesel Engine Based on Improved Woschni Correlation. Appl. Mech. Mater. 2014, 538, 175–178. [Google Scholar]
  19. Kim, Y.-J.; Park, Y.-J.; Park, T.-J.; Lee, C.-E. Development of a Simulation Model for a New Rotary Engine to Optimize Port Location and Operating Conditions Using GT-POWER. Energies 2024, 17, 4732. [Google Scholar] [CrossRef]
  20. Brayek, M.; Driss, Z.; Jemni, M.A. Optimization of the Wiebe Function Parameters and a New Function for the Filling Coefficient for Dual-Fuel Engines. In International Conference on Wave Mechanics and Vibrations; Springer: Berlin/Heidelberg, Germany, 2022; pp. 1196–1206. [Google Scholar]
  21. Chicco, D.; Warrens, M.J.; Jurman, G. The coefficient of determination R-squared is more informative than SMAPE, MAE, MAPE, MSE and RMSE in regression analysis evaluation. PeerJ Comput. Sci. 2021, 7, e623. [Google Scholar]
  22. Wang, W.; Mai, Z.; Yao, X.; Tang, C.; Huang, Z. Towards optimized excess air ratio and substitution rate for a dual fuel HPDI engine. Appl. Therm. Eng. 2024, 253, 123797. [Google Scholar]
  23. Gang, H.; Lang, L.; Ye, T.; Wei, Z. Combustion flow field structure and performance in hydrogen-fueled scramjet. J. Aerosp. Power 2023, 38, 2177–2185. [Google Scholar]
  24. Xu, Z. Effect of Compression Ratio on the Performance of Direct-Injection Hydrogen Engines. Trends Renew. Energy 2024, 10, 283–300. [Google Scholar] [CrossRef]
  25. Babayev, R.; Morén, M.; Johansson, B. Comparative Computational Study of Hydrogen and Natural Gas in Heavy-Duty Compression-Ignition Engines: Combustion Characteristics, Thermal Efficiency, and Local Pollutant and Greenhouse Gas Emissions. In Thermal Efficiency, and Local Pollutant and Greenhouse Gas Emissions; SSRN: Rochester, NY, USA, 2025. [Google Scholar]
  26. Liang, Y.; Wang, Z.; Dong, D.; Wei, W.; Zhang, H.; Li, G.; Zhang, Z. Effects of hydrogen volume fraction, air fuel ratio, and compression ratio on combustion and emission characteristics of an SI ammonia-hydrogen engine. Energy 2024, 308, 132858. [Google Scholar]
  27. Goldwitz, J.A. Combustion Optimization in a Hydrogen-Enhanced Lean Burn SI Engine. Ph.D. Thesis, Massachusetts Institute of Technology, Cambridge, MA, USA, 2004. [Google Scholar]
  28. Batool, S.; Naber, J.D.; Shahbakhti, M. Data-driven modeling and control of cyclic variability of an engine operating in low temperature combustion modes. IFAC-PapersOnLine 2021, 54, 834–839. [Google Scholar]
  29. Domínguez, V.M.; Hernández, J.J.; Ramos, Á.; Rodríguez-Fernández, J. Role of the Compression Ratio in Dual-Fuel Compression Ignition Combustion with Hydrogen and Methanol. Energy Fuels 2024, 38, 19127–19136. [Google Scholar]
  30. De Bellis, V.; Piras, M.; Bozza, F.; Malfi, E.; Novella, R.; Gómez-Soriano, J.; Olcina-Girona, M. Development and validation of a phenomenological model for hydrogen fueled PFI internal combustion engines considering Thermo-Diffusive effects on flame speed propagation. Energy Convers. Manag. 2024, 308, 118395. [Google Scholar]
  31. Wang, Y.; Zhang, L.; Zhou, C.; Guo, X.; Xing, K.; Huang, H. Numerical Study on the Potential of Stratified Mixture to Improve Thermal Efficiency and Reduce Carbon Emissions in High-Speed Gasoline Direct Injection Engine. J. Eng. Gas Turbines Power 2024, 146, 121015. [Google Scholar]
  32. Issa, A.N.; Kim, J.K.; Chun, K.W.; Choi, J.-H.; Lee, W.-J. Investigation of an optimal exhaust gas recirculation rate on a four-stroke spark-ignited LPG engine. J. Energy Inst. 2025, 120, 102048. [Google Scholar] [CrossRef]
  33. Baigang, S.; Lingzhi, B.; Qinghe, L. Development and trends of direct injection hydrogen internal combustion engine technology. J. Automot. Saf. Energy 2021, 12, 265. [Google Scholar]
  34. Silveira, J.; Fagundez, J.; Garlet, R.; Martins, M.; Salau, N.; Lanzanova, T. Hydrogen-fueled PFI SI engine investigation for near-zero NOx emissions in de-throttled and supercharged ultra-lean burn conditions. Int. J. Hydrogen Energy 2024, 91, 800–813. [Google Scholar]
  35. Liebau, M.; Suprun, W.; Kasprick, M.; Gläser, R. Transition Metal Oxides Supported on TiO2 as Catalysts for the Low-Temperature Selective Catalytic Reduction of NO x by NH3. Catalysts 2024, 15, 22. [Google Scholar] [CrossRef]
  36. Boretti, A. Electric turbochargers in hydrogen internal combustion engines powered hybrid electric vehicles: Advancing performance, efficiency, and sustainability. Int. J. Hydrogen Energy 2025, 103, 690–700. [Google Scholar] [CrossRef]
  37. Park, C.; Jang, I.; Lee, J.; Kim, M.; Park, C.; Kim, Y.; Choi, Y. Effect of a Compression Ratio Increase and High-Flow-Rate Injection on the Combustion Characteristics of an Ammonia Direct Injection Spark-Ignited Engine. J. Mar. Sci. Eng. 2025, 13, 268. [Google Scholar] [CrossRef]
  38. Nguyen, Q.T.; Le, M.D. Effects of compression ratios on combustion and emission characteristics of SI engine fueled with hydrogen-enriched biogas mixture. Energies 2022, 15, 5975. [Google Scholar] [CrossRef]
  39. Sadeq, A. Combustion Advancements: From Molecules to Future Challenges; Independently Published: Chicago, IL, USA, 2023. [Google Scholar]
Figure 1. Photograph of the test engine.
Energies 18 01656 g001
Figure 2. The verified engine model of GT-POWER v2022. 1: compressor, 2: turbine, 3: intercooler, 4: inlet manifold, 5: cylinder, 6: exhaust manifold.
Energies 18 01656 g002
Figure 3. (a) In-cylinder pressure under simulation and experimental conditions; (b) power under simulation and experimental conditions; (c) NOx emissions under simulation and experimental conditions.
Energies 18 01656 g003
Figure 4. Volume efficiency curves under different excess air ratios.
Energies 18 01656 g004
Figure 5. IMEP curves under different excess air ratios.
Energies 18 01656 g005
Figure 6. COV of IMEP curves under different excess air ratios.
Energies 18 01656 g006
Figure 7. Indicated thermal efficiency (ITE) curves under different excess air ratios.
Energies 18 01656 g007
Figure 8. Torque and power variations under different excess air ratios.
Energies 18 01656 g008
Figure 9. BSFC curves under different excess air ratios.
Energies 18 01656 g009
Figure 10. NOx emission curves under different excess air ratios.
Energies 18 01656 g010
Figure 11. Exhaust gas temperature variations under different excess air ratios.
Energies 18 01656 g011
Figure 12. Cylinder pressure profiles under different excess air ratios.
Energies 18 01656 g012
Figure 13. Heat release rate curves under different excess air ratios.
Energies 18 01656 g013
Figure 14. The variation coefficient curve of IMEP (near the lean combustion limit) under different excess air ratios.
Energies 18 01656 g014
Table 1. Main technical parameters of the engine.
ParametersValue
Cylinder diameter × stroke/mm × mm130 × 161
Rated power/kW324–368
Rated speed or nominal speed/r·min−11900
Maximum torque/Nm2020–2320
Torque peak rpm/r·min−11100–1500
Engine displacement/L12.82
Table 2. Comparative summary table of performance metrics.
ParameterCR = 9CR = 11CR = 13
ITE Peak (%)40.1 (λ = 3)40.8 (λ = 3)41.25 (λ = 3)
BSFC Minimum (g/kWh)80.1 (λ = 1)70.7 (λ = 1)68.7 (λ = 1)
Peak IMEP (bar)8.43 (λ = 1)8.32 (λ = 1)8.14 (λ = 1)
NOx Peak (g/kWh)22.4 (λ = 1.5)21.6 (λ = 1.5)18.6 (λ = 1.5)
Disclaimer/Publisher’s Note: The statements, opinions and data contained in all publications are solely those of the individual author(s) and contributor(s) and not of MDPI and/or the editor(s). MDPI and/or the editor(s) disclaim responsibility for any injury to people or property resulting from any ideas, methods, instructions or products referred to in the content.

