Article

Energy Efficiency and the Transition to Renewables—Building Communities of the Future

by
Efstathios E. Michaelides
Department of Engineering, TCU, Fort Worth, TX 76129, USA
Energies 2025, 18(7), 1778; https://doi.org/10.3390/en18071778
Submission received: 26 February 2025 / Revised: 26 March 2025 / Accepted: 31 March 2025 / Published: 2 April 2025
(This article belongs to the Section A: Sustainable Energy)

Abstract

:
The effects of energy efficiency on the decarbonization engineering infrastructure were examined by simulating the hourly energy demand of a small Texan city with 10,000 buildings. The available renewable energy sources in the region, wind and solar, supply the required energy, and the deficit or surplus is offset by energy storage. The demand–supply match during every hour of the year determines the required renewable power, the energy storage requirement, and dissipation in the energy storage/regeneration processes. The computations showed that the implementation of energy efficiency measures will decrease the total required renewable power by a factor of 2.9, the needed energy storage by a factor of 2.0, and the annual energy dissipation by a factor of 2.4. Of particular interest is the determination of the energy transition elasticity coefficients, which offer quantitative interpretation and a better understanding of the effects of energy efficiency measures on the decarbonization efforts of communities.

1. Introduction

Following the significant increase in atmospheric greenhouse gases, in particular carbon dioxide (CO2), and several warnings by the Intergovernmental Panel on Climate Change [1], it is apparent that action must be taken to significantly reduce global CO2 emissions. It appears that the most effective way to achieve this goal is to transition global electricity generation from fossil fuel combustion to renewable energy sources—perhaps supplemented with nuclear energy—and to reduce the global energy demand through a combination of conservation and improved efficiency measures [2,3]. Recent roadmaps established by the International Energy Agency (IEA) and the IPCC strongly recommend that the electricity generation industry should reach net zero CO2 emissions by the year 2050 [4].
Energy efficiency and energy conservation measures are the cleanest and least expensive ways to satisfy part of the global energy demand. Instead of generating more energy, energy efficiency actions simply satisfy the demand with the consumption of less energy. For this reason, the IEA refers to efficiency as the first fuel [2]. Realizing that energy efficiency is an abundant and affordable “fuel”, several nations have prioritized efficiency in their CO2 emission reduction policies. However, ten years after the IEA’s sound endorsement of energy efficiency, global investment in this vital component of net zero emissions for the future has not grown as much as other components [5], and it appears that the importance of energy efficiency projects has been overlooked in some nations [6].
The heating and cooling needs of buildings consume more than 25% of the global primary energy sources—more than those for transportation and electricity generation—and account for 40% of global CO2 emissions [7]. A number of recent studies have confirmed the advantages of energy efficiency in homes and commercial buildings. Among these, a study of Scottish islands determined that heat pumps in buildings offer very high promise to reduce energy consumption and energy bills [8]. Heat pumps also help with air conditioning in hotter climates, since they can double as air conditioners, thereby contributing to achieving net zero emissions [9,10].
Energy efficiency programs for buildings have been a topic of research in several countries and regions, including Switzerland [11], Portugal [12], India [13], Russia [14], and Central Asia [15] The financial costs/benefits of retrofitting older buildings and rental properties in Germany were examined in [16,17], which concluded that, while energy efficiency measures substantially reduce energy usage, governmental intervention is needed to help building owners with the cost of retrofits. Recently, advanced monitoring and computational methods, such as the Digital Twins, have been proposed to enhance energy efficiency and sustainability across the residential sector [18,19].
Despite its importance in combatting the climate crisis, building energy efficiency in the USA has not received significant attention from policy or the regulatory environment. The housing stock is older, with houses built with few energy-saving devices during an era of cheap energy and lax energy conservation regulations. The recent (since 2020) price hikes in electricity and natural gas have imposed financial strain on households, especially those of moderate means, and the energy price burden has become a national challenge for low-income families that disproportionately tend to live in energy-inefficient homes [20]. Moderate-income families are not immune to this financial crunch [21].
This study quantitatively examined the necessary power generation and energy storage capacity for a residential community in North Texas to become independent of fossil fuels without burdening the grid. Buildings in this region use a great deal of electricity for air conditioning (a-c), a practice that is fast spreading around the globe, according to the IEA [22]. This study used actual hourly electricity and natural gas demand data for households, as well as hourly wind velocity and solar irradiance data in the region for renewable power generation. Matching the energy supply and demand was ensured at every hour of the year. Two cases were examined: the first when only electricity was generated by renewables, and the heating needs of the buildings were supplied by natural gas; and the second when heat pumps and renewable energy also supplied the needed heat. Of particular interest for assessing the effectiveness of energy efficiency measures was the introduction of the transition elasticity coefficients, which quantitatively assess the impacts of energy efficiency measures on thermodynamic variables and the needed infrastructure for decarbonization. Succinctly, the novel aspects of this study are:
  • Using realistic, actual hourly demand data for the community.
  • Using hourly power demand–supply matching for all hours of the year.
  • Introducing feasible energy efficiency and conservation measures to reduce the power demand.
  • Introducing the concept of elasticity coefficients that quantitatively describe tradeoffs between efficiency and power capacity increases.
It must be noted that the paper deals in a deterministic way with the principal engineering variables that would affect the energy transition. An estimate of the costs of the systems is also given at the end of the paper.

2. A Community of Buildings with Zero Carbon Emissions

The installation of rooftop photovoltaic (PV) systems and the conversion of new and existing buildings to Net Zero Energy Buildings (NZEBs) is touted as a viable option to reduce CO2 emissions. Essentially, NZEBs generate a surplus of electricity during the daylight hours of the year and withdraw that surplus from the grid during the night hours. While the NZEB notion is of a good standard, its wide application would cause significant problems for the electricity generation industry: when NZEBs multiply in a region, the grid must absorb a very high quantity of electric power during the late morning hours, when the demand is moderate. In the evenings, when there is no solar irradiance, the grid must supply all the power demand to the buildings. This causes a shift in the electric power demand on the grid, which develops a sizable dip during the late morning hours. At high market penetrations of PV systems in NZEBs, the residual demand in the summers becomes negative, and (in the absence of storage) the excess generated power is dissipated. This electric power demand trend has been called the duck curve [23,24]. More recent research on NZEBs examined and highlighted their effects on the electricity grid [25] and on the optimization of other systems (such as air conditioners and heat pumps) that are an integral part of NZEBs [26].
The duck curve and its counterpart for wind energy, the rattlesnake curve [27], cause significant electricity supply–demand mismatches; impose limits on wind and solar energy utilization; and constrain higher market penetration of renewable energy sources. ERCOT, the electric power grid for Texas that generates more than 24% of its electricity from wind, already suffers from the effects of renewable energy supply–demand mismatches: in March 2023, when there was high wind power output, more than 6.2% of the electricity day-ahead prices were negative; and more than 72% of contracts were at prices below $25/MWh, the borderline of system profitability [28]. This supply–demand mismatch and the limitation of higher market penetration of renewables can only be remedied by the development of substantial energy storage infrastructure [3,29,30].
While most energy efficiency studies consider single-building units and older home refurbishment with energy-efficient equipment, this study considers an entire community of 10,000 new households (equivalent to a small city), for the following reasons:
  • Larger energy generation and storage systems are more efficient and cheaper (per unit power and energy generated). The system’s operation and maintenance costs are spread over a larger population.
  • A recent study found that shared, community-based solar projects expand renewable energy access to more diverse and less affluent populations [31].
  • It is cheaper to install energy efficiency systems in new homes, which are designed for such systems, than to refurbish older homes.
  • When uniform energy efficiency systems are applied to a large number of buildings, significant economies of scale are realized.
The UN-Habitat estimated in June 2024 that, because of the current global housing crunch and the increasing global population, the world will need to build 96,000 new homes every day until 2030 [32]. Texas is a region that experiences very high population growth, the highest among the states in the USA. A considerable portion of this growth is happening in rural counties outside the big cities (where land area is abundant and inexpensive) and where new housing development projects have become ubiquitous [33]. It would be good if such new housing complexes were built with energy generation units and energy efficiency systems to make them zero-energy and grid-independent communities.
This study examined the needed infrastructure for a microgrid that would serve a model community of 10,000 residential buildings in North Texas—equivalent to a small town. Figure 1 is a schematic diagram for energy supply, storage, and consumption for the 10,000 residences. Renewable energy for this community is solely generated by wind turbines and PV systems. It must be noted that the wind turbines do not have to be located within or near the community. Because their operation is noisy, wind turbines are routinely placed in areas with high wind potential, and far from cities. This is not an impediment to the use of wind power, since the turbines generate alternating current at high voltage, and transmission of this power involves little dissipation. Parts of the PV systems may reside inside the community (on rooftops and in open spaces), while other parts may be outside the boundaries of the community, depending on land availability.
The North Texas region was chosen for the following reasons:
  • The region is endowed with significant renewable energy resources. The average solar irradiance is higher than 220 W/m2. Wind power availability is high, especially in the panhandle and the coastal areas, where average velocities are more than 12 m/s.
  • In 2023, the growing wind farms in the region generated approximately 108 TWh of electric energy, more than any other state in the USA [28].
  • The regional energy needs are very high.
  • The energy needs and general demand trends are similar to those of the entire southern region of the USA.
  • Actual hourly demand data are available for an entire year.
However, the geography of the state does not provide natural large energy storage sites—e.g., large underground caverns and lakes at high elevations. Another storage alternative would be large solid batteries or flow batteries. However, the quantity of energy storage needed for a community of 10,000 homes is very high—as becomes apparent in the results section—and is (at present) more costly. For this reason, hydrogen storage (supplemented with a small number of batteries to avoid renewable power curtailment and to enable fuel cells to operate steadily) is the only large-scale energy storage option for the 10,000 homes. Expanding the options to include this type of hybrid storage (hydrogen supplemented with batteries in an optimized combination) would enhance the adaptability of GIB communities to different regions. It must be noted that the results of this study can be easily converted from hydrogen storage to any other form of energy storage.
When it comes to energy demand, buildings in the region consume more electricity than in other states. The average Texas household is bigger than the USA average, and the weather significantly hotter in the summer. As a result, Texan households use a great deal of electricity for a-c in the summers; the annual electric energy consumption by the average Texas household is 13,128 kWh, about 26% higher than the USA average [34].
While the winters in Texas are relatively mild, heating is always needed at night and during cold spells. Most households are heated by natural gas, which is locally produced. The matching of energy demand and supply during every hour in this study determines the needed infrastructure for the community to become decarbonized and rely on its own microgrid. Two cases are examined. In the first case, only the electricity demand of the households is supplied by the microgrid, and natural gas supplies the heating. In the second case, the use of natural gas is eliminated, and all heating needs are supplied by heat pumps. The same thermodynamic cycle and equipment may be used as a-c in the summer and a heat pump in the winter.
Regarding energy efficiency measures, Texas households lag behind the rest of the USA, and the USA lags behind the rest of the OECD countries. In 2023, the average price of electricity in ERCOT was $0.142 per kWh, and the average price of natural gas was $14.18 per 1000 ft3 ($1.366 per therm). Cheap energy is not conducive to the adoption of energy efficiency measures, and the current building stock in Texas proves this dictum. With such a past history of cheap energy, it is not surprising that the average home in Texas is not rated on in the LEED scale and is not close to the new concept of “green buildings” [35,36]. The a-c systems in most households currently have low coefficients of performance (COP), with many homes served by inefficient window units. Most residential buildings have insufficient attic insulation, while their fenestration primarily consists of single-pane windows [34]. This implies that there is ample opportunity to reduce the energy demand in the average Texas household, primarily by two actions: (a) the installation of double-pane windows and thicker layers of insulation in attics that would significantly cut heat exchange with the ambient environment; and (b) the installation of more efficient a-c and heat pump systems. The installation of Ground Source Heat Pumps (GSHPs) has the potential to significantly increase the COP of households from the current average of 3.5 for a-c units to 9.0 or more [37], and there are several commercial systems that are marketed in the region with such high COP values. With the global emphasis on sustainability, such efficient buildings and clusters of buildings will become the backbone of self-sufficient clusters of homes with microgrids and of the “smart cities” of the future [38,39].

3. Governing Equations and Solution

Solar and wind energy are the primary renewable energy sources that generate all the electricity needed in the buildings. The instantaneous power and electric energy generated by the PV cells during any time period (0, t) are calculated as follows:
W ˙ P V i = A η T i S ˙ i a n d E P V i = 0 t A η T i S ˙ i d t A Δ t η T i S ˙ i
where A is the area of all the installed PV panels; S ˙ i denotes the total irradiance in the region—direct and diffuse; ηTi is the generating efficiency of the PV cells; and Δt is the time period—one hour in the calculations that follow.
The efficiency, ηTi, of the PV cells weakly depends on the ambient temperature. While the nominal efficiency of the PV cells is quoted in their specifications as being constant at 25 °C, the actual efficiency drops at higher temperatures. An extensive review of PV cells recommends the following expression for their efficiency when the ambient temperature is Ti during the ith time period [40]:
η T i = η 25 1 k s c T 25 , f o r T > 25 ° C η T i = η 25 , f o r T 25 ° C
Based on the types of PV cells that are available on the market, the values η25 = 0.24 and ksc = 0.0020 were adopted in this study.
Hourly values for the irradiance, S ˙ i in Equation (1), for the North Texas region were obtained from the National Solar Radiation Database, with the user manual for the database published in [41]. To avoid the effects of unusual weather phenomena—e.g., large summer storms, long dry spells, etc.—three-year averaged data were used in this study.
The wind power supply to the community was calculated using the average power supplied by the total nominal power of wind turbines in the area:
W ˙ W i = W ¯ W ˙ i n s t
where W ¯ is the (dimensionless) average power generated per unit power installed; and W ˙ i n s t is the actual wind power installed for the needs of the community. Hourly values for W ¯ may be computed from the data inventory of the electricity grid [28].
During every hour of the year, the electric power demand of the 10,000 buildings, EDi, is met in two ways: (a) either directly by the hourly energy generation of the wind turbines and PV systems or (b) by a combination of these energy sources and a fuel cell system, which utilizes the stored hydrogen. When hourly power generation by the wind and the PV system is higher than the demand, the difference (energy surplus) is converted to hydrogen gas, and the generated mass of hydrogen is added to the storage system. When the hourly generation is less than the demand (energy deficit), the fuel cells consume some of the stored hydrogen to generate an energy deficit, as follows:
E P i E D i = δ E S i
where EPi is the energy produced by the PVs and wind turbines during the hour i; EDi is the energy demand from the cluster of buildings; and δESi is the change in stored energy, which can be positive or negative. At the end of the ith hour in the year of simulations, the level of energy storage, ES, is given by one of the following equations:
E S i + 1 = E S i + δ E S i η e l i f E P i E D i E S i + i = E S i + δ E S i / η f c i f E P i < E D i
where ηel is the efficiency of the electrolysis process that produces hydrogen gas; and ηfc is the conversion efficiency of the fuel cells. The efficiencies of the two processes define the dissipation of the energy storage/recovery system.
To improve the reliability of the energy system for this community, it was stipulated that, at all hours of the year, sufficient energy must remain in the storage system to generate enough power for the buildings during the following ten days (240 h). The implication of this constraint is that the hydrogen level does not reach zero, and the system always maintains a minimum amount of energy to distribute to the microgrid. If the renewable power generation systems malfunction or completely fail—e.g., because of an extreme weather event, such as a hurricane, a tornado, or a winter polar vortex—community managers would have sufficient time to repair the system or purchase power and hydrogen from the marketplace to ensure continuation of the energy supply. It must be noted that there is an active hydrogen market in Texas, a state that hosts three large underground hydrogen storage facilities, with a total energy capacity of 332 GWh [42]. Using energy storage is an advantage for the renewable energy transition: the effects of bad weather, which often result in local and regional electricity disruptions and blackouts, are mitigated by the use of stored energy.

Solving the Governing Equations

With 1 h as the timescale of the computations, the governing equations yielded a system of 8760 linear, algebraic equations that are sequentially solved, starting at hour 1 and ending at hour 8760. Periodic conditions were applied to this system, with a time period of one year: at the end of the year (8760th hour), the state of the entire system must be the same as the state at the first hour. The system at the end of the year reverts to its original state, and the process can be repeated year after year. As a consequence, at the end of the 8760th hour, the stored energy level is equal to the energy level at the beginning of the 1st hour. Thus, the solution of the system was derived by iteration using the energy storage level as the pivot variable. The following steps were used in the iteration process:
  • An initial wind power capacity was stipulated for the supply of wind power. This was treated as a parameter in the calculations. Based on this, the wind energy supply was computed for all hours of the year.
  • A quantity of stored energy (in hydrogen mass) ES0 at the beginning of the first hour of the year was stipulated.
  • The two values from steps 1 and 2 were recorded in a computer program that also included (for the entire community): the hourly a-c demand; the hourly total electric energy demand; and the heating demand for space heating in the winter and hot water throughout the year.
  • An area, A, of the PV system was assumed. Based on the local irradiance, the hourly PV energy generation was computed and added to the hourly wind energy generation.
  • Equations (4) and (5) for the surplus or deficit of energy were solved, and the two quantities were sequentially calculated for all hours of the year, starting at hour 1 and ending at hour 8760.
  • At the end of the calculations, the stored energy at the end of the year, ES8760, was computed. ES8760 was compared to the originally stipulated value ES0 in step 2. If ES0 < ES8760, additional energy is needed, and A is increased. If ES0 > ES8760, the area A is decreased. Steps 5 and 6 were repeated with the new value for the required PV area A until ES0 = ES8760. The last value was the required PV area. In combination with the wind power capacity, stipulated in step 1, the two renewable energy sources (supplemented with the storage system) generated sufficient energy for the entire year.
  • The correct value for ES0, which was stipulated in step 2, was calculated in a second iteration, which made use of the minimum energy storage condition that the energy storage system must contain sufficient energy/hydrogen to satisfy the entire demand for the next ten days (240 h), even when zero additional power is generated. Thus, ES0 was modified until its correct value indicated that the minimum stored energy constraint was satisfied.
After the correct values of the parameters were calculated, the maximum hydrogen mass that was stored in the system throughout the 8760 h of the year was obtained, and the required volume of the hydrogen storage system was computed using the density of hydrogen at 300 K and 50 MPa (30.6 kg/m3). The annual energy dissipation, due to the irreversibility in the energy storage and recovery processes, was also determined as the difference between the generated energy and the energy consumed in the 10,000 buildings.

4. Results and Discussion

Hourly energy demand–supply calculations were performed for two cases: Case A, when renewable energy sources supplied only the electricity demand; and Case B, when the a-c systems in the buildings doubled as heat pumps, and the renewable energy sources supplied electricity to also satisfy the space and water heating requirements of the community. In this case, there is no need to consume any natural gas, and the community achieves complete decarbonization.

4.1. Case A: Electricity Source Substitution with Renewables

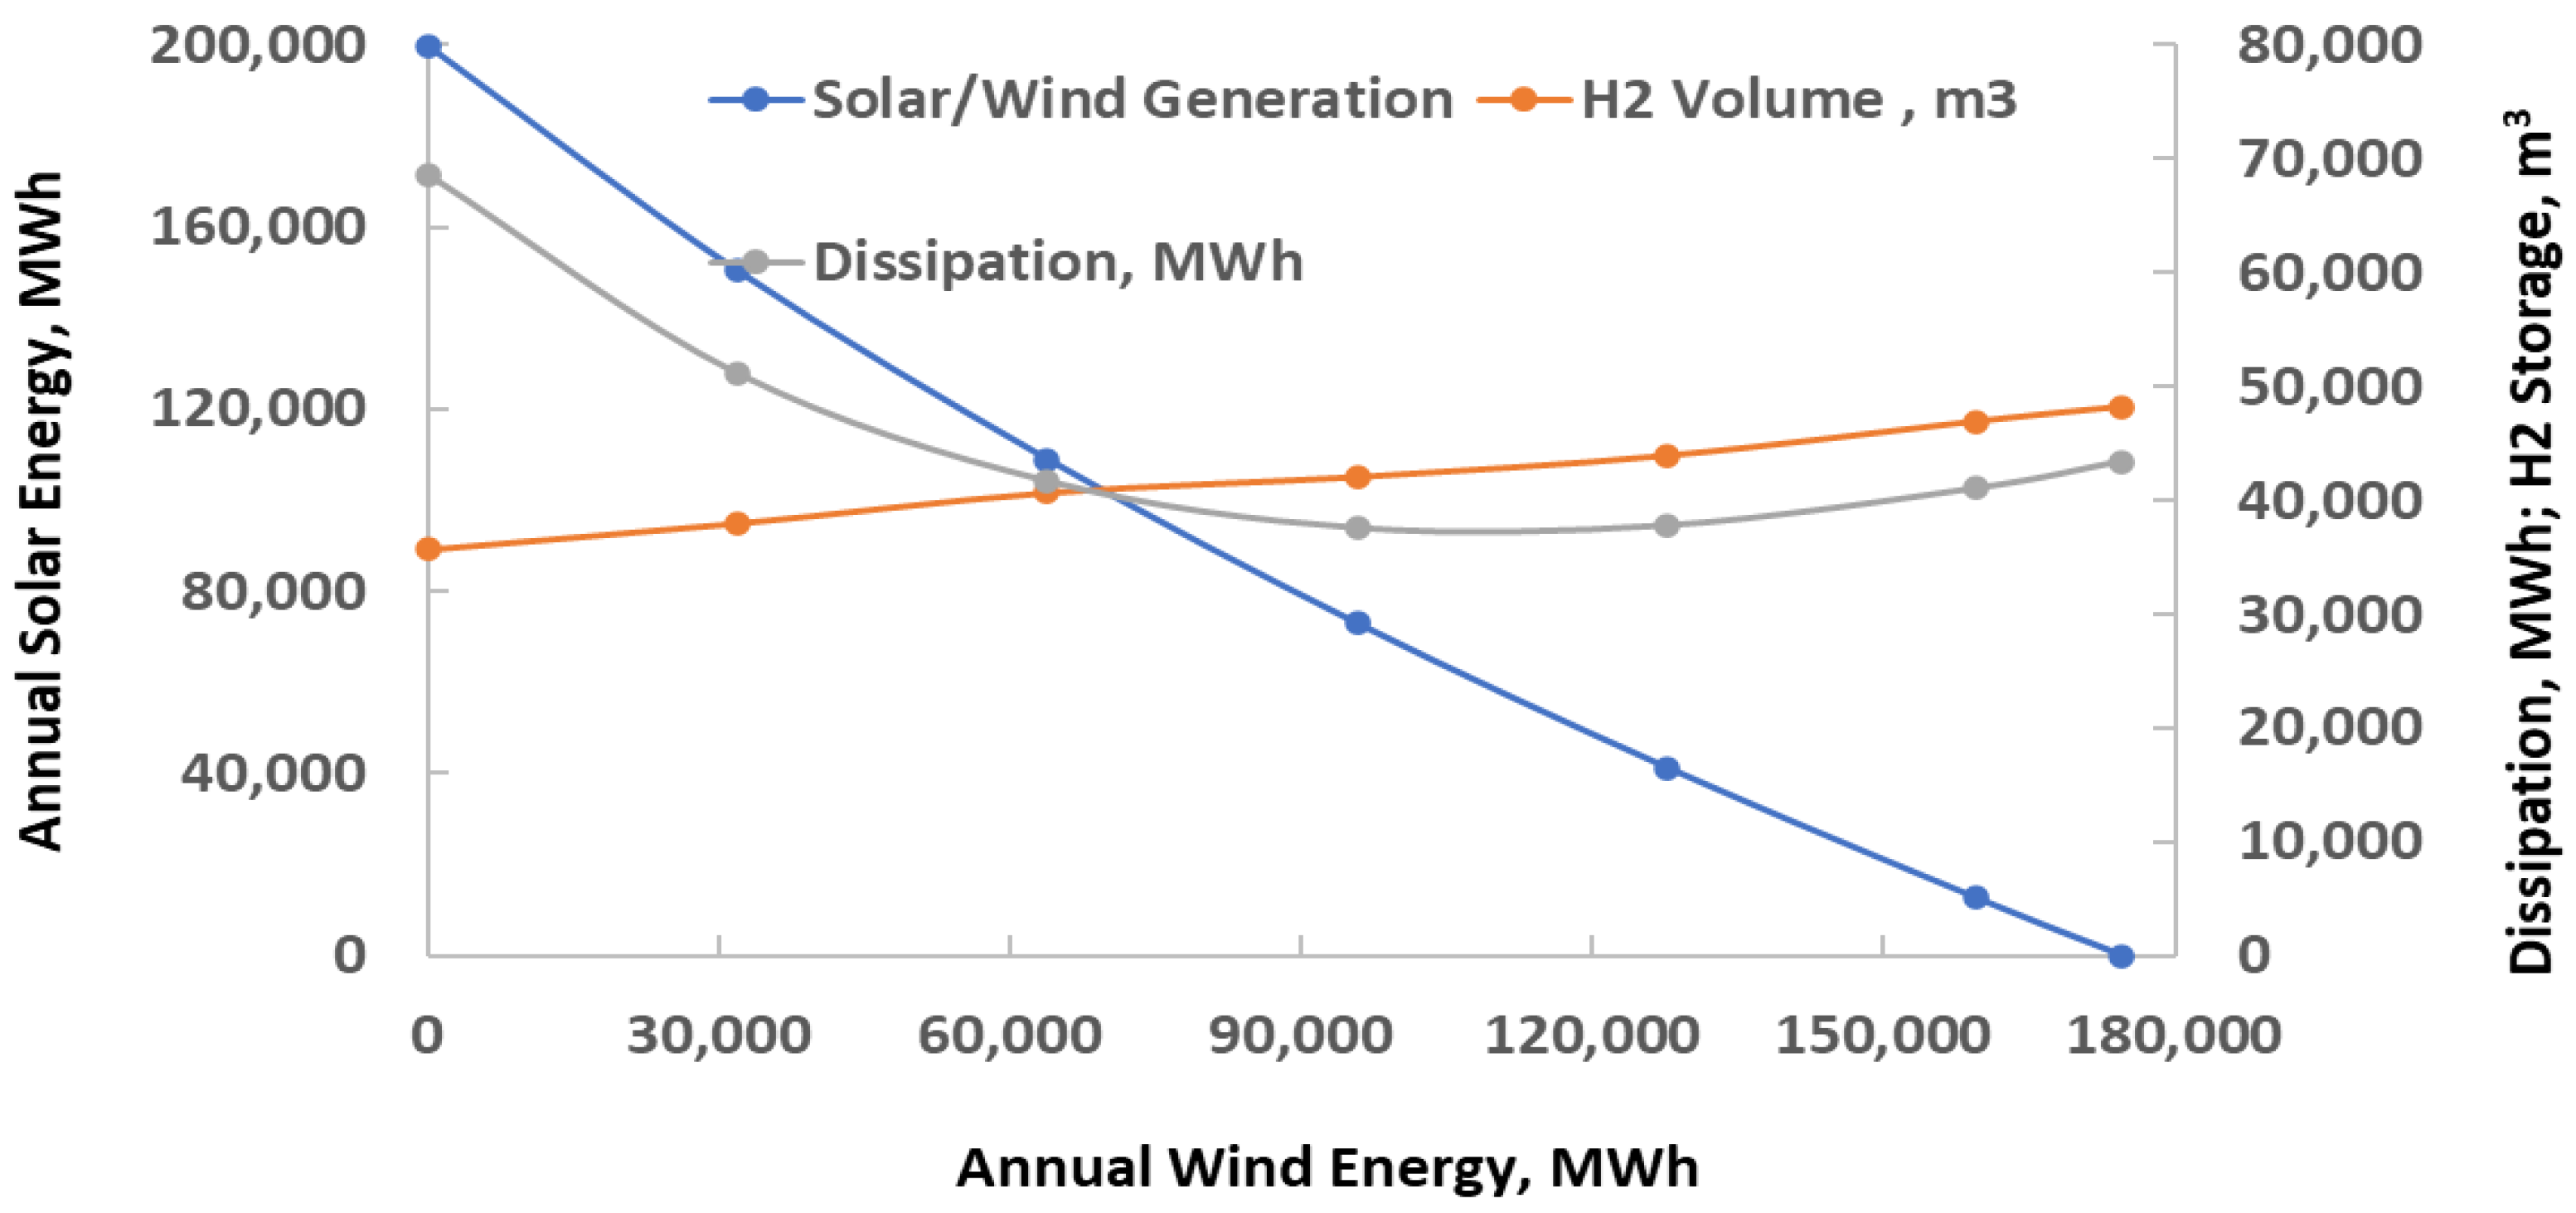
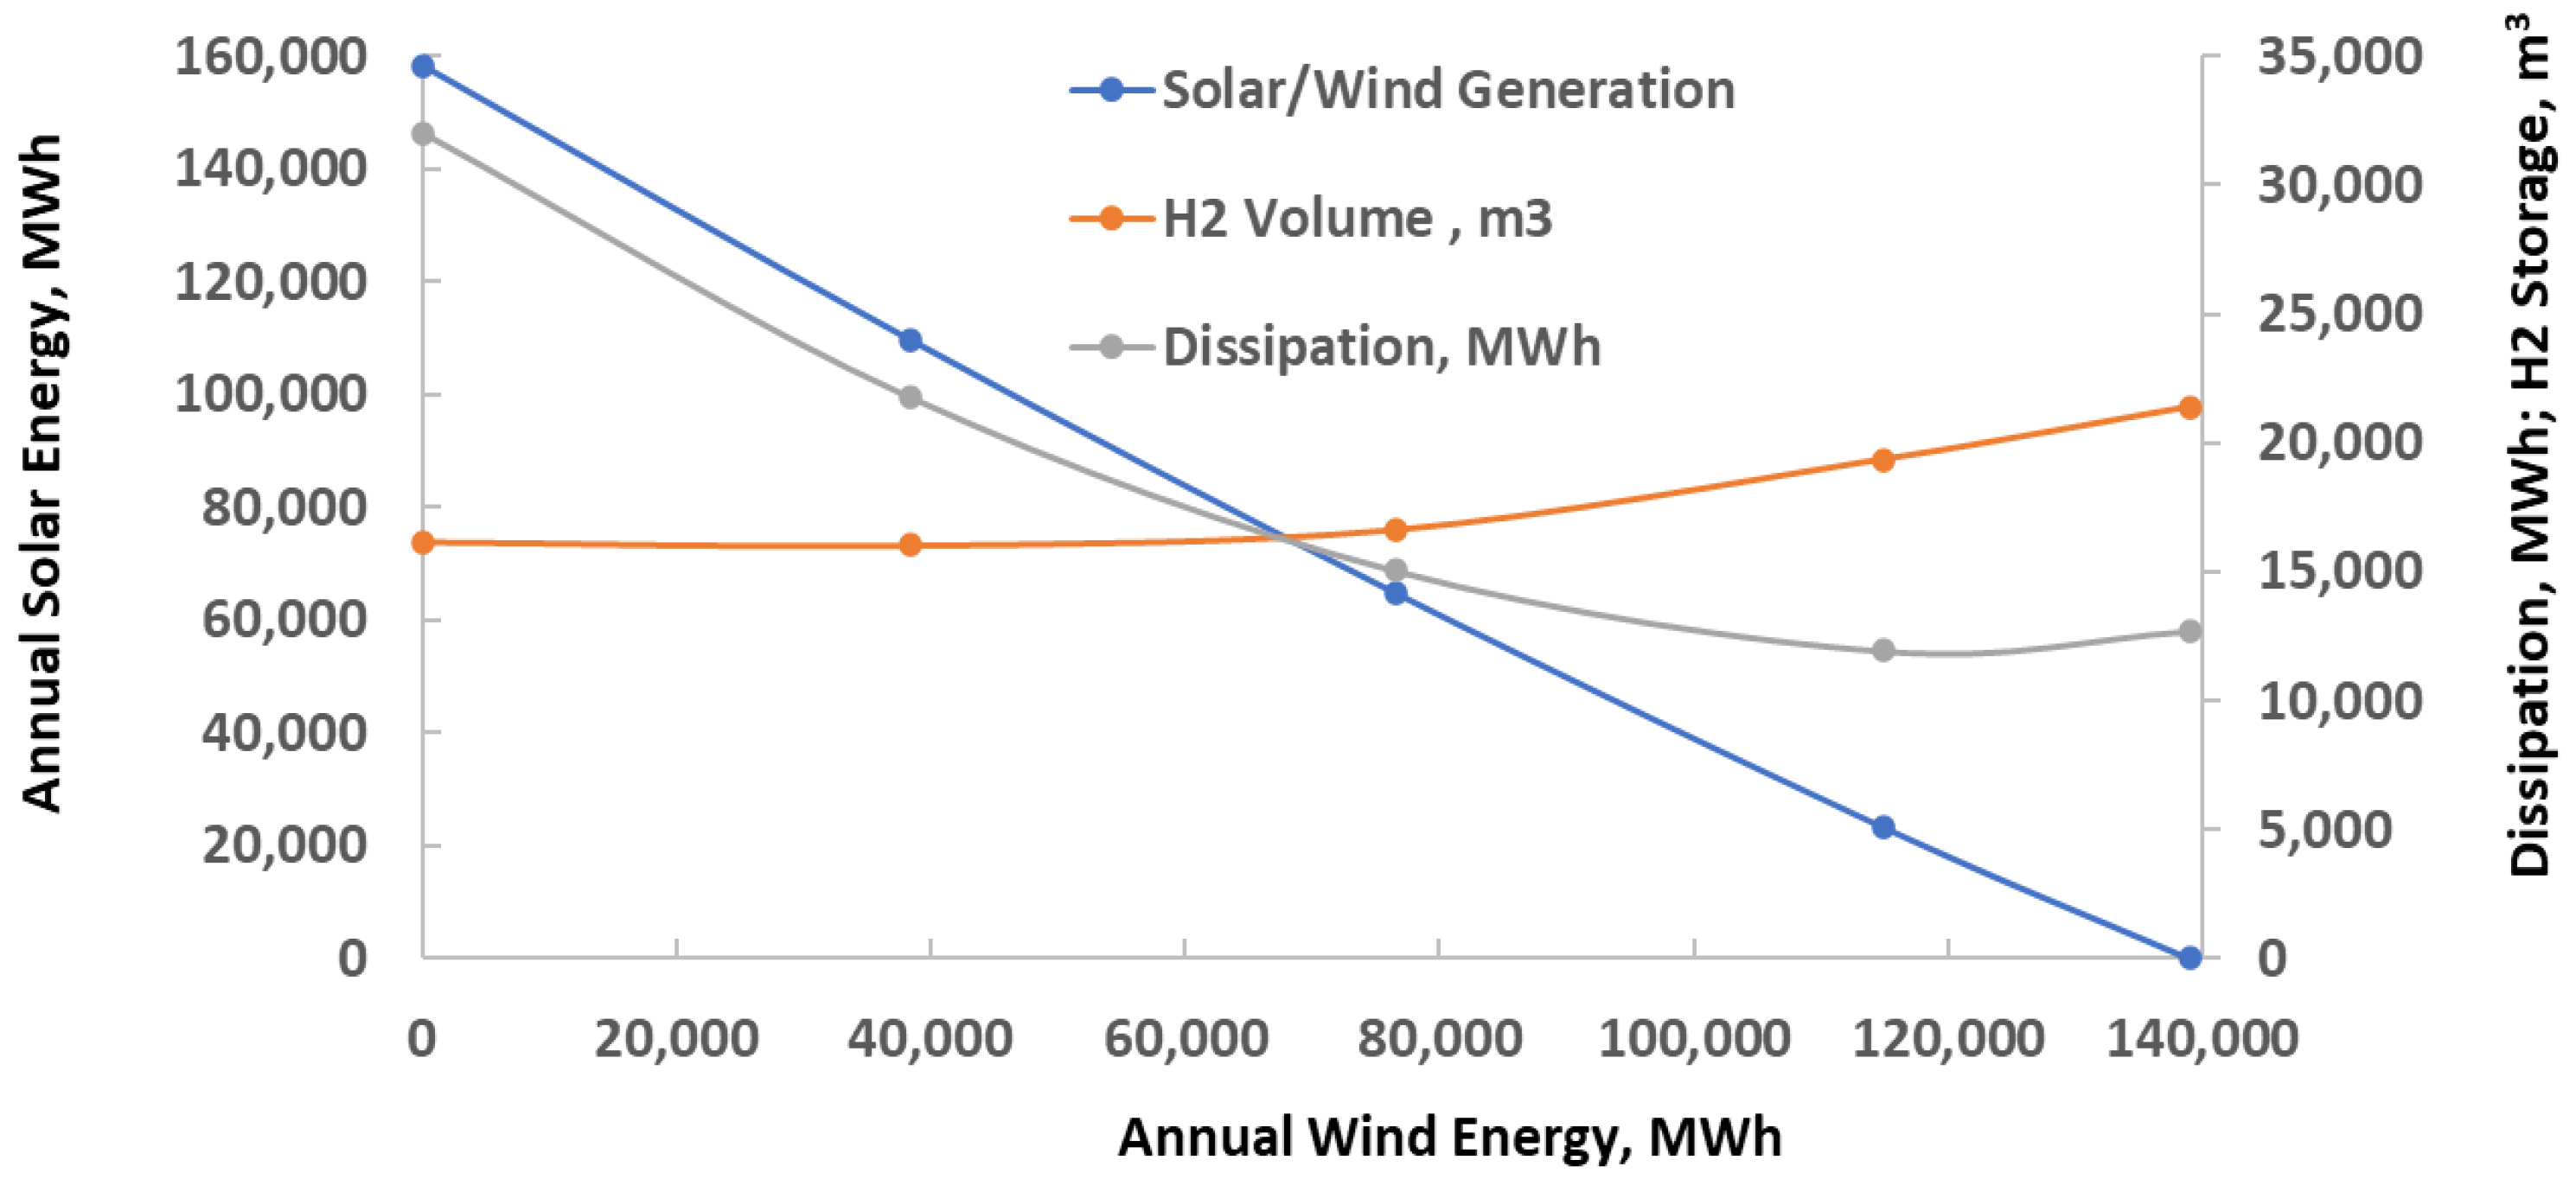
A baseline computation was first conducted to determine what would be the renewable power capacity and storage requirements for the cluster of buildings to become grid-independent and satisfy their electricity requirements with the current average COP of households in Texas (3.5). The results are shown in Figure 2. The ordinate of the graph is the annual energy generated by the wind, and the abscissas show (left) the corresponding energy generated by the PV system and (right) the energy storage capacity requirement (in m3 of hydrogen) and the annual energy dissipation (in MWh). Since the renewable energy transition involves both wind and solar energy systems, the two systems complement each other, with an increase in wind energy implying that less solar electricity is needed. Because the wind generation units have higher capacity operating factors than PV units, the slope of this curve was −1.12 MWh solar per MWh wind. It is also observed in Figure 2 that the annual energy dissipation attained a weak minimum.
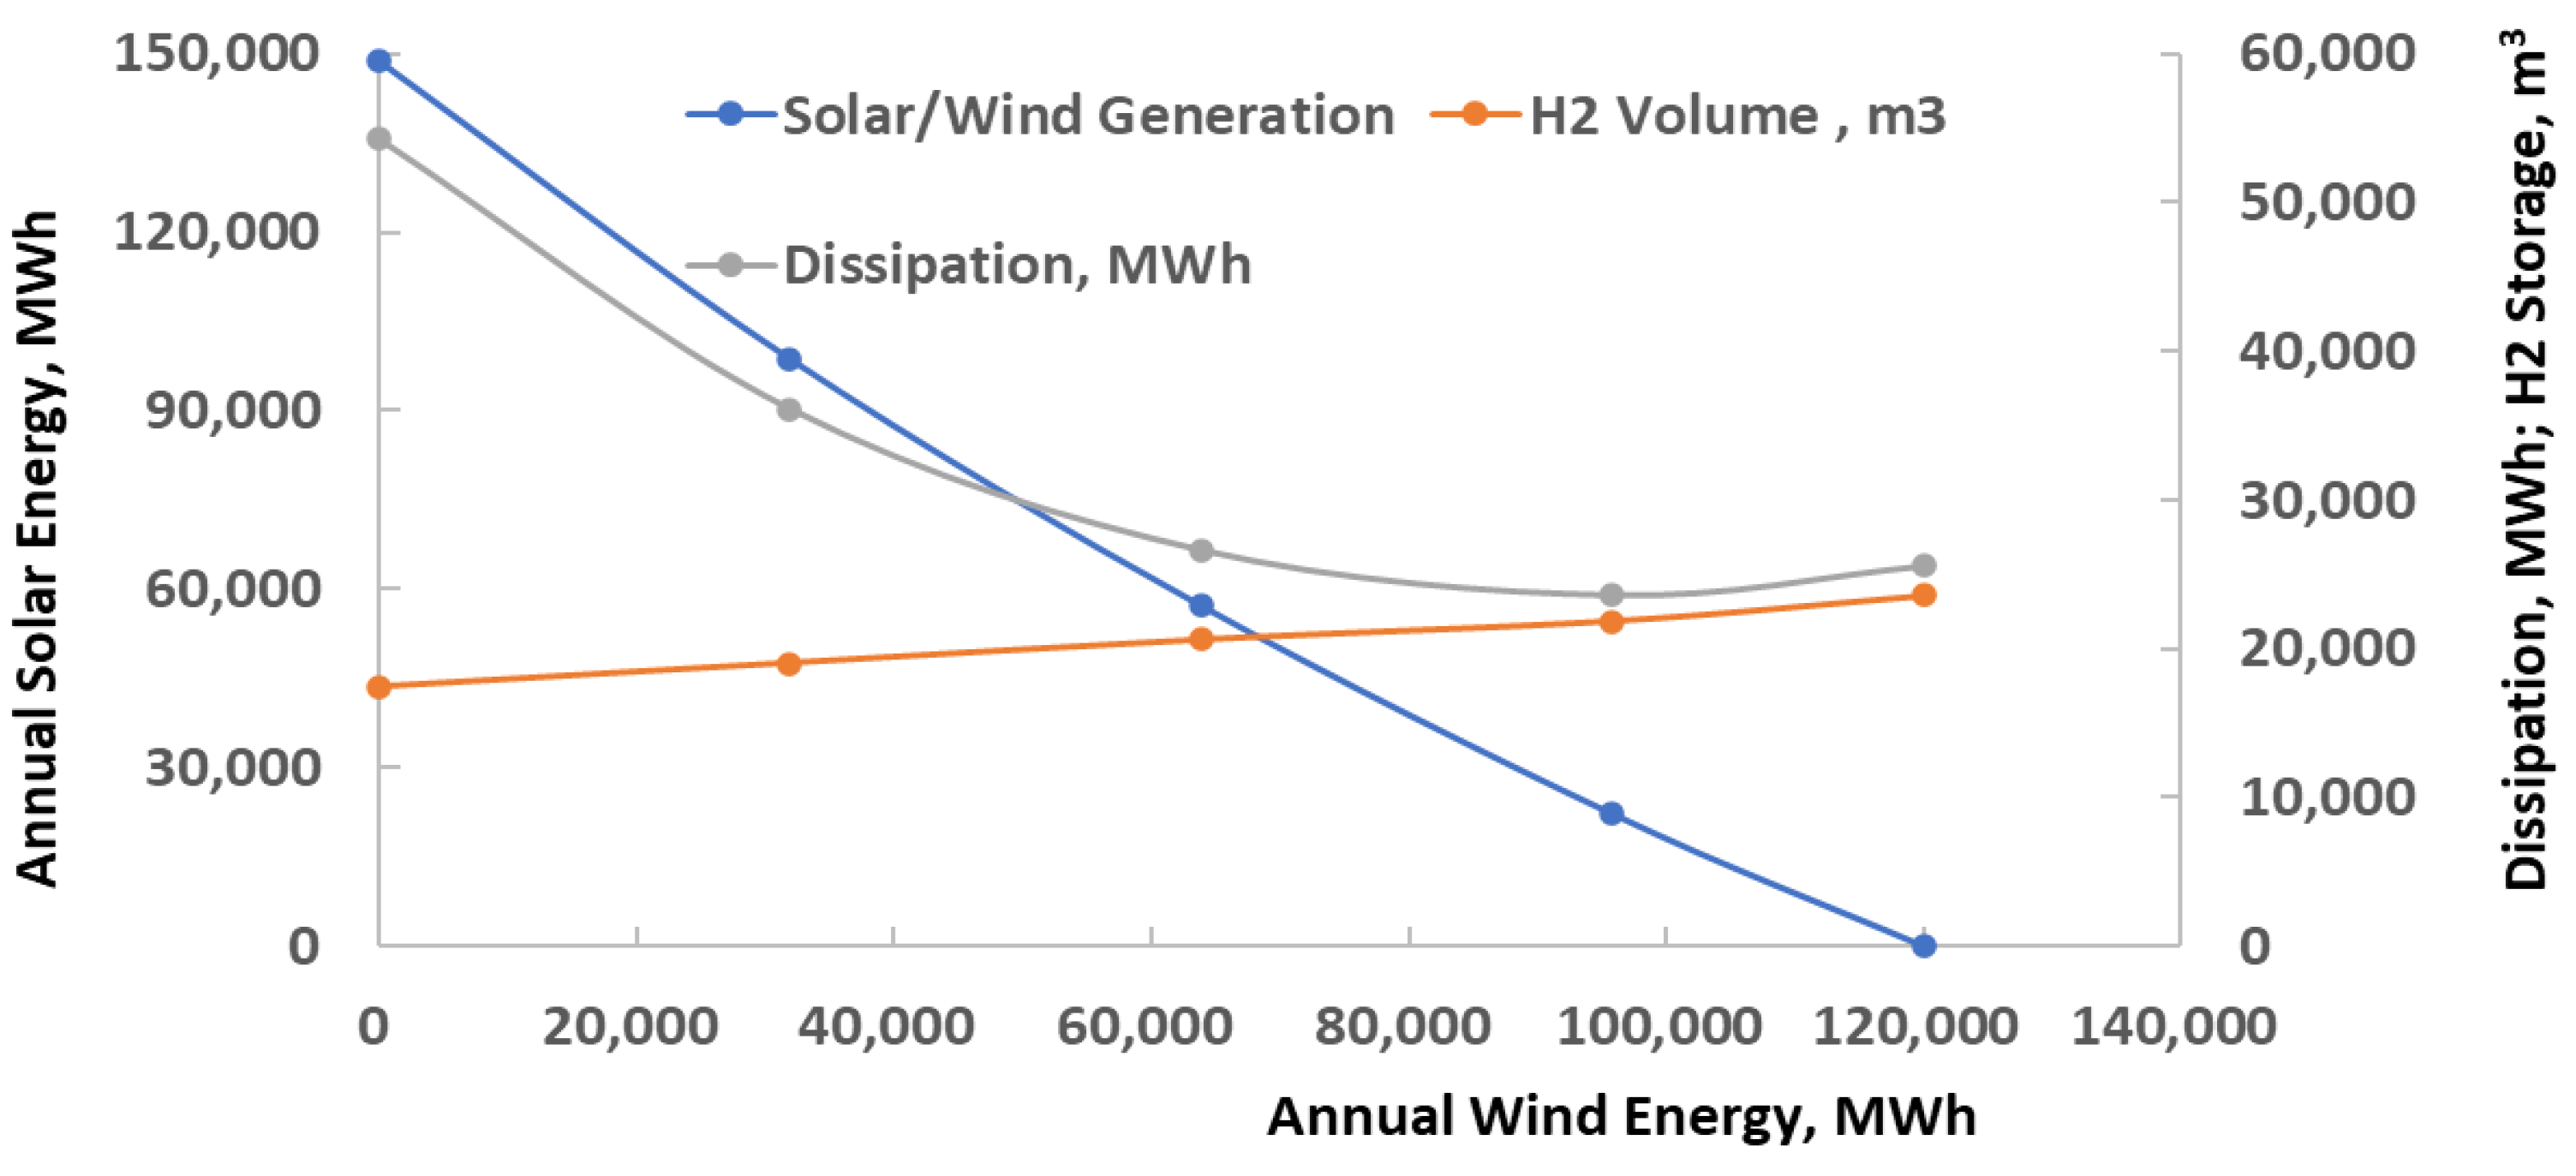
Computations were performed for more efficient a-c units, with the COP values increasing from 3.5 to 5, 7, and 9. Figure 3 shows the energy needed from wind and solar, the dissipation, and the storage requirements for the transition of the community to renewable energy sources when COP = 9.
A comparison of Figure 2 and Figure 3 proves that this energy efficiency measure had a very significant effect by substantially reducing the needed annual energy (which implies lesser investment in renewable power sources), the quantity and volume of hydrogen needed for energy storage (which implies lesser investment in electrolysis, storage, and fuel cell capacity), and the annual dissipation (which is essentially electric energy generated and wasted).
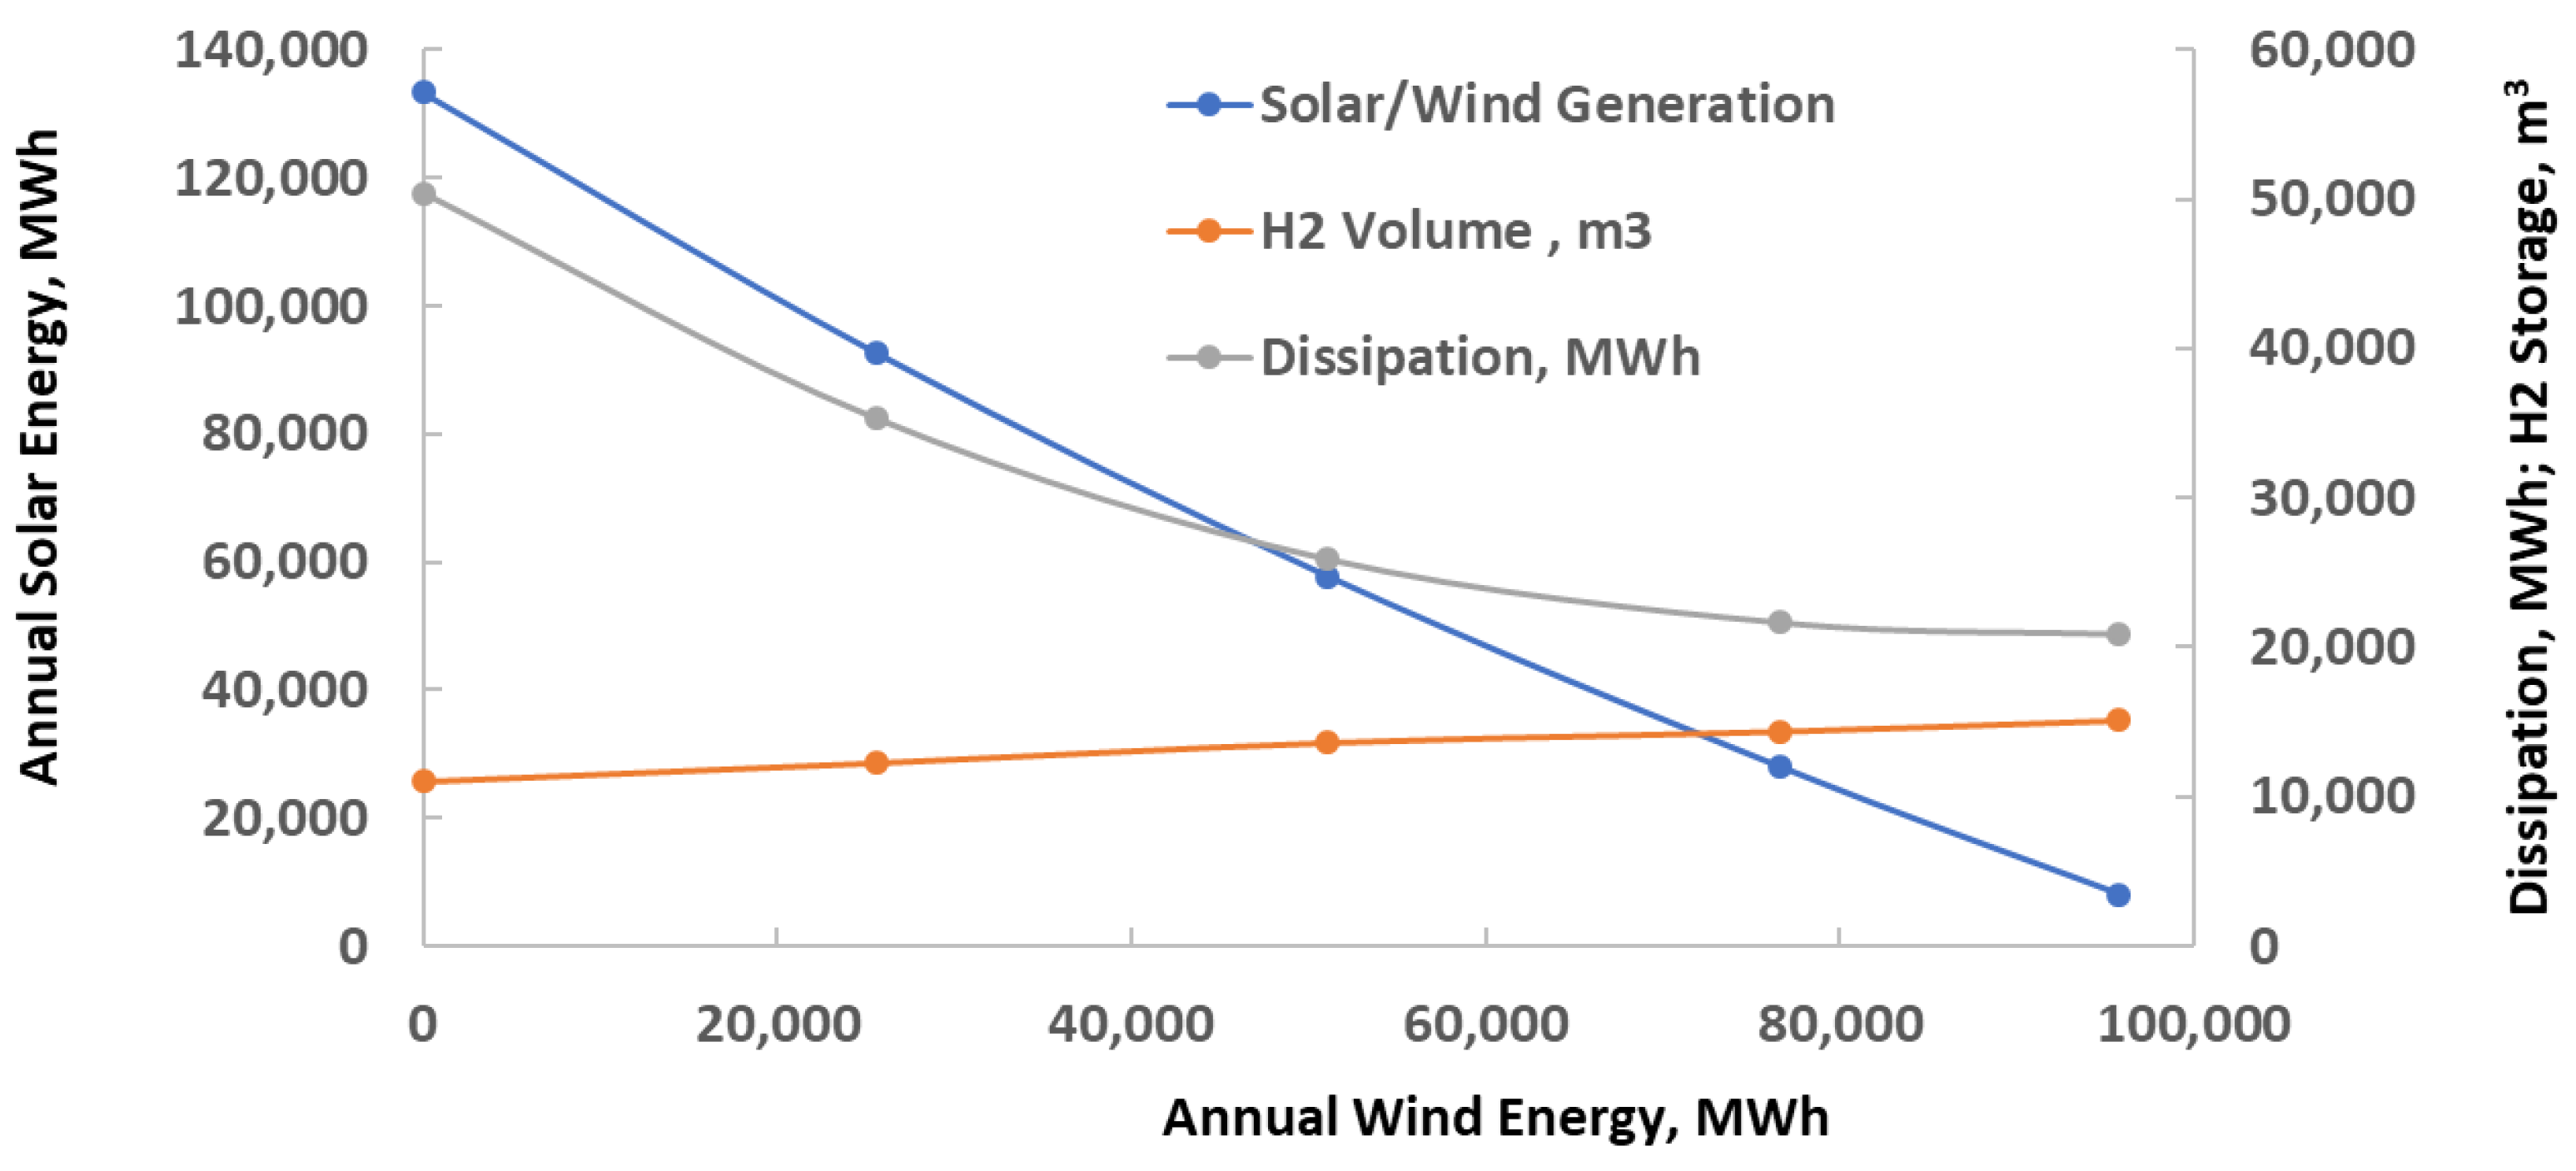
Improving the insulation of buildings is another energy efficiency measure that reduces the required investment for the transition to renewable energy [43]. Calculations were conducted for the case in which insulation improvements (double-pane fenestration and attic insulation) reduced by half the heat transfer to the buildings during the summer, thus reducing the a-c electricity consumption by 50%. The results of these calculations are shown in Figure 4.
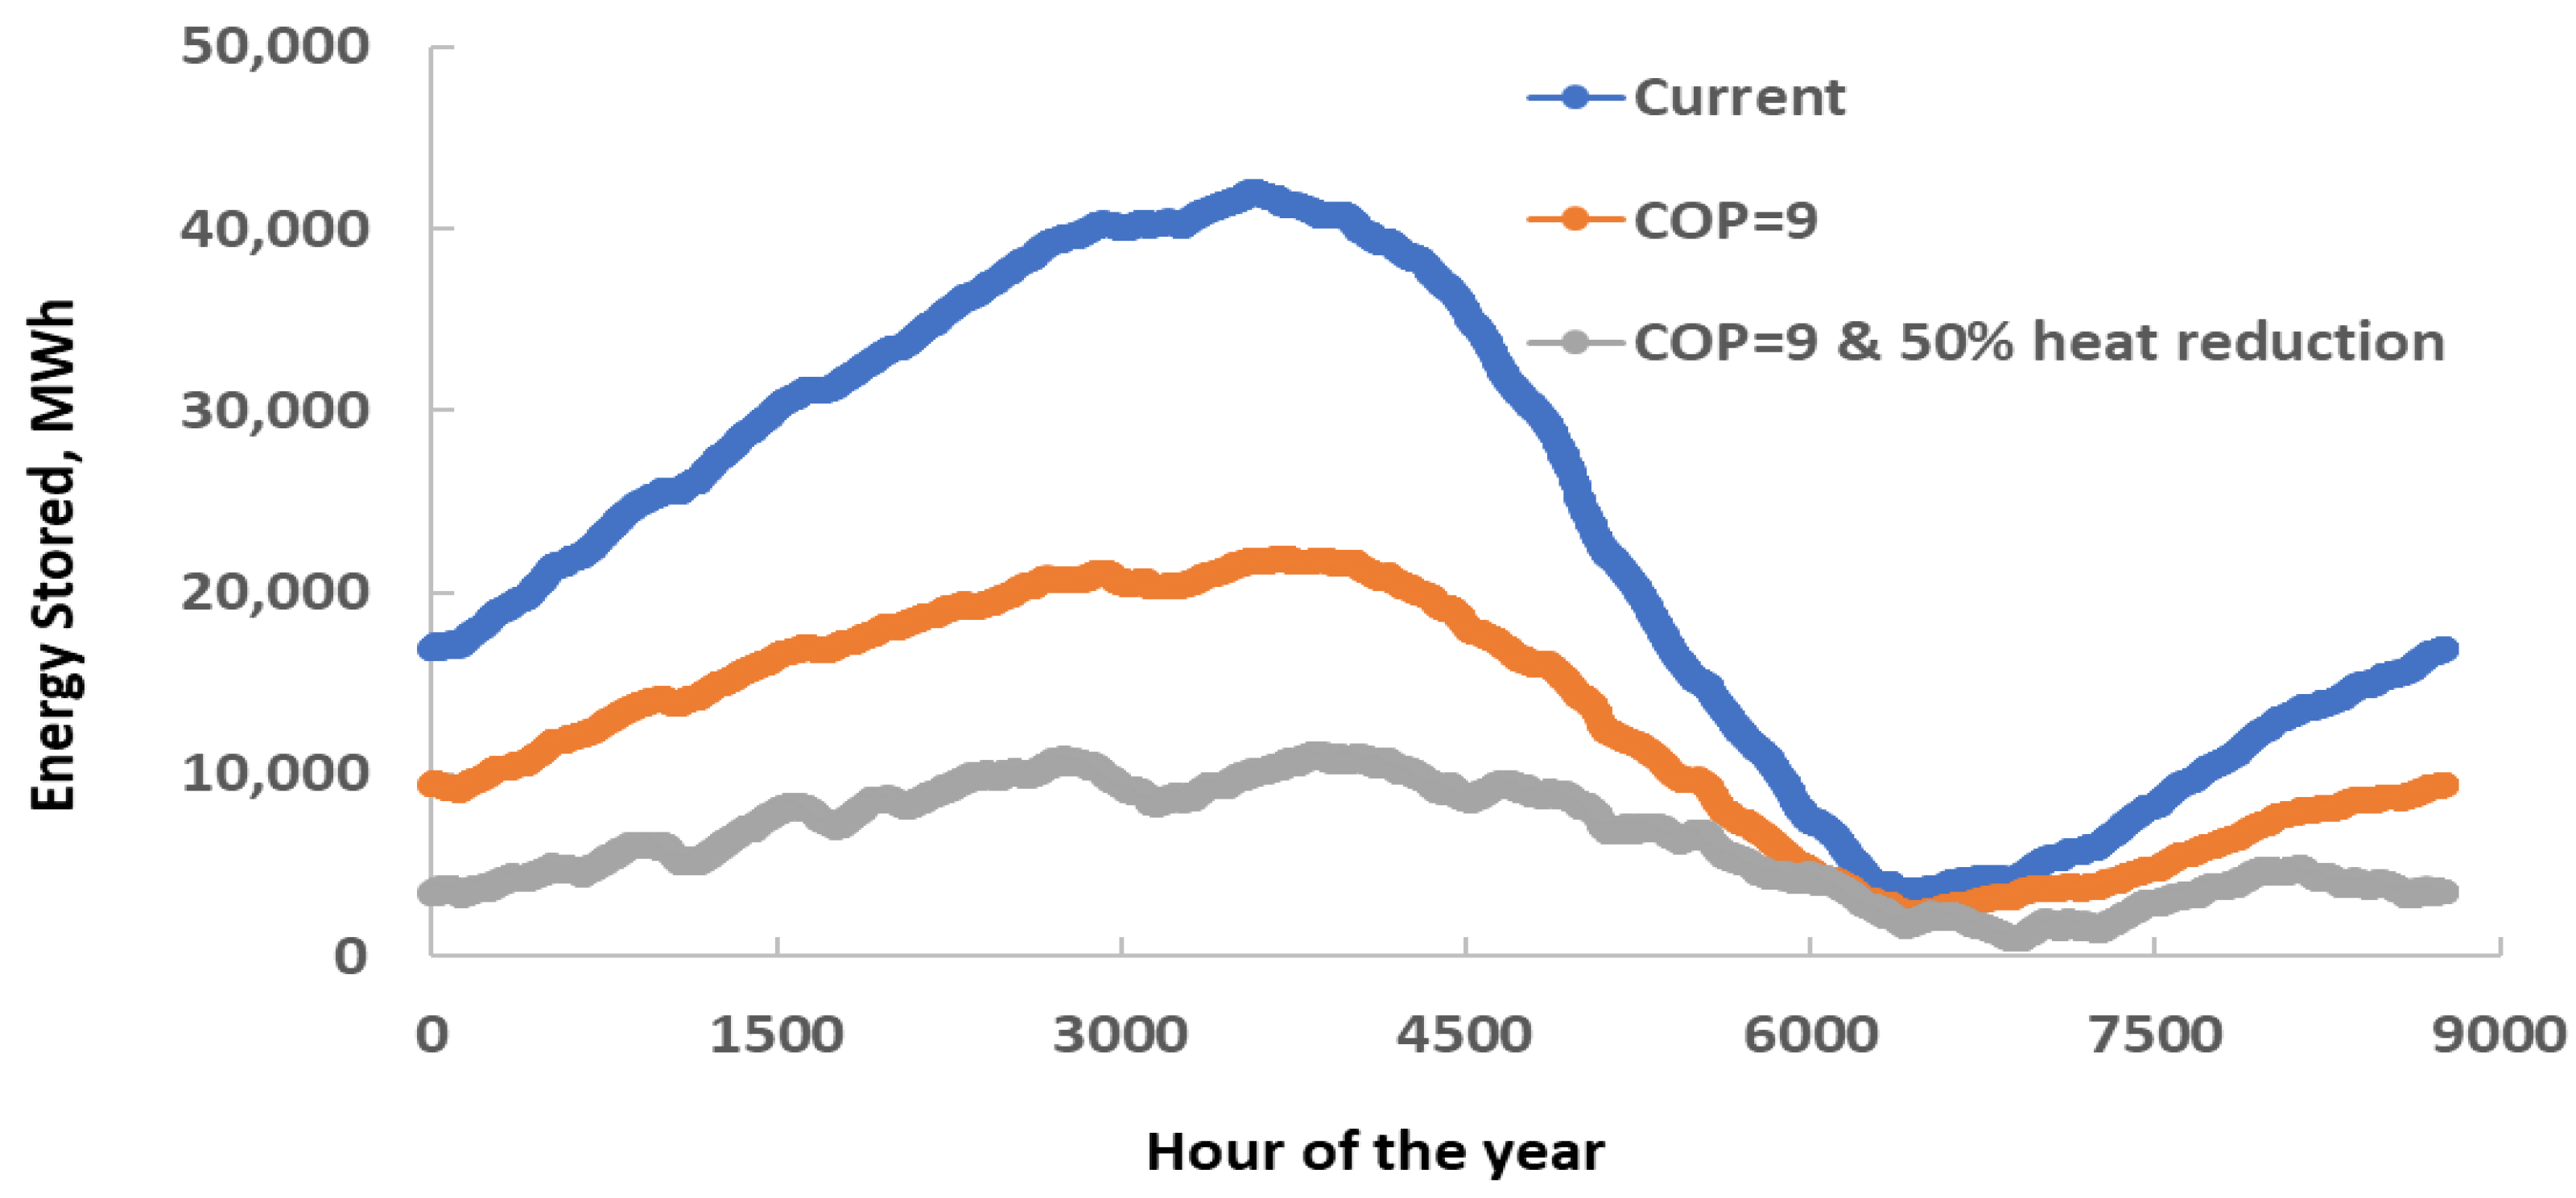
Figure 5 shows the state of the energy storage system during all hours of the year for the three cases, whose results are depicted in Figure 1, Figure 2 and Figure 3. The solar–wind energy mix was chosen at the minimum dissipation points for this figure, and the stored energy was measured in MWh. For the interpretation of the results of Figure 5, 1 kg of hydrogen is equivalent (−ΔG0) to 118.5 MJ of chemical energy, or 32.9 kWh or 0.0329 MWh. Also, the density of hydrogen at 50 MPa and 300 K is 30.662 kg/m3, which implies that 1 m3 of hydrogen at these conditions stores approximately the equivalent of 1 MWh of chemical energy.
The maximum of the curves in Figure 5 is the measure of the required energy storage for the 10,000 buildings, as reported in Figure 2, Figure 3 and Figure 4. It is apparent in Figure 5 that the maximum stored energy occurred at the beginning of June (at approximately hour 4000 of the year). The stored energy was consumed by the a-c units in the summer, and the energy storage minimum occurred at the end of September, when the hotter days in the region were over. From September to June the energy storage system gradually accumulated surplus energy to be used in the next summer [44]. It is also apparent from Figure 5 that the adoption of energy efficiency measures significantly decreased (by factors of 1.9 and 2.6) the energy storage requirement (in volume or mass of hydrogen).

4.2. Case B: Electricity and Natural Gas Substitution with Renewables

This case entailed operation of the a-c equipment as heat pump units during the winter months for the supply of space heating and generating hot water. Hot water during the summers is also supplied by the a-c units, since all refrigeration cycles dissipate heat [3]. It must be noted that the COP of the heat pump systems is, by definition, one unit higher than the COP of a-c systems, when the two utilize the same thermodynamic cycle. Thus, for the baseline case, when the refrigeration cycle operated for the removal of heat (a-c system), its COP was 3.5, and when it operated as a heat pump, its COP was 4.5. Figure 6 depicts the annual energy generated by wind and solar irradiance, the energy storage requirements, and the annual energy dissipation, for the baseline case.
A comparison of Figure 2 and Figure 6, which depict the same variables for the two baseline cases, reveals that the total energy required for the entire decarbonization of this community was higher in the second case—this is as expected, since additional energy and installed power are needed for the generation of electricity, as well as for the substitution of natural gas. A rather surprising result was that the required storage was less in the second case. This happened because of the higher total nominal power of the electricity generation units. Since energy storage was primarily required for the operation of the a-c units during the summer, the additional electric power generation alleviated part of the storage burden. Because of the lower storage requirement, the annual energy dissipation was also lower in Case B.
Figure 7 and Figure 8 correspond to Figure 3 and Figure 4, respectively, and depict the generated energy savings, as well as the storage savings, when energy efficiency measures were adopted and the COP of the a-c units was improved to 9 (Figure 7), and when, additionally, the heat transfer coefficients of the buildings was improved to reduce heat losses (in the winter) and heat gains (in the summer) by 50% (Figure 8). A comparison of the corresponding figures confirms significant reductions in the required energy and storage capacity due to the energy efficiency measures.
An interesting observation from comparison of the data shown in Figure 4 and Figure 8 is that, when the buildings were well insulated and operated with efficient a-c systems, it took a relatively small amount of additional electric power for the heat pumps (reversed a-c units) to generate the needed heat. For example, with the wind turbines at a nominal capacity of 24,000 MW, an additional 3193 kW of PV power (0.32 kW per household) would enable the efficient heat pumps to provide all the heat (currently at 1143 TJ) needed for the community and avoid the combustion of approximately 1.083 billion ft3 of natural gas.
The hourly quantity of energy in the hydrogen storage system is shown in Figure 9. As in case A, the energy efficiency measures resulted in significant reductions in the required storage (by factors 1.6 and 2.2), as represented by the maximum of the three curves. An interesting observation from Figure 9 is that the energy stored in the system had a second, but lesser, maximum, at the beginning of December, signifying that part of the energy stored during the autumn months was spent on operation of the heat pump systems during the winter months.

5. Elasticity Coefficients for Transition

While Figure 2, Figure 3, Figure 4, Figure 5, Figure 6, Figure 7, Figure 8 and Figure 9 provide a rather qualitative depiction of the effects of energy efficiency on key parameters for the decarbonization of clusters of residential buildings, more quantitative information is imparted by the transition elasticity coefficients, which are defined as the effects of one-unit improvement of the COP on the calculated variables. Thus, four elasticity coefficients were defined for the total needed nominal power reduction, Cnp, the annual energy generation, Cen, the required storage, Cst, and the resulting energy dissipation, Cde. Accordingly, these coefficients are defined by the following expressions:
C n p = W ˙ P V + W ˙ w C O P δ W ˙ P V + W ˙ w δ C O P , C e n = E P V + E w C O P δ E P V + E w δ C O P C s t = V max C O P δ V max δ C O P , C d e = E d i s C O P δ E d i s δ C O P
where EPV and Ew represent the total annual energy generated by the PV units and the wind units respectively; Vmax corresponds to the required volume of the hydrogen storage system; and Edis is the annual energy dissipation, due to the storage-regeneration process. Table 1 and Table 2 give the values of these coefficients for cases A and B, respectively. The last row of the two tables shows the elasticity coefficients when, in addition to the improvements of the a-c and heat pump systems, improved insulation in the buildings reduced the heat exchanged with the environment by 50%.
The numerical values in Table 1 and Table 2 show that there are diminishing returns in the application of energy efficiency measures. In case A, when the coefficient of performance of the a-c units increased from 3.5 to 4.5, there was a reduction in the nominal required power by 10,390 kW and in the required hydrogen storage capacity by 6452 m3; while, if the COP is increased from 7 to 8, the corresponding reductions were 2774 kW and 1671 m3. This observation supports current policies that assist in the refurbishing of older homes with the most inefficient a-c systems and least insulation. However, a glance at the numbers in both tables proves that, even with diminishing returns, the reductions in needed power, total energy generated, storage capacity, and dissipated energy were significant, and that energy efficiency measures substantially contributed to a reduction in the needed investment for the decarbonization of this community.

6. A Note on Cost

The focus of this study was the effect of energy efficiency on physical variables associated with the energy transition to renewable sources. The study was based on energy balances (the Laws of Thermodynamics) that are inalienable and permanent, as well as on the engineering performance of systems (e.g., the heat pump units and water electrolysis units), with which the engineering community has a great deal of experience. Consequently, the results of the study are subject to very low levels uncertainty. On the other hand, the prices and the cost of the systems needed for decarbonization of the electricity industry are determined by market forces, meaning that they are volatile and subject to high levels of uncertainty. Even though solar and wind power generation are almost mature and proven technologies, the cost of constructing solar farms and installing wind turbines fluctuates and varies significantly with time and locality. The life cycles (time to replacement) of PV cells and wind turbines are also uncertain. The cost of energy storage systems, which depend on currently developing technologies, fluctuates even more widely. An earlier study noted that energy storage systems are in the developmental stage or in early stages of commercialization, and that any cost estimates are site-specific and may be incongruent with each other [45]. A more recent survey of more than 100 cost publications confirmed this incongruency and concluded that energy storage costs show very high dispersity, and that cost estimates often differ by a factor of three or more [46].
Because of the high uncertainty of cost estimates and the temporal variability of all prices, it was decided not to include a detailed cost analysis in this study and to only present the scientific results that are demonstrable and subject to low uncertainty. Based on the available information, an attempt was made to derive estimates on the capital (investment) expenditures of the systems under comparison, namely the investments on the efficiency measures, the required installed power, the storage system, and the fuel cells that convert hydrogen to electricity. The cost values were obtained from US-DOE data [47], and the results appear in Table 3 for a single home in the community (to better communicate the impact to homeowners).
It is apparent from Table 3 that striving for high efficiency significantly reduces the investment costs for the transition to renewable energy. The estimate in this case amounts to a 32% investment cost reduction.

7. Conclusions

Decarbonization of the electricity generation sector requires significant infrastructure (power generation units, storage facilities, fuel cells, etc.) if energy demand remains the same. High a-c usage in combination with inefficient a-c units and buildings with inadequate insulation will make the “business as usual” approach to decarbonization very expensive. The calculations in this study showed that the electricity and heating requirements in a decarbonized community of homes in North Texas can be met with significantly lesser infrastructure if the buildings are well insulated and the a-c systems are among the most efficient on the market. Energy management and policy recommendations that emanate from the results of this study include:
  • Advance local regulations that would encourage new housing developments to install adequate insulation (in attics and windows), as well as efficient GSHP units for a-c and heat pumps.
  • Promote the dual use of a-c units and heat pumps instead of piping natural gas to homes.
  • Offer incentives for efficiently built housing developments to become grid independent by storing part of the electric energy generated by renewable energy sources.
  • When hydrogen generation and storage equipment reach the markets, advance regulations for all new housing developments to become grid-independent and operate their own electricity microgrids.
  • Offer incentives for existing buildings to significantly improve their insulation and the efficiency of their a-c units.
The transition elasticity coefficients which were introduced in this paper offer a quantitative measure for the savings in all the energy infrastructures needed for the transition to renewable energy sources. The results of this study show that the implementation of appropriate energy efficiency measures will decrease the total renewable power by a factor of 2.9; decrease the energy storage by a factor of 2.0; and decrease the annual energy dissipation by a factor of 2.4. It must be emphasized that, although the energy demand data used pertain to residences in Texas, the results apply to the entire southern part of the USA, where energy demand patterns are very similar. It is expected that the main conclusions of the paper would also apply to other regions of the globe with similar climates, where the summer a-c power demand is substantial. Further research into this subject, based on actual and realistic demand patterns, would clarify this issue. Other subjects for further research are the inclusion of commercial and large office buildings that have specific demand patterns; and the inclusion of other geographic regions that need less energy.

Funding

Partial support for this project was obtained from the W.A. (Tex) Moncrief Chair of Engineering at TCU, for which the author is thankful.

Data Availability Statement

The data from this study are available from the author upon request.

Acknowledgments

The author is thankful for the sets of electricity consumption data and natural gas consumption data provided by Reliant Energy® and Atmos Energy®. This research was partly supported by the W.A. (Tex) Moncrief Founding Chair of Engineering at TCU.

Conflicts of Interest

The author declares no conflicts of interest.

References

  1. IPCC. Climate Change 2007: Synthesis Report. Contribution of Working Groups I, II and III to the Fourth Assessment Report of the Intergovernmental Panel on Climate Change; IPCC: Geneva, Switzerland, 2007. [Google Scholar]
  2. IEA. Energy Efficiency Market Report—2013; IEA Publications: Paris, France, 2013. [Google Scholar]
  3. Michaelides, E.E. Energy, the Environment and Sustainability; CRC Press: Boca Raton, FL, USA, 2018. [Google Scholar]
  4. IEA. Net Zero Roadmap: A Global Pathway to Keep the 1.5 °C Goal in Reach—2023 Update; IEA Publications: Paris, France, 2023. [Google Scholar]
  5. IEA. World Energy Investment 2024; 2024 IEA Publications: Paris, France, 2024. [Google Scholar]
  6. IPCC. Climate Change 2022: Mitigation of Climate Change. 2022. Available online: https://www.ipcc.ch/report/ar6/wg3/ (accessed on 12 February 2025).
  7. IEA. Key World Energy Statistics 2021; IEA Press: Paris, France, 2021. [Google Scholar]
  8. Matthew, C. The multiple benefits of current and potential energy efficiency policies. A Scott. Isl. Case Study. Energy Policy 2024, 187, 114032. [Google Scholar] [CrossRef]
  9. Watson, S.D.; Lomas, K.J.; Buswell, R.A. How will heat pumps alter national half hourly heat demands? Empirical modelling based on GB field trials. Energy Build. 2021, 238, 110777. [Google Scholar] [CrossRef]
  10. Kokoni, S.; Leach, M. Policy mechanisms to support heat pump deployment: A UK case study based on techno-economic modelling. Renew. Sustain. Energy Transit. 2021, 1, 100009. [Google Scholar] [CrossRef]
  11. Yushchenko, A.; Patel, M.K. Cost-effectiveness of energy efficiency programs: How to better understand and improve from multiple stakeholder perspectives? Energy Policy 2017, 108, 538–550. [Google Scholar] [CrossRef]
  12. Palma, P.; Gouveia, J.P.; Barbosa, R. How much will it cost? An energy renovation analysis for the Portuguese dwelling stock. Sustain. Cities Soc. 2022, 78, 103607. [Google Scholar] [CrossRef]
  13. Kirme, S.K.; Kapse, V.S. A comprehensive review of residential building energy efficiency measures in India. Energy Build. 2024, 319, 114537. [Google Scholar] [CrossRef]
  14. Tsvetkov, P.; Samuseva, P.; Nikolaychuk, L. The research of the impact of energy efficiency on mitigating greenhouse gas emissions at the national level. Energy Convers. Manag. 2024, 314, 118671. [Google Scholar] [CrossRef]
  15. Otrachshenko, V.; Hartwell, C.A.; Popova, O. Energy efficiency, market competition, and quality certification: Lessons from Central Asia. Energy Policy 2023, 177, 113539. [Google Scholar]
  16. Galvin, R. The economic losses of energy-efficiency renovation of Germany’s older dwellings: The size of the problem and the financial challenge it presents. Energy Policy 2024, 184, 113905. [Google Scholar]
  17. Sieger, L.; Weber, C. Inefficient markets for energy efficiency?—The efficiency premium puzzle in the German rental housing market. Energy Policy 2023, 183, 113819. [Google Scholar]
  18. Mihai, S.; Yaqoob, M.; Dang, H.V.; Davis, W.; Towakel, P.; Mohsin, R.; Karamanoglu, M.; Barn, B.; Shetve, D.; Prasad, R.; et al. Digital Twins: A Survey on Enabling Technologies, Challenges, Trends and Future Prospects. IEEE Commun. Surv. Tutor. 2022, 24, 2255–2291. [Google Scholar] [CrossRef]
  19. Sayed, A.N.; Bensaali, F.; Himeur, Y.; Dimitrakopoulos, G.; Varlamis, I. Enhancing building sustainability: A Digital Twin approach to energy efficiency and occupancy monitoring. Energy Build. 2025, 328, 115151. [Google Scholar] [CrossRef]
  20. Hernández, D.; Siegel, E. Energy insecurity and its ill health effects: A community perspective on the energy-health nexus in New York City. Energy Res. Soc. Sci. 2019, 47, 78–83. [Google Scholar] [CrossRef] [PubMed]
  21. Drehobl, A.; Ross, L.; Ayala, R. How High Are Household Energy Burdens? American Council for an Energy-Efficient Economy (ACEEE): Washington, DC, USA, 2020. [Google Scholar]
  22. IEA. World Energy Outlook; IEA Publications: Paris, France, 2024. [Google Scholar]
  23. California ISO (CAISO), 2016, Fast Facts—What the Duck Curve Tells Us About Managing a Green Grid, Report Comm PR/2016. Available online: https://www.caiso.com/library (accessed on 12 February 2025).
  24. Freeman, E.; Occello, D.; Barnes, F. Energy Storage for Electrical Systems in the USA. AIMS Energy 2016, 4, 856–875. [Google Scholar] [CrossRef]
  25. Stamatellou, A.-M.; Stamatelos, T. The Implications of Long-Term Local Climate Change for the Energy Performance of an nZEB Residential Building in Volos, Greece. Energies 2025, 18, 1032. [Google Scholar] [CrossRef]
  26. Baumann, C.; Wohlgenannt, P.; Streicher, W.; Kepplinger, P. Optimizing Heat Pump Control in an NZEB via Model Predictive Control and Building Simulation. Energies 2024, 18, 100. [Google Scholar] [CrossRef]
  27. Michaelides, E.E. Thermodynamics, Energy Dissipation, and Figures of Merit of Energy Storage Systems—A Critical Review. Energies 2021, 14, 6121. [Google Scholar] [CrossRef]
  28. ERCOT. 2024. Available online: https://www.ercot.com/gridinfo/generation (accessed on 28 September 2024).
  29. Hadjipaschalis, I.; Poullikkas, A.; Efthimiou, V. Overview of current and future ES technologies for electric power applications. Renew. Sustain. Energy Rev. 2009, 13, 1513–1522. [Google Scholar] [CrossRef]
  30. Huggins, R.A. Energy Storage—Fundamentals, Materials and Applications, 2nd ed.; Springer: Cham, Switzerland, 2016. [Google Scholar]
  31. O’Shaughnessy, E.; Barbose, G.; Kannan, S. Evaluating community solar as a measure to promote equitable clean energy access. Nat. Energy 2024, 9, 955–963. [Google Scholar] [CrossRef]
  32. UN-Habitat. 2024. Available online: https://www.weforum.org/agenda/2024/06/global-housing-crisis-practical-solutions/ (accessed on 28 September 2024).
  33. Texas. 2024. Available online: https://www.texasstandard.org/stories/texas-population-growth-census-suburban-kaufman-county-dfw-metroplex/ (accessed on 28 September 2024).
  34. EIA. Household Energy Use in Texas; US Energy Information Administration, US Department of Energy Publications: Washington, DC, USA, 2024. Available online: https://www.eia.gov/state/analysis.php?sid=TX (accessed on 28 September 2024).
  35. Wang, R.; He, Z.; Zhai, X.; Lu, S. Application and Performance Evaluation of Key Technologies in Green Buildings. Energies 2024, 17, 6418. [Google Scholar] [CrossRef]
  36. Moghimi, S.M.; Gulliver, T.A.; Thirumarai Chelvan, I.; Teimoorinia, H. Resource Optimization for Grid-Connected Smart Green Townhouses Using Deep Hybrid Machine Learning. Energies 2024, 17, 6201. [Google Scholar] [CrossRef]
  37. Ochsner, K. Geothermal Heat Pumps—A Guide for Planning and Installing; Earthscan: London, UK, 2008. [Google Scholar]
  38. Aguilar, R.S.; Michaelides, E.E. Microgrid for a Cluster of Grid Independent Buildings Powered by Solar and Wind Energy. Appl. Sci. 2021, 11, 9214. [Google Scholar] [CrossRef]
  39. Szpilko, D.; Fernando, X.; Nica, E.; Budna, K.; Rzepka, A.; Lăzăroiu, G. Energy in Smart Cities: Technological Trends and Prospects. Energies 2024, 17, 6439. [Google Scholar] [CrossRef]
  40. Dubey, S.; Sarvaiya, N.J.; Sheshadri, B. Temperature dependent Photovoltaic (PV) efficiency and its effect on PV production in the world—A review. Energy Procedia 2013, 33, 311–321. [Google Scholar] [CrossRef]
  41. Wilcox, S. National Solar Radiation Database 1991–2010 Update: User’s Manual; Technical Report NREL/TP-5500-54824.2012. Available online: https://www.nrel.gov/docs/fy12osti/54824.pdf (accessed on 2 March 2025).
  42. Michaelides, E.E. Energy Storage—The Key to Renewable Energy Transition; CRC Press: Boca Raton, FL, USA, 2025; in print. [Google Scholar]
  43. de Oliveira, C.C.; Vaz, I.C.M.; Ghisi, E. Retrofit strategies to improve energy efficiency in buildings: An integrative review. Energy Build. 2024, 321, 114624. [Google Scholar] [CrossRef]
  44. Leonard, M.D.; Michaelides, E.E. Grid-independent residential buildings with renewable energy sources. Energy 2018, 148, 448–460. [Google Scholar] [CrossRef]
  45. Zakeri, B.; Syri, S. Electrical ES systems: A comparative life cycle cost analysis. Renew. Sustain. Energy Rev. 2015, 42, 569–596. [Google Scholar] [CrossRef]
  46. Kebede, A.A.; Kalogiannis, T.; Van Mierlo, J.; Berecibar, M. A comprehensive review of stationary energy storage devices for large scale renewable energy sources grid integration. Renew. Sustain. Energy Rev. 2022, 159, 112213. [Google Scholar] [CrossRef]
  47. Available online: https://www.energy.gov/eere/solar/solar-photovoltaic-system-cost-benchmarks (accessed on 2 March 2025).
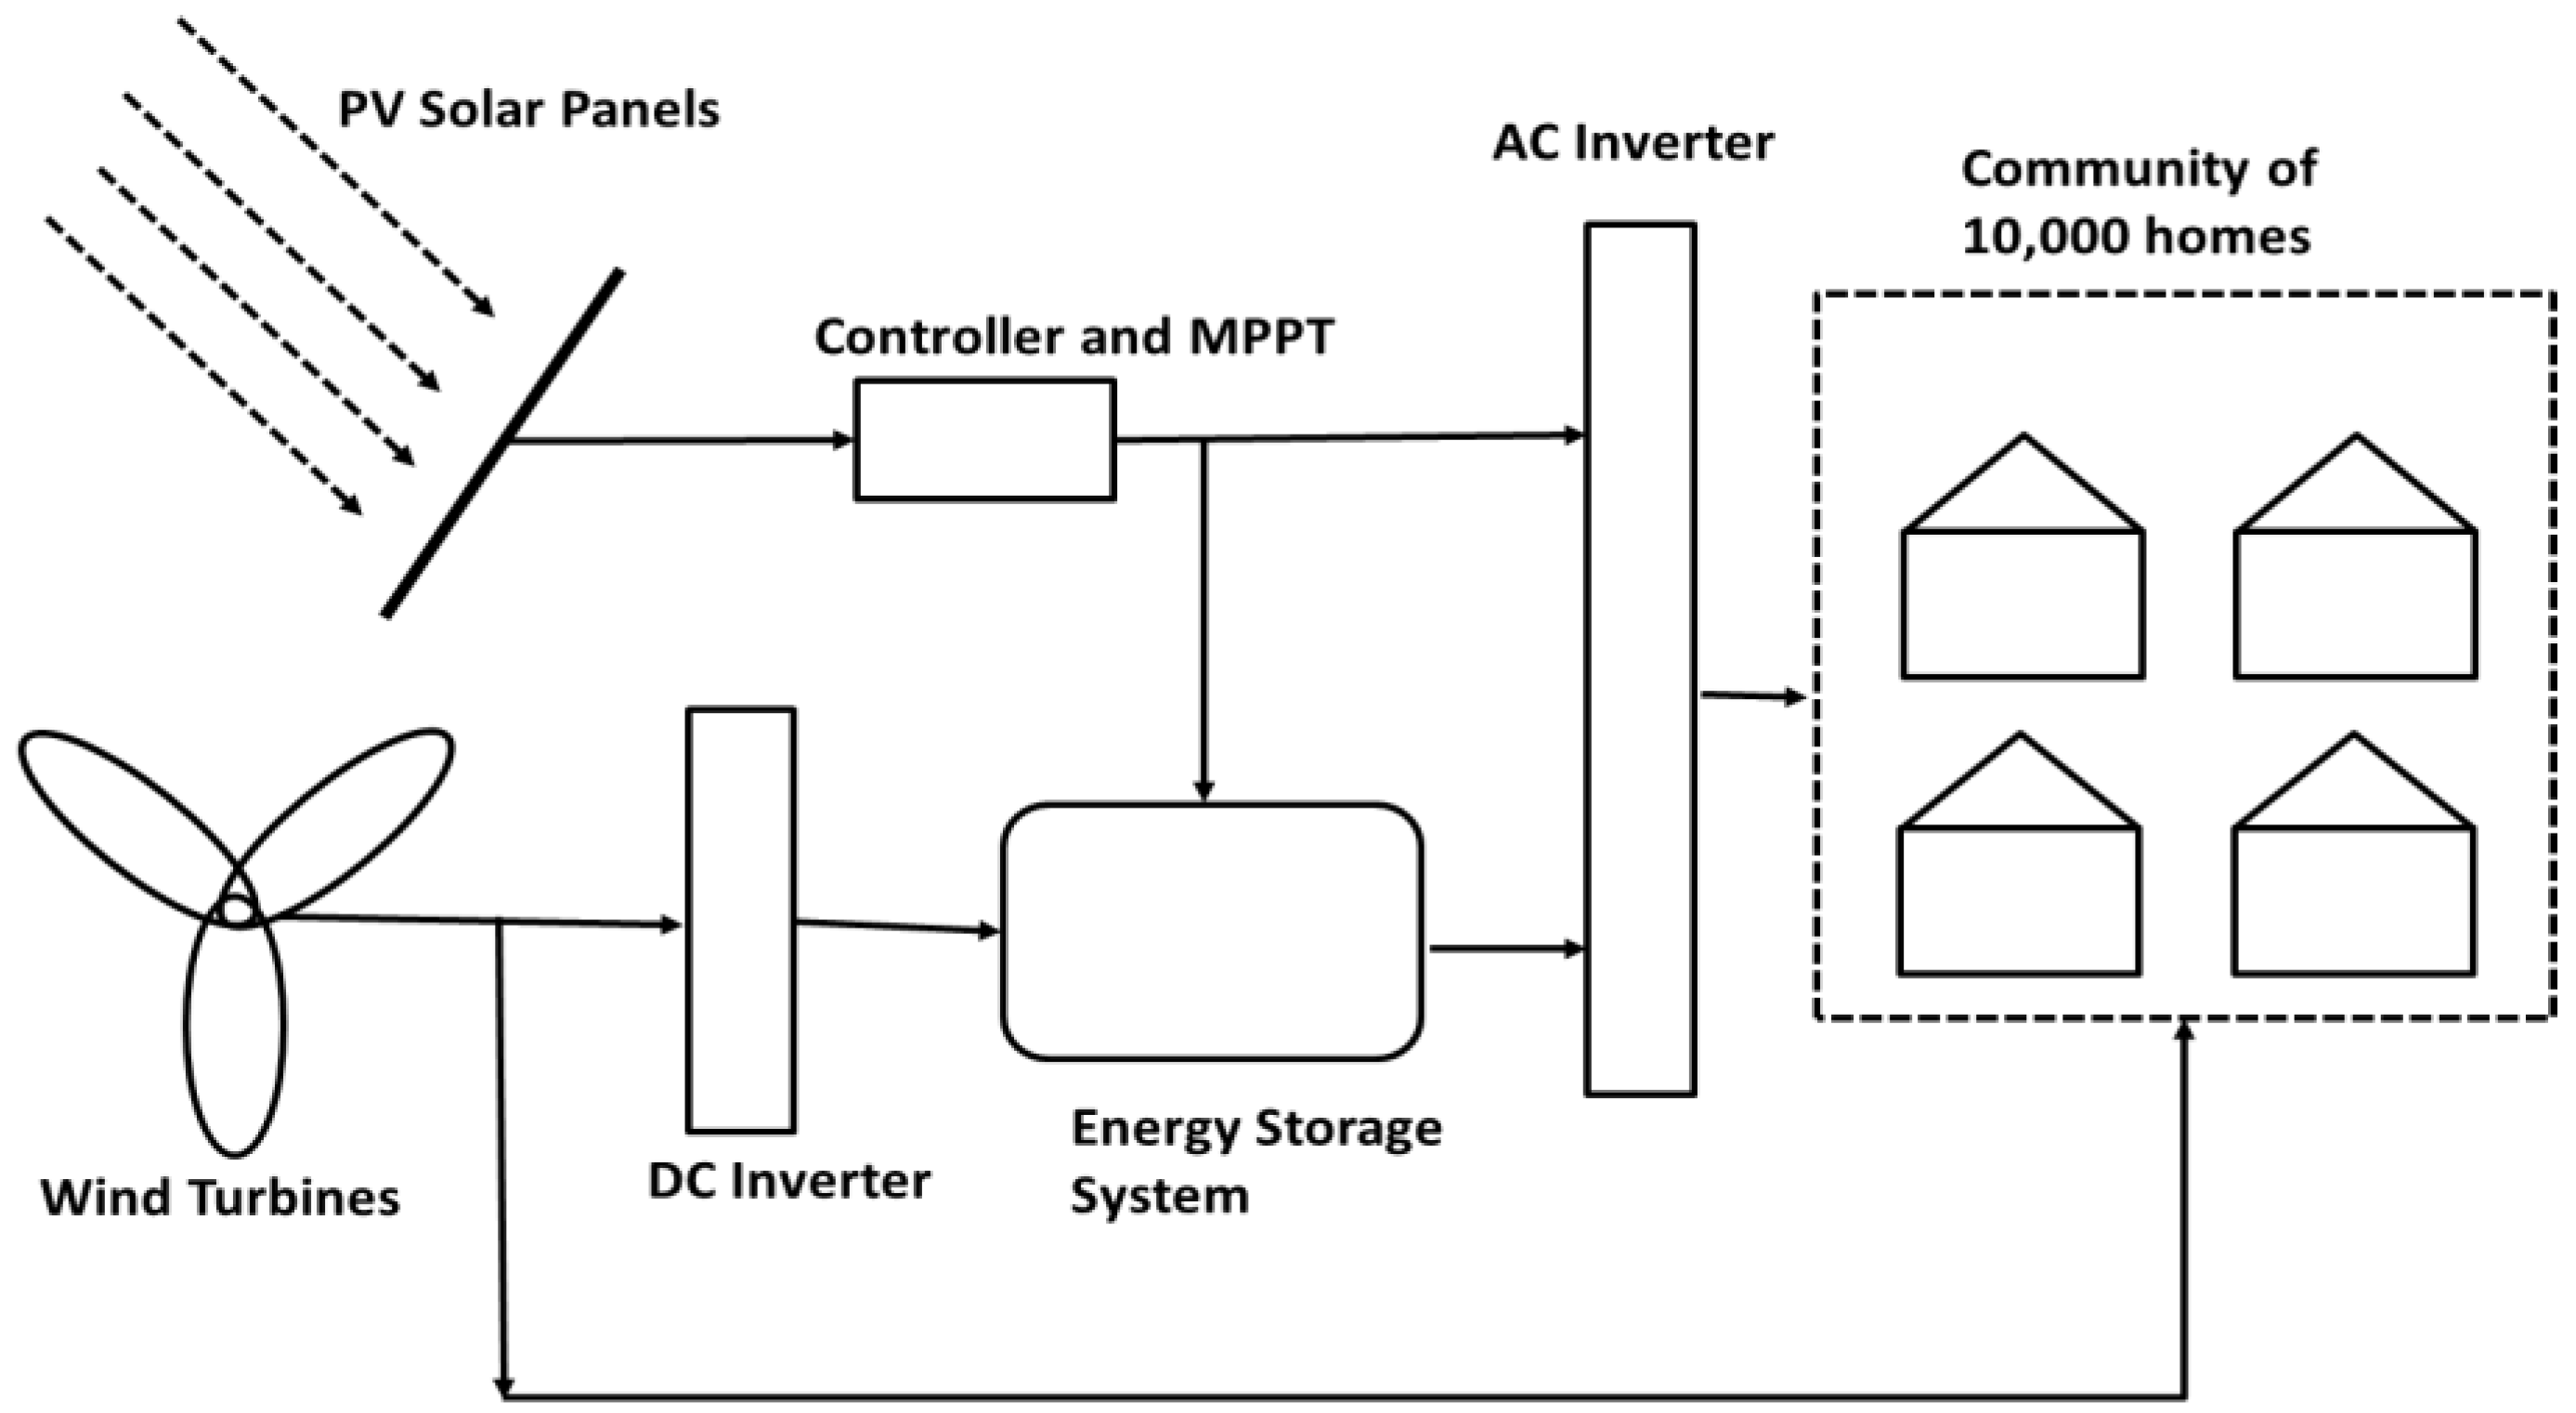
Figure 1. Schematic diagram of energy supply and demand in a grid-independent community.
Energies 18 01778 g001
Figure 2. Annually generated wind and solar energy, annual energy dissipation, and needed hydrogen storage capacity for a-c COP = 3.5. Case A.
Energies 18 01778 g002
Figure 3. Annually generated wind and solar energy, annual energy dissipation, and needed hydrogen storage capacity for a-c COP = 9. Case A.
Energies 18 01778 g003
Figure 4. Annually generated wind and solar energy, annual energy dissipation, and needed hydrogen storage capacity for a-c COP = 9 and 50% heat exchange reduction. Case A.
Energies 18 01778 g004
Figure 5. The state of the hydrogen storage system during all hours of the year. Case A.
Energies 18 01778 g005
Figure 6. Annually generated wind and solar energy, annual energy dissipation, and needed hydrogen storage capacity for the baseline study, a-c COP = 3.5. Case B.
Energies 18 01778 g006
Figure 7. Annually generated wind and solar energy, annual energy dissipation, and needed hydrogen storage capacity for a-c COP = 9. Case B.
Energies 18 01778 g007
Figure 8. Annually generated wind and solar energy, annual energy dissipation, and needed hydrogen storage capacity for a-c COP = 9 and 50% heat exchange reduction. Case B.
Energies 18 01778 g008
Figure 9. State of the hydrogen storage system during all hours of the year. Case B.
Energies 18 01778 g009
Table 1. Households in North Texas, for case A.
Power Reduction, kWAnnual Energy Reduction, MWhStorage Reduction, m3Dissipation Reduction, MWh
COP 3.5 to 510,39016,87564524884
COP 5 to 75041818731752191
COP 7 to 92774450616911175
50% heat & COP = 9955715,52254763863
Table 2. Households in North Texas, for case B.
Power Reduction, kWAnnual Energy Reduction, MWhStorage Reduction, m3Dissipation Reduction, MWh
COP 3.5 to 517,44728,33645364585
COP 5 to 7909914,77823092168
COP 7 to 95459886613231567
50% heat & COP = 95056821212351463
Table 3. The effect of efficiency measures on the cost of investment for a single home in the independent microgrid. All values in thousands of $US.
Without Efficiency Measures, 1000 $USWith All Efficiency Measures, 1000 $US
Efficiency Measures 0.068.3
Installed Renewable Power26.19.6
Energy Storage135.235.5
Fuel Cells11.64.3
Total Investment172.9117.6
Disclaimer/Publisher’s Note: The statements, opinions and data contained in all publications are solely those of the individual author(s) and contributor(s) and not of MDPI and/or the editor(s). MDPI and/or the editor(s) disclaim responsibility for any injury to people or property resulting from any ideas, methods, instructions or products referred to in the content.