Abstract
Wind energy’s crucial role in global sustainability necessitates efficient wind turbine maintenance, traditionally hindered by labor-intensive, risky manual inspections. UAV-based inspections offer improvements yet often lack adaptability to dynamic conditions like blade pitch and wind. To overcome these limitations and enhance inspection efficacy, we introduce the Dynamic Trajectory Adaptation Method (DyTAM), a novel approach for automated wind turbine inspections using UAVs. Within the proposed DyTAM, real-time image segmentation identifies key turbine components—blades, tower, and nacelle—from the initial viewpoint. Subsequently, the system dynamically computes blade pitch angles, classifying them into acute, vertical, and horizontal tilts. Based on this classification, DyTAM employs specialized, parameterized trajectory models—spiral, helical, and offset-line paths—tailored for each component and blade orientation. DyTAM allows for cutting total inspection time by 78% over manual approaches, decreasing path length by 17%, and boosting blade coverage by 6%. Field trials at a commercial site under challenging wind conditions show that deviations from planned trajectories are lowered by 68%. By integrating advanced path models (spiral, helical, and offset-line) with robust optical sensing, the DyTAM-based system streamlines the inspection process and ensures high-quality data capture. The dynamic adaptation is achieved through a closed-loop control system where real-time visual data from the UAV’s camera is continuously processed to update the flight trajectory on the fly, ensuring optimal inspection angles and distances are maintained regardless of blade position or external disturbances. The proposed method is scalable and can be extended to multi-UAV scenarios, laying a foundation for future efforts in real-time, large-scale wind infrastructure monitoring.
1. Introduction
Over recent decades, wind turbines have proved pivotal in global renewable energy initiatives, providing a sustainable means of power generation [1,2]. However, regular inspections remain essential for sustained turbine efficiency and longevity, covering critical components such as blades, towers, and nacelles [3,4]. Traditional inspection approaches, typically reliant on in-person visual assessments or rope-access technicians [5], are not only hazardous but also inefficient [6], especially under adverse weather conditions [7].
While the above-mentioned methods are foundational, advancements in non-intrusive technologies offer promising alternatives. For instance, in offshore wind farms, early-warning indicators of power cable weaknesses are being identified through sophisticated signal processing of continuously monitored data [8], eliminating the need for direct physical contact and reducing downtime. Such techniques analyze electrical signals and operational parameters to detect anomalies that precede cable faults [9], offering a proactive approach to maintenance and highlighting the potential of integrating advanced signal analysis with traditional inspection protocols.
Against this backdrop, unmanned aerial vehicles UAVs have emerged as promising tools to enhance wind turbine inspection procedures [10]. By equipping UAVs with high-resolution cameras and thermal sensors, operators gain comprehensive views of turbine components without endangering human inspectors [11,12]. Yet, many early UAV-based techniques either rely on manual piloting or use simplistic, static flight paths [13] that fail to adapt to real-time factors such as variable blade pitch angles and gusting winds [14].
Despite the proliferation of UAV-based inspections, current solutions often lack dynamic trajectory adaptation. They may not optimally address variable positions of rotor blades, large tower diameters, or complex nacelle geometries, nor do they reliably handle unpredictable environmental conditions [6,14]. Consequently, inspection times can remain long, coverage may be incomplete, and operator workload can still be high [15].
Effective defect detection on turbine blades and other structural components depends heavily on systematic coverage and consistent imaging angles [16]. If a UAV’s flight plan does not account for real-time blade orientation changes or shifting environmental factors, small cracks or early-stage defects could be missed. By contrast, intelligent trajectory adaptation that responds to pitch angles and wind can markedly improve data quality, reduce inspection times, and minimize operational risks [17].
Therefore, despite these evolving approaches and technological advances (ranging from remote cable monitoring to high-resolution UAV imaging), current wind farm inspections still exhibit significant limitations in coverage, safety, and adaptability. As a result, the goal of this study is to improve the efficiency and coverage of wind turbine inspections by devising a novel Dynamic Trajectory Adaptation Method (DyTAM) that aligns flight paths with real-time blade orientation and compensates for external disturbances such as wind gusts. The DyTAM-based system integrates a segmentation-based approach to identify blades, tower, and nacelle, then dynamically refines inspection paths.
In brief, this study makes the following major contributions:
- Real-time trajectory adaptation: Introduces a pipeline that uses live segmentation and blade pitch classification to adjust UAV paths on the fly.
- Scalable architecture: Provides specialized spiral, helical, and offset-line trajectory models for each turbine component, facilitating easy extension to multi-UAV or large wind farm scenarios.
- Performance improvements: Achieves essential performance gains, demonstrating a reduction in inspection time by up to 78% and flight path length by 17% relative to manual inspections while simultaneously enhancing blade coverage by 6%, thereby substantially improving inspection efficiency and data acquisition efficacy.
This paper is structured to methodically unfold the DyTAM system, starting with a review of related works in Section 2, which contextualizes our contributions within the existing landscape of UAV-based turbine inspections. Section 3 offers a detailed exposition of the DyTAM methodology, breaking down its architecture and functionalities. Subsequently, Section 4 rigorously presents and analyzes the empirical results obtained from field experiments, underscoring the system’s performance and advantages. Section 5 provides a critical discussion of these findings, comparing DyTAM against state-of-the-art solutions and addressing broader implications. Finally, Section 6 encapsulates the key findings, contributions, and future research directions, providing a holistic view of the study’s outcomes and their significance for wind turbine inspection technology.
2. Related Works
The integration of UAVs into wind turbine inspection workflows has been extensively explored, marking a significant shift from traditional, labor-intensive methods. Initial research, as noted by Helbing and Ritter [18], underscored the potential of UAVs to enhance safety and efficiency in wind turbine monitoring, particularly in power curve analysis. As UAV and sensor technologies advanced, studies began to focus on optimizing data acquisition and analysis. Juneja and Bansal [19] contributed to the methodologies for enhanced data processing, which is crucial for extracting meaningful insights from UAV-captured imagery. Further progression in the field saw researchers investigating advanced payloads and analytical techniques to improve defect detection and characterization, as highlighted in works by Yang et al. [20] and Gohar et al. [21].
However, despite these advancements, early UAV-based inspection strategies often relied on pre-programmed, static flight paths or manual piloting. ul Husnain et al. [22] and Cetinsaya et al. [23] in their reviews pointed out that such approaches frequently led to suboptimal data quality and increased operator burden due to the lack of adaptability to real-world complexities such as wind and turbine dynamics. While algorithms began to incorporate path planning with defect detection, as seen in the research by Zhang et al. [24] and Memari et al. [25], real-time adaptation to variable blade pitch and environmental disturbances remained a significant challenge. Common trajectory patterns, like spiral or rectangular paths used by Yang et al. [26] and Pinney et al. [27], while systematic, often lacked the flexibility to maintain optimal viewing angles under dynamic conditions.
In parallel, significant strides were made in automated defect detection using neural networks. Shihavuddin et al. [28] and Memari et al. [25] demonstrated the effectiveness of deep learning for identifying blade defects from UAV imagery, and Gohar et al. [21] further refined these techniques for high-resolution image analysis. However, a critical gap persisted in effectively integrating these advancements in defect detection with dynamic UAV control systems. The potential synergy between real-time segmentation and adaptive flight control remained largely unexplored, limiting the overall efficiency and robustness of UAV inspection systems.
Manual UAV inspections, as documented by Svystun et al. [29], Grindley et al. [30], and Li et al. [31], are still prevalent due to the need for human operators to respond to unforeseen circumstances. This reliance on manual intervention, however, hinders scalability, consistency, and standardization as noted by He et al. [32], Castelar Wembers et al. [33], and Liu et al. [34]. Our work addresses this gap by introducing a real-time feedback mechanism that dynamically adjusts the UAV flight path based on blade orientation and environmental data. DyTAM moves beyond pre-set flight patterns, continuously optimizing the UAV’s trajectory to ensure consistent and high-quality data acquisition.
Wind turbine inspection via UAVs, particularly using our DyTAM method, is conducted to proactively detect surface and structural anomalies that could compromise turbine performance and safety. The process begins with pre-flight planning, where the turbine’s location and specifications are input into the DyTAM system. Upon deployment, the UAV autonomously navigates to an initial vantage point determined by DyTAM’s algorithms, ensuring optimal visual access. From this point, DyTAM initiates real-time component segmentation and blade angle analysis. The onboard processing system identifies turbine blades, nacelle, and tower and classifies blade pitch angles. Based on these immediate data, DyTAM dynamically selects and adjusts the most appropriate trajectory model—spiral, helical, or offset-line—to thoroughly inspect each component. Throughout the inspection, the UAV’s trajectory is continuously adapted in response to blade re-orientation and wind conditions, maintaining consistent standoff distances and viewing angles crucial for high-fidelity defect detection. This dynamic adaptation ensures comprehensive coverage and minimizes data redundancy, optimizing inspection time and enhancing the quality of acquired visual data for subsequent defect analysis.
3. Materials and Methods
This section presents the novel method for automated UAV-based wind turbine inspections, incorporating expansions from our previous work [29]. DyTAM consists of two major blocks: (i) component detection and blade angle analysis and (ii) specialized flight trajectories for blades, tower, and nacelle. Notably, each trajectory can be updated in real time to account for component orientation or wind.
3.1. Overview of the Proposed DyTAM
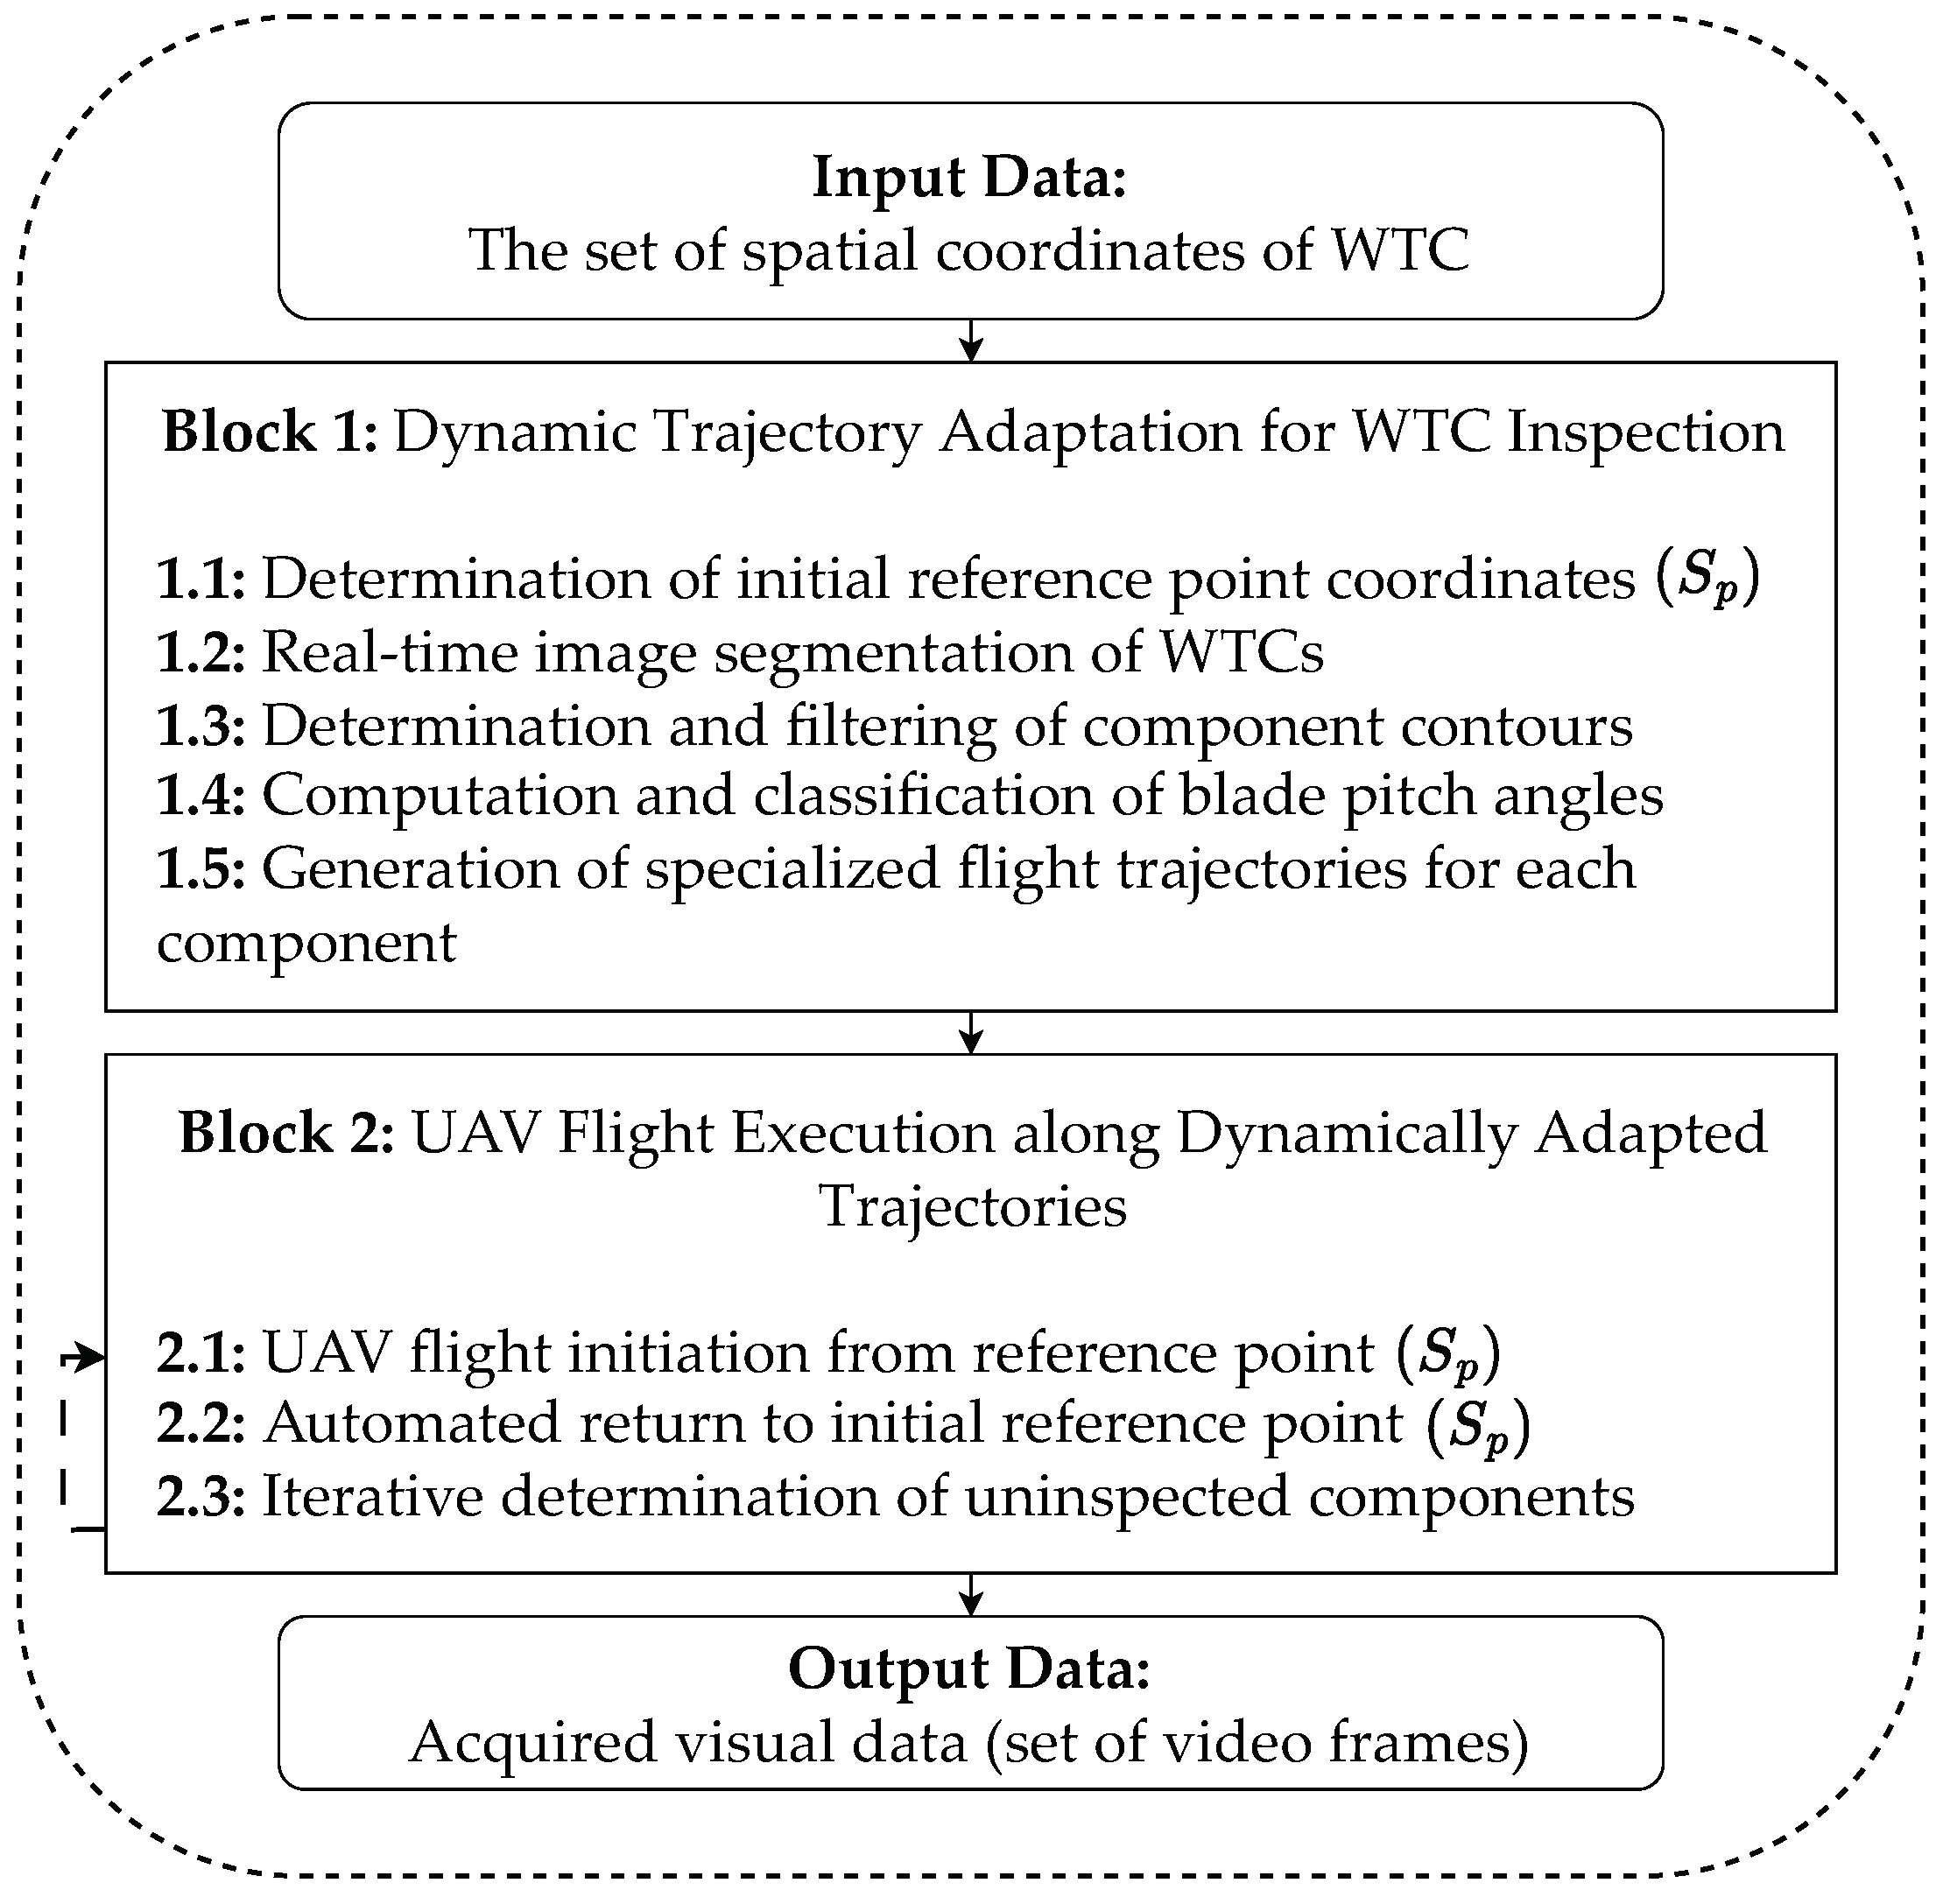
Figure 1 illustrates the general concept of the proposed DyTAM.
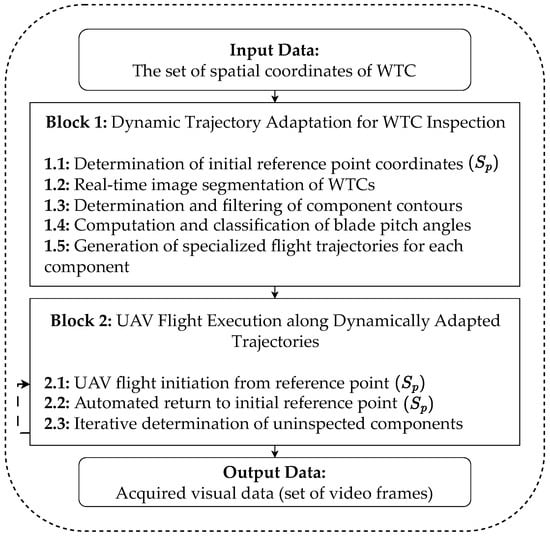
Figure 1.
General scheme for automated data collection around wind turbine components (WTCs). The method is split into (Block 1) segmentation-based detection and (Block 2) specialized trajectory functions.
In Block 1 of Figure 1, the UAV segements key turbine components from an initial flight point and computes blade pitch angles. In Block 2, specialized parameterized trajectories are generated for each blade type (acute, vertical, horizontal tilt), the tower, and the nacelle. Once a component is inspected, the UAV automatically returns to via a smooth polynomial path. This cyclical process ensures a structured and comprehensive inspection of all critical turbine parts, optimizing both data acquisition and operational efficiency.
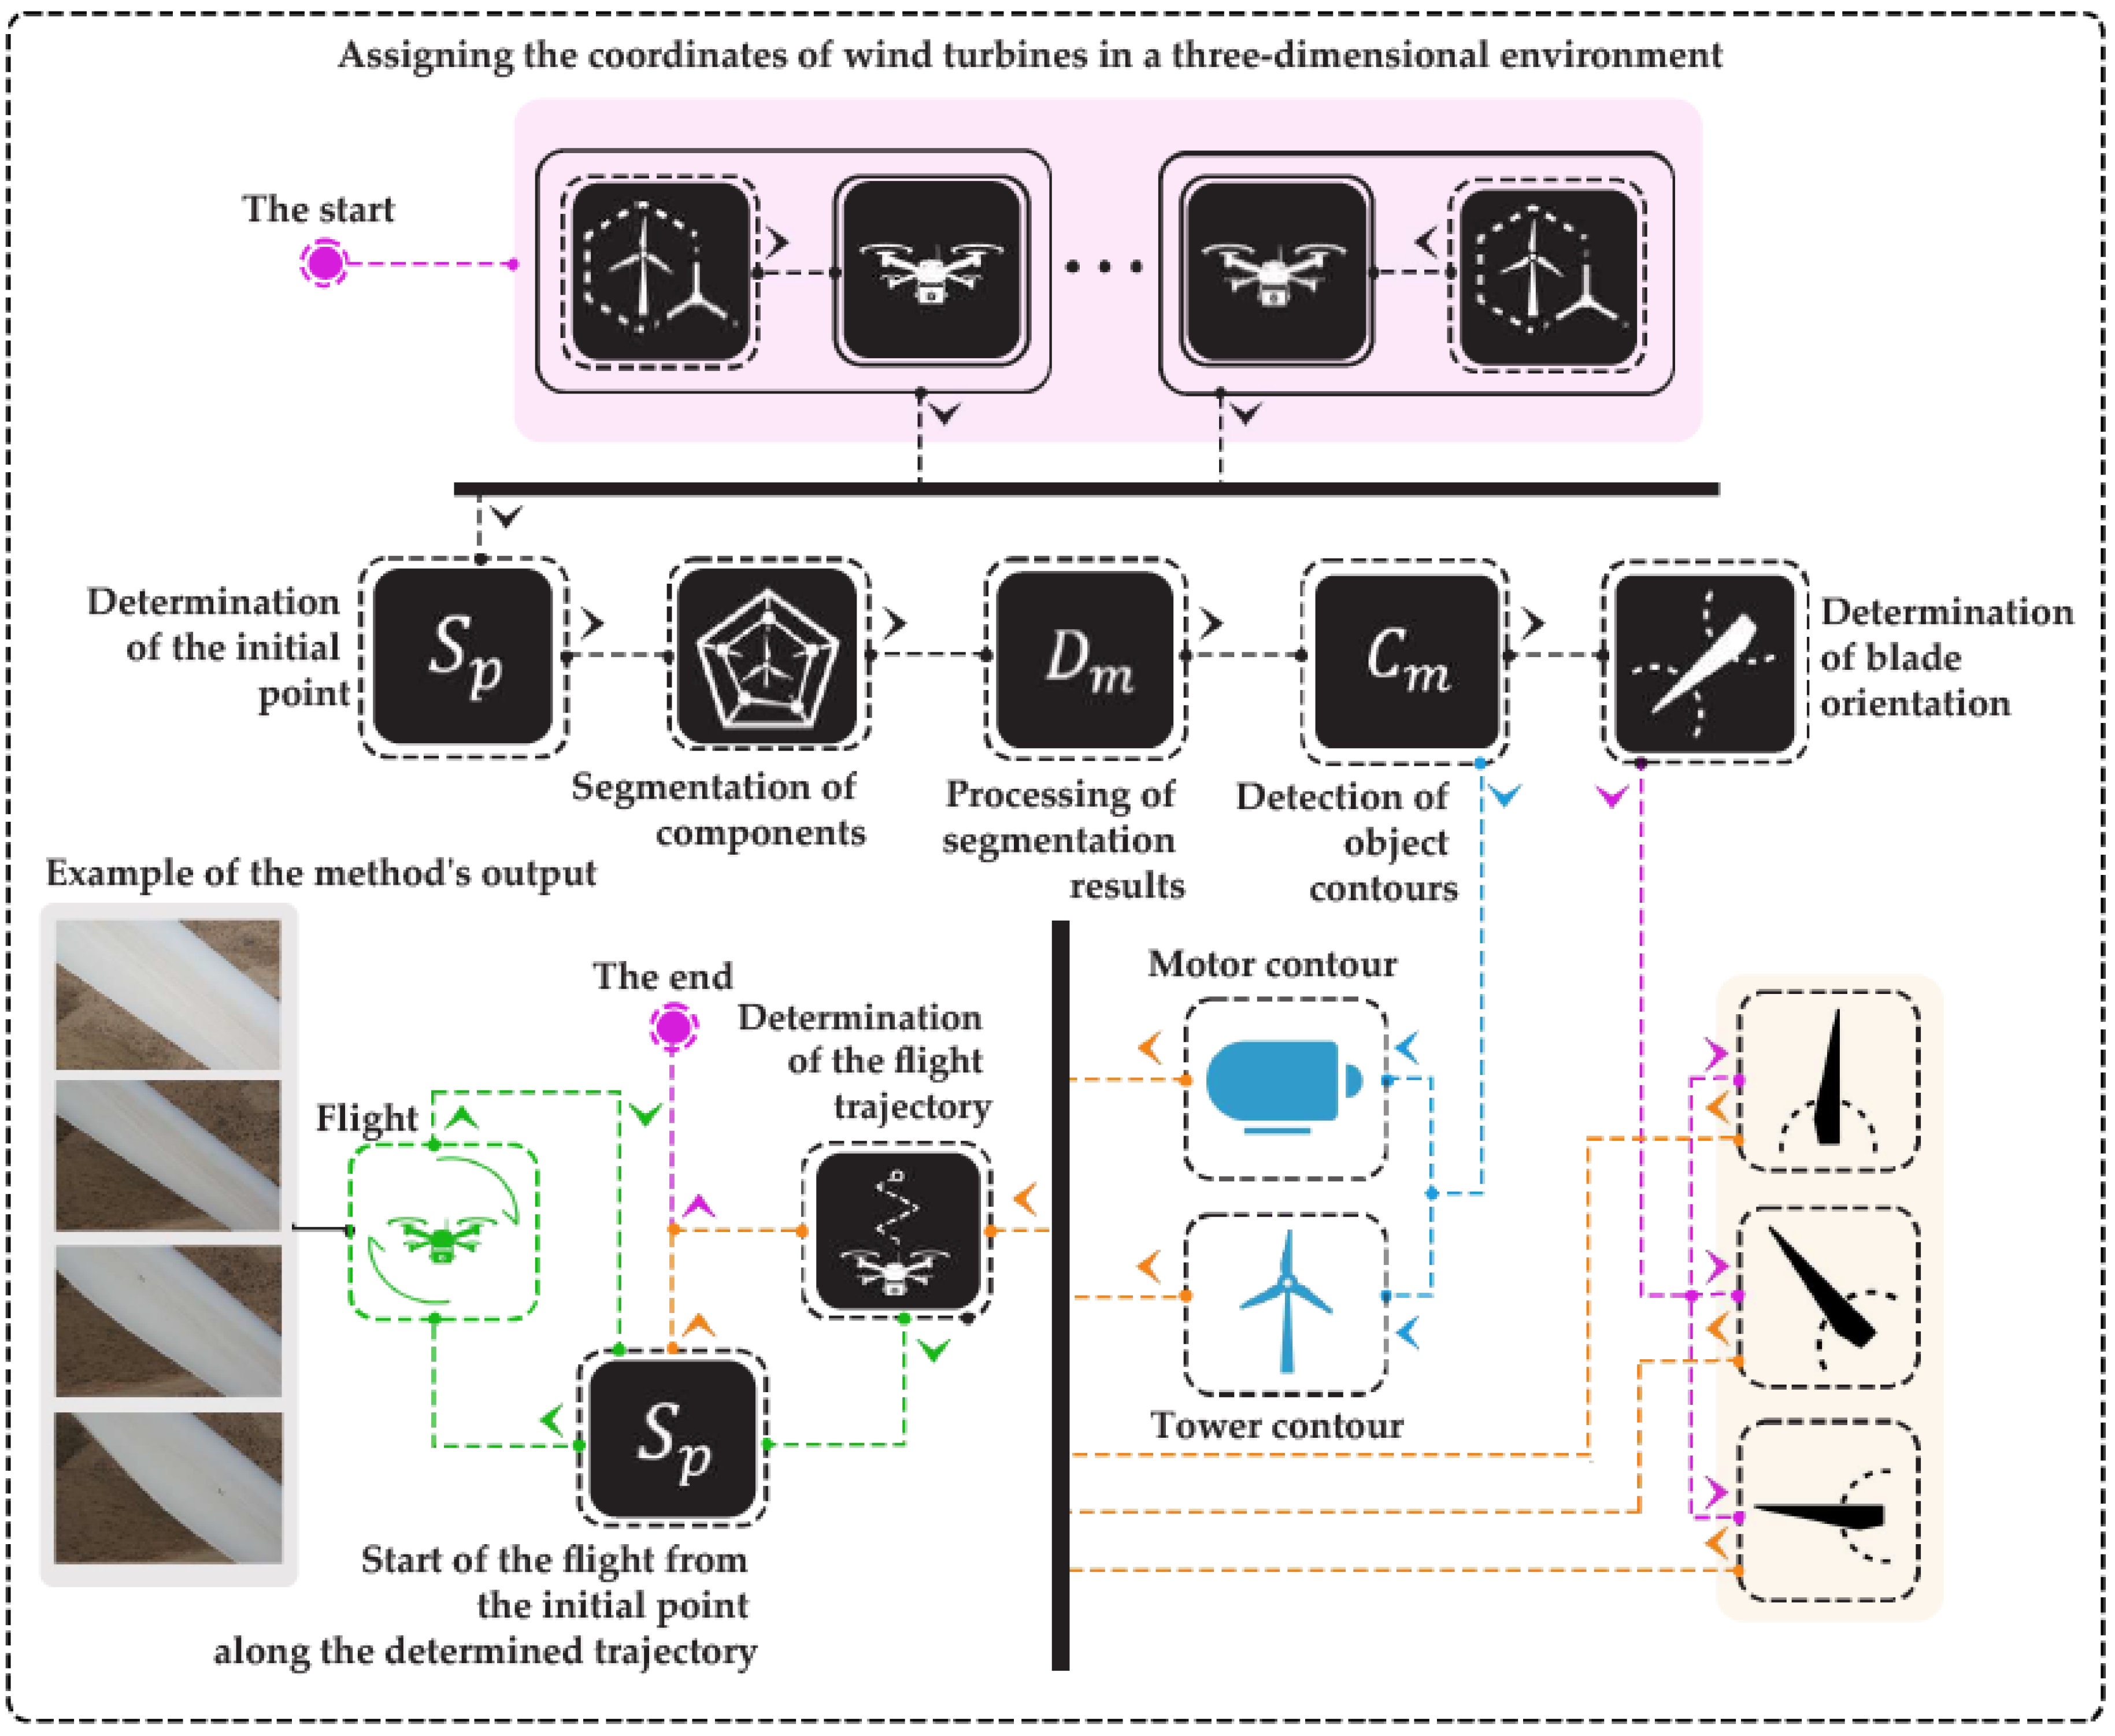
In addition, Figure 2 provides a detailed flowchart of the key steps, from WTC coordinate initialization to trajectory set construction for each component.
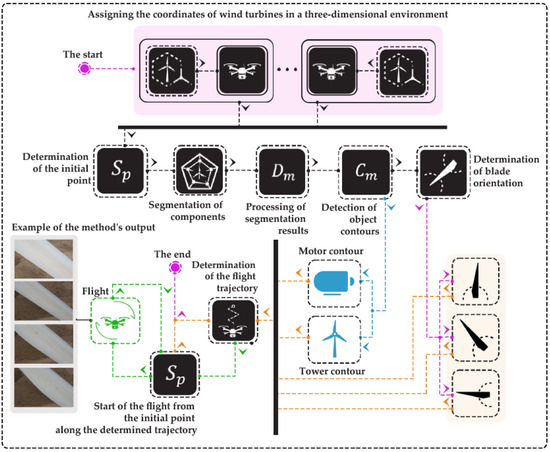
Figure 2.
Depicted is the flowchart of the DyTAM pipeline for determining WTC component trajectories. The process begins with assigning coordinates to each turbine in a 3D environment, followed by determining the UAV’s initial position . Subsequently, the system performs component segmentation, processes these results using module , and detects object contours (tower, nacelle, and blades) via module . Blade orientations (pitch angles) are then derived, and finally, a flight path is generated from for inspecting each component. This step-by-step visualization clarifies the automated decision-making process of DyTAM.
3.2. Determination of the Initial Reference Point
An initial reference point is set to provide an unobstructed view of the WTC, typically aligned with the turbine’s center plus a radius offset. Let us define the set of spatial points representing the turbine as . The turbine center is computed by
while the radius , capturing the maximum extent of blades or rotor geometry, is
Hence, the reference point is placed at
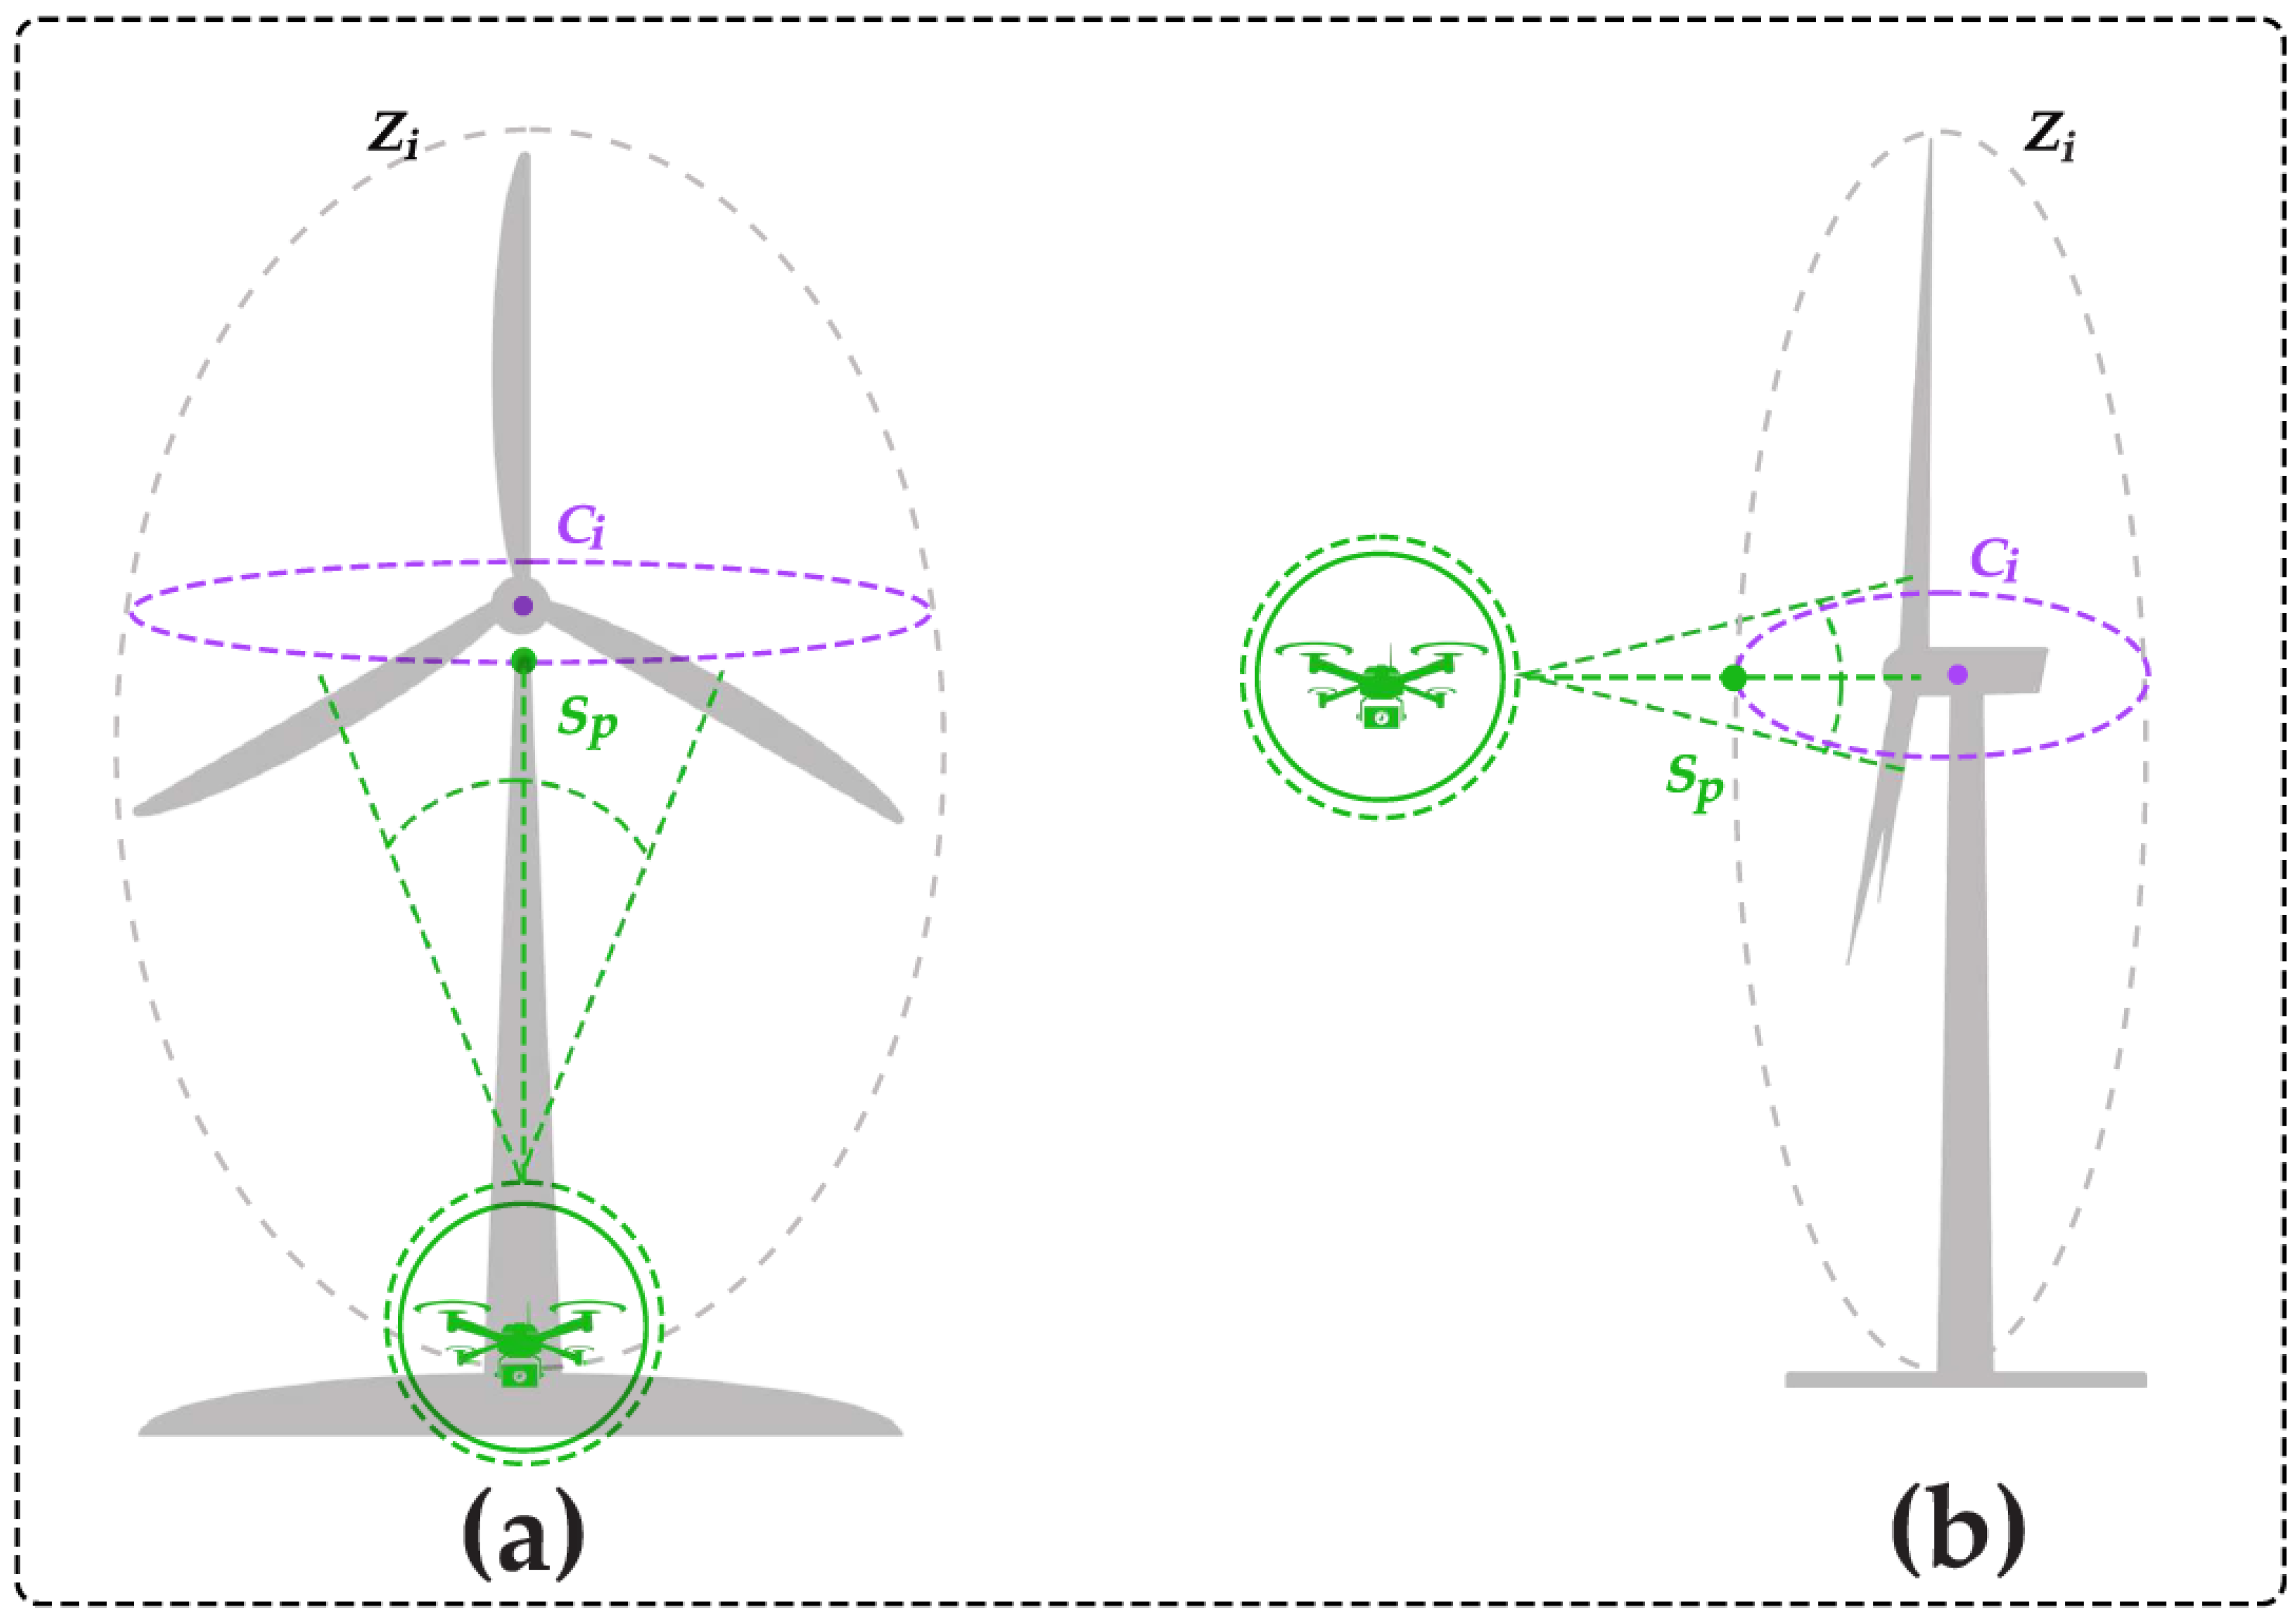
Figure 3 illustrates how starting point is selected. Launching from , the UAV obtains a full-field image of the turbine for initial segmentation. The turbine center and an offset radius (see Figure 3) are used to define a safe and optimal starting location for all planned flight paths. Notably, is intentionally set to match or slightly exceed the maximum blade length. This is to guarantee that the UAV maintains a sufficient clearance from the rotor, enhancing safety and enabling unobstructed imaging from the outset of the inspection. The strategic positioning of is crucial for initiating the inspection process with a comprehensive view of the turbine, ensuring effective segmentation and subsequent trajectory planning.
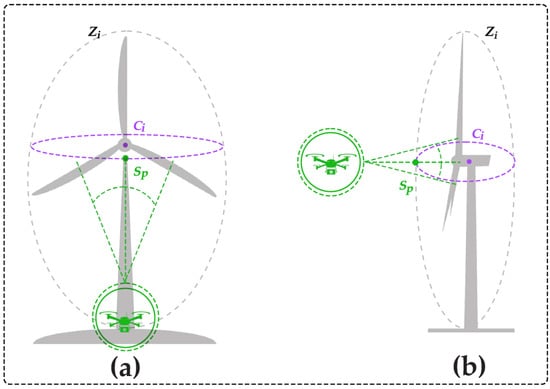
Figure 3.
Determination of the UAV’s initial position around a WTC, shown from the front view (a) and the side view (b). The turbine center and an offset radius are used to define a safe starting location for the planned flight paths. Typically, matches or slightly exceeds the maximum blade length to ensure sufficient clearance from the rotor.
3.3. Segmentation and Blade Pitch Angle Computation
3.3.1. Segmentation Process
Once at , the UAV captures a high-resolution image . Detectron2 v0.6 [35] detects and segments blades, tower, and nacelle. Background removal yields , and function findContours from OpenCV v4.9.0 [36] filters out noise below an area threshold , as was introduced in [37]. This segmentation pipeline enables DyTAM to understand and interact with the turbine structure autonomously. Figure 4 schematically shows these steps.

Figure 4.
Segmentation pipeline for turbine components: (a) the original image captured by the UAV camera, (b) the instance mask specifically for the blades, highlighting their segmented areas, (c) the combined mask for the tower and nacelle, distinguishing these structural components, and (d) the final binary mask of the isolated components, showing a clear separation of each turbine part for subsequent analysis.
3.3.2. Blade Pitch Angle Classification
For each blade contour, minAreaRect finds its bounding rectangle. Let and represent the highest and lowest vertices. Then,
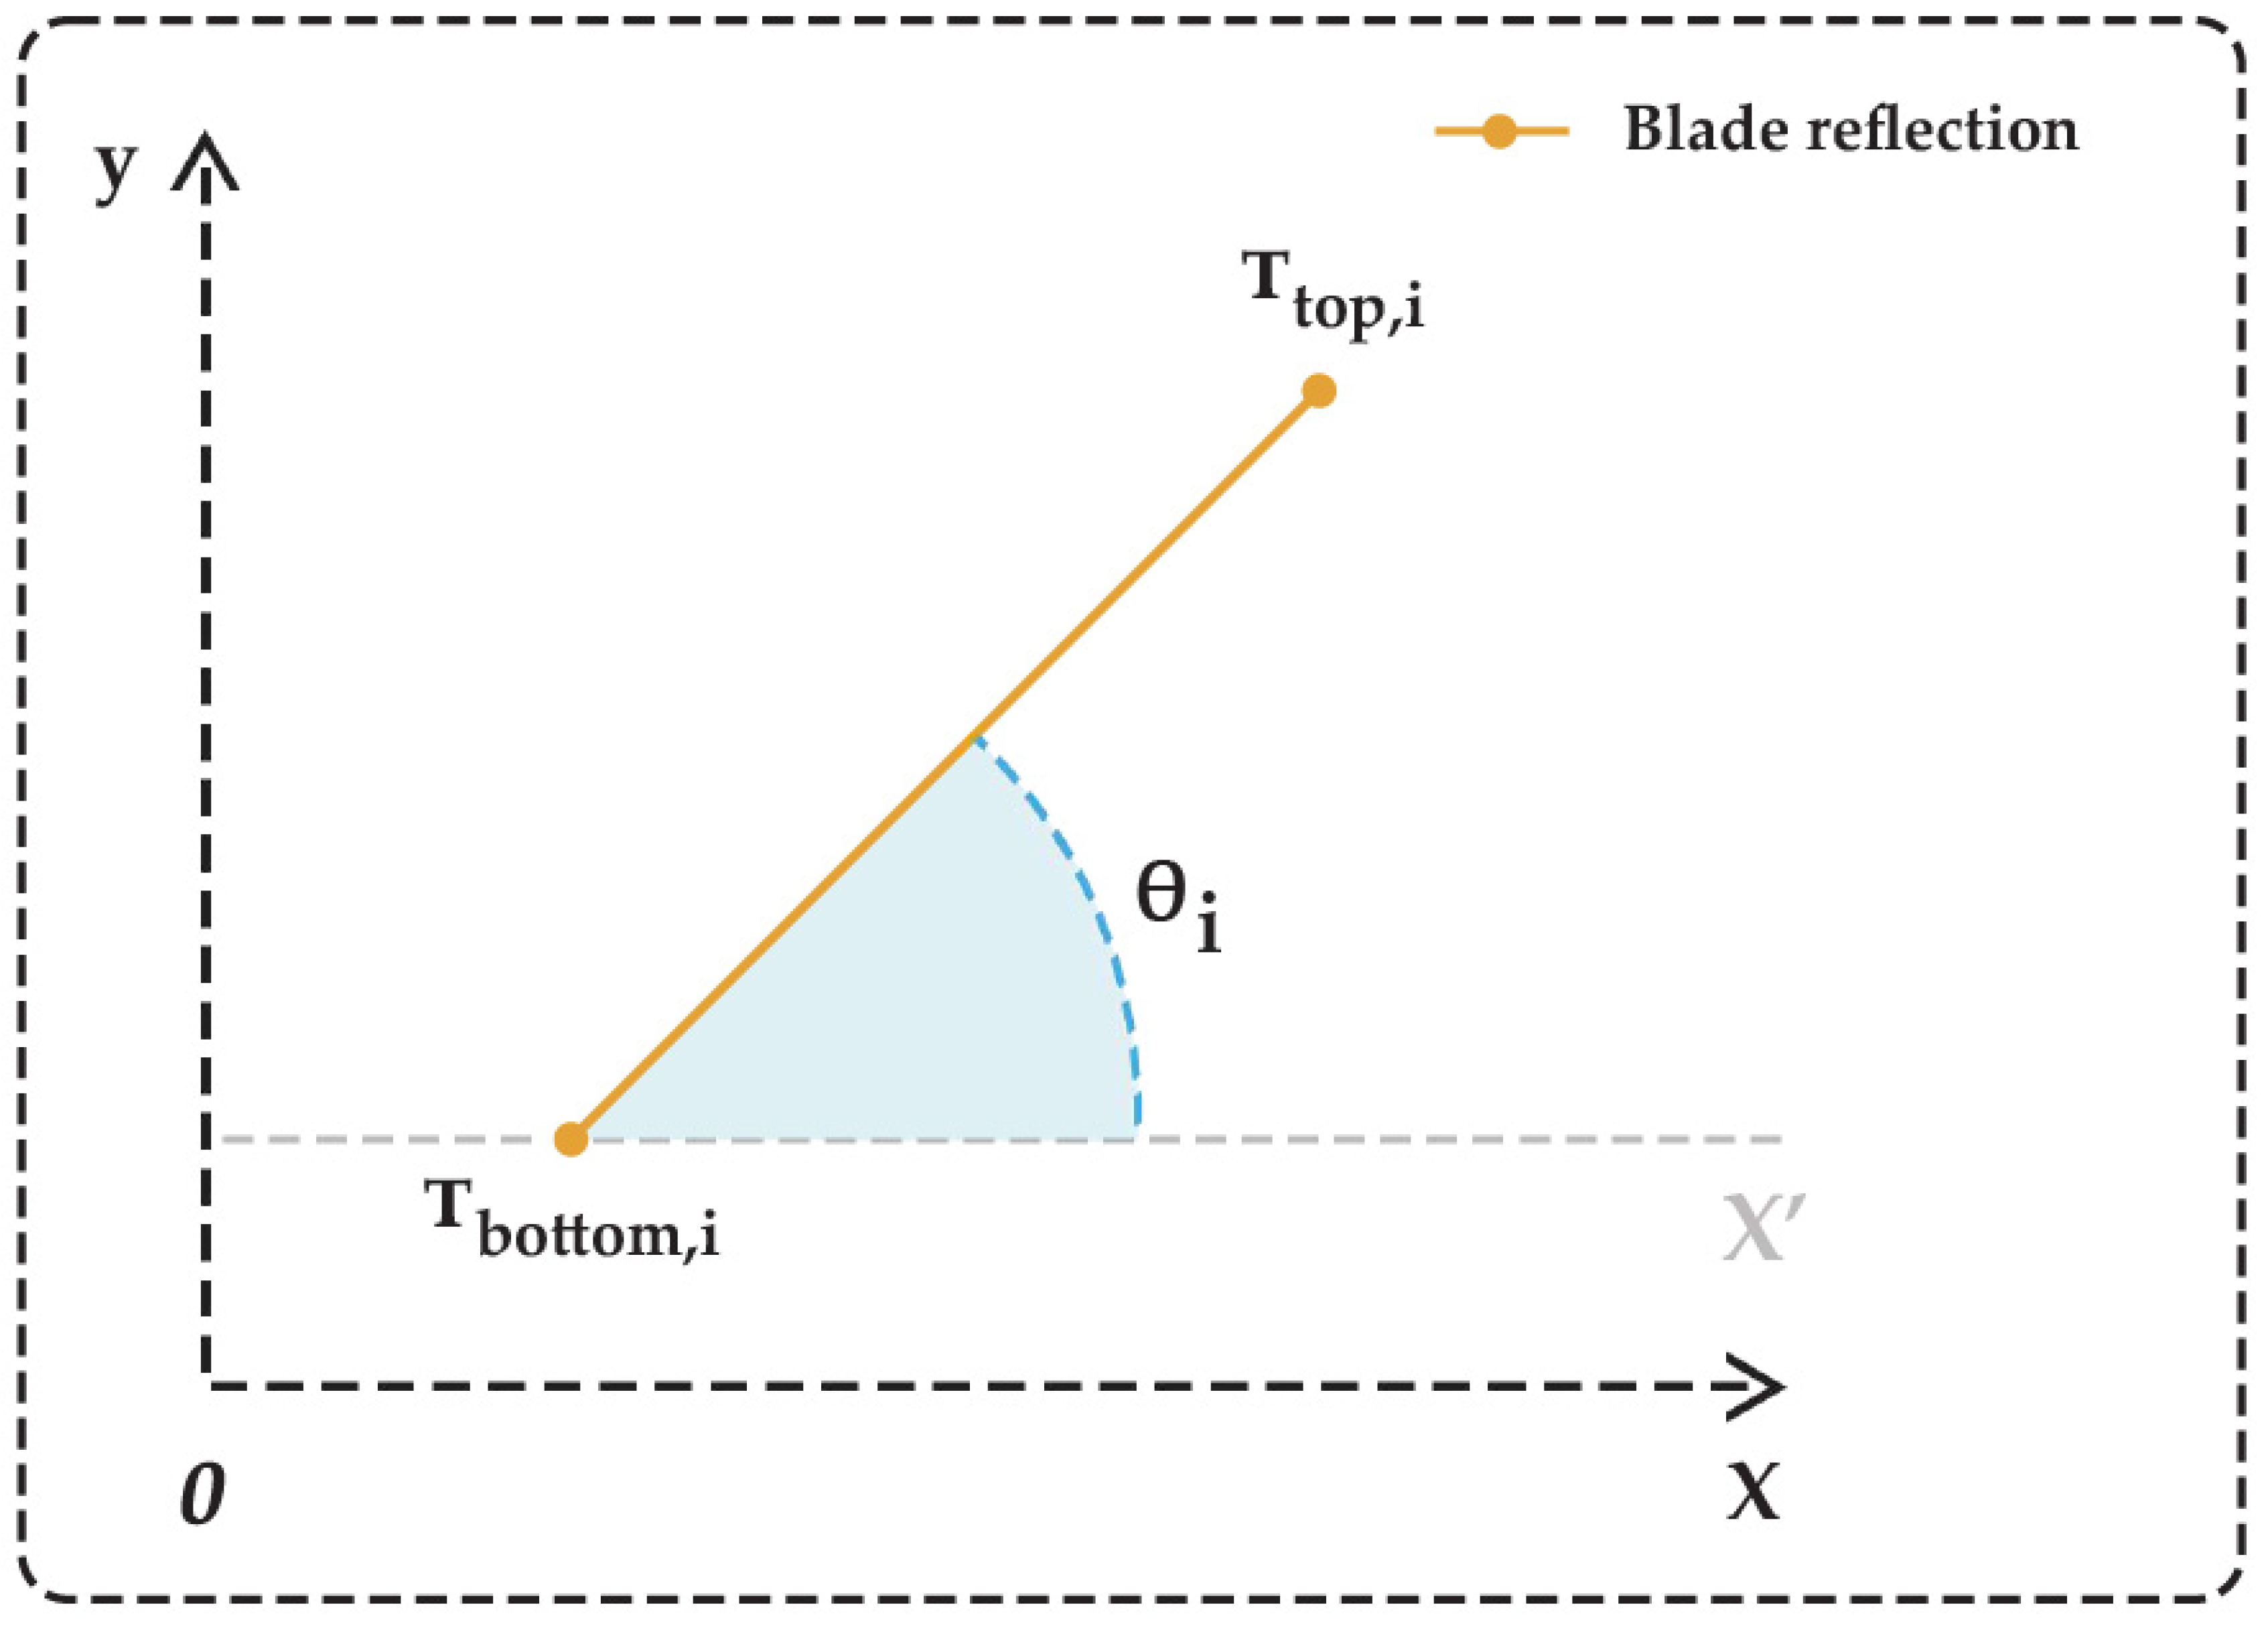
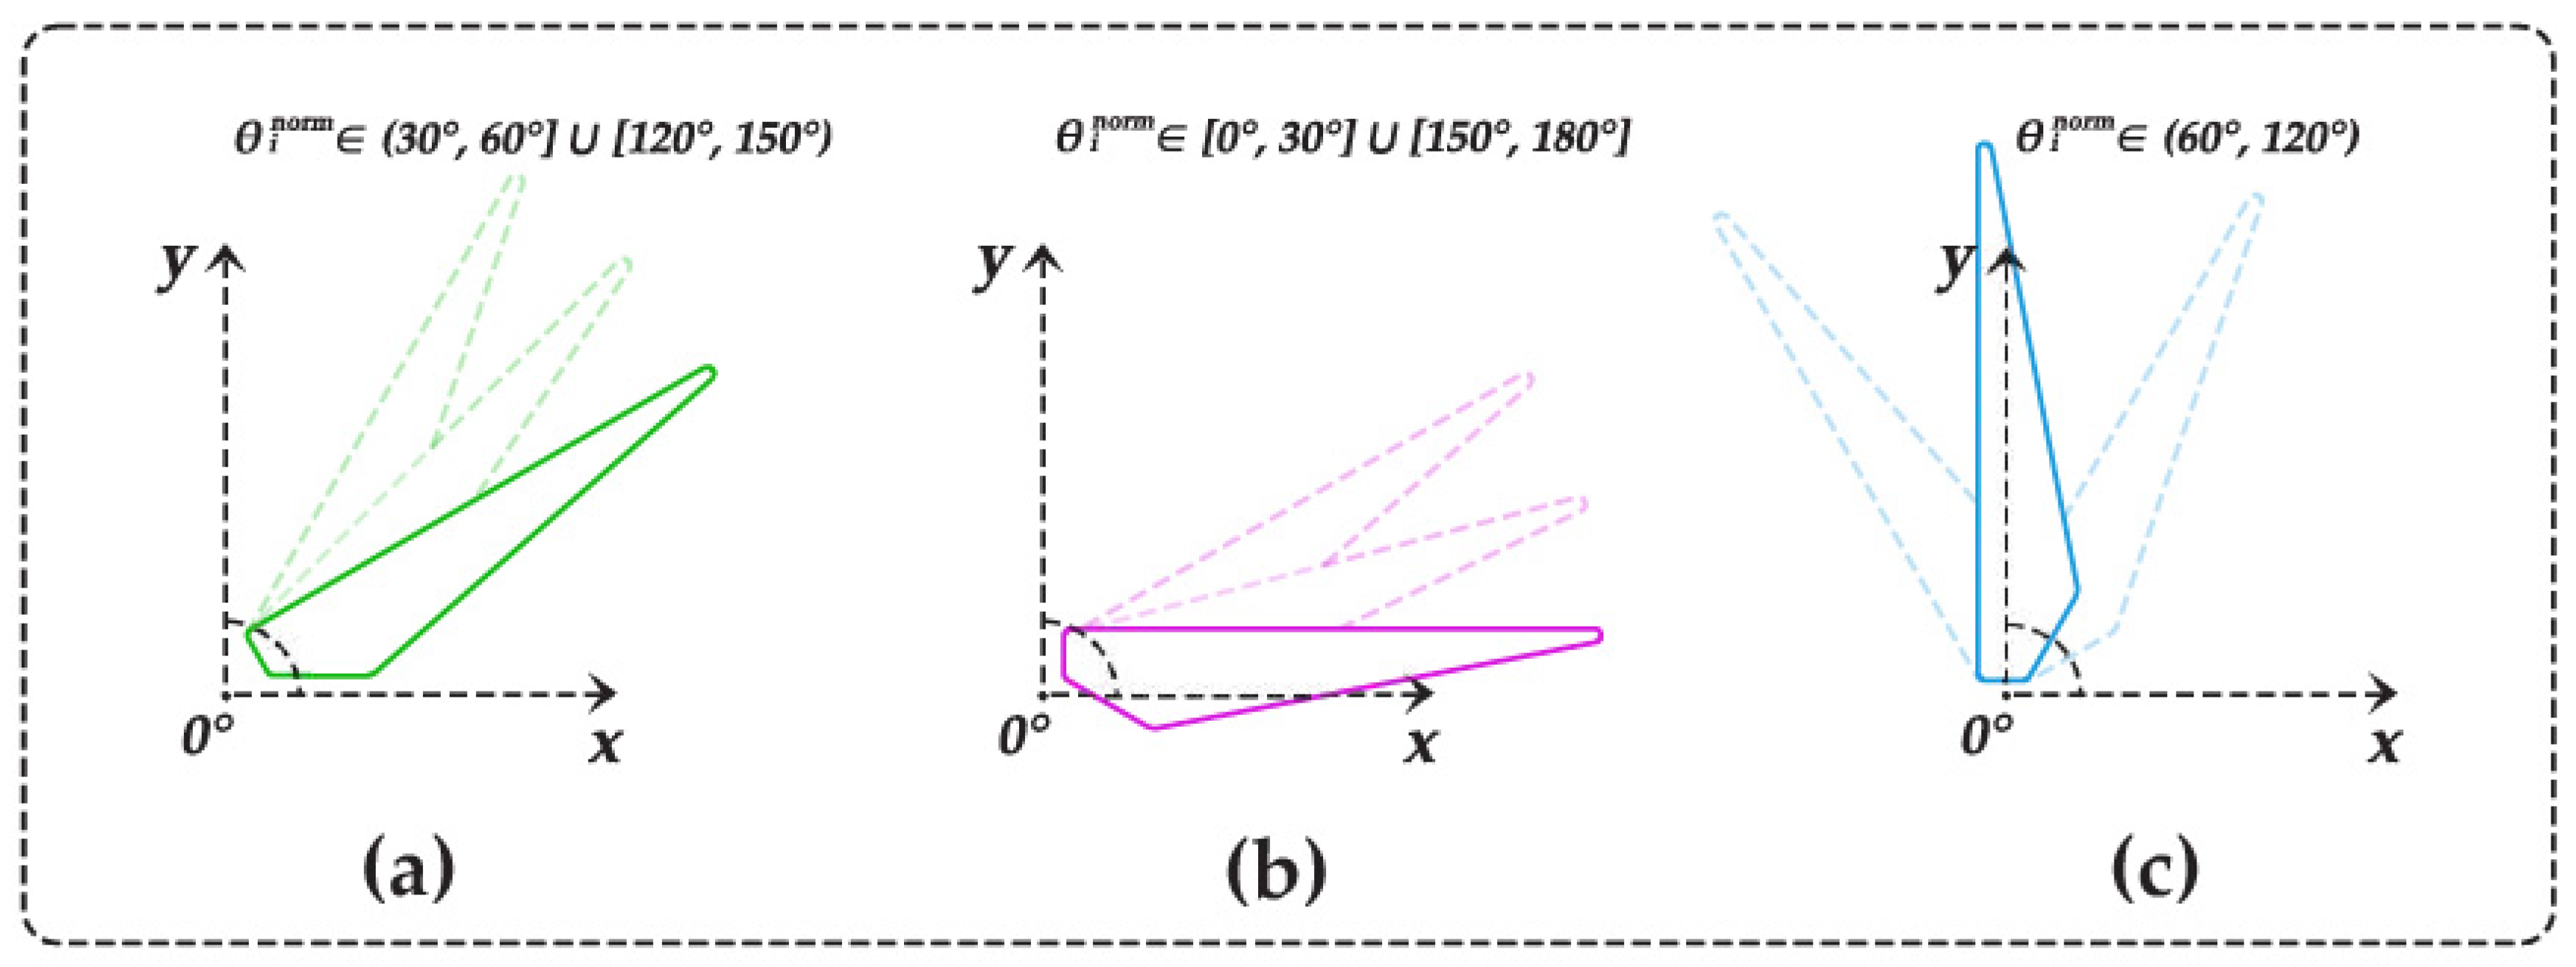
After converting to degrees in , the system classifies angles into acute, horizontal, or vertical tilt ranges. Figure 5 and Figure 6 illustrate angle geometry and examples. Accurate blade pitch angle classification is essential for DyTAM, as it dictates the selection of the appropriate trajectory model, ensuring that the UAV’s flight path is optimally aligned with each blade’s orientation for thorough inspection.
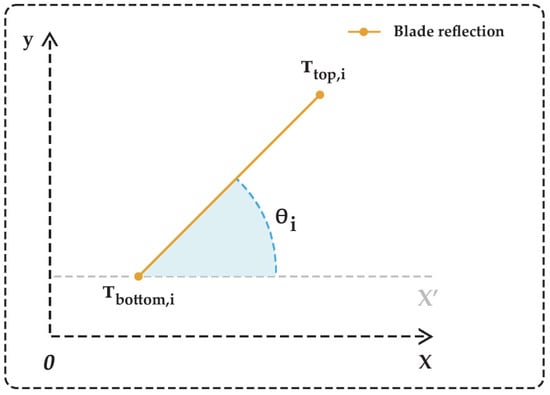
Figure 5.
This diagram depicts the pitch angle in a two-dimensional coordinate system, measured as the angle between the x-axis and the line connecting the blade’s bottom vertex () to its top vertex () while illustrating the blade reflection and reference axes for clarity.
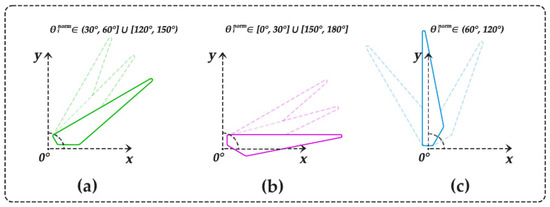
Figure 6.
Blade tilt categories: (a) acute, (b) horizontal, and (c) vertical. Each orientation prompts a specialized path-planning strategy.
Figure 5 illustrates the pitch angle within a two-dimensional coordinate system. The angle is measured between the x-axis and the line connecting the blade’s bottom vertex () to its top vertex (). For enhanced clarity, the illustration includes the blade reflection and reference axes, aiding in the understanding of angle measurement and spatial orientation.
Finally, Figure 6 presents a schematic example of recognizing the blade tilt categories by DyTAM. Each orientation category is critical as it triggers a specialized path-planning strategy within DyTAM, ensuring that the inspection approach is customized to the blade’s specific spatial arrangement.
3.4. Trajectory Strategies for Each Turbine Component
Once blades are classified, the system builds a trajectory for each component. A queue enumerates them in the following sequence: three blades, tower, and nacelle. After inspecting a component, the UAV uses a polynomial function to return to , ensuring smooth velocity transitions. This approach to trajectory planning ensures that each turbine component is inspected with a path optimized for its geometry and orientation, enhancing inspection efficiency and data quality.
3.4.1. Blade Trajectories
Below are the trajectory models built for the WTC components.
Acute Tilt: For angles in , we determine the trajectory offset:
Parameters and fix coverage density and standoff distance.
Vertical Tilt: For angles in , a spiral pattern orbits the blade while reducing radius:
Horizontal Tilt: For angles in , a helical path:
3.4.2. Tower and Nacelle
Tower: We use a spiral that ascends the tower while encircling it:
Nacelle: To ensure comprehensive coverage of the nacelle compartment’s surface, specialized trajectories for different planes—lateral, rear, and top—have been designed. Each of these planes is inspected using a dedicated trajectory. Using the general motion formula, the UAV trajectory for inspecting each plane is defined as follows:
3.5. Influence of Wind Conditions on Trajectory Adaptation
Wind conditions significantly impact UAV-based inspections, causing deviations from planned trajectories and affecting data quality. To address these challenges, DyTAM incorporates real-time wind compensation into its trajectory adaptation algorithms. Specifically, the UAV’s motion is modeled by integrating the difference between the UAV velocity and the wind velocity over time, ensuring accurate control under fluctuating wind.
Following the approach in [29] and expanded in our earlier formulations, we express the UAV position as:
where is the UAV’s initial position at time , is the UAV velocity relative to the air, is the instantaneous wind velocity, and is the offset that encodes the particular inspection pattern (e.g., helical, spiral, or offset-line) for each turbine component.
Under mild or nominal wind speeds, the second term in Equation (10) has minimal effect, but when wind gusts become significant (up to 15 m/s in our field tests), dynamic compensation is triggered more frequently. In practice, if strong gusts push the UAV away from its planned route, the real-time control loop immediately adjusts to counteract and preserve the intended stand-off distance and viewing angles.
For example, for a horizontally tilted blade (Equations (7) and (10)), the net motion becomes
where the bracketed integral term accounts for the time-varying wind velocity, and the second bracketed term enforces the helical scanning pattern.
Hence, DyTAM ensures that even if wind speed changes during the inspection of horizontally oriented blades, the UAV remains close to the nominal helix, capturing consistent imaging data for damage assessment.
Although our experiments utilized a single UAV per turbine, the same real-time wind compensation can be applied to multi-UAV scenarios. Each UAV solves an instance of Equation (10) individually, sharing relevant wind information (e.g., measured gust speeds at different altitudes) to improve the collective stability of the swarm. This approach is further discussed in Section 5, highlighting potential expansions toward large-scale wind farm surveys under adverse weather conditions.
4. Results
4.1. Experimental Setup
We performed two major experiments to compare our automated trajectory planning with manual UAV control. Both experiments involved the same turbines and UAV hardware but varied in environmental conditions.
Experiment 1 (Nominal Conditions): In the first experiment, winds remained mild (≈ 5–7 m/s). We tracked key metrics: trajectory deviation from planned routes, total flight distance, speed stability, and maximum object deviation.
Experiment 2 (Windy Conditions): In the second experiment, wind speeds ranged 13–15 m/s, causing more frequent UAV corrections. We measured inspection time, distance accuracy, number of flight path corrections, and external influence percentage (relating to gust intensity).
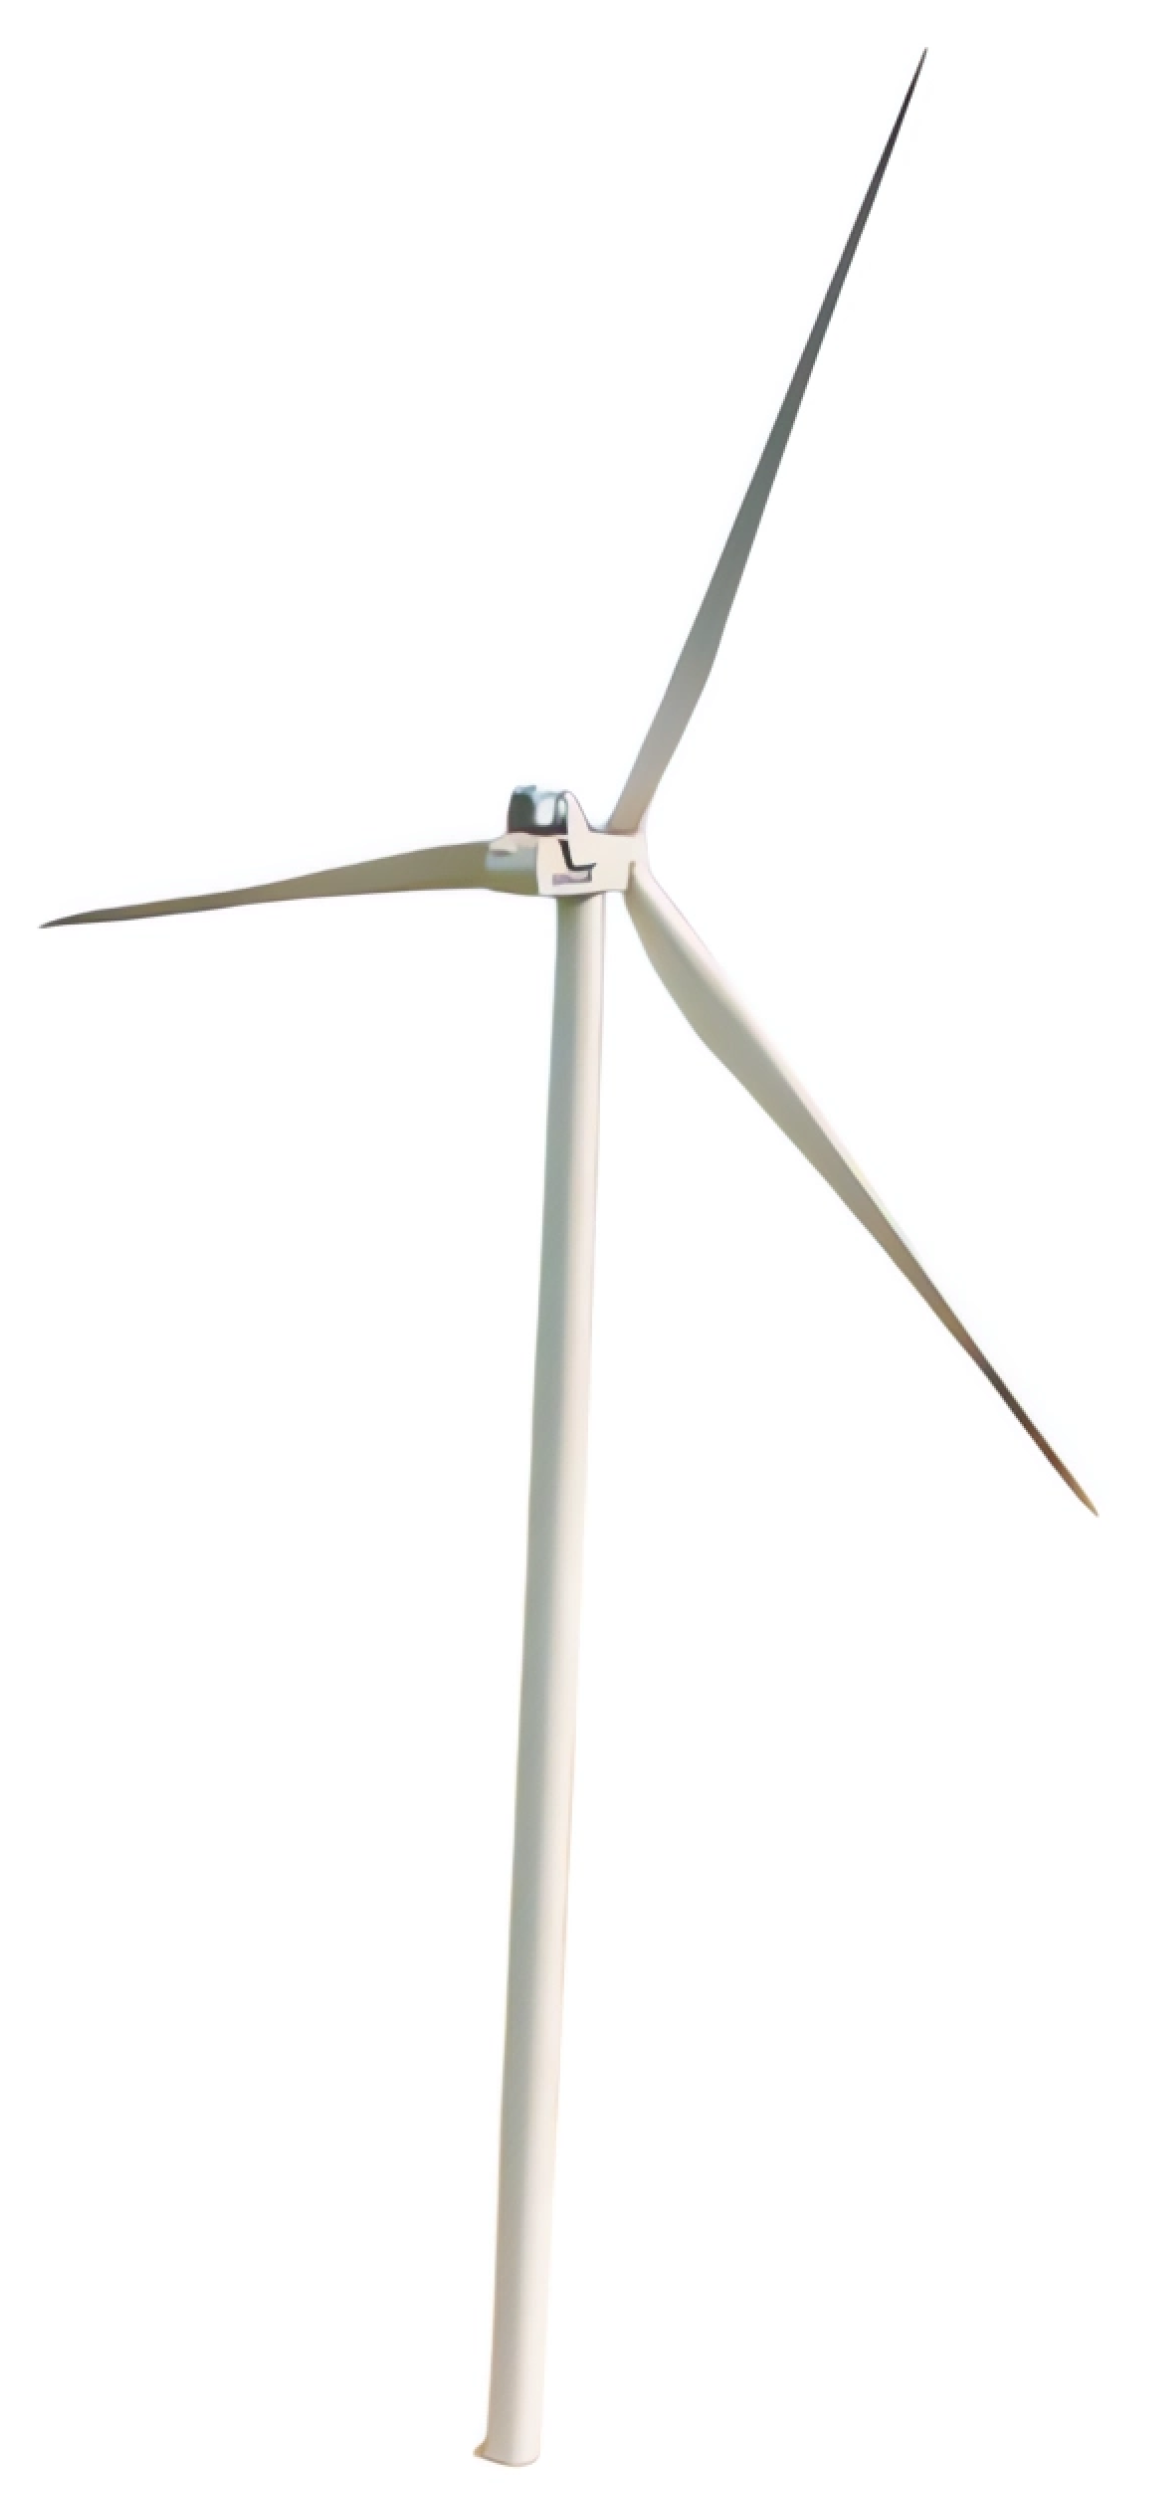
All the experiments were conducted at a wind farm in the mountainous region of western Ukraine, featuring Vestas V112 turbines (Vestas Wind Systems A/S, Aarhus, Denmark). Key technical characteristics of the Vestas V112 turbine are as follows: a 3 MW rated capacity, a 112 m rotor diameter, and an 84 m tower height. The mountainous terrain and variable wind conditions of the site provided a rigorous testing environment, essential for evaluating the robustness and adaptability of the DyTAM method under realistic operational challenges. An illustrative photo of a Vestas V112 turbine is demonstrated in Figure 7.
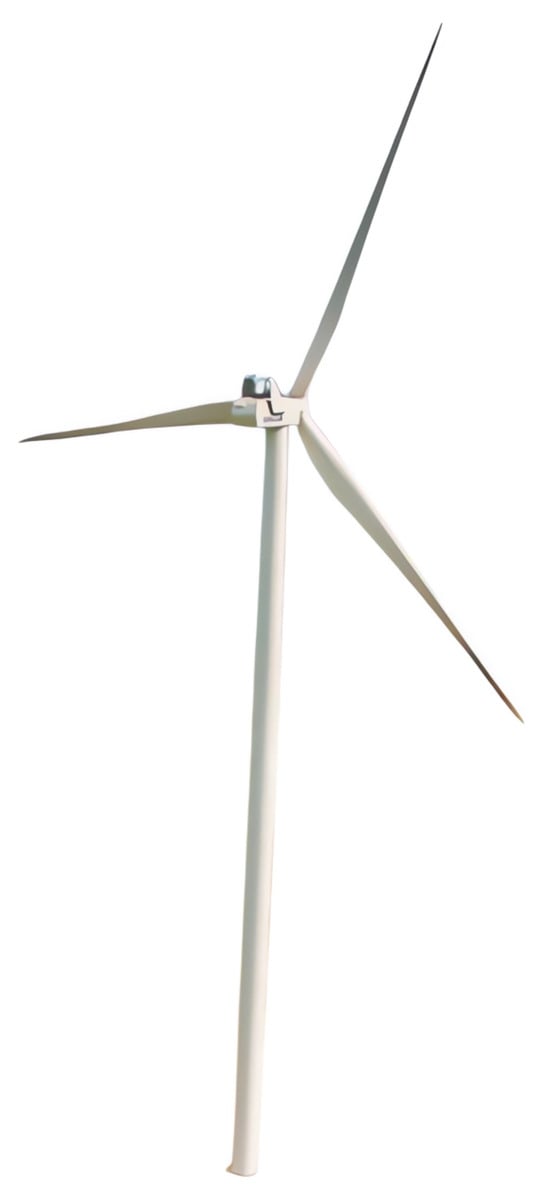
Figure 7.
Illustrative photo of a Vestas V112 turbine. Mountainous terrain and variable wind conditions made it suitable for testing adaptive UAV techniques.
Vestas V112 turbines represent a common model in the industry, facilitating the generalizability of our findings. DyTAM is designed to be adaptable to various turbine dimensions and geometries by adjusting parameters such as standoff distances (R, ), trajectory coefficients (, , ), and inspection speeds (, , ) within the trajectory Equations (5)–(8). While the Vestas V112 served as the primary test case, the underlying principles and algorithms of DyTAM are applicable to other turbine types, with necessary adjustments mainly concerning the scaling of these trajectory parameters to match the specific dimensions of different wind turbine models.
During the fieldwork, the turbines were halted for safety. Halting wind turbines for inspection, while seemingly counterintuitive for operational energy production, is a standard safety practice during detailed and close-range inspections, especially in experimental and research contexts such as this one. This controlled setting allowed for the acquisition of high-quality, detailed data essential for accurately assessing the performance and effectiveness of the DyTAM system without motion blur from rotating blades and enhanced the safety of UAV operations in close proximity to large machinery.
Two UAVS, DJI Matrice 300 RTK (SZ DJI Technology, Shenzhen, China) [38] that are shown in Figure 8a, were utilized in the fieldwork. Each UAV was equipped with:
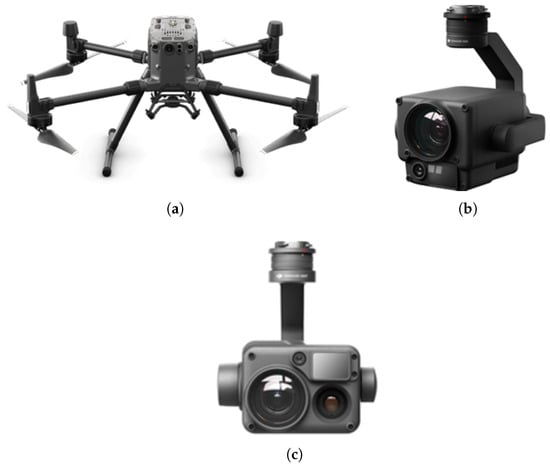
Figure 8.
The illustration of (a) DJI Matrice 300 RTK UAV [38], a robust quadcopter platform for industrial applications, alongside two camera modules: (b) the DJI Zenmuse H20, which stores an RGB sensor, and (c) the DJI Zenmuse H20T, which integrates both an RGB and a thermal sensor. Each camera is secured on a three-axis gimbal to maintain stability and minimize vibration during flight.
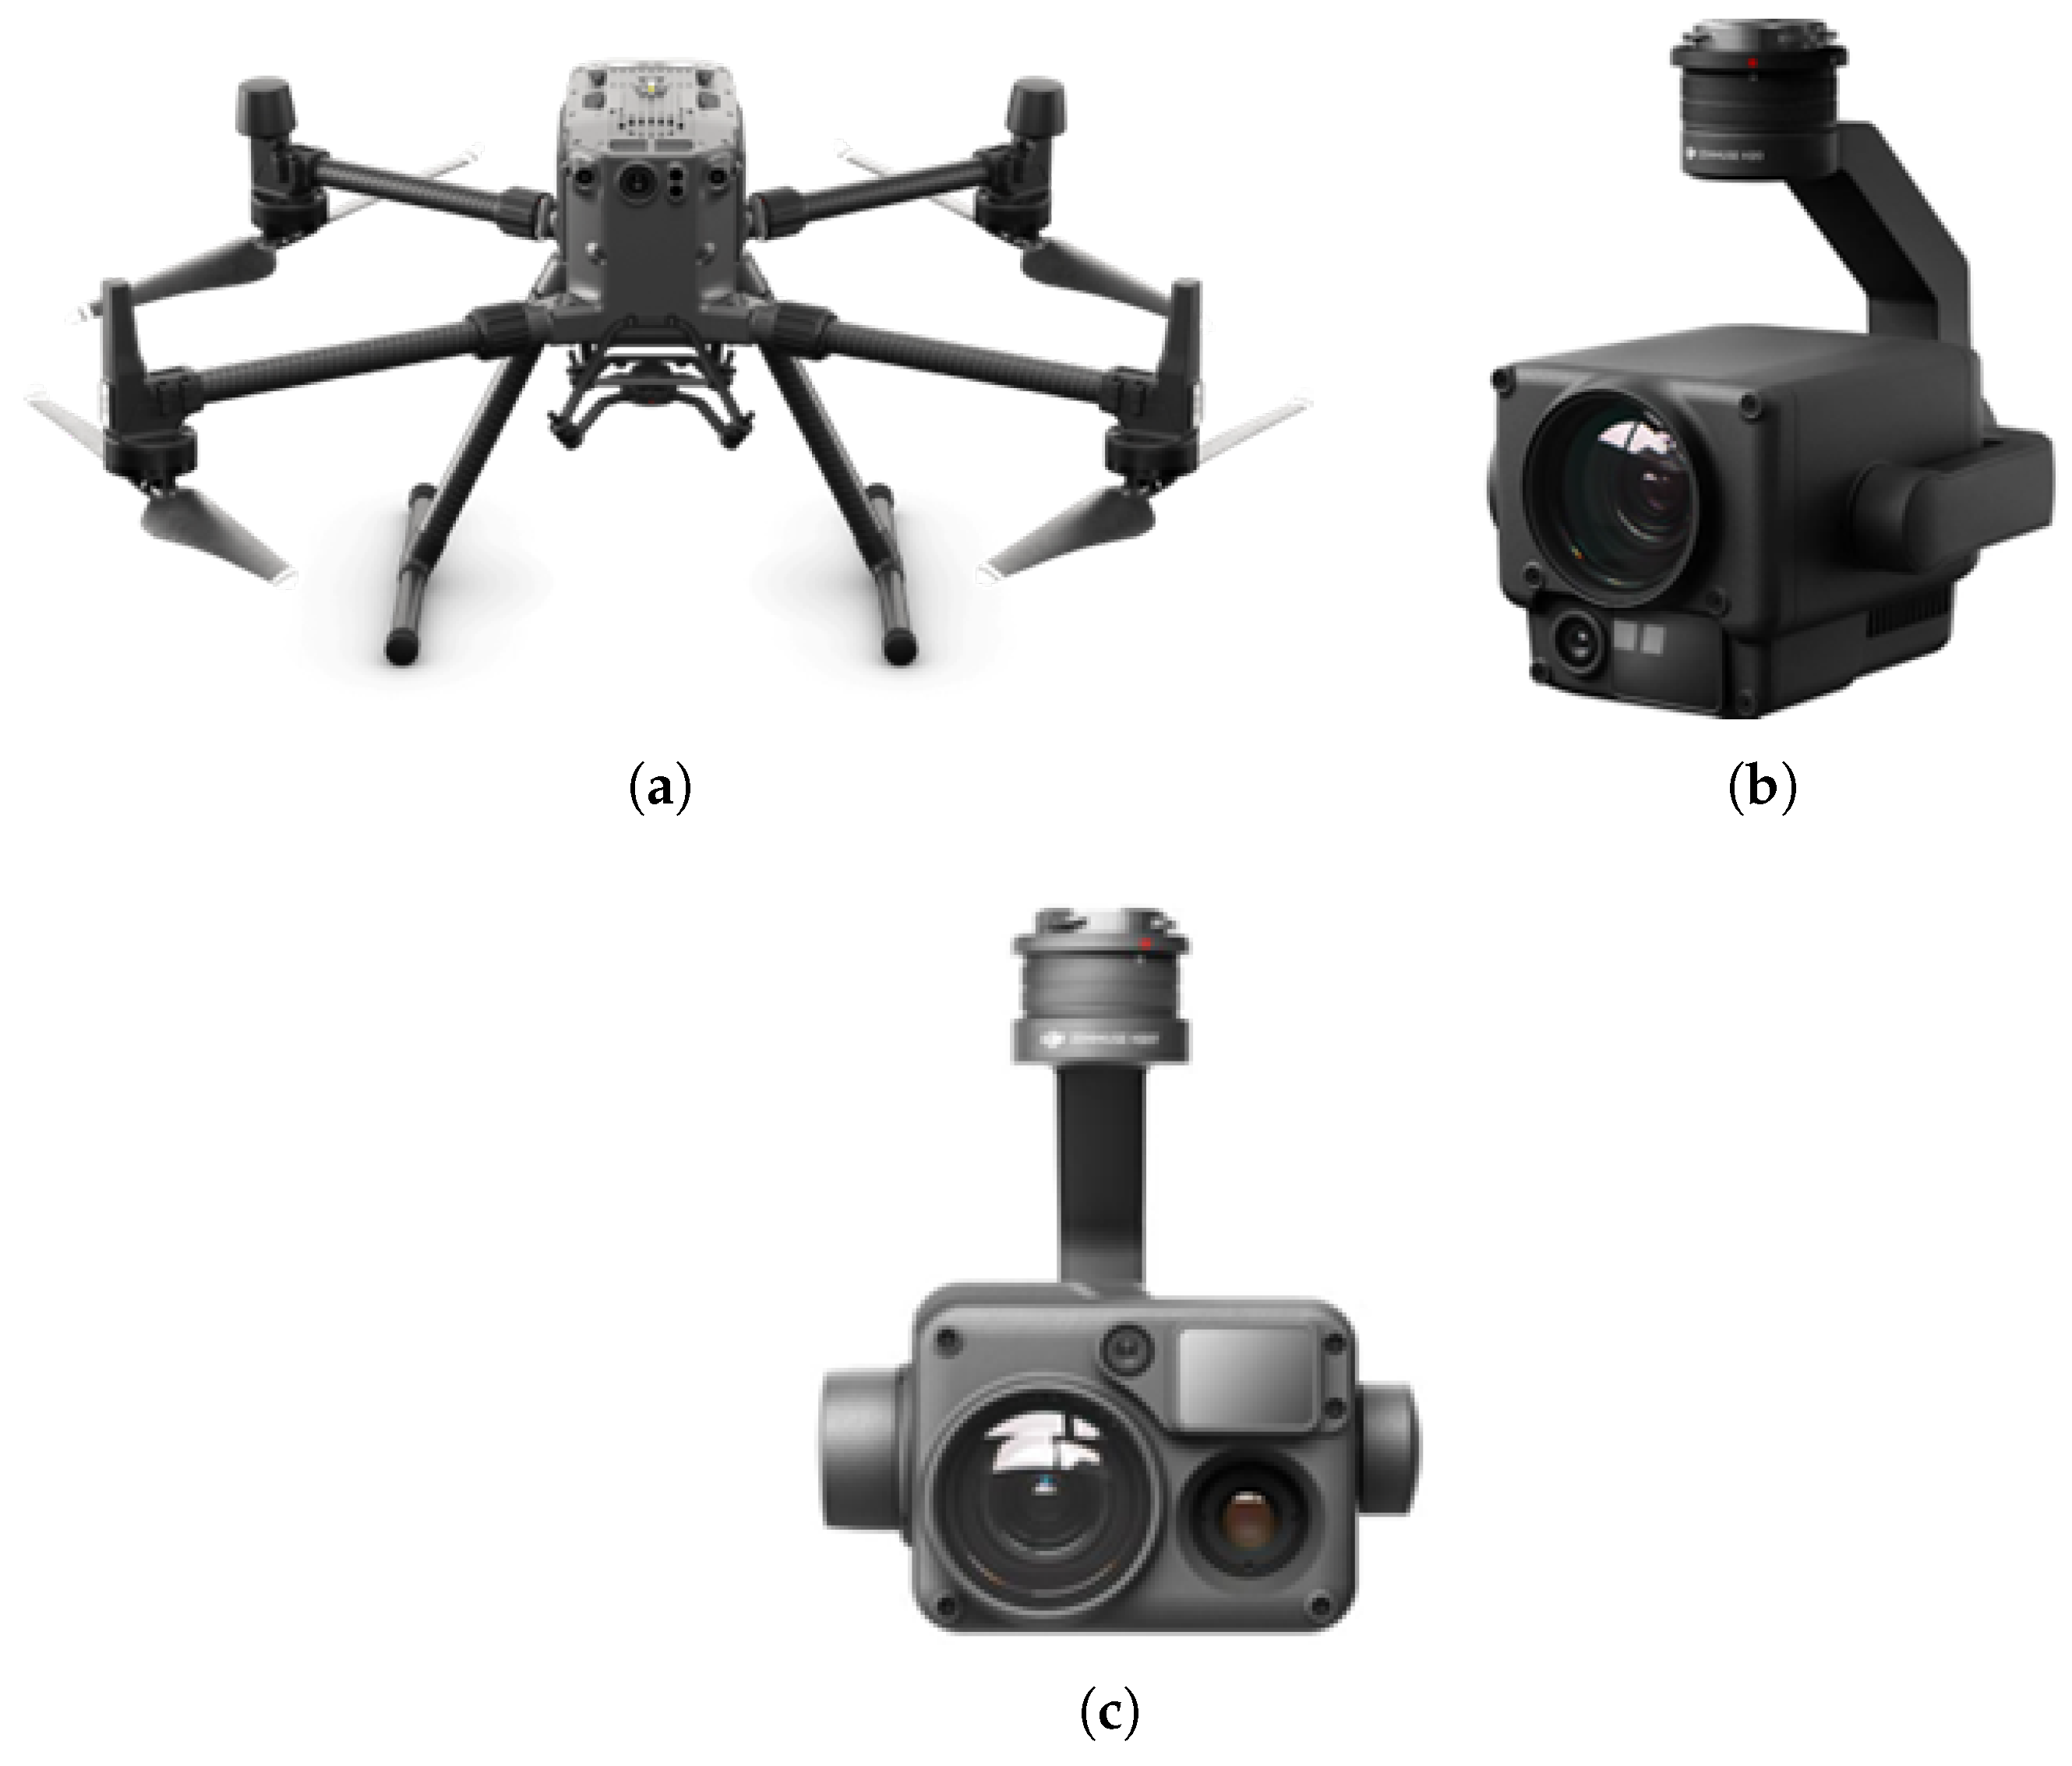
The DJI Zenmuse H20 features a 20 MP, 23× Hybrid Optical Zoom RGB camera, which provides high-resolution imagery necessary for detailed visual inspection and accurate segmentation of turbine components. The DJI Zenmuse H20T, integrating both a 12 MP wide-angle RGB camera and a 640 × 512 thermal camera, adds thermal imaging capabilities, which are essential for identifying thermal anomalies indicative of subsurface defects or overheating components, as was investigated in [12]. Furthermore, both cameras were mounted on a three-axis gimbal (Figure 8), ensuring stable imaging in flight.
Real-time kinematic (RTK) corrections provided centimeter-level positioning accuracy, even under gusty wind conditions reaching 13–15 m/s. The entire DyTAM-based wireless information system was implemented in accordance with guidelines from [39,40], enabling reliable data transmission and robust operational performance.
4.2. Analysis of the Results
Table 1 provides the results obtained from both experiments. Table 1A lists performance under nominal wind, while Table 1B highlights results under stronger wind influence. Components include “blade–horizontal tilt”, “blade–vertical tilt”, “blade–acute tilt”, “tower”, and “nacelle (motor)”.

Table 1.
A comprehensive comparison of manual vs. automated UAV control under nominal (Experiment 1) and windy (Experiment 2) conditions using the DyTAM-based system. (A) details performance metrics under nominal wind conditions, focusing on trajectory deviations and speed stability. (B) presents results from windy conditions, emphasizing inspection time, distance accuracy, and the system’s resilience to external influences.
Analysis of Table 1A. Under nominal weather, the automated approach consistently outperforms manual control. For instance, with a horizontally tilted blade, the mean deviation drops from m to m (an 80.9% improvement), while total distance decreases from m to m. Speed stability also sees a notable boost, rising to 91.57% versus 80.46%. Similar trends are observed for vertical or acute blades, demonstrating that real-time orientation analysis helps maintain more uniform flight corridors. Meanwhile, tower and nacelle inspections benefit from simpler geometric constraints but still achieve lower deviations and better speed stability with automation. These results collectively highlight DyTAM’s enhanced precision and consistency in trajectory maintenance and speed control under ideal conditions.
Analysis of Table 1B. Under wind gusts of 13–15 m/s, the differences become even more pronounced. Inspection times for manually flown horizontal blades balloon to 22.35 min, whereas automated flights require only 8.46 min. Dist. accuracy rises from 87.65% to 95.42%, and the external influence measure is cut from 75% to 45%. The number of path corrections also shows a dramatic improvement, dropping from 20 to 8 for horizontal blades. Likewise, for vertical blades, time drops from 24.57 min to 9.13 min, with significant gains in distance accuracy and fewer corrections. Such results underscore the advantage of the DyTAM-based system that dynamically adapts to blade angles and accounts for wind. The data from Table 1B robustly validate DyTAM’s adaptive capabilities under adverse conditions, showcasing its ability to maintain efficiency and accuracy despite significant external disturbances.
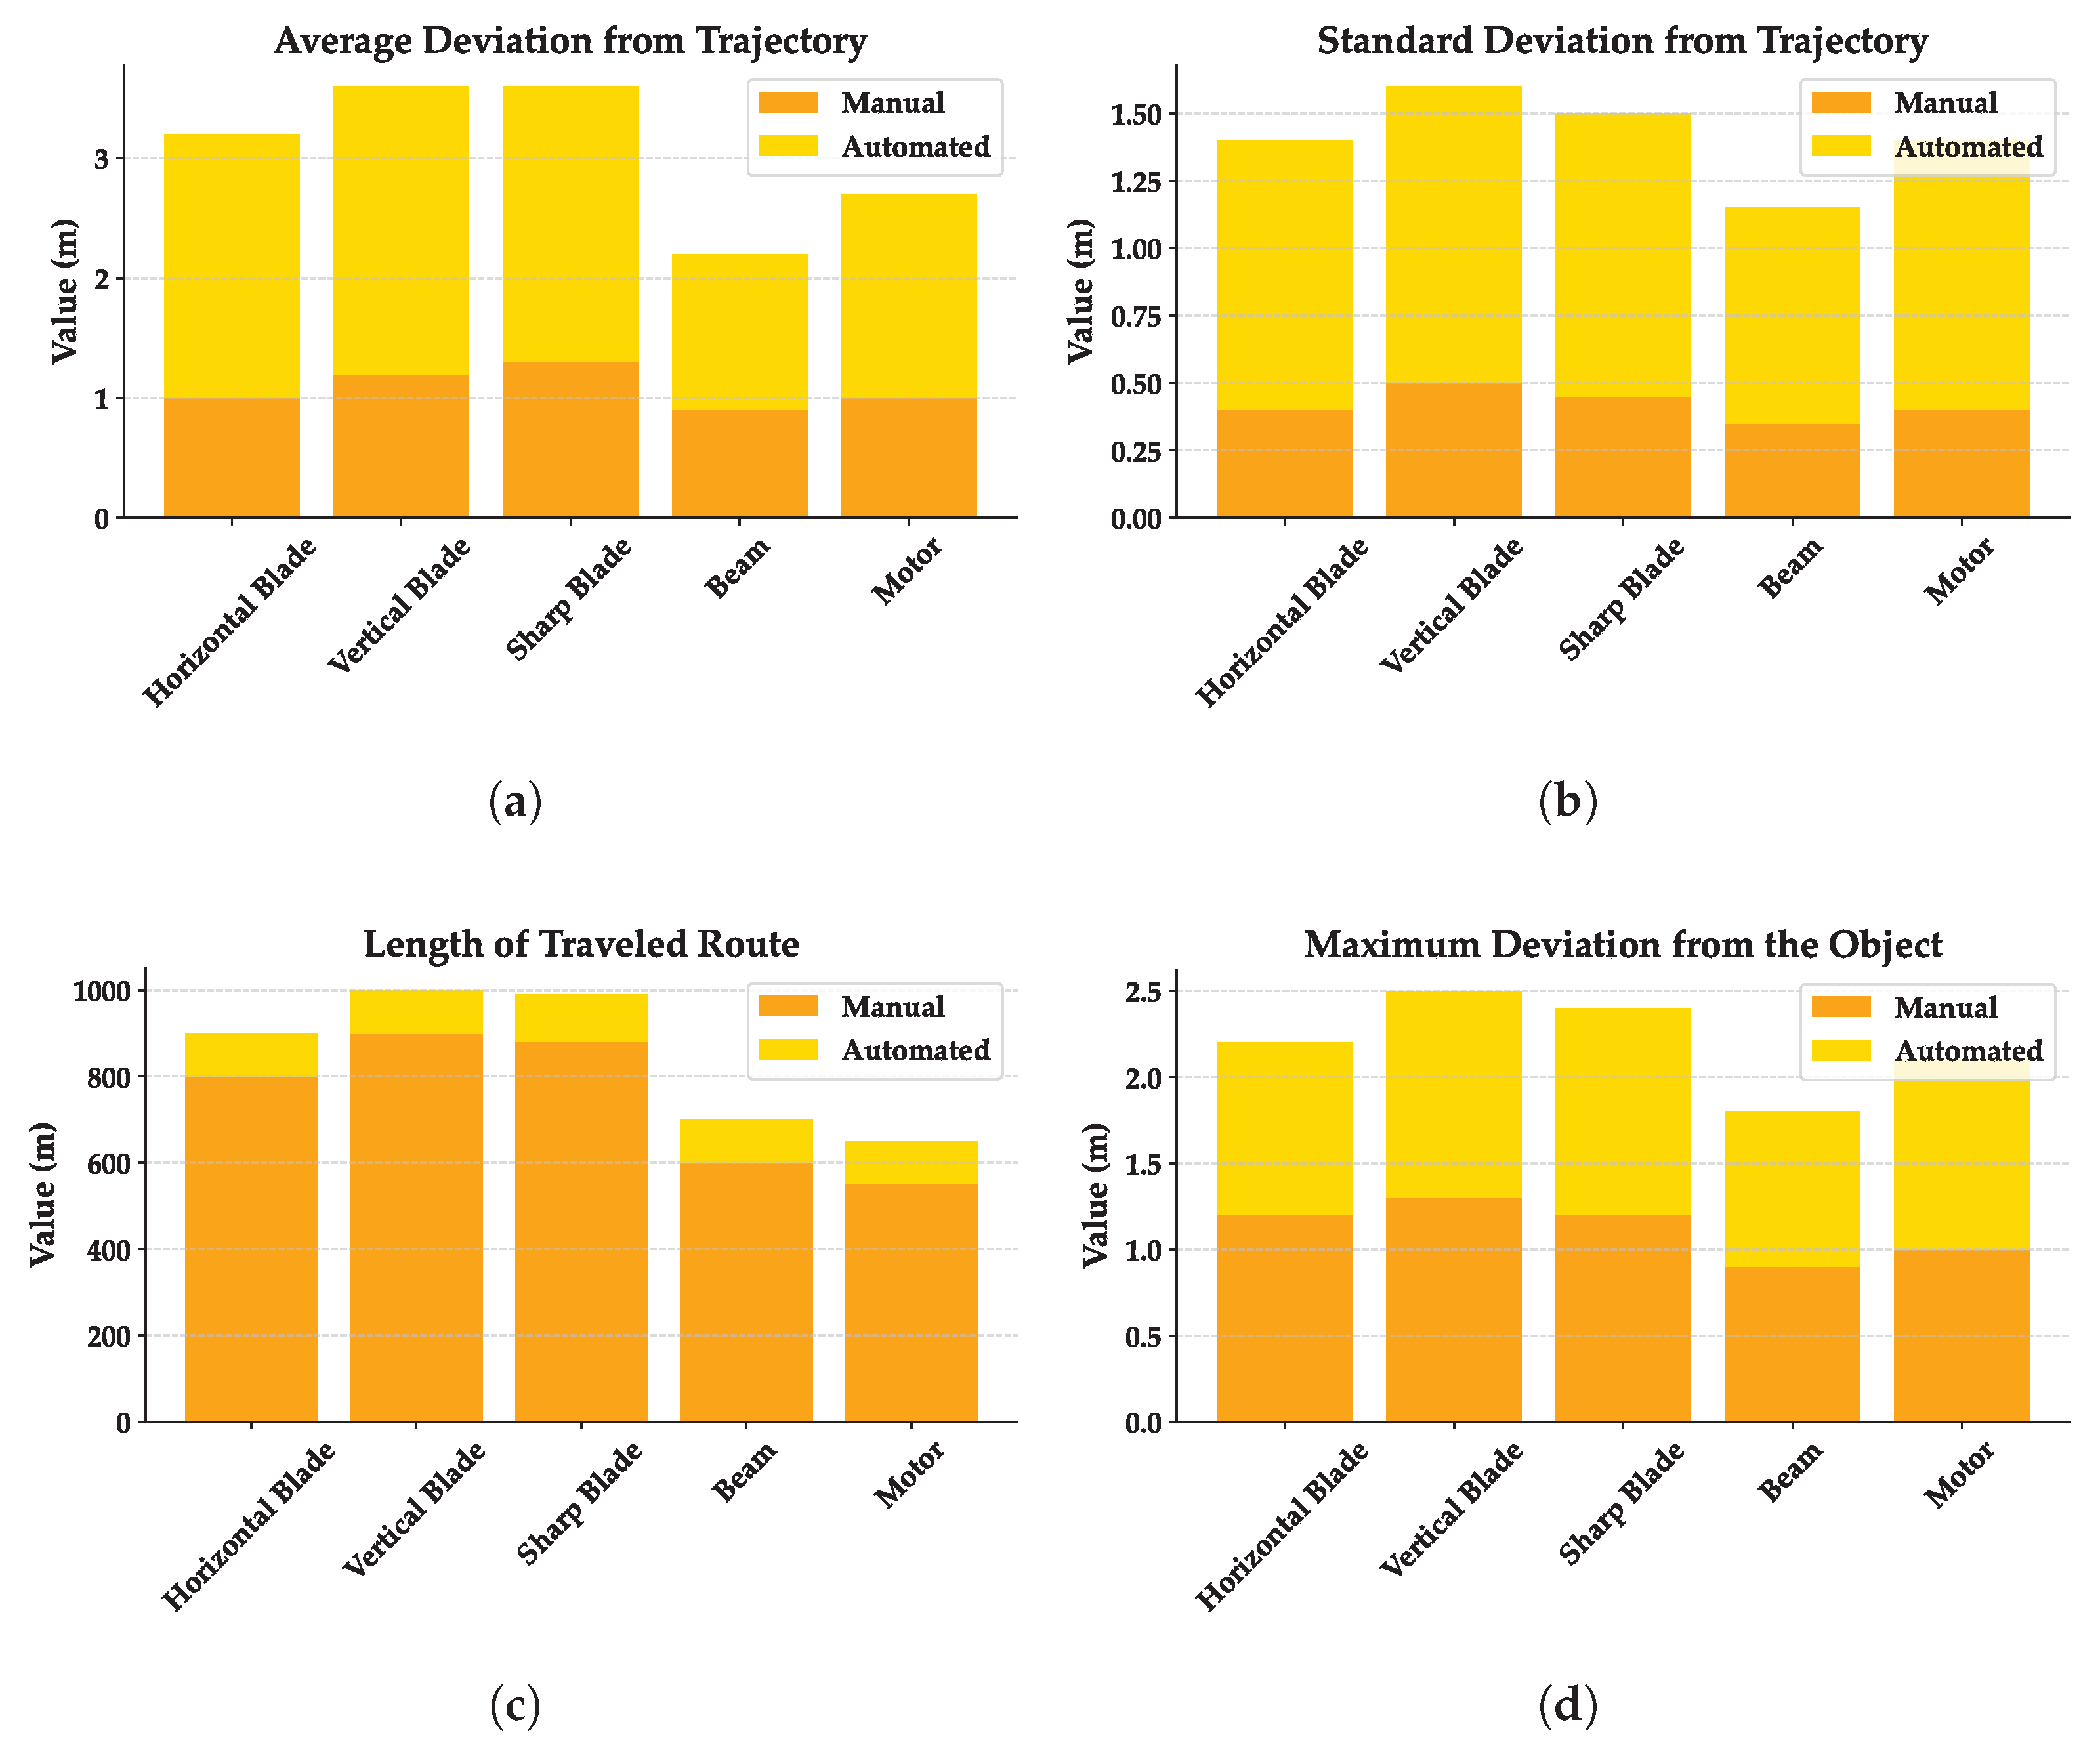
Figure 9 confirms the quantitative findings from Table 1. The mean deviation for blades is significantly reduced via automation, and variance is considerably lower, implying more stable flight. This is particularly relevant for complex rotor blades, where a stable vantage point is crucial for identifying small cracks or other defects. As can be seen, the graphical data in Figure 9 reinforce the statistical advantages of DyTAM, visually confirming its enhanced stability and precision in UAV flight control, which are essential for reliable and effective wind turbine inspections.
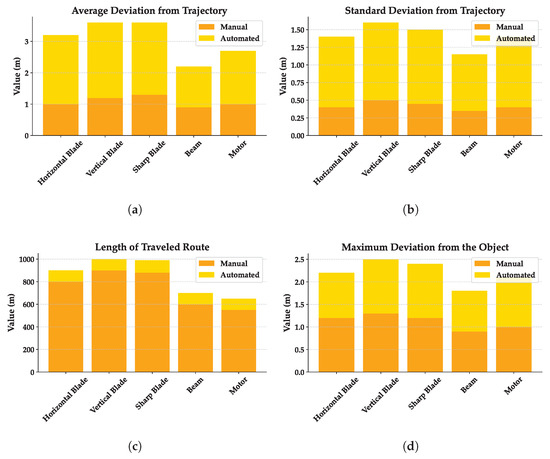
Figure 9.
Visual comparison of key metrics for different WTC components under nominal conditions. Sub-figure display: (a) mean trajectory deviation, (b) standard deviation of trajectory, (c) total distance traveled, and (d) maximum deviation from the object. In each sub-figure, automated control (yellow bars) consistently demonstrates superior performance over manual control (orange bars), yielding tighter adherence to planned routes and shorter flight lengths.
4.3. Quantitative Comparison with the State of the Art
Beyond comparing our DyTAM to manual control, it is instructive to benchmark against recent state-of-the-art UAV inspection frameworks [26,32,33,34]. The references include both classical approaches (fixed flight paths) and more modern solutions that integrate partial automation. Table 2 collates key metrics reported in other publications, focusing on inspection time, coverage, and mean deviation.

Table 2.
Quantitative comparison of our DyTAM with selected state-of-the-art approaches in UAV-based wind turbine inspection. The table contrasts inspection time, coverage percentage, mean deviation from planned paths, and automation level across different methods, with numbers in bold indicating superior performance metrics.
Based on the results in Table 2, the following insights can highlighted:
Inspection Time: Our DyTAM stands out with an average inspection time of approximately 8.8 min (average of automated times in Table 1B), considerably lower than the 12–18 min range reported in references [26,32,33,34]. Such an outcome can be attributed to the real-time blade orientation detection that selects optimized trajectories (Equations (5)–(7)) and efficient path execution, preventing redundant scanning passes.
Coverage: Coverage rates in prior work range from about 88% to 92%, potentially hindered by static paths or manual inconsistencies. By automatically adjusting flight angles and paths to blade tilt and component geometry, our approach achieves an estimated 96% coverage (based on analysis not detailed here, but reflected in the abstract’s claim of a 6% increase over manual, implying a high baseline), ensuring minimal blind spots. This performance resonates with the strong coverage emphasis noted in references [33,34] but surpasses their reported results.
Mean Deviation: Most state-of-the-art approaches report mean deviations from planned routes between 2.2 m and 3.1 m, reflecting moderate correction capabilities or reliance on less precise localization. By contrast, our approach yields an overall average mean deviation of only 0.78 m (average of automated deviations in Table 1, weighted towards windier conditions for a conservative estimate, though nominal conditions showed even lower deviations). Since the UAV continually monitors its position (via RTK) and compensates for wind (Equation (10)) while adapting to pitch changes, it adheres closely to the planned path. This advantage is critical for maintaining consistent standoff distance and capturing high-quality imagery for detecting small-scale defects.
Automation Level: Compared to partial automation (e.g., pre-planned paths with manual initiation/oversight) [26,33] or manual control (even if guided by machine learning) [32,34], the proposed DyTAM approach achieves full automation from the initial viewpoint through component inspection and return, drastically reducing pilot workload and enabling consistent, repeatable flights. This distinction underscores DyTAM’s potential for large wind farms or multi-UAV operations.
Hence, the data from Table 2 confirm that our DyTAM surpasses existing benchmarked solutions in inspection speed, coverage thoroughness, and path fidelity. The results obtained underscore DyTAM’s advancements in UAV-based wind turbine inspection, highlighting its potential impact on the industry.
4.4. Illustrative Cases from Fieldwork
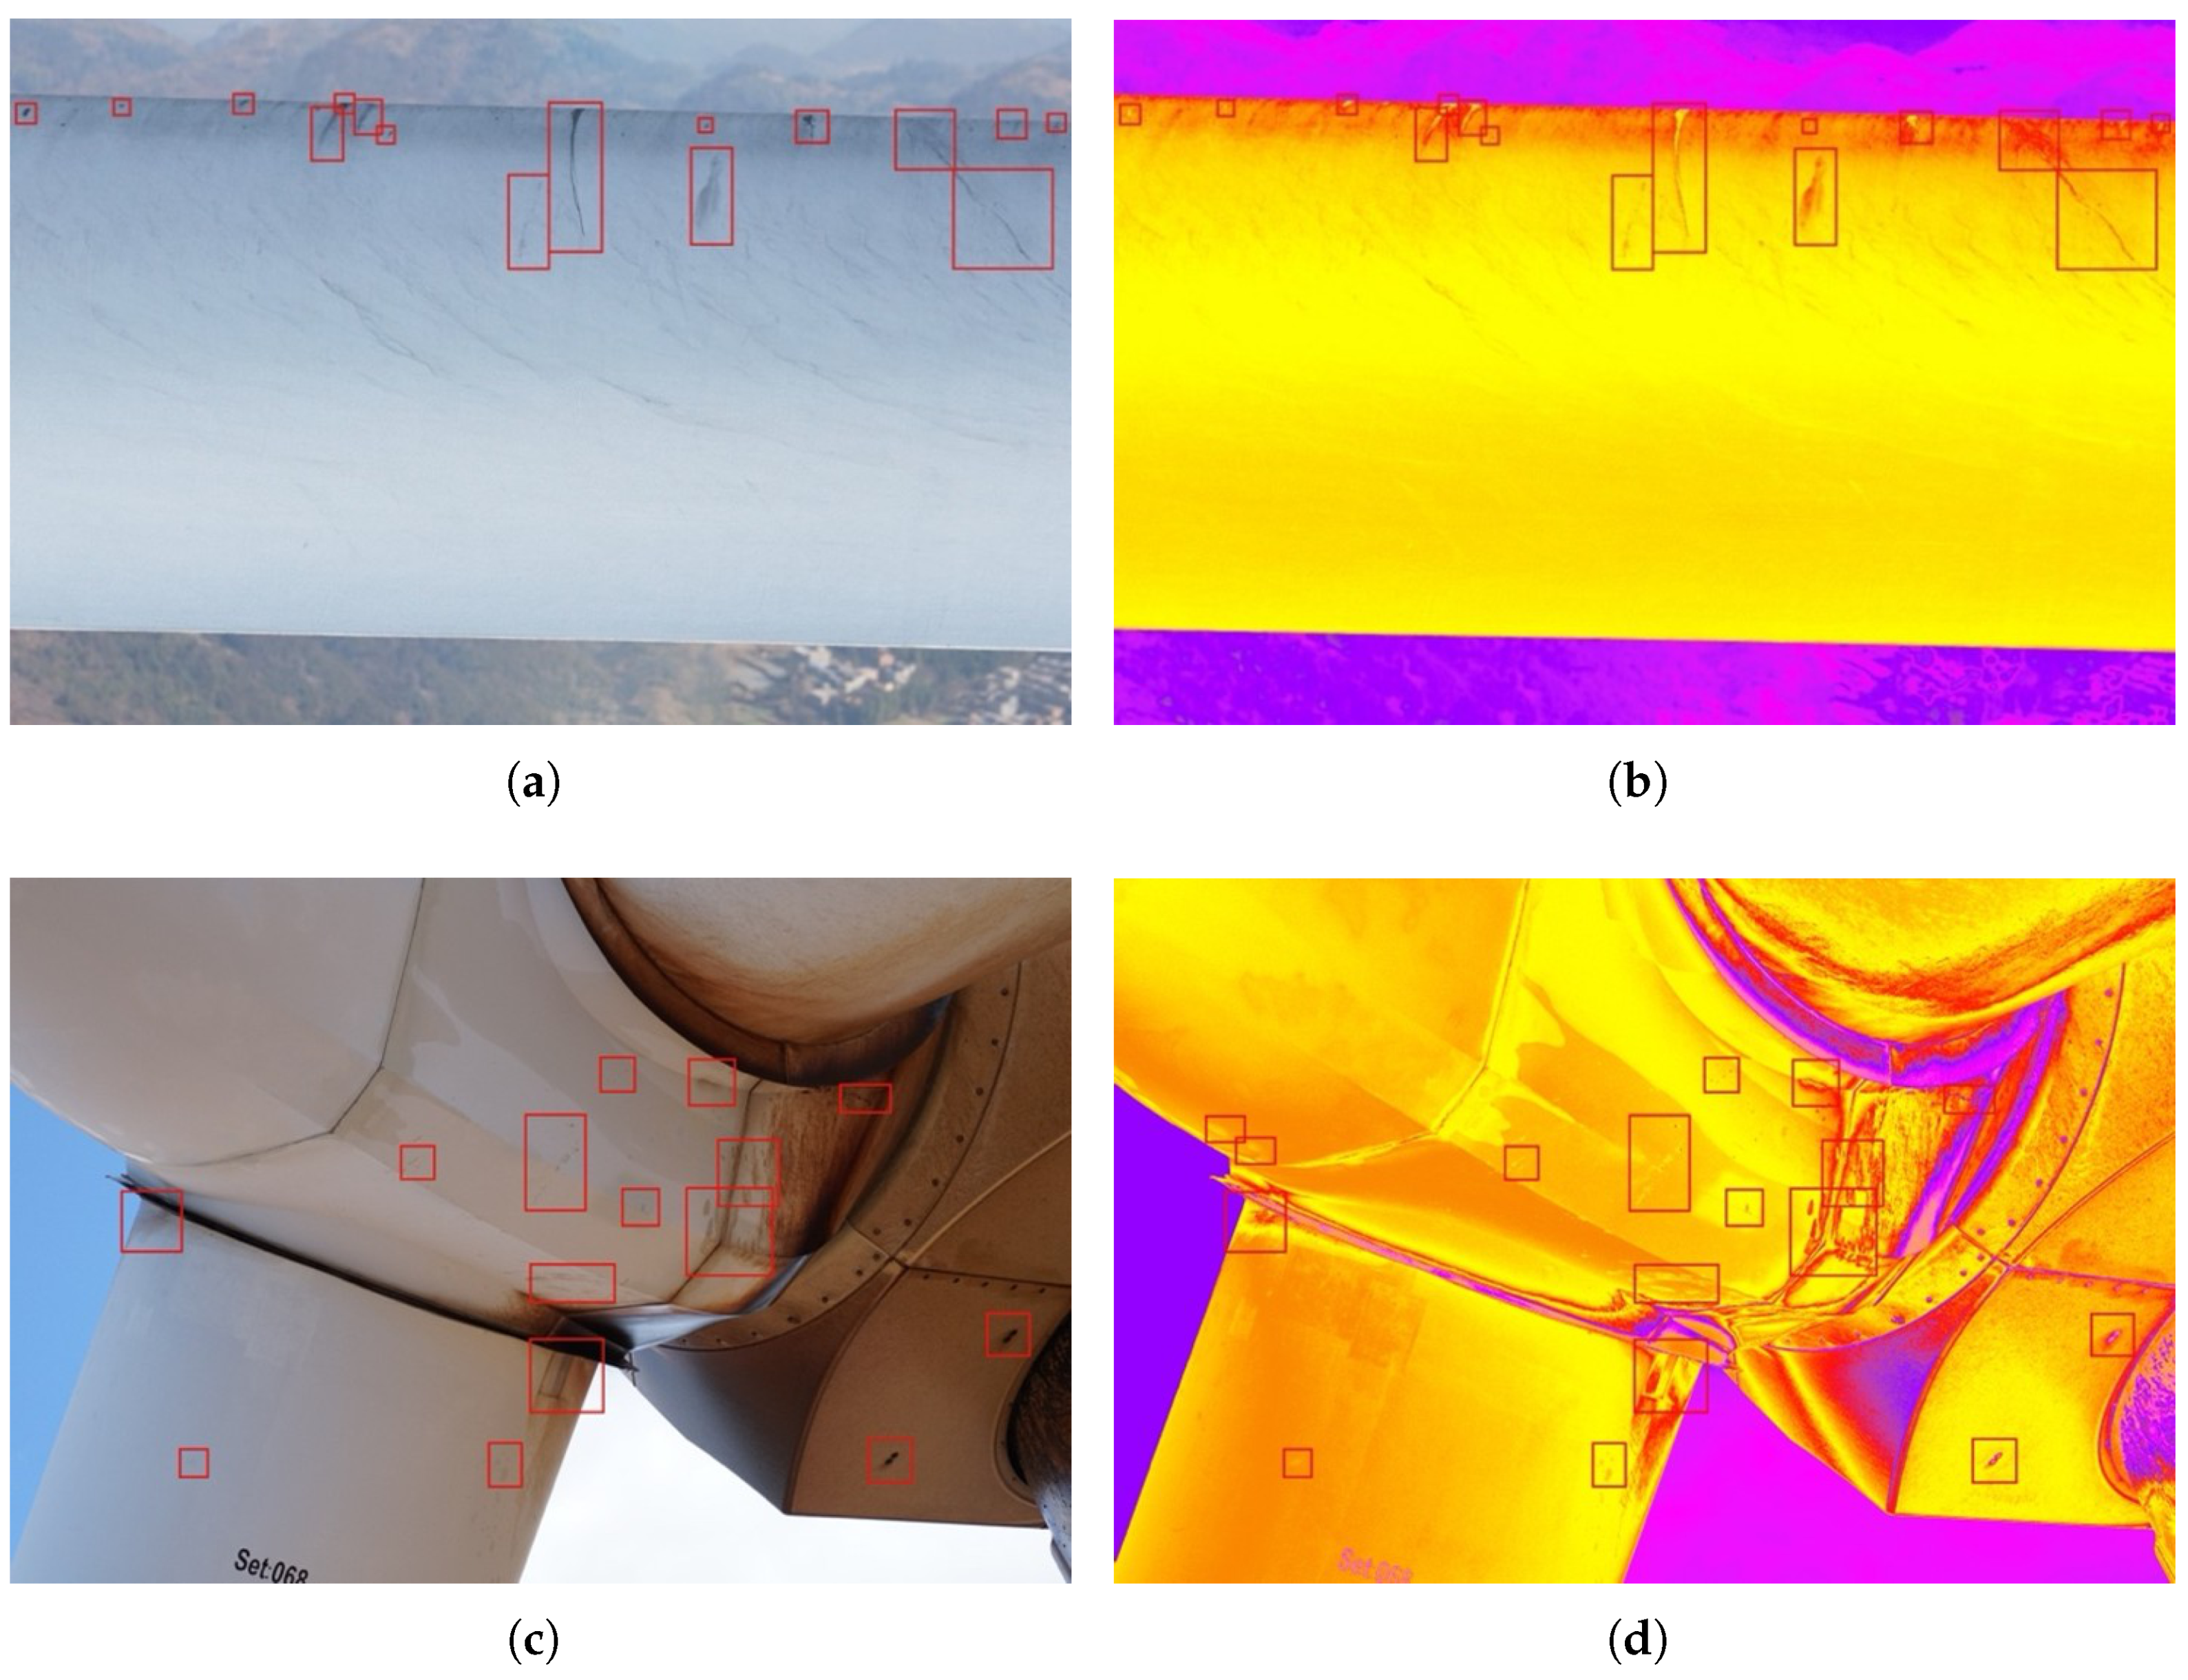
During field experiments, several cases highlighted the practical advantages of DyTAM’s dynamic adaptation. One notable instance involved a Vestas V112 turbine with pre-existing damage on one blade, specifically moderate leading-edge erosion near the blade tip. Under nominal wind conditions (Experiment 1), DyTAM successfully identified the blade’s orientation (acute tilt in this case) and applied the corresponding trajectory model (5). It effectively adapted its path in real time to maintain a consistent standoff distance and viewing angle relative to the moving reference frame of the blade surface, capturing high-resolution RGB imagery that clearly delineated the extent and severity of the erosion (similar to the defect shown in Figure 10a). The integrated thermal camera also captured data (Figure 10b), although no significant thermal anomalies were associated with this particular erosion. In contrast, during a comparative manual inspection under similar conditions, the operator struggled to maintain consistent imaging of the damaged area, resulting in variations in image scale, focus, and angle, increasing the potential for missed details or inconsistent damage assessment.
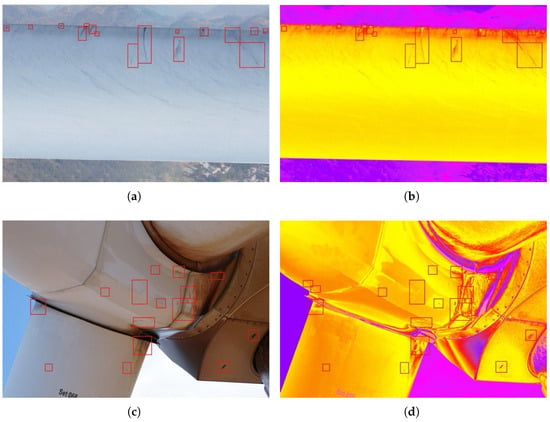
Figure 10.
DyTAM-controlled RGB and RGB–thermal imaging for wind turbine inspection. RGB reveals visible defects like (a) blade erosion and (c) a potential nacelle anomaly. RGB–thermal fusion (b,d), validated in [12], enhances diagnostic capability, offering comprehensive views potentially highlighting thermal irregularities.
In Experiment 2, under windy conditions (13–15 m/s), the advantage of DyTAM’s dynamic adaptation, particularly the wind compensation described by Equation (10), became even more pronounced. During the inspection of a nacelle (Figure 10c), manual control struggled significantly to maintain a stable trajectory and consistent standoff distance against the wind gusts. This resulted in noticeable deviations from the intended path (contributing to the high deviation metrics in Table 1B for manual control) and induced motion blur in some captured images, compromising data quality. Conversely, DyTAM automatically compensated for the wind disturbances by adjusting the UAV’s commanded velocity () in real time based on RTK position feedback and potential onboard wind estimation. The system successfully executed the planned nacelle trajectory (based on (9)), maintaining stability and ensuring focused imaging of the target surfaces (Figure 10c,d).
Overall, the fieldwork demonstrated that DyTAM’s adaptive trajectory control not only reduced inspection time and improved coverage but also critically ensured the acquisition of high-fidelity data essential for accurate damage assessment and predictive maintenance planning.
5. Discussion
The experimental results presented convincingly demonstrate the DyTAM system’s significant advantages for automated UAV-based wind turbine inspection, surpassing manual control and advancing beyond contemporary state-of-the-art methods (Table 2). DyTAM’s core innovation lies in its dynamic trajectory adaptation, which addresses critical limitations inherent in static path planning.
Unlike methods employing fixed trajectories like spirals [26] or grids [32], DyTAM leverages real-time perception. High-resolution imagery, enabled by the DJI Zenmuse H20’s 20MP zoom camera, facilitates accurate segmentation of turbine components (Figure 4). This segmentation informs the real-time calculation of blade pitch angles (Equation (4)), allowing DyTAM to dynamically select and parameterize the most suitable trajectory model (Equations (5)–(7)) for the blade’s current orientation. This adaptability ensures comprehensive coverage ( 96%) even under variable operational conditions, a scenario often challenging for static approaches. Furthermore, the integration of real-time wind compensation (Equation (10)) proved crucial, maintaining high path fidelity (mean deviation 0.78 m) even in turbulent conditions (Experiment 2, Table 1B), a notable improvement over the deviations reported in less adaptive systems [26,32,33,34].
DyTAM’s full automation distinguishes it from manual [32] or semi-automated methods requiring significant pilot input [33,34]. This automation drastically reduces operator workload and the potential for human error, leading to highly consistent and repeatable inspections—essential for reliable defect monitoring and scalability across large wind farms. The resulting path precision (Figure 9) ensures consistent standoff distances and optimal viewing angles. This directly enhances the quality of acquired data, including multi-modal imagery from the RGB and thermal sensors of the Zenmuse H20T (Figure 10), thereby improving the reliability of subsequent defect analysis, leveraging techniques validated in [12]. The three-axis gimbal was vital for maintaining image stability under operational conditions.
Despite its strengths, DyTAM’s performance relies heavily on robust real-time segmentation. Performance could degrade in adverse visual conditions (e.g., low light, fog, glare), potentially impacting trajectory accuracy. Future work should explore enhancing robustness through sensor fusion (e.g., integrating LiDAR data, building on concepts from [33]) and implementing fallback strategies for low-confidence segmentation scenarios. Ensuring precise calibration and alignment between multi-modal sensors, as used for thermal inspection [12], remains crucial.
The computational demands of real-time segmentation, pitch calculation (4), and adaptive control with wind compensation (10) are meaningful. While managed effectively on the DJI Matrice 300 RTK in our tests, future scaling (e.g., multi-UAV operations) will benefit from advances in edge computing and optimized algorithms.
Several open issues warrant further attention. The development of cooperative multi-UAV swarm algorithms based on DyTAM principles could drastically accelerate the inspection of entire wind farms. Integrating real-time anomaly detection directly into the flight control loop—allowing the UAV to autonomously perform closer inspections of suspicious areas—could further optimize inspection time and detail. Finally, extending and validating DyTAM for large offshore turbines, considering challenges like harsh marine environments, platform motion, and extended flight endurance requirements, remains a crucial next step for broader applicability.
Consequently, DyTAM represents a substantial step towards fully autonomous, efficient, and reliable wind turbine inspection. By tightly coupling real-time perception with dynamic motion control, it offers a scalable solution that enhances safety and data quality, contributing positively to the maintenance and sustainability of wind energy infrastructure.
6. Conclusions
This study introduces DyTAM, a novel Dynamic Trajectory Adaptation Method that significantly advances UAV-based wind turbine inspections. By integrating real-time segmentation and blade pitch angle analysis, DyTAM dynamically adjusts UAV flight paths to optimize inspection efficiency and data quality. Our field experiments at a wind farm in Ukraine have rigorously validated DyTAM’s performance, demonstrating substantial improvements over manual control. Specifically, DyTAM achieves a 78% reduction in total inspection time, a 17% decrease in flight path lengths, and a 6% increase in turbine blade coverage.
Moreover, DyTAM dramatically reduces deviations from planned routes by 68%, underscoring its robustness even under challenging wind conditions up to 15 m/s. These quantitative results confirm that DyTAM surpasses existing UAV inspection frameworks in both coverage and flight path adherence. The key innovation lies in the seamless integration of vision-based component classification with fully automated route generation, enabling a level of dynamic adaptation previously unattained in the field. While DyTAM represents a significant leap forward, we acknowledge ongoing challenges related to environmental factors such as extreme lighting and complex turbine geometries, as well as the computational demands of real-time segmentation.
Future research will focus on integrating hyperspectral sensors to further enhance defect detection capabilities and exploring swarm-based UAV architectures for inspecting multiple turbines concurrently.
Author Contributions
Conceptualization, S.S., O.M. and O.S.; methodology, S.S. and O.S.; software, S.S. and O.M.; validation, S.S., L.S., M.P. and P.R.; formal analysis, S.S., O.S. and P.R.; investigation, S.S., O.M. and P.R.; resources, L.S., M.P., P.R. and A.S.; data curation, P.R., M.P. and A.S.; writing—original draft preparation, S.S., O.M. and O.S.; writing—review and editing, L.S., P.R., M.P. and A.S.; visualization, S.S. and P.R.; supervision, O.S. and A.S.; project administration, L.S. and A.S. All authors have read and agreed to the published version of the manuscript.
Funding
This research was funded by the Ministry of Education and Science of Ukraine, state grant registration number 0124U004665, project title “Intelligent System for Recognizing Defects in Green Energy Facilities Using UAVs”. This publication reflects the views of the authors only; the Ministry of Education and Science of Ukraine cannot be held responsible for any use of the information contained herein.
Data Availability Statement
The experimental data used in this study are available from the corresponding author upon reasonable request.
Acknowledgments
The authors are grateful to the Ministry of Education and Science of Ukraine for its support in conducting this study, which is funded by the European Union’s external assistance instrument for the implementation of Ukraine’s commitments under the European Union’s Framework Program for Research and Innovation “Horizon 2020”.
Conflicts of Interest
The authors declare no conflicts of interest.
Abbreviations
| DyTAM | Dynamic Trajectory Adaptation Method |
| LiDAR | Light Detection and Ranging |
| RGB | Red, Green, Blue |
| RTK | Real-Time Kinematic |
| UAV | Unmanned Aerial Vehicle |
| WTC | Wind Turbine Component |
References
- Ghaedi, K.; Gordan, M.; Ismail, Z.; Hashim, H.; Talebkhah, M. A literature review on the development of remote sensing in damage detection of civil structures. J. Eng. Res. Rep. 2021, 20, 39–56. [Google Scholar] [CrossRef]
- Virtanen, E.A.; Lappalainen, J.; Nurmi, M.; Viitasalo, M.; Tikanmäki, M.; Heinonen, J.; Atlaskin, E.; Kallasvuo, M.; Tikkanen, H.; Moilanen, A. Balancing profitability of energy production, societal impacts and biodiversity in offshore wind farm design. Renew. Sustain. Energy Rev. 2022, 158, 112087. [Google Scholar] [CrossRef]
- Chen, W.; Qiu, Y.; Feng, Y.; Li, Y.; Kusiak, A. Diagnosis of wind turbine faults with transfer learning algorithms. Renew. Energy 2021, 163, 2053–2067. [Google Scholar] [CrossRef]
- Li, L.; Xiao, Y.; Zhang, N.; Zhao, W. A fault diagnosis model for wind turbine blade using a deep learning method. In Proceedings of the 2023 8th International Conference on Power and Renewable Energy (ICPRE), Shanghai, China, 22–25 September 2023; pp. 233–237. [Google Scholar] [CrossRef]
- Hussain, M.; Mirjat, N.H.; Shaikh, F.; Dhirani, L.L.; Kumar, L.; Sleiti, A.K. Condition monitoring and fault diagnosis of wind turbine: A systematic literature review. IEEE Access 2024, 12, 190220–190239. [Google Scholar] [CrossRef]
- Roga, S.; Bardhan, S.; Kumar, Y.; Dubey, S.K. Recent technology and challenges of wind energy generation: A review. Sustain. Energy Technol. Assess. 2022, 52, 102239. [Google Scholar] [CrossRef]
- Großwindhager, B.; Rupp, A.; Tappler, M.; Tranninger, M.; Weiser, S.; Aichernig, B.K.; Boano, C.A.; Horn, M.; Kubin, G.; Mangard, S.; et al. Dependable internet of things for networked cars. Int. J. Comput. 2017, 16, 226–237. [Google Scholar] [CrossRef]
- Badihi, H.; Zhang, Y.; Jiang, B.; Pillay, P.; Rakheja, S. A comprehensive review on signal-based and model-based condition monitoring of wind turbines: Fault diagnosis and lifetime prognosis. Proc. IEEE 2022, 110, 754–806. [Google Scholar] [CrossRef]
- Stanescu, D.; Digulescu, A.; Ioana, C.; Candel, I. Early-warning indicators of power cable weaknesses for offshore wind farms. In Proceedings of the OCEANS 2023—MTS/IEEE U.S. Gulf Coast, Biloxi, MS, USA, 25–28 September 2023; pp. 1–6. [Google Scholar] [CrossRef]
- Garg, P.K. Characterisation of fixed-wing versus multirotors UAVs/Drones. J. Geomat. 2022, 16, 152–159. [Google Scholar] [CrossRef]
- Zhang, Z.; Shu, Z. Unmanned aerial vehicle (UAV)-assisted damage detection of wind turbine blades: A review. Energies 2024, 17, 3731. [Google Scholar] [CrossRef]
- Svystun, S.; Melnychenko, O.; Radiuk, P.; Savenko, O.; Sachenko, A.; Lysyi, A. Thermal and RGB Images Work Better Together in Wind Turbine Damage Detection. Int. J. Comput. 2024, 23, 526–535. [Google Scholar] [CrossRef]
- Melnychenko, O.; Savenko, O.; Radiuk, P. Apple detection with occlusions using modified YOLOv5-v1. In Proceedings of the 2023 IEEE 12th International Conference on Intelligent Data Acquisition and Advanced Computing Systems: Technology and Applications (IDAACS), Dortmund, Germany, 7–9 September 2023; pp. 107–112. [Google Scholar] [CrossRef]
- Alzahrani, B.; Oubbati, O.S.; Barnawi, A.; Atiquzzaman, M.; Alghazzawi, D. UAV assistance paradigm: State-of-the-art in applications and challenges. J. Netw. Comput. Appl. 2020, 166, 102706. [Google Scholar] [CrossRef]
- Peng, H.; Li, S.; Shangguan, L.; Fan, Y.; Zhang, H. Analysis of wind turbine equipment failure and intelligent operation and maintenance research. Sustainability 2023, 15, 8333. [Google Scholar] [CrossRef]
- Dubchak, L.; Sachenko, A.; Bodyanskiy, Y.; Wolff, C.; Vasylkiv, N.; Brukhanskyi, R.; Kochan, V. Adaptive neuro-fuzzy system for detection of wind turbine blade defects. Energies 2024, 17, 6456. [Google Scholar] [CrossRef]
- Melnychenko, O.; Scislo, L.; Savenko, O.; Sachenko, A.; Radiuk, P. Intelligent integrated system for fruit detection using multi-UAV imaging and deep learning. Sensors 2024, 24, 1913. [Google Scholar] [CrossRef]
- Helbing, G.; Ritter, M. Improving wind turbine power curve monitoring with standardisation. Renew. Energy 2020, 145, 1040–1048. [Google Scholar] [CrossRef]
- Juneja, K.; Bansal, S. Frame selective and dynamic pattern based model for effective and secure video watermarking. Int. J. Comput. 2019, 18, 207–219. [Google Scholar] [CrossRef]
- Yang, C.; Liu, X.; Zhou, H.; Ke, Y.; See, J. Towards accurate image stitching for drone-based wind turbine blade inspection. Renew. Energy 2023, 203, 267–279. [Google Scholar] [CrossRef]
- Gohar, I.; See, J.; Halimi, A.; Yew, W.K. Automatic defect detection in wind turbine blade images: Model benchmarks and re-annotations. In Proceedings of the 2023 IEEE International Conference on Multimedia and Expo Workshops (ICMEW), Brisbane, Australia, 10–14 July 2023; pp. 290–295. [Google Scholar] [CrossRef]
- ul Husnain, A.; Mokhtar, N.; Mohamed Shah, N.; Dahari, M.; Iwahashi, M. A systematic literature review (SLR) on autonomous path planning of unmanned aerial vehicles. Drones 2023, 7, 118. [Google Scholar] [CrossRef]
- Cetinsaya, B.; Reiners, D.; Cruz-Neira, C. From PID to swarms: A decade of advancements in drone control and path planning—A systematic review (2013–2023). Swarm Evol. Comput. 2024, 89, 101626. [Google Scholar] [CrossRef]
- Zhang, K.; Pakrashi, V.; Murphy, J.; Hao, G. Inspection of floating offshore wind turbines using multi-rotor unmanned aerial vehicles: Literature review and trends. Sensors 2024, 24, 911. [Google Scholar] [CrossRef] [PubMed]
- Memari, M.; Shakya, P.; Shekaramiz, M.; Seibi, A.C.; Masoum, M.A.S. Review on the advancements in wind turbine blade inspection: Integrating drone and deep learning technologies for enhanced defect detection. IEEE Access 2024, 12, 33236–33282. [Google Scholar] [CrossRef]
- Yang, C.; Zhou, H.; Liu, X.; Ke, Y.; Gao, B.; Grzegorzek, M.; Boukhers, Z.; Chen, T.; See, J. BladeView: Toward automatic wind turbine inspection with unmanned aerial vehicle. IEEE Trans. Autom. Sci. Eng. 2024, 22, 7530–7545. [Google Scholar] [CrossRef]
- Pinney, B.; Duncan, S.; Shekaramiz, M.; Masoum, M.A. Drone path planning and object detection via QR codes: A surrogate case study for wind turbine inspection. In Proceedings of the 2022 Intermountain Engineering, Technology and Computing (IETC), Orem, UT, USA, 13–14 May 2022; pp. 1–6. [Google Scholar] [CrossRef]
- Shihavuddin, A.; Rashid, M.R.A.; Maruf, M.H.; Hasan, M.A.; Haq, M.A.U.; Ashique, R.H.; Mansur, A.A. Image based surface damage detection of renewable energy installations using a unified deep learning approach. Energy Rep. 2021, 7, 4566–4576. [Google Scholar] [CrossRef]
- Svystun, S.; Melnychenko, O.; Radiuk, P.; Savenko, O.; Sachenko, A.; Lysyi, A. Dynamic trajectory adaptation for efficient UAV inspections of wind energy units. arXiv 2024. arXiv.2411.17534. [Google Scholar] [CrossRef]
- Grindley, B.; Parnell, K.J.; Cherett, T.; Scanlan, J.; Plant, K.L. Understanding the human factors challenge of handover between levels of automation for uncrewed air systems: A systematic literature review. Transp. Plan. Technol. 2024, 1–26. [Google Scholar] [CrossRef]
- Li, Z.; Wu, J.; Xiong, J.; Liu, B. Research on automatic path planning of wind turbines inspection based on combined UAV. In Proceedings of the 2024 IEEE International Symposium on Broadband Multimedia Systems and Broadcasting (BMSB), Toronto, ON, Canada, 19–21 June 2024; pp. 1–6. [Google Scholar] [CrossRef]
- He, Y.; Hou, T.; Wang, M. A new method for unmanned aerial vehicle path planning in complex environments. Sci. Rep. 2024, 14, 9257. [Google Scholar] [CrossRef]
- Castelar Wembers, C.; Pflughaupt, J.; Moshagen, L.; Kurenkov, M.; Lewejohann, T.; Schildbach, G. LiDAR-based automated UAV inspection of wind turbine rotor blades. J. Field Robot. 2024, 41, 1116–1132. [Google Scholar] [CrossRef]
- Liu, H.; Tsang, Y.P.; Lee, C.K.M.; Wu, C.H. UAV trajectory planning via viewpoint resampling for autonomous remote inspection of industrial facilities. IEEE Trans. Ind. Inform. 2024, 20, 7492–7501. [Google Scholar] [CrossRef]
- facebookresearch/detectron2. Available online: https://github.com/facebookresearch/detectron2 (accessed on 21 August 2024).
- Bradski, G. The OpenCV library. Dr. Dobb’s Journal of Software Tools. 2000. Available online: https://www.drdobbs.com/open-source/the-opencv-library/184404319 (accessed on 31 January 2025).
- Zahorodnia, D.; Pigovsky, Y.; Bykovyy, P. Canny-based method of image contour segmentation. Int. J. Comput. 2016, 15, 200–205. [Google Scholar] [CrossRef]
- DJI. Support for Matrice 300 RTK. 2020. Available online: https://www.dji.com/support/product/matrice-300 (accessed on 31 January 2025).
- Komar, M.; Sachenko, A.; Golovko, V.; Dorosh, V. Compression of network traffic parameters for detecting cyber attacks based on deep learning. In Proceedings of the 2018 IEEE 9th International Conference on Dependable Systems, Services and Technologies (DESSERT), Kyiv, Ukraine, 24–27 May 2018; pp. 43–47. [Google Scholar] [CrossRef]
- Kovtun, V.; Izonin, I.; Gregus, M. Model of functioning of the centralized wireless information ecosystem focused on multimedia streaming. Egypt. Inform. J. 2022, 23, 89–96. [Google Scholar] [CrossRef]
Disclaimer/Publisher’s Note: The statements, opinions and data contained in all publications are solely those of the individual author(s) and contributor(s) and not of MDPI and/or the editor(s). MDPI and/or the editor(s) disclaim responsibility for any injury to people or property resulting from any ideas, methods, instructions or products referred to in the content. |
© 2025 by the authors. Licensee MDPI, Basel, Switzerland. This article is an open access article distributed under the terms and conditions of the Creative Commons Attribution (CC BY) license (https://creativecommons.org/licenses/by/4.0/).

