Article

Hydrocarbon Accumulation Characteristics of the Perdido Fold Belt, Burgos Basin, Gulf of Mexico—A Comparison Between the Central and Eastern Regions

by
Yan Fan
1,
Caifu Xiang
1,*,
Songling Yang
2,
Aishan Li
2,
Liang Chen
2,
Lin’an Pang
2,
Jingtan Chen
2 and
Minghui Yang
1
1
College of Geosciences, China University of Petroleum (Beijing), Beijing 102249, China
2
CNOOC International Company Limited, Beijing 100028, China
*
Author to whom correspondence should be addressed.
Energies 2025, 18(7), 1834; https://doi.org/10.3390/en18071834
Submission received: 13 February 2025 / Revised: 27 March 2025 / Accepted: 2 April 2025 / Published: 4 April 2025
(This article belongs to the Special Issue Petroleum Exploration, Development and Transportation)

Abstract

:
Frequent salt tectonic activities within the Perdido fold belt complicate hydrocarbon accumulation, severely constraining hydrocarbon exploration. In this paper, the characteristics and differences of hydrocarbon accumulation in the Wilcox and Frio Formations in the central and eastern regions of the Perdido fold belt are analyzed through geochemical analysis, hydrocarbon generation simulation, and regional tectonic restoration. The results indicate the following: (1) Hydrocarbon in the Wilcox and Frio Formations in both the central and eastern regions of the Perdido fold belt originates from the Jurassic Tithonian source rocks. (2) Source rocks in the central and eastern regions entered the oil generation threshold in the late Paleocene and reached the oil generation peak in the late Eocene. Compared with the central region, the eastern region reached the gas generation threshold earlier, which is influenced by the activities and differential distribution of salt in the Perdido fold belt. (3) Hydrocarbon accumulation in central and eastern regions is divided into four stages, showing a “terraced single-layer” and “dual-layer” accumulation pattern in the central and eastern regions of the Perdido fold belt, respectively. (4) Central and eastern regions represent discrepancies in the petroleum systems elements of reservoirs, caprocks, traps, generation, charging, and preservation of hydrocarbon.

1. Introduction

The Gulf of Mexico Basin is a renowned salt-bearing basin in the passive continental margin, and its long history of oil exploration and production has attracted widespread attention in industry and academia [1,2,3,4]. According to the statistics of Snedden et al. [4], the cumulative offshore production and the ultimately recoverable resources in the Gulf of Mexico Basin exceed 60 billion barrels of oil equivalent (BOE) and 113 billion BOE, respectively. Up to now, three hydrocarbon-bearing regional fold belts have been found in the deepwater area of the northern Gulf of Mexico, namely, the Perdido, Keathley-Walker, and Mississippi Fan [5]. The study area of this paper is the Perdido fold belt, which has presented significant exploration potential for oil and gas since the successive discoveries of the Great White and Silvertip oil fields [6].
The Perdido fold belt possesses complex geological conditions, with Mesozoic–Cenozoic sedimentary bodies, extensional and contractional faults, and fold belts [5]. The super-thick, widely distributed, and diversified salt rocks in the Perdido fold belt influenced the generation and accumulation of hydrocarbons. Structurally, the Perdido fold belt can be divided into the western, central, and eastern regions. In the western region, the salt tectonics are mainly dominated by salt piercements formed by Jurassic Louann salt. In the central region, large-scale Jurassic Louann salt cores and allochthonous salts are developed. In contrast, salt structures are rarely developed in the eastern region. At present, there are a few works on the accumulation of oil and gas in the Perdido fold belt [7,8]. These previous studies mainly focus on thermal evolution simulation of source rocks, the characteristics and genesis of oil and gas, and hydrocarbon migration.
Salt tectonics influence hydrocarbon generation, migration, and preservation in passive continental-margin basins. In terms of hydrocarbon generation, Davison and Cunha [7] and Liu [9] reckon that the presence and tectonic activities of salt layers affect the heat conduction and convection processes in the formations, thereby influencing the formation temperature and postponing the maturation of the subsalt source rocks. In terms of hydrocarbon migration, the effects of salt tectonics are still controversial. Some scholars believe that the active stepped faults and ductile migration pathways formed by salt tectonics can serve as conduits for oil migration [8,10,11,12]. However, Zhang et al. [12] argue that the listric faults formed by salt tectonics may create barriers and baffles for fluid flow. Additionally, Bian et al. [13] suggest that salt rocks prevent hydrocarbon migration along the strike–slip faults. In terms of hydrocarbon preservation, most works present that the salt structure salt tectonics are beneficial. It is found that salt rocks can preserve pore space in subsalt reservoirs by alleviating their diagenesis [9]. Moreover, Snedden et al. [4] believe that salt rocks, due to their strong fluidity and plasticity, are prone to forming various types of salt-related traps, such as salt core compression anticline traps and salt weld traps. Overall, the characteristics of hydrocarbon accumulation in the Perdido fold belt are not fully understood, and the role of salt tectonics in hydrocarbon accumulation remains unrevealed.
By three-dimensional seismic data, geochemical analysis, and thermal evaluation simulation, the hydrocarbon generation, migration, and accumulation processes in two typical hydrocarbon-bearing strata, i.e., the Wilcox and Frio Formations, in the central and eastern regions of the Perdido fold belt are comparatively analyzed. The results not only reveal the salt-involved hydrocarbon accumulation characteristics and patterns within the Perdido fold belt but also emphasize their spatial discrepancies in the central and eastern regions. The findings of this paper will benefit the identification of favorable exploration areas and reduce the exploration risks in the Perdido fold belt.

2. Geological Background

The Perdido fold belt is located in the Burgos Basin, northern Gulf of Mexico (Figure 1a). The Burgos Basin is a typical passive continental-margin basin with a seawater depth of 1000–3000 m [14]. Based on the characteristics of gravity detachment deformation of salt rocks, the Burgos Basin can be divided into a tensile zone, transitional zone, and compressive zone from west to east (Figure 1b). According to the developmental characteristics of salt tectonics, the Perdido fold belt is divided into three regions, i.e., the western, central, and eastern regions (Figure 1c). Specifically, the western region of the Perdido fold belt is located in the transitional zone of the Burgos Basin, while the central and eastern regions are situated in the compressive zone of the Burgos Basin. In the western region of the Perdido fold belt, mud diapirs and a small number of salt welds are developed; in the central region, large-scale allochthonous salt sheets are developed; and in the eastern region, thrust-related folds are developed, with no allochthonous salt present.
The Perdido fold belt develops a complete source–reservoir–cap system. The Jurassic Tithonian Stage carbonate rocks are important source rocks in the Perdido fold belt (Figure 1d). These source rocks are characterized by high-organic-matter abundance, with the average total organic carbon (TOC) content exceeding 4 wt% and Type II kerogen [8,15]. This indicates that the Perdido fold belt has excellent source rock conditions, providing abundant hydrocarbons for the formation of oil and gas reservoirs. The Upper Paleocene–Lower Eocene Wilcox Formation and the Oligocene Frio Formation are dominating reservoirs in the Perdido fold belt (Figure 1d). The porosity of the Wilcox and Frio Formations ranges from 25 to 30% and 10 to 23%, and the permeability ranges from 50 to 250 mD (1 mD = 1.019 × 10⁻¹⁵ m2) and 3 to 21 mD [5,16]. The regional cap rocks in the Perdido fold belt are marine mudstones from the Eocene to Oligocene and continental mudstones from the Miocene.
The Gulf of Mexico Basin, which came into being during the Mesozoic, has undergone long-term tectonic evolution, forming a stratigraphic system primarily composed of marine carbonate rocks and continental clastic rocks (Figure 1d). In the late Triassic, the Gulf of Mexico Basin entered a rifting stage. During this period, the Gondwana Continent split from the Laurentia Continent, resulting in the northwest–southeast-oriented rifting that formed grabens, half-grabens, and rift valleys [17,18,19]. The sediments deposited during this stage were primarily shale, mudstone, and siltstone [17]. In the middle Jurassic, Earth’s crust cracked, and the ocean expanded in the Gulf of Mexico Basin [20,21], with thick Louann salt deposited during the marine transgression [22].
In the late Jurassic, the Gulf of Mexico Basin entered the period of the passive continental margin, with the Yucatan Block rotating counterclockwise and the forming of oceanic crust [22]. In the early Cretaceous, rifting and ocean expansion came to an end [17,21,23,24]. From the late Jurassic to the early Cretaceous, marine deposits dominated and continental deposits subordinated; the Tithonian Stage carbonate rocks developed during this period [22].
In the late Cretaceous, the Gulf of Mexico Basin entered a passive continental-margin reconstruction stage, in which the shelf at the western margin of the Gulf of Mexico was uplifted, influenced by the Laramide Orogeny, depositing marlstone and shale [25,26,27]. In the Paleocene, the Burgos Basin received abundant siliciclastic sediments supplied by the uplift and erosion of the Laramide Orogenic Belt, and the Lower Wilcox Formation sandstone deposited [28]. In the early Eocene, the Burgos Basin received sediments from the Rio Grande and developed a large-scale basin bottom fan [22]. Late Paleocene to early Eocene, the Upper Wilcox Formation turbidite sandstone formed [5]. In the late Eocene to Oligocene, the terrain was uplifted, and erosion intensified due to the Laramide Orogeny, causing a substantial increase in the sediments carried by the Rio Grande, developing sandstone and turbidites in the Burgos Basin [29,30]. In the Oligocene, the Frio Formation sandstone was deposited. From the Miocene to the present, the original depositional center of the Burgos Basin shifted eastward to the Mississippi River, leading to the weakening of the sedimentation in the Perdido fold belt; clastic deposits dominated [31].
For the Perdido fold belt, more specifically, the stratigraphic framework is also influenced by salt tectonics. In the Eocene to Oligocene, the Louann Salt was transferred to the compression area of the Burgos Basin under the driving of gravity, developing widely distributed allochthonous salt sheets at the central region of the Perdido fold belt, while a thrust-fold belt was formed at the eastern region. As the sedimentation weakens, the allochthonous salt advances slowly toward the extrusion zone. During this period, the double-layer salt tectonics pattern in the Perdido fold belt is gradually established, which is composed of the deep Louann Salt and the shallow allochthonous salt. After the Miocene, the allochthonous salt was covered by terrestrial clastic sediments, ultimately forming the current framework of the Perdido fold belt (Figure 1c).
Figure 1. Geographic location, stratigraphic column, and geological profile of the Perdido fold belt in the Burgos Basin. (a) Locations of the Burgos Basin and the Gulf of Mexico (modified from [32]); (b) Location of the Perdido fold belt and its subdivisions (modified from [33,34]); (c) Typical geological profile of the Perdido fold belt and the Burgos Basin (modified from [35]); (d) Stratigraphic column of the Perdido fold belt (profile AA’) (modified from [16,33]).
Energies 18 01834 g001

3. Data and Methods

In this section, the basic data collected in this work and the geological research methods of basin modeling and back-stripping are introduced briefly.

3.1. Data

As displayed in Table 1, the basic data collected in this paper mainly include three-dimensional seismic data, stratigraphic divisions, and hydrocarbon geochemical data. The locations of related wells are illustrated in Figure 1b. These wells are fairly evenly distributed in central and eastern regions of the Perdido fold belt, which is beneficial to obtain a comprehensive understanding of geochemical characteristics and hydrocarbon accumulation characteristics. Except for partial hydrocarbon geochemical data collected from the published literature [8], the other data are sourced from the Major Scientific and Technology Project of China National Offshore Oil Corporation During the 14th Five-Year Plan Period.
The three-dimensional seismic survey was conducted throughout the whole Perdido fold belt. The stratigraphic divisions and fault interpretation are carried out on Petrel software (version 2021.1) based on the preprocessed three-dimensional seismic data. The grid sizes are 1.9 km × 1.9 km and 76 m × 76 m for the whole Perdido fold belt and salt tectonics, respectively. More elaborate stratigraphic divisions are also identified from the logging data (mainly natural gamma ray, true formation resistivity, and acoustic curves) of typical wells C-2 and M-2, including the depth, lithology, and thickness of strata. The result of the stratigraphic division is in accordance with the seismic interpretation. Moreover, the approximate age and paleo-water-depth of these strata of wells C-2 and M-2 are analyzed for the further conduction of basin modeling.
The geochemistry data contain the laboratory data on source rock, natural gas, and crude oil. Among them, the geochemistry data on Tithonian source rock include the TOC content and pyrolysis hydrocarbon content (S2) from wells H-1 and L-1 (5 sets of data). In addition, the vitrinite reflectance (Ro) from Oligocene to Quaternary in wells C-2 and M-2 are also collected. Geochemistry data on natural gas and crude oil in the Wilcox and Frio Formations from 14 wells are collected. It should be noted that some high-quality published geochemistry data in reference [8] on gas and oil in the Perdido fold belt are adopted in this paper (Table 1). This is due to the available geochemistry data in the study area being relatively scarce, and the supplement of these published data will benefit the comprehensiveness and accuracy of the geochemical insights in the Perdido fold belt. The geochemical data of natural gas include its compositions and characteristics on stable carbon isotopes, while for the crude oil, the American Petroleum Institute (API) gravity and sulfur content are collected.

3.2. Basin Modeling

Basin modeling is a method for the hydrocarbon generation history reconstruction of source rocks. This method predicts oil and gas generation through temperature modeling: the model is calibrated by the vitrinite reflectance and well temperature, and then it simulates the hydrocarbon generation process [36,37,38]. In this paper, the basin modeling on a single well is carried out by the one-dimensional (1D) module of BasinMod software (version 2014). The main analysis processes include data preparation, burial and subsidence history construction, and thermal history simulation. The basic data for basin modeling are mainly stratigraphic divisions, lithology, Ro, stratigraphic age, stratum thickness, denudation thickness of stratum, stratum temperature, thermal conductivity, terrestrial heat flow, and paleo-water-depth. In the first step, the burial and subsidence history are constructed with the input data. Then, by fitting thermal history parameters, the thermal history in a single well can be generated. It should be noted that the simulation results on thermal history should be verified by the comparison between the simulated Ro and measured Ro.
In this paper, one-dimensional temperature modeling was conducted for the stratigraphic sequences from the Upper Jurassic to the present for well C-2 in the central region and well M-2 in the eastern region of the Perdido fold belt. The hydrocarbon generation history of the Tithonian source rocks in the central and eastern regions was then recovered by the calibration of the vitrinite reflectance.

3.3. Back-Stripping

The back-stripping method is a technique for reconstructing paleosurface morphology and sedimentary history. This method involves removing stratigraphic layers from new to old through decompression, fault displacement removal, and layer flattening, thereby restoring the original depositional state of the strata [39,40]. The above processes are carried out by the two-dimensional (2D) module of Move software (version 2010.1). Key parameters include fault properties and initial formation porosity. In this work, the tectonic evolution history of the central and eastern regions of the Perdido fold belt from the early Eocene to the present (typical geological profile of BB’ in Figure 1b) was reconstructed.

4. Results

The geochemistry characteristics of hydrocarbons and source rocks, as well as the results of basin modeling, in the Perdido fold belt are analyzed in this part. Based on these analyses, the origin and generation process of hydrocarbons is preliminarily understood.

4.1. Geochemistry Characteristics of Hydrocarbon

The study of geochemical characteristics of oil and gas is an important means to determine their composition, origin, and thermal evolution stages. In this section, the geochemical characteristics of natural gas and crude oil from the Wilcox and Frio Formations in the Perdido fold belt are analyzed, and the differences in geochemical characteristics between the central and eastern regions are compared.

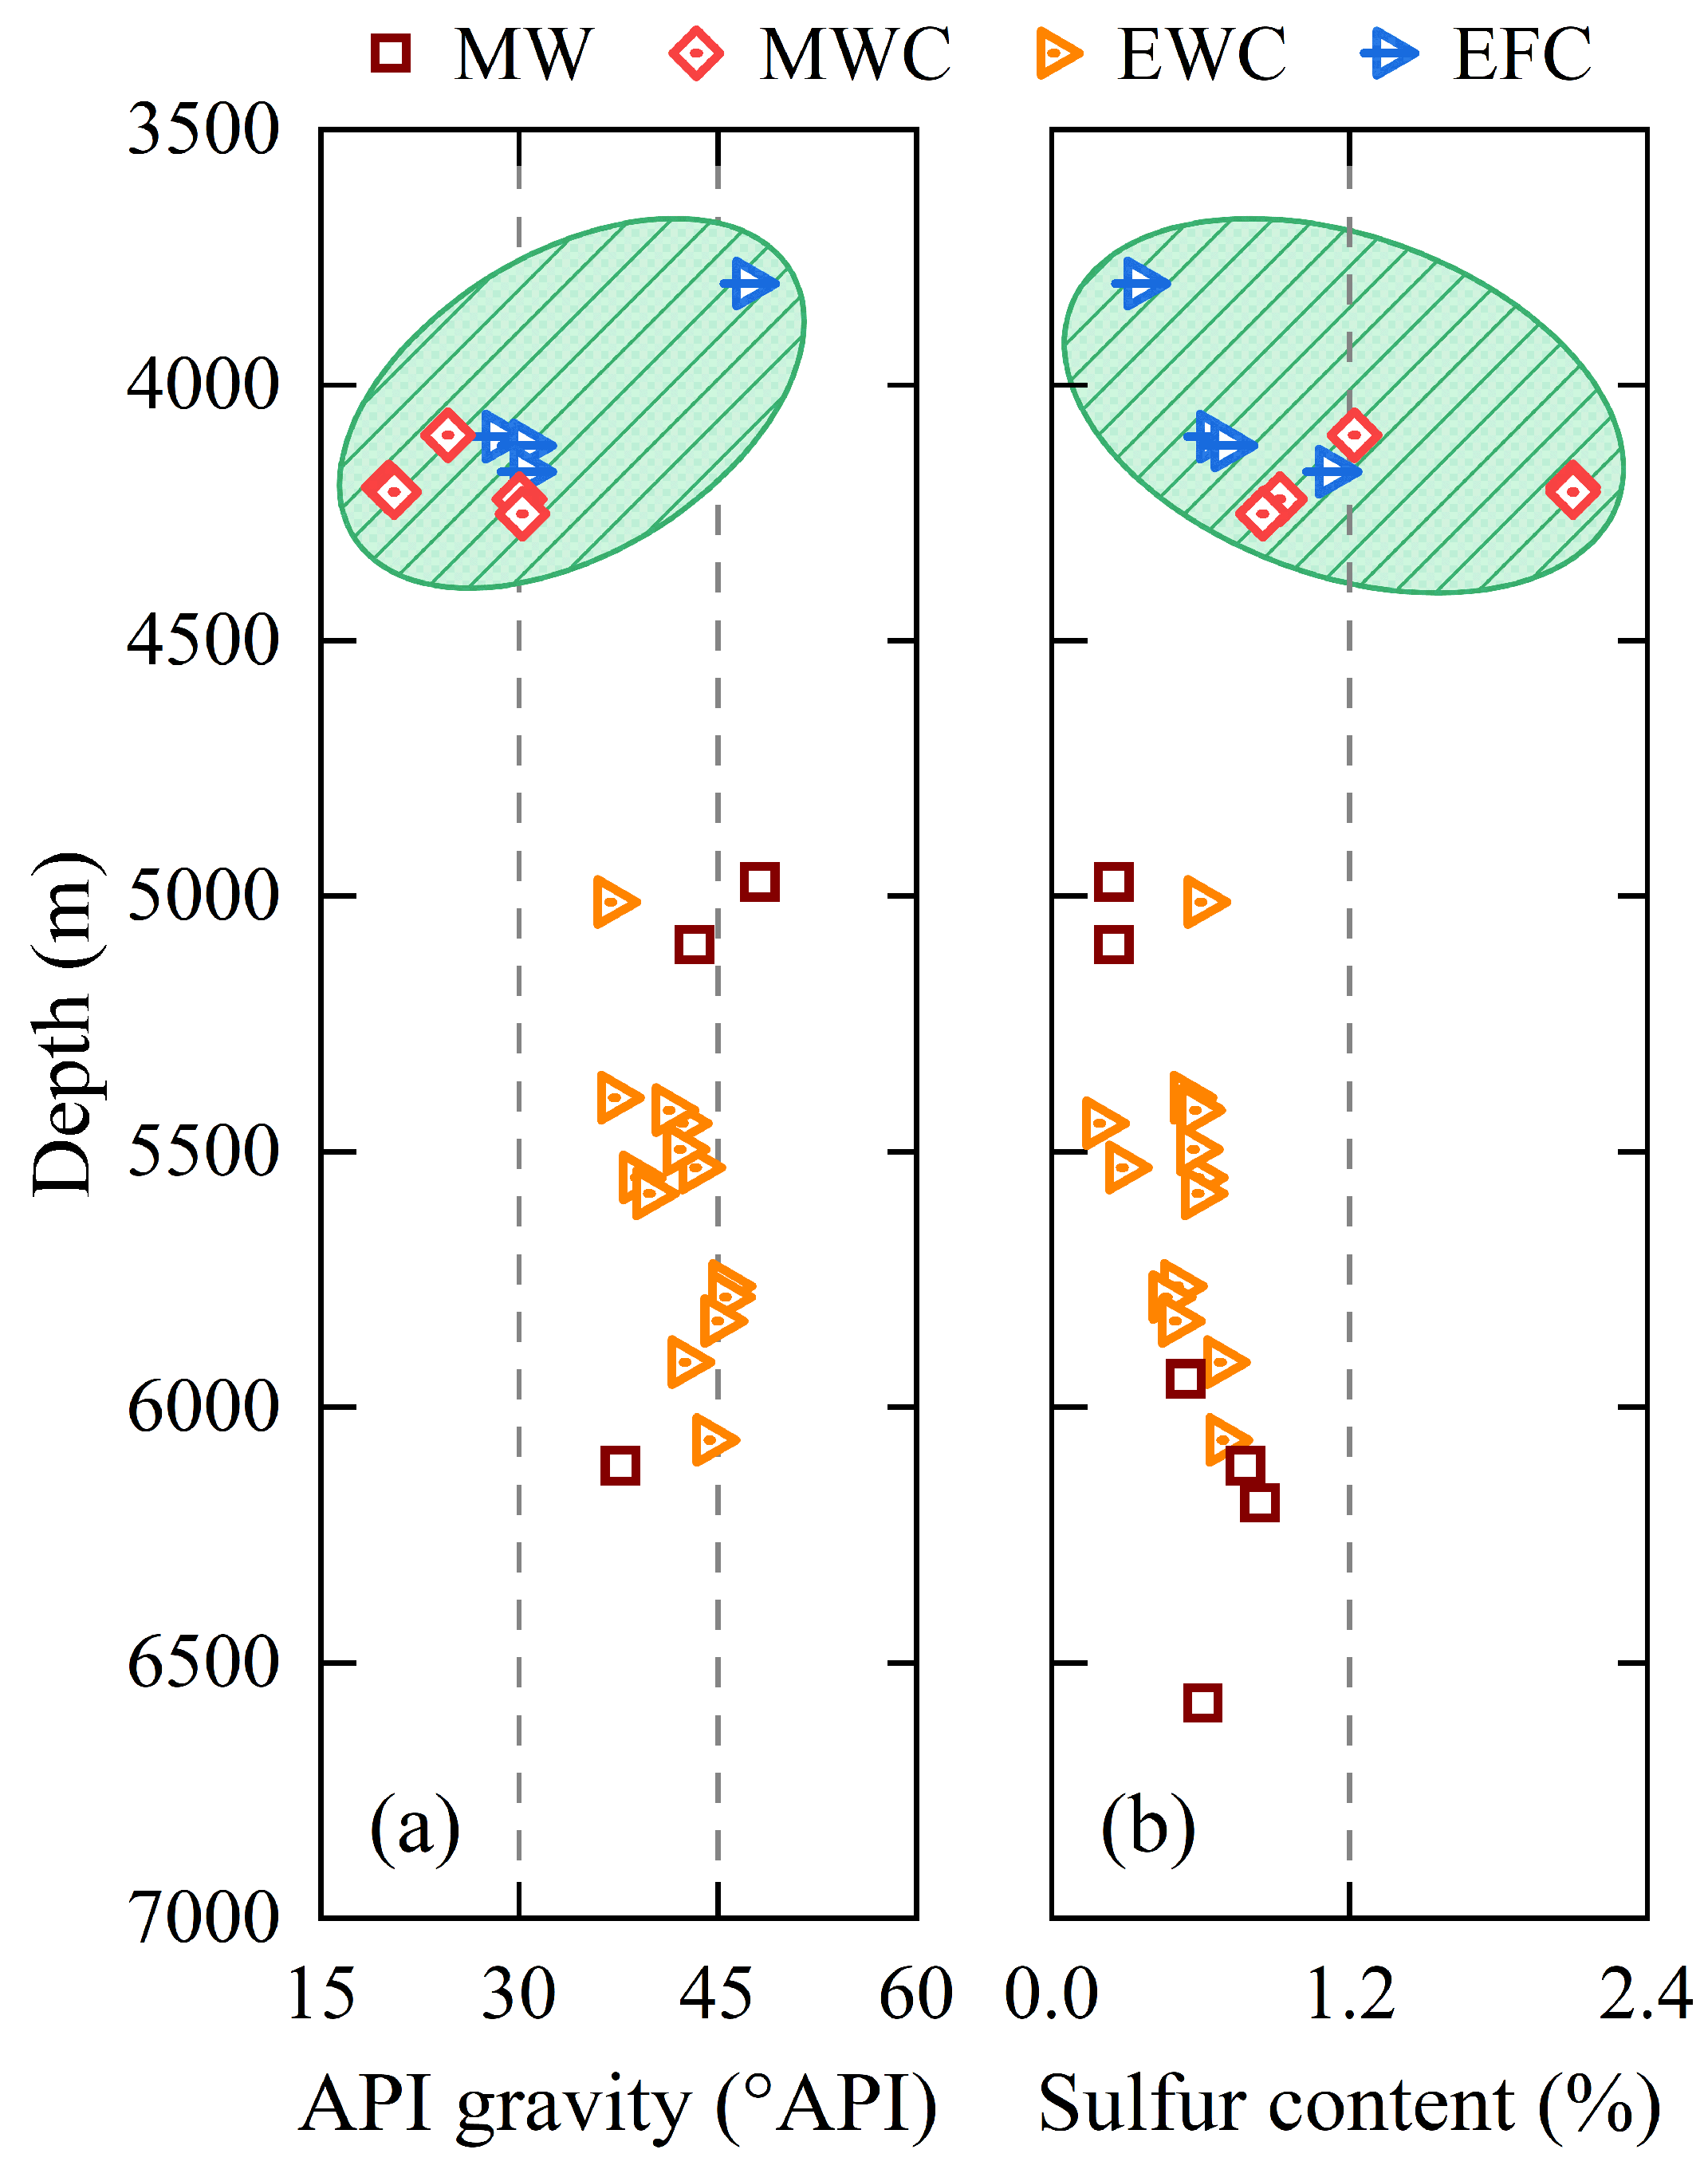
4.1.1. Oil Geochemistry

API gravity and sulfur content are important indicators for evaluating the quality of crude oil. The API gravities of heavy oil, medium oil, and light oil are <22°API, 22°API -38°API, and >38°API, respectively, while the sulfur contents of low-sulfur, sulfur-containing, and high-sulfur crude oils are <0.5%, 0.5–2.0%, and >2.0%, respectively [41]. The API gravity and sulfur content of crude oil in the Perdido fold belt are shown in Figure 2. The API gravity of crude oil in the Wilcox Formation ranges from 20°API to 48°API, with an average of 38°API; the sulfur content ranges from 0.2% to 2.1%, with an average of 0.7%. The API gravity of crude oil in the Frio Formation ranges from 28°API to 47°API, with an average of 34°API; the sulfur content in the Frio Formation ranges from 0.4% to 1.1%, with an average of 0.7%. The crude oil in the Wilcox Formation and Frio Formation of the Perdido fold belt is primarily composed of medium-to-light oil, with low-to-moderate sulfur content, and contains a small amount of heavy oil and high-sulfur crude oil. A previous study has shown that most of the oil in the Perdido fold belt is light and medium oil [8], which is consistent with the results of this study. Overall, high-quality crude oil is mainly enriched in the deeply buried Wilcox Formation in the central and eastern regions, while the crude oil quality is relatively poorer in the shallowly buried Wilcox Formation in the central region and the Frio Formation in the eastern region. The shallowly buried crude oil may undergo biodegradation to some extent, resulting in a decrease in oil quality.
The relative contents of C27, C28, and C29 regular steranes can be used to identify the type of oil-generating kerogen and the maturity of crude oil [42,43,44]. As shown in Figure 3a, the oil-generating kerogens of both the Wilcox and the Frio Formations in the Perdido fold belt are derived from phytoplankton and bacteria, suggesting that they may originate from the same set of source rocks. The maturity of crude oil can be revealed by the sterane isomerization parameters C29ααα20S/(20S + 20R) and C29αββ/(ααα + αββ). As maturity increases, the α configuration of steranes converts to the β configuration, and the biological configuration R converts to the geological configuration S, which is manifested by an increase in C29ααα20S/(20S + 20R) and C29αββ/(ααα + αββ) with increasing maturity [44]. As shown in Figure 3b, the C29ααα20S/(20S + 20R) and C29αββ/(ααα + αββ) values of crude oil in the Wilcox Formation and Frio Formation of the Perdido fold belt are distributed in the ranges of 0.37–0.63 and 0.54–0.72, respectively, indicating that the crude oil has entered the mature thermal evolution stage. In terms of horizontal distribution, the degree of thermal evolution of the Wilcox Formation crude oil in the eastern region is higher than that in the central region.

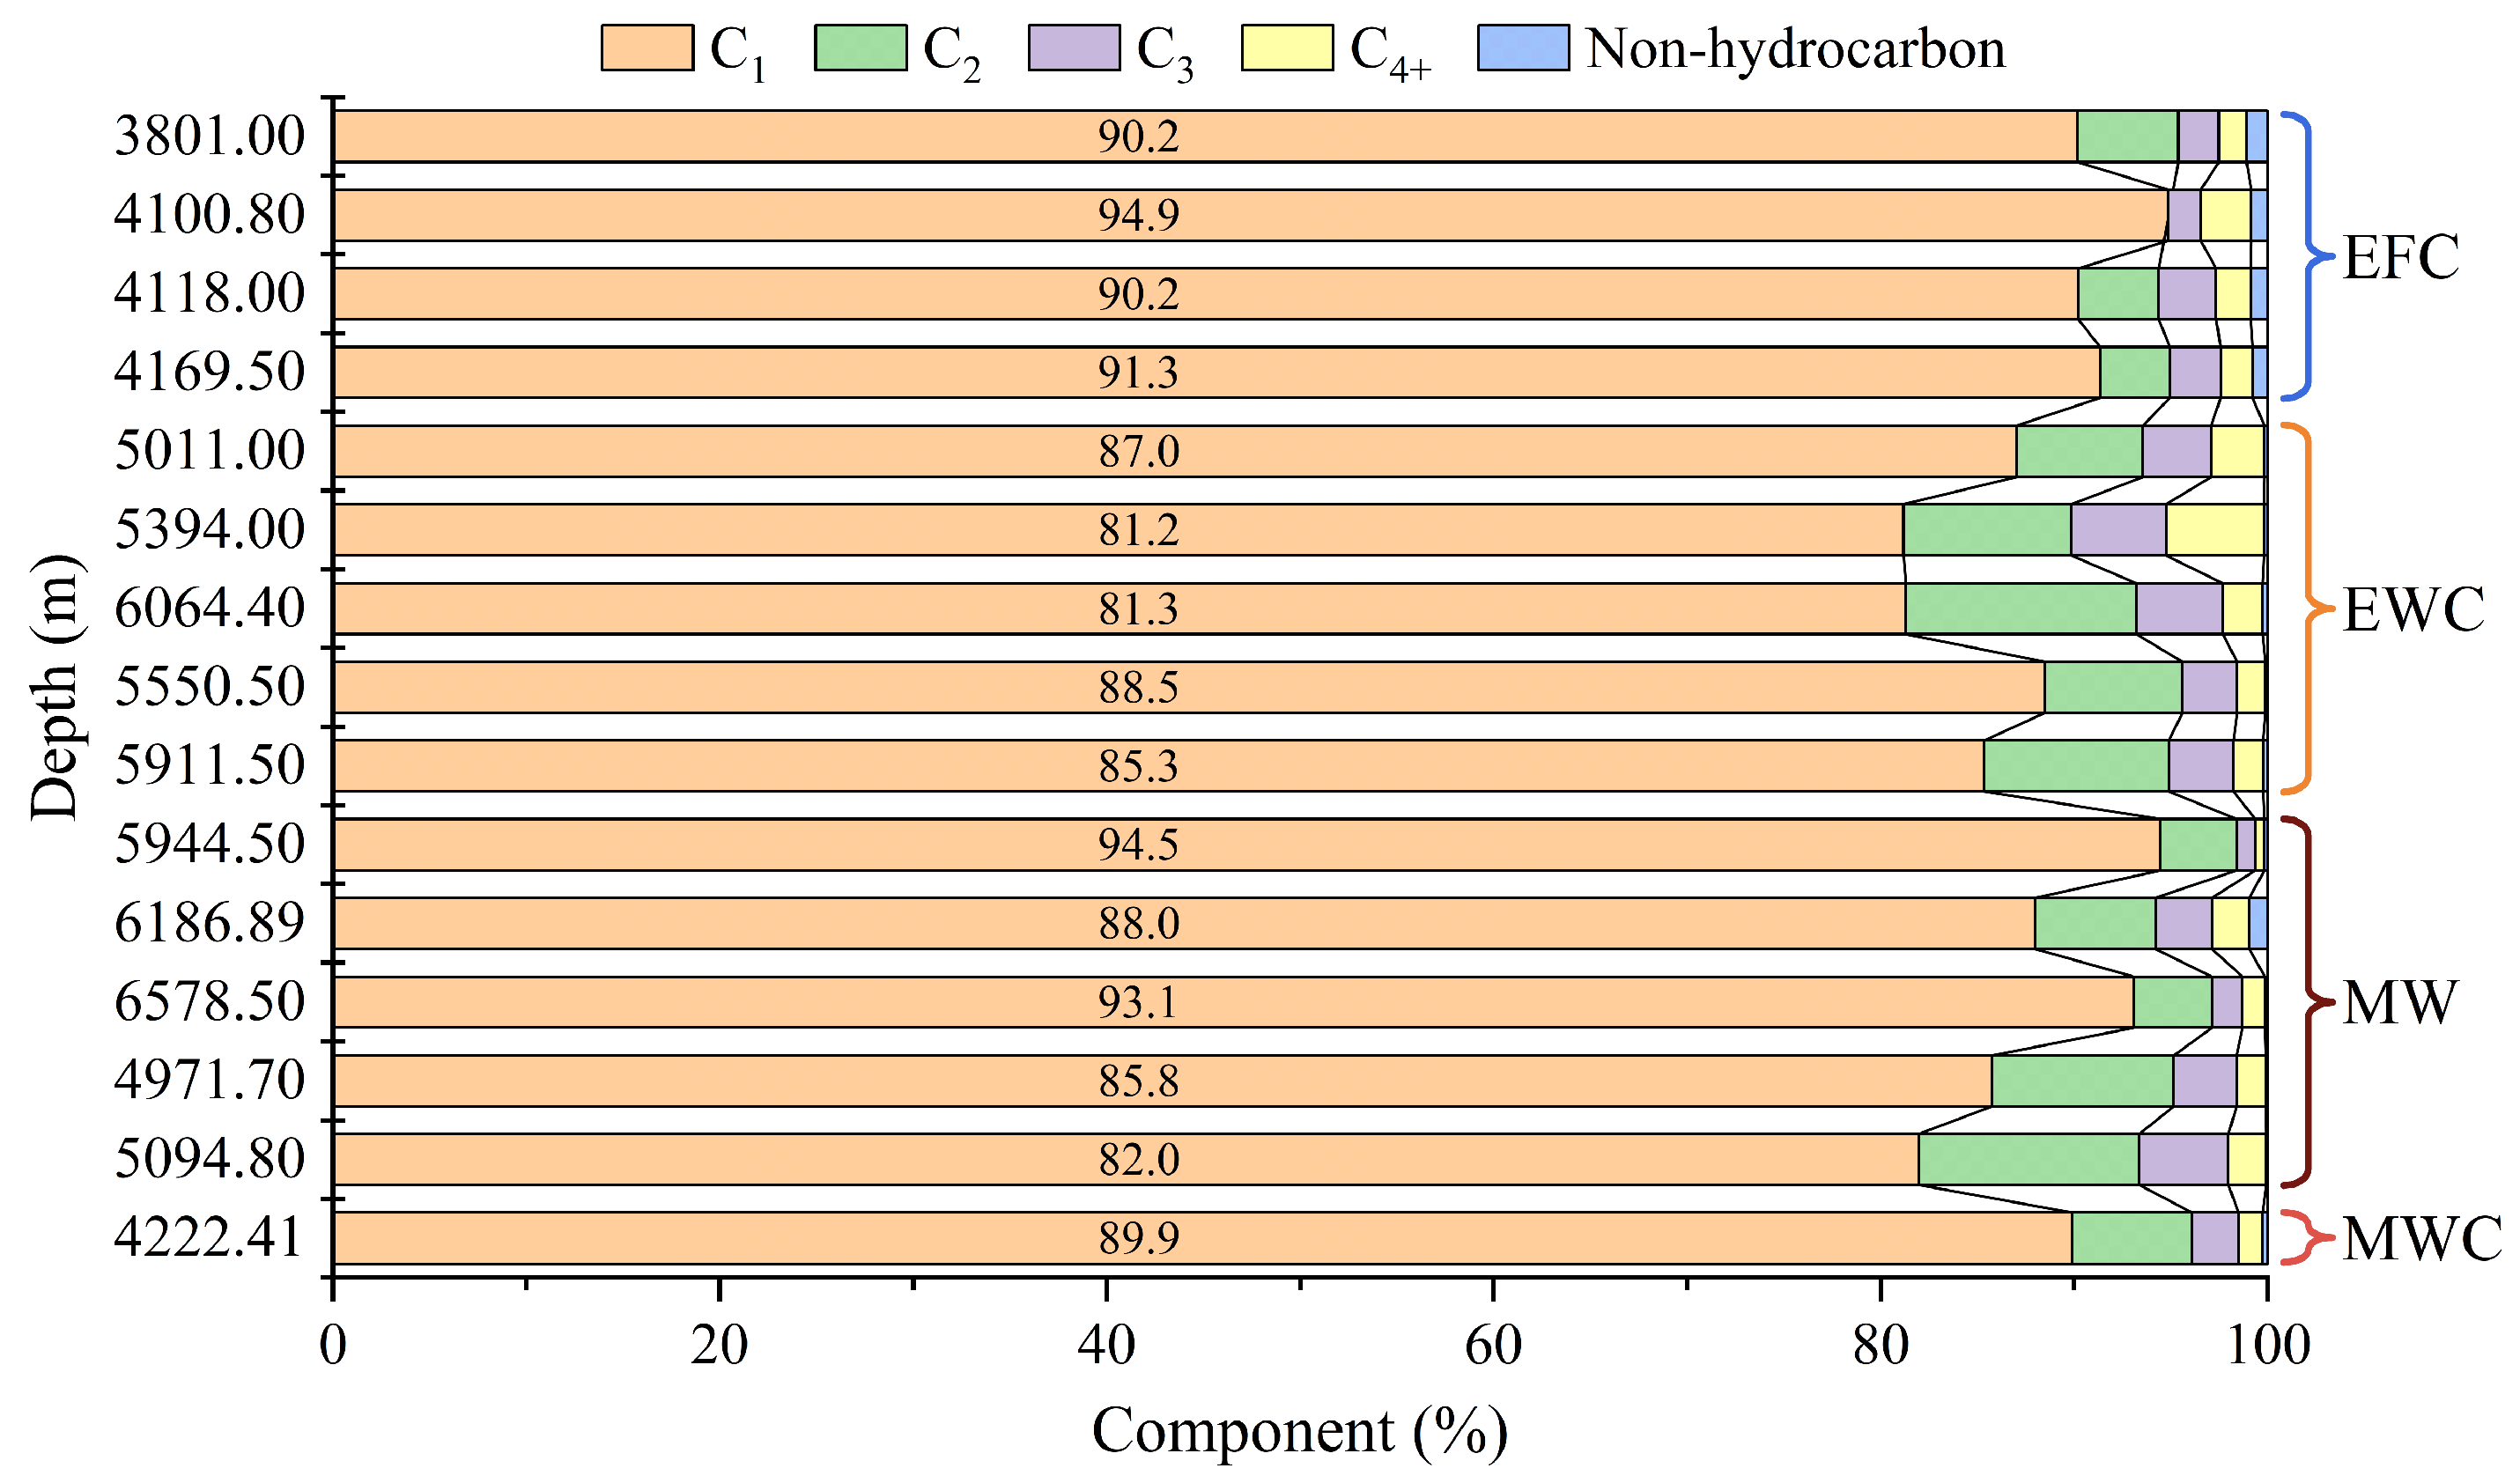
4.1.2. Natural Gas Geochemistry

The natural gas components of the Wilcox Formation and the Frio Formation in the Perdido fold belt are primarily hydrocarbons (with methane content ranging from 81.2% to 94.9%, averaging 88.0%; the average contents of ethane, propane, and butane are 7.0%, 3.0%, and 1.3%, respectively) and contain a small amount of non-hydrocarbon gases (mainly carbon dioxide, with content ranging from 0.08% to 1.09%, averaging 0.38%) (Figure 4). Since the methane content in the natural gas is below 95%, the enriched natural gas in the Wilcox and Frio Formations in the central and eastern regions of the Perdido fold belt is predominantly wet gas. This section not only analyzes the type, origin, and maturity of natural gas in the Perdido fold belt, but also compares the vertical and horizontal changes in these parameters, supplementing and enriching the existing findings of [8].
The origin, type, and maturity of natural gas can be determined by its compositions and carbon isotopes [45,46,47,48]. Specifically, the origin of natural gas can be analyzed based on the relationship between methane, ethane, propane components, and the carbon isotope of methane [49,50]. As shown in Figure 5a, the natural gas in the central and eastern regions of the Perdido fold belt is overall thermally generated, but there may be some differences in the sources of natural gas within the fold belt. In terms of vertical distribution, the natural gas in the Wilcox Formation is derived from the cracking of Type I and Type II kerogen, while the natural gas in the Frio Formation is primarily derived from the cracking of Type II kerogen. In terms of planar distribution, the natural gas in the Wilcox Formation in the central region of the Perdido fold belt tends to originate from the cracking of Type I and Type II kerogen, while the natural gas in the Wilcox and Frio Formations in the eastern region tends to originate from the cracking of Type II kerogen. The type and maturity of natural gas can be determined based on the carbon isotopes of methane, ethane, and propane [51,52,53]. As shown in Figure 5b, the natural gas in the Wilcox Formation is a mixture of oil-type gas, coal-type gas, and a combination of both, while the natural gas in the Frio Formation is composed of oil-type gas and coal-type gas. Regionally, the natural gas in the Wilcox Formation in the central region of the Perdido fold belt is composed of oil-type gas, as well as a mixture of oil-type gas and coal-type gas, while the natural gas in the Wilcox Formation in the eastern region is primarily oil-type gas. As shown in Figure 5b, the natural gas in the Wilcox Formation is in the mature-to-high-mature stage, while the natural gas in the Frio Formation is in the low-mature-to-mature stage. For the Wilcox Formation, the maturity of natural gas in the central region of the fold belt is higher than that in the eastern region.

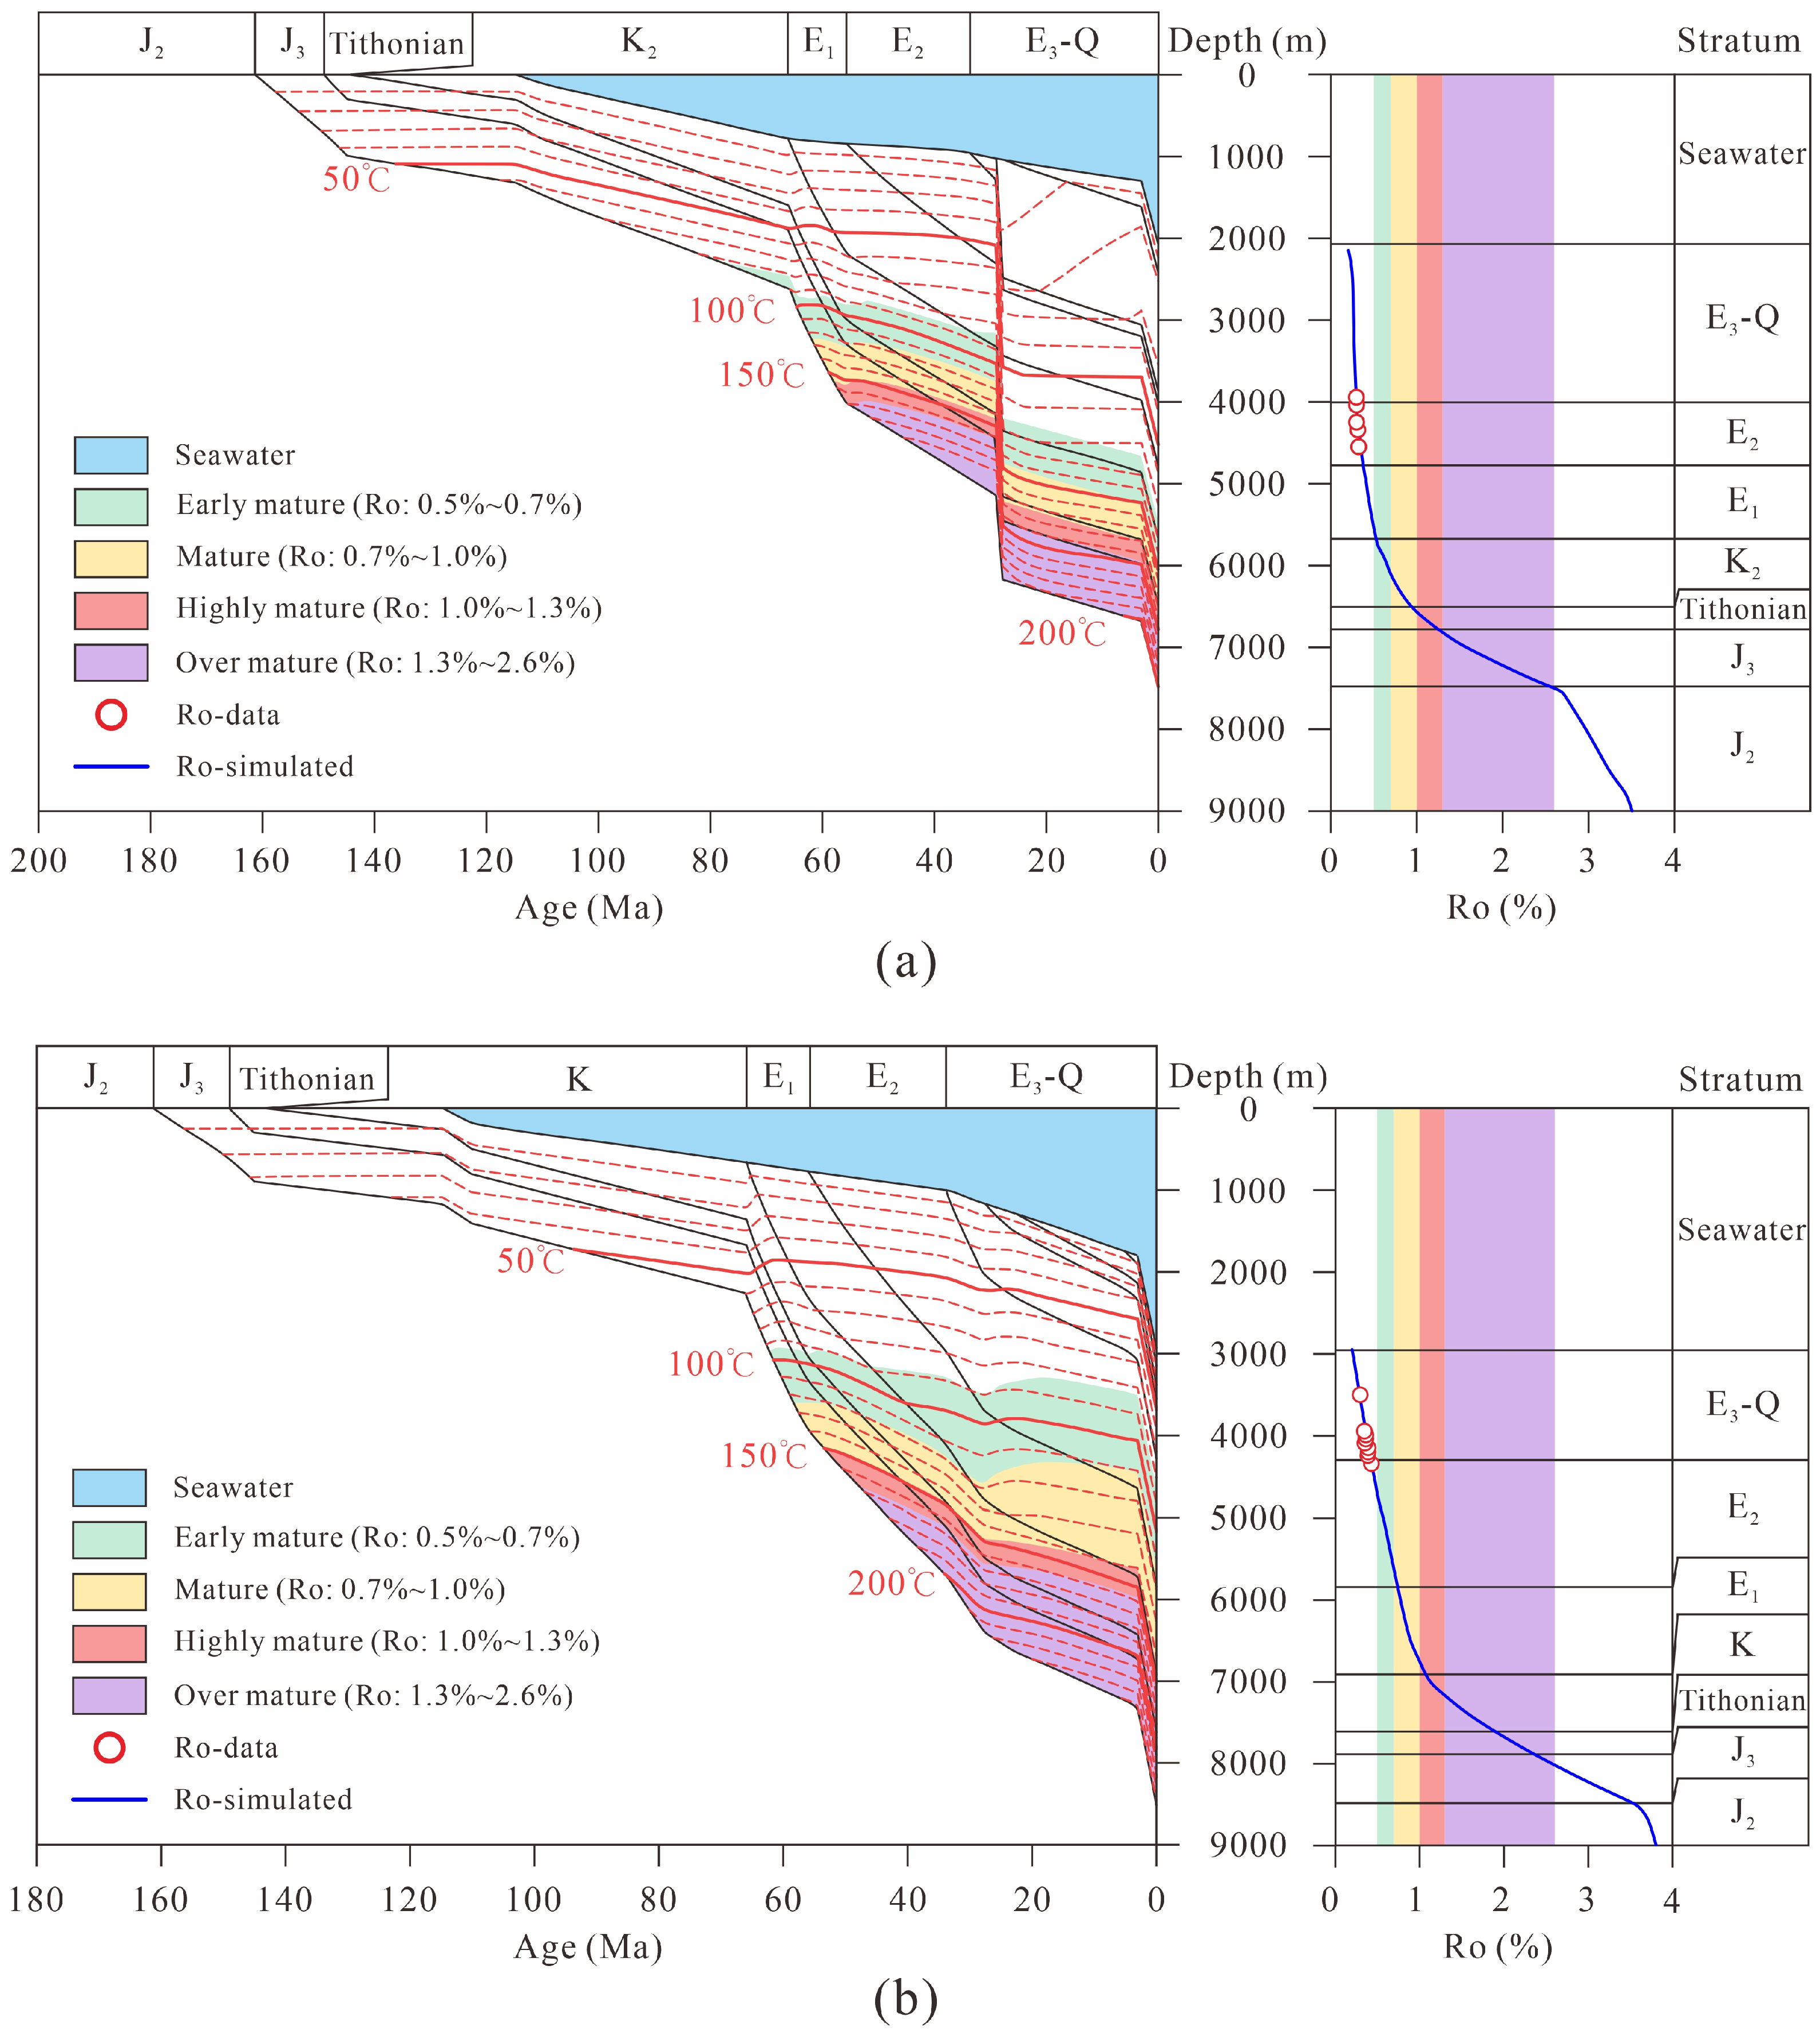
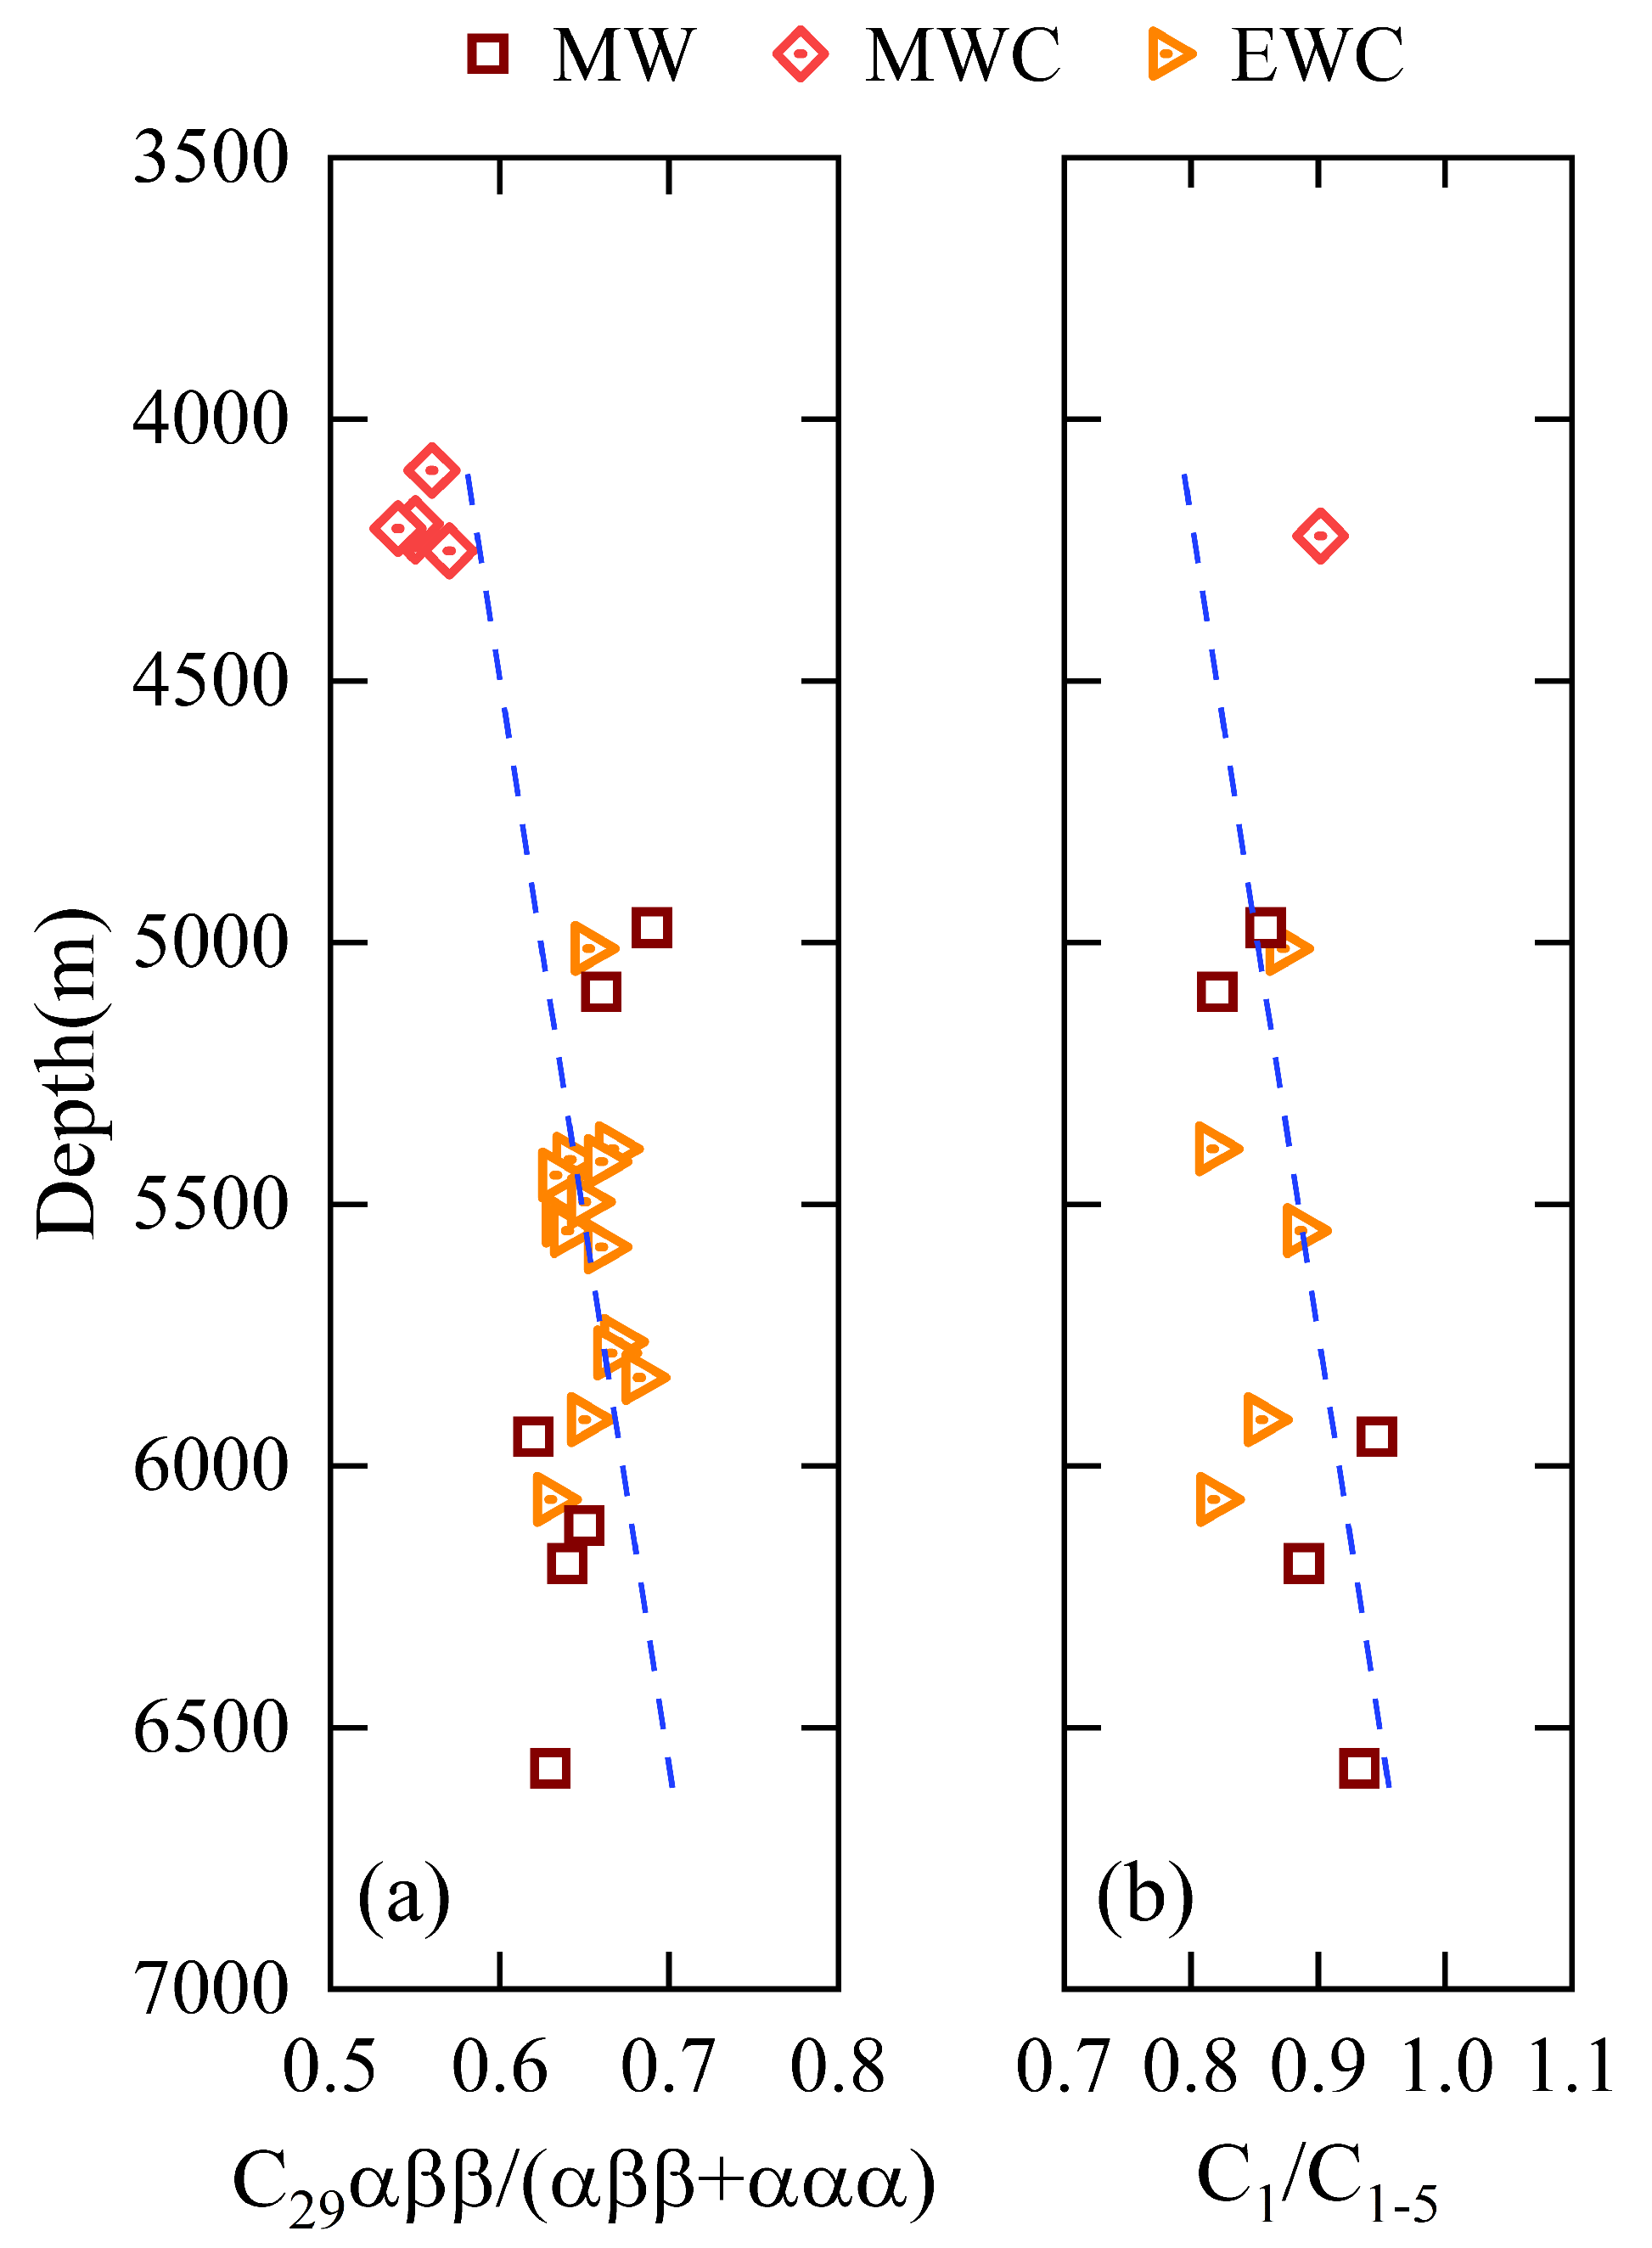
4.2. Origin and Generation of Hydrocarbon

As shown in Figure 6, the kerogen enriched in the carbonate rocks of the Tithonian Stage is Type I and Type II. The Tithonian carbonate rocks have a thickness of 300–500 m, with a TOC content ranging from 0.77 wt% to 6.56 wt%. Due to the deep burial depth and high formation temperature, the Tithonian carbonate rocks have considerable potential for hydrocarbon generation, with pyrolysis hydrocarbons ranging from 3.79 to 48.45 mg HC/g rock. The temperature of maximum pyrolysis yields (Tmax) of the Tithonian source rocks in the Gulf of Mexico Basin ranges from 404 °C to 467 °C, indicating that partial source rocks have entered the high-maturity thermal evolution stage [16]. According to the geochemical characteristics and physical properties of hydrocarbons (Figure 3a, Figure 4, and Figure 5a), the Type I and Type II kerogen are determined to be the hydrocarbon-generating kerogen of the Wilcox Formation and Frio Formation in the Perdido fold belt. Moreover, based on the type of kerogen and its thermal evolution stage, it is inferred that the oil and gas in the Wilcox Formation and Frio Formation of the Perdido fold belt originates from the Tithonian source rocks. This inference is mutually verified with the findings of [5,7].
The reconstruction of burial history and hydrocarbon generation history is an effective means to analyze the periods of stratigraphic subsidence and hydrocarbon generation, expulsion, and migration. The basin modeling results for the Tithonian source rocks at well C-2 in the central region of the Perdido fold belt and well M-2 in the eastern region are shown in Figure 7. The simulated vitrinite reflectances are highly consistent with the measured values, indicating the reliability of the simulation results. In terms of stratigraphic burial history, from the late Jurassic to the present, the strata in the central and eastern regions of the Perdido fold belt have been continuously sinking. From the late Jurassic to the end of the Cretaceous, the stratigraphic subsidence rate was relatively low; however, it increased significantly from the early Paleocene to the early Oligocene. From the late Eocene to the late Oligocene, the Jurassic Louann Salt broke through the surface in the central region of the Perdido fold belt, forming large-scale allochthonous salt sheets, which also led to the rapid subsidence of the overlying strata of the Louann Salt. Under the effect of gravity, the allochthonous salt sheets compressed the strata in the eastern region of the Perdido fold belt, causing the subsidence of the eastern strata to increase slightly. From the Miocene to the late Pliocene, the subsidence rates of the strata in both the central and eastern regions slowed down. Since the Quaternary, the strata in the whole Perdido fold belt have undergone rapid subsidence.
In terms of hydrocarbon generation history, the simulation results indicate that the Tithonian source rocks have considerable hydrocarbon generation potential. As displayed in Figure 7a,b, the Tithonian source rocks at well C-2 in the central region and well M-2 in the eastern region both entered the oil generation stage (Ro: 0.5–1.0%) in the late Paleocene, then reached the oil generation peak (Ro: 1.0–1.3%) in the middle-to-late Eocene. Moreover, the central region entered the gas generation stage (Ro: >1.3%) in the late Oligocene, which was later than that of the eastern region (i.e., the end of the Eocene). Previous study has shown that the compression of salt rock has a cooling effect on the underlying strata and prolongs the maturity period of the subsalt source rocks [7]. This is consistent with the results of this study; in addition, it is believed that the high thermal conductivity of salt rock is the key reason for this phenomenon. When the thickness of the overlying strata above the source rocks is similar, the high thermal conductivity of the thick allochthonous salt in the central region results in a smaller temperature increase, causing the source rocks in the central region to reach the gas generation window later.

5. Discussion

In this section, the hydrocarbon accumulation characteristics in the Perdido fold belt are discussed, mainly in the aspects of transport systems, hydrocarbon migration characteristics, accumulation patterns, and petroleum systems. The contrastive analysis in the above aspects between the central and eastern regions of the Perdido fold belt is conducted.

5.1. Transport Systems of Hydrocarbon

The geological model analysis shows that the oil and gas transport system in the Perdido fold belt mainly includes faults, the Wilcox sandstone, and the Frio sandstone (Figure 8). Generally, faults are the effective “highways” of the source rock–reservoir connection due to their considerable size in length and cross-sectional area. Moreover, considering the good petrophysical properties of the reservoir strata, the Wilcox and Frio Formations can also play the role of oil and gas transport system to a certain extent. Previous research has shown that faults generated by salt rock activity and the Wilcox Formation sandstones constitute the oil and gas migration pathways in the Perdido fold belt [8], which is consistent with the results of this paper. However, previous research did not explore in depth the changes in fault properties during salt rock activity and ignored the role of Frio Formation sandstones as migration pathways for oil and gas.
In the central region, subsalt reverse faults developed at the end of the Eocene. From the plane perspective, these faults mainly strike northeast and are nearly perpendicular to the direction of the seaward flow of allochthonous salt. From the profile perspective, these faults extend upward to the base of the allochthonous salt and cut downward through the Jurassic source rock, with multiple faults with similar dips forming nearly parallel thrust belts. In the middle and late Eocene, with the formation of allochthonous salt, partial subsalt reverse faults reversed, forming the composite oil and gas transport system consisting of reverse faults, negative inversion faults, and the Wilcox sandstone (Figure 8).
In the eastern region, reverse faults also developed. The strikes of these faults are controlled by the lateral compression of salt. Faults close to the thrust of allochthonous salt are mostly upright and have a higher distribution density, while faults far from the salt are mostly shovel-shaped and have a lower distribution density. The faults in the eastern region do not cut through the Jurassic source rock, but cut through the Wilcox sandstone and connect to the Jurassic source rock through a nearly northeastern boundary fault, forming the composite oil and gas transport system consisting of a source-rock-connected reverse fault, the Wilcox sandstone, the thrust-fold faults, and the Frio sandstone (Figure 8).

5.2. Migration Directions of Hydrocarbon

Geochemical tracing of oil and gas is a mature method for determining the direction of hydrocarbons migration. In this paper, the ratio of 4-methyldibenzothiophene to 1-methyldibenzothiophene (4/1-MDBT), the relative content of Ts/(Ts + Tm), and C29αββ/(αββ + ααα) are adopted to analyze the oil migration, while the dryness coefficient (C1/C1–5) is used to analyze the gas migration. Theoretically, these parameters are positive for the maturity of hydrocarbons. Hydrocarbons with higher maturity usually migrate into the reservoir later than those with lower maturity [55]. In other words, the hydrocarbons with higher maturity are usually behind the hydrocarbons with lower maturity during their migration. Therefore, the decreased direction of hydrocarbon maturity in the same reservoir, i.e., the decreased direction in the values of the above parameters, indicates the migration direction of hydrocarbons [56,57,58]. In the previous work [8], the vertical migration of hydrocarbons was analyzed and discussed, but the interregional migration characteristics are still unclear. In this section, the migration directions of crude oil and natural gas in the Wilcox Formation are revealed.
The hydrocarbons in the Perdido fold belt have undergone vertical and lateral migration during their accumulation. Vertically, the source rocks and reservoirs in the study area have a “lower generation and upper storage” configuration, signifying the hydrocarbons migrated vertically to the reservoirs from deeper strata. As displayed in Figure 9, the values of C29αββ/(αββ + ααα) and C1/C1–5 both show a decreasing trend with the decrease in depth of the Wilcox Formation, which also confirms the vertical migration for the hydrocarbons in the Wilcox Formation. In the plane graph of Figure 10, the values of 4/1-MDBT and Ts/(Ts + Tm) show a decreasing trend from SW to NE, indicating that the hydrocarbons in the Wilcox Formation migrated from SW to NE. Moreover, the lateral migration direction of hydrocarbons is in keeping with the extension direction of the strike–slip faults in the study area, further confirming the transport capacity of the faults and reservoir rocks. In the northeast part of the Perdido fold belt, crude oil with relatively higher maturity also developed, which may be related to the multiple charging of hydrocarbons.

5.3. Accumulation Processes and Patterns of Hydrocarbon

The hydrocarbon accumulation models for the central and eastern regions of the Perdido fold belt are constructed based on tectonic evolution restoration. The results indicate that the hydrocarbon accumulation processes between the two regions are different (Figure 11).
The hydrocarbon accumulation process in the central region can be divided into four stages. Stage I: In the late Paleocene, the Tithonian source rocks reached the oil generation threshold, resulting in the generation of a small amount of crude oil. In the early Eocene, the strata were in integrated contact with minimal tectonic relief, and low-angle east-dipping reverse faults developed. The Wilcox Formation dipped slightly to the east (Figure 11a). Stage II: In the middle-to-late Eocene, the autochthonous salt broke through the surface, forming the allochthonous salt. Regional compression led to the formation of the eastward-dipping thrust-fold belt, with anticlinal traps developing in the central region. During this period, the Tithonian source rocks entered the oil generation peak, and crude oil migrated vertically upwards along reverse faults into the Wilcox Formation, forming large-scale anticlinal oil reservoirs (Figure 11b). Stage III: In the late Oligocene, large-scale allochthonous salt sheets formed and pushed the middle–late Eocene mudstone caprock. This process led to the destruction of the regional caprock, the complete destruction of oil reservoirs in the Wilcox Formation, and the formation of widely distributed bitumen. Meanwhile, the allochthonous salt sheets were overlaid on the Wilcox Formation, becoming the new regional caprock. The loss of in situ salt caused the collapse of the overlying strata, creating a local extensional environment. As a result, the early-formed reverse faults were inverted, forming negative inversion faults. During this period, the Tithonian source rocks entered the gas generation threshold. The hydrocarbons first migrated vertically along faults to the Wilcox Formation, and then laterally migrated in the Wilcox Formation, accumulating in anticlinal traps at higher tectonic positions (Figure 11c). Stage IV: from the Miocene to the present, faults beneath the allochthonous salt are mostly sealed under the regional compressive environment, and the sealing height of the traps has increased (Figure 11d).
The hydrocarbon accumulation process in the eastern region can also be divided into four stages. Stage I: late Paleocene to early Eocene, the hydrocarbon accumulation in the eastern region is similar to Stage I in the central region (Figure 11a). Stage II: During the mid-to-late Eocene, regional compressive tectonic activity led to the formation of an eastward-dipping thrust-fold belt in the east. During this period, the Tithonian source rocks entered the oil generation peak, and low-maturity crude oil migrated vertically along faults to the Wilcox Formation to form ancient oil reservoirs (Figure 11b). At the end of the Eocene, the source rocks reached the threshold for gas generation, producing a small amount of natural gas. Stage III: During the late Oligocene, a large amount of natural gas was generated, and the oil and gas migrated upward along middle Jurassic reverse faults to the Wilcox Formation. A significant amount of oil and gas migrated upward through reverse faults to the Frio Formation, and “dome-shaped” dominant gas reservoirs were formed. Meanwhile, the scales of the Wilcox oil and gas reservoirs were reduced. The oil and gas within the Frio Formation further migrated laterally to the west through the fault system, forming “progradational” oil and gas reservoirs (Figure 11c). Stage IV: From the Miocene to the present, the Tithonian source rocks are still in the gas generation stage, and oil and gas continue to migrate along reverse faults towards the Wilcox Formation and further accumulate in the shallow Frio Formation, forming oil and gas reservoirs (Figure 11d).
In summary, the differences in hydrocarbon accumulation between the central and eastern regions of the Perdido fold belt are as follows:
  • Type of oil and gas transport systems. The hydrocarbon migration pathway in the central region consists of reverse faults, negative inversion faults, and Wilcox Formation sandstone, while in the eastern region, it consists of source-rock-connected reverse faults, Wilcox Formation sandstone, thrust-fold faults, and Frio Formation sandstone.
  • Threshold for gas generation of the source rocks. The source rocks in the central region entered the gas generation stage in the late Oligocene, while those in the eastern entered the gas generation window at the end of the Eocene.
  • Hydrocarbon accumulation pattern. In the central region, hydrocarbons first migrate vertically from the source rocks to the Wilcox Formation along faults, then migrate to structurally high positions within the Wilcox Formation to form reservoirs, overall following a “step-like” single-layer accumulation pattern. In the eastern region, hydrocarbons migrate vertically from the source rocks to the Wilcox Formation and then to the Frio Formation along faults, forming “dome-shaped” gas reservoirs in the Wilcox Formation and “progradational” oil and gas reservoirs in the Frio Formation, overall exhibiting a dual-layer accumulation pattern.

5.4. Petroleum Systems

In this section, the petroleum systems in the central and eastern regions of the Perdido fold belt are elaborated, interpreted by the comprehensive review of the reservoir geochemical characteristics, single-well burial history, source rock hydrocarbon generation history, and regional tectonic evolution (Figure 12).
The elements of the petroleum systems in the central and eastern regions of the Perdido fold belt are as follows:
  • Source rocks. The source rocks are marine carbonate rocks of the Jurassic Tithonian Stage, with large thickness, wide distributed area, abundant phytoplankton and bacteria-originated organic matters, Type I and Type II kerogen, and significant hydrocarbon generation potential.
  • Reservoirs. The reservoir in the central region is the Wilcox Formation, while the reservoirs in the eastern region are the Wilcox Formation and the Frio Formation, both of which are marine turbidite sandstones.
  • Caprocks. In the central region of the Perdido fold belt, the caprock was mudstone from the early Paleocene to the late Eocene, which has turned into allochthonous salt since the late Eocene. The caprock in the eastern region is always mudstone since the formation of the reservoirs. These caprocks are thickly and widely deposited in the study area, providing excellent preservation capacity for oil and gas reservoirs.
  • Traps. The traps in the central region are anticline traps with a closing height of approximately 4 km, while in the eastern region, they are thrust-fold traps with a gentler structure and less closing height. Most of these traps were formed in the middle Eocene and finalized in the late Oligocene.
  • Hydrocarbon generation. There are two major hydrocarbon generation periods in the central and eastern regions. Abundant oil was generated in the middle Eocene for the two regions, while the major generation period for natural gas was the late Oligocene and late Eocene in the central and eastern regions, respectively. The amount of oil and gas generated is only a qualitative display, which may be subject to uncertainty and does not represent an absolute quantity.
  • Hydrocarbon charging. There were two stages of hydrocarbon charging events in both the central and eastern regions. The first stage of hydrocarbon charging occurred in the middle Eocene, with large amounts of crude oil charged into the Wilcox Formation. In the second stage, crude oil and gas charged into the Wilcox and Frio Formations, happening in the late Oligocene and late Eocene for the central and eastern regions, respectively.
  • Reservoir preservation. The hydrocarbons in the central region have been protected by regional mudstone since the middle Eocene. But since the late Eocene, regional allochthonous salt rocks have served as caprocks. During the transformation period of the caprock, the reservoirs in the central region were destroyed. For the eastern region, the hydrocarbons have been continuously protected by regional mudstones since the middle Eocene to the present.

6. Conclusions

  • The hydrocarbons in the central and eastern regions of the Perdido fold belt originate from the Tithonian source rocks, while their type and maturity are different. Mature medium–light crude oil is reserved in the Wilcox and Frio Formations, but the oil in the eastern region shows higher maturity. Gas in the central region is generated from type I and type II kerogen and is in the mature–highly mature stage. Gas in the eastern region is mainly cracked from type II kerogen and in the stage of low mature–mature.
  • The Tithonian source rocks entered the oil generation stage in the late Paleogene and reached the oil generation peak in the middle Eocene, but entered the gas generation stage and peak in the late Oligocene and late Eocene, respectively. The natural gas generation in the central region of the Perdido fold belt was postponed since the development of super-thick allochthonous salt.
  • The hydrocarbons mainly migrated from southwest to northeast and from deep buried strata to the shallow formations. Hydrocarbons in the central region first migrated vertically to the Wilcox Formation, and then migrated in the Wilcox Formation, presenting a “terraced single-layer” accumulation pattern. Hydrocarbons in the eastern region first migrated vertically to the Wilcox and Frio Formations, and then made westward-spreading adjustments in the Frio Formation, presenting a “double-layer” accumulation pattern.
  • Differences exist in petroleum system elements between the central and eastern regions. By the systematic analyses and comparisons of the hydrocarbon accumulation in the central and eastern regions, it is believed that the eastern region is the preferable exploration zone.
In guiding the development of oil and gas, cluster horizontal wells and three-dimensional development strategies are recommended to be deployed in the eastern region since the development of the double reservoirs of the Wilcox and Frio Formations and gentle stratigraphic structure, to improve exploitation efficiency and save engineering costs. For the salt-bearing central region, the next research direction includes drilling risks evaluation and anti-sticking technology optimization for the efficient development of oil and gas.

Author Contributions

Methodology, Y.F. and C.X.; investigation, Y.F.; formal analysis, Y.F.; resources, C.X. and S.Y.; writing—original draft preparation, Y.F.; writing—review and editing, Y.F., C.X., L.C., J.C., A.L., M.Y. and S.Y.; supervision, C.X. and M.Y.; project administration, C.X., S.Y., A.L., L.C., L.P. and J.C. All authors have read and agreed to the published version of the manuscript.

Funding

This research was funded by the Major Scientific and Technology Project of China National Offshore Oil Corporation During the 14th Five-Year Plan Period, grant number KJGG2022-0902.

Data Availability Statement

The data presented in this study are available on request from the corresponding author due to privacy.

Acknowledgments

The authors wish to thank the Major Scientific and Technology Project of China National Offshore Oil Corporation During the 14th Five-Year Plan Period (No. KJGG2022-0902), which provided financial and basic data support for this work.

Conflicts of Interest

Authors Songling Yang, Aishan Li, Liang Chen, Lin’an Pang and Jingtan Chen were employed by the company CNOOC International Company Limited. The remaining authors declare that the research was conducted in the absence of any commercial or financial relationships that could be construed as a potential conflict of interest.

Abbreviations

The following abbreviations are used in this manuscript:
APIAmerican Petroleum Institute
BOEBillion barrels of oil equivalent
C1Methane
C1/C1–5Dryness coefficient
C2Ethane
C3Propane
C4+Butane and heavier alkanes
C27C27 n-alkanes
C28C28 n-alkanes
C29C29 n-alkanes
C29ααα20S/(20S + 20R)Sterane isomerization parameter
C29αββ/(ααα + αββ)Sterane isomerization parameter
EFCCited data of the Frio Formation in the eastern region
EWCCited data of the Wilcox Formation in the eastern region
E1Paleocene
E2Eocene
E3Oligocene
HIHydrogen index (HI = S2/TOC)
J2Middle Jurassic
J3Late Jurassic
KCretaceous
K2Late Cretaceous
MWCCited data of the Wilcox Formation in the central region
MWData of the Wilcox Formation in the central region
N1Miocene
N2Pliocene
QQuaternary
RoVitrinite reflectance
S2Pyrolysis hydrocarbon content
T3Upper Triassic
TmaxTemperature of maximum pyrolysis yields
TOCTotal organic carbon
Ts/(Ts + Tm)Relative content of trimethylhopane
4/1-MDBTRatio of 4-methyldibenzothiophene to 1-methyldibenzothiophene
δ13CCarbon isotopes

References

  1. Bugti, M.N.; Mann, P. Regional source rock thermal stress modeling and map-based charge access modeling of the Port Isabel passive margin foldbelt, northwestern Gulf of Mexico. Interpretation 2023, 11, T717–T734. [Google Scholar] [CrossRef]
  2. Cunningham, R.; Snedden, J.W.; Norton, I.O.; Clement Olson, H.; Whiteaker, T.L.; Virdell, J.W. Upper Jurassic Tithonian-centered source mapping in the deepwater northern Gulf of Mexico. Interpretation 2016, 4, SC97–SC123. [Google Scholar] [CrossRef]
  3. Rowan, M.G. Structural architecture and evolution of eastern Mississippi Canyon, northern gulf of Mexico. Mar. Pet. Geol. 2023, 150, 106127. [Google Scholar] [CrossRef]
  4. Snedden, J.W.; Cunningham, R.C.; Virdell, J.W. The northern Gulf of Mexico offshore super basin: Reservoirs, source rocks, seals, traps, and successes. AAPG Bull. 2020, 104, 2603–2642. [Google Scholar] [CrossRef]
  5. Weimer, P.; Bouroullec, R.; Adson, J.; Cossey, S.P.J. An overview of the petroleum systems of the northern deep-water Gulf of Mexico. AAPG Bull. 2017, 101, 941–993. [Google Scholar] [CrossRef]
  6. Eikrem, V.; Li, R.; Medeiros, M.; McKee, B.J.; Boswell, B.L.; Shumilak, E.E.; Mohan, R. SS: Perdido Development Project: Great White WM12 Reservoir and Silvertip M. Frio Field Development Plans and Comparison of Recent Well Results with Pre-Drill Models. In Proceedings of the Offshore Technology Conference, Houston, TX, USA, 3–7 May 2010. [Google Scholar] [CrossRef]
  7. Davison, I.; Cunha, T.A. Allochthonous salt sheet growth: Thermal implications for source rock maturation in the deepwater Burgos Basin and Perdido Fold Belt, Mexico. Interpretation 2016, 5, T11–T21. [Google Scholar] [CrossRef]
  8. Wang, C.; Zeng, J.; Yu, Y.; Cai, W.; Li, D.; Yang, G.; Liu, Y.; Wang, Z. Origin, migration, and characterization of petroleum in the Perdido Fold Belt, Gulf of Mexico basin. J. Pet. Sci. Eng. 2020, 195, 107843. [Google Scholar] [CrossRef]
  9. Liu, Y.-M. Salt Evolution Mechanism and Hydrocarbon Accumulation in Santos Basin, Brazil. In Proceedings of the International Field Exploration and Development Conference 2021, Singapore, 8 September 2022; pp. 3527–3535. [Google Scholar] [CrossRef]
  10. Cai, J.; He, Y.; Liang, J.; Qiu, C.; Zhang, C. Differential deformation of gravity-driven deep-water fold-and-thrust belts along the passive continental margin of East Africa and their impact on petroleum migration and accumulation. Mar. Pet. Geol. 2020, 112, 104053. [Google Scholar] [CrossRef]
  11. Elfassi, Y.; Gvirtzman, Z.; Katz, O.; Aharonov, E. Chronology of post-Messinian faulting along the Levant continental margin and its implications for salt tectonics. Mar. Pet. Geol. 2019, 109, 574–588. [Google Scholar] [CrossRef]
  12. Zhang, Q.; Alves, T.M.; Martins-Ferreira, M.A.C. Fault analysis of a salt minibasin offshore Espirito Santo, SE Brazil: Implications for fluid flow, carbon and energy storage in regions dominated by salt tectonics. Mar. Pet. Geol. 2022, 143, 105805. [Google Scholar] [CrossRef]
  13. Bian, Q.; Deng, S.; Lin, H.; Han, J. Strike-Slip salt tectonics in the Shuntuoguole Low Uplift, Tarim Basin, and the significance to petroleum exploration. Mar. Pet. Geol. 2022, 139, 105600. [Google Scholar] [CrossRef]
  14. Zhu, Y.; Li, A.; Chen, L.; Lin, P. Distribution characteristics of deep/shallow bi-layered salt and the North-South differentialstructural deformation in the Perdido structural belt of Burgos basin, Mexico. China Offshore Oil Gas 2021, 33, 62–70. [Google Scholar] [CrossRef]
  15. Santamaria, D. Organic Geochemistry of Tithonian Source Rocks and Associated Oils from the Sonda de Campeche. Bachelor’s Thesis, RWTH Aachen University, Aachen, Germany, 2000. [Google Scholar]
  16. Li, A.; Cai, W.; Lu, J.; Yan, J.; Zhang, L.; Zhao, C. Analysis on petroleum conditions and exploration potential in Burgos Basin, north of Mexico. Mar. Geol. Front. 2020, 38, 77–85. [Google Scholar] [CrossRef]
  17. Salvador, A. Late Triassic-Jurassic Paleogeography and Origin of Gulf of Mexico Basin1. AAPG Bull. 1987, 71, 419–451. [Google Scholar] [CrossRef]
  18. Duffy, O.B.; Fernandez, N.; Peel, F.J.; Hudec, M.R.; Dooley, T.P.; Jackson, C.A.-L. Obstructed minibasins on a salt-detached slope: An example from above the Sigsbee canopy, northern Gulf of Mexico. Basin Res. 2020, 32, 505–524. [Google Scholar] [CrossRef]
  19. Eddy, D.R.; Van Avendonk, H.J.A.; Christeson, G.L.; Norton, I.O.; Karner, G.D.; Johnson, C.A.; Snedden, J.W. Deep crustal structure of the northeastern Gulf of Mexico: Implications for rift evolution and seafloor spreading. J. Geophys. Res. Solid Earth 2014, 119, 6802–6822. [Google Scholar] [CrossRef]
  20. Pindell, J.; Dewey, J. Permo-Triassic Reconstruction of Western Pangea and the Evolution of the Gulf of Mexico/caribbean Region. Tectonics 1982, 1, 179–211. [Google Scholar] [CrossRef]
  21. Marton, G.; Buffler, R.T. Jurassic Reconstruction of the Gulf of Mexico Basin. Int. Geol. Rev. 1994, 36, 545–586. [Google Scholar] [CrossRef]
  22. Worrall, D.M.; Snelson, S.; Bally, A.W.; Palmer, A.R. Evolution of the northern Gulf of Mexico, with emphasis on Cenozoic growth faulting and the role of salt. In The Geology of North America—An Overview; Geological Society of America: Boulder, CO, USA, 1989; Volume A. [Google Scholar] [CrossRef]
  23. Pindell, J.L.; Kennan, L. Tectonic evolution of the Gulf of Mexico, Caribbean and northern South America in the mantle reference frame: An update. In The Origin and Evolution of the Caribbean Plate; James, K.H., Lorente, M.A., Pindell, J.L., Eds.; Geological Society of London: London, UK, 2009; Volume 328. [Google Scholar] [CrossRef]
  24. Nguyen, L.C.; Mann, P. Gravity and magnetic constraints on the Jurassic opening of the oceanic Gulf of Mexico and the location and tectonic history of the Western Main transform fault along the eastern continental margin of Mexico. Interpretation 2016, 4, SC23–SC33. [Google Scholar] [CrossRef]
  25. Feng, J.; Buffler, R.T.; Kominz, M.A. Laramide orogenic influence on late Mesozoic-Cenozoic subsidence history, western deep Gulf of Mexico basin. Geology 1994, 22, 359–362. [Google Scholar] [CrossRef]
  26. Gray, G.; Pottorf, R.J.; Yurewicz, D.A.; Mahon, K.; Pevear, D.R.; Chuchla, R. Thermal and chronological record of syn- to post-Laramide burial and exhumation, Sierra Madre Oriental, Mexico. AAPG Mem. 2001, 75, 159–181. [Google Scholar] [CrossRef]
  27. Hudec, M.R.; Dooley, T.P.; Peel, F.J.; Soto, J.I. Controls on the evolution of passive-margin salt basins: Structure and evolution of the Salina del Bravo region, northeastern Mexico. GSA Bull. 2019, 132, 997–1012. [Google Scholar] [CrossRef]
  28. Snedden, J.W.; Tinker, L.D.; Virdell, J. Southern Gulf of Mexico Wilcox source to sink: Investigating and predicting Paleogene Wilcox reservoirs in eastern Mexico deep-water areas. AAPG Bull. 2018, 102, 2045–2074. [Google Scholar] [CrossRef]
  29. Winker, C.D.; Center, M.H.M. Cenozoic Shelf Margins, Northwestern Gulf of Mexico Basin. In Recognition of Shallow-Water Versus Deep-Water Sedimentary Facies in Growth-Structure Affected Formations of the Gulf Coast Basin; SEPM Society for Sedimentary Geology: Tulsa, OK, USA, 1981; Volume 2. [Google Scholar] [CrossRef]
  30. Galloway, W.E. Genetic Stratigraphic Sequences in Basin Analysis II: Application to Northwest Gulf of Mexico Cenozoic Basin1. AAPG Bull. 1989, 73, 143–154. [Google Scholar] [CrossRef]
  31. Waller, T.D. Structural Analysis of the Perdido Fold Belt: Timing, Evolution, and Structural Style. Master’s Thesis, Texas A&M University, College Station, TX, USA, 2007. [Google Scholar]
  32. Vazquez-Garcia, O. Tectonic Synthesis of the Deepwater Lamprea Thrust and Fold Belt, Offshore Burgos Basin, Western Gulf of Mexico. Master’s Thesis, Colorado School of Mines, Golden, CO, USA, 2018. [Google Scholar]
  33. Liang, J.; Huang, X.; Cai, W.; Wang, Y.; Chen, L.; Zhang, Y. Source-to sink system and exploration prospects of the Wilcox Formation in Perdido fold belt, Burgos Basin, Mexico. Acta Pet. Sin. 2019, 40, 1439–1450. [Google Scholar] [CrossRef]
  34. Yang, F.; Hu, W.; Cai, W.; Chen, Z. Characteristics and their forming mechanisms of the salt-mud diapiric structure in Perdido Structure Belt of Burgos Basin. Pet. Geol. Oilfield Dev. Daqing 2020, 39, 31–38. [Google Scholar] [CrossRef]
  35. Kong, G.; Li, A.; Zhu, Y.; Zhang, L.; Zhao, C.; Ding, P. Application of interpretation technology of salt-related trap in deepwater compression area offshore Burgos Basin, Mexico. Mar. Geol. Front. 2022, 38, 77–85. [Google Scholar] [CrossRef]
  36. Tang, Y.; Xue, K.; Gao, X.; Song, Y.; Li, H.; Wang, Y. Origin, maturity and geochemistry of natural gas in the Yancheng Sag, Subei Basin, China: Insights from pyrolysis experiments and basin modeling. J. Asian Earth Sci. 2025, 285, 106558. [Google Scholar] [CrossRef]
  37. Osman, M.; Farouk, S.; Salem, T.; Sarhan, M.A. Hydrocarbon generation potential of South Geisum Oilfield, Gulf of Suez, Egypt: Source rock evaluation and basin modeling for unconventional hydrocarbon prospects. Pet. Res. 2024, in press. [CrossRef]
  38. Du, S.; Hu, T. Mechanisms of hydrocarbon generation from organic matters: Theories, experiments and simulations. Adv. Geo-Energy Res. 2024, 12, 156–160. [Google Scholar] [CrossRef]
  39. Bishop, D.J.; Buchanan, P.G.; Bishop, C.J. Gravity-driven thin-skinned extension above Zechstein Group evaporites in the western central North Sea: An application of computer-aided section restoration techniques. Mar. Pet. Geol. 1995, 12, 115–135. [Google Scholar] [CrossRef]
  40. Peng, G.; Wu, Z.; Dai, Y.; Zhang, L.; Yu, S.; Wang, W.; Pang, H. Quantitative evaluation and models of hydrocarbon accumulation controlled by faults in the Pearl River Mouth Basin. Adv. Geo-Energy Res. 2023, 8, 89–99. [Google Scholar] [CrossRef]
  41. Demirbas, A.; Alidrisi, H.; Balubaid, M.A. API Gravity, Sulfur Content, and Desulfurization of Crude Oil. Pet. Sci. Technol. 2015, 33, 93–101. [Google Scholar] [CrossRef]
  42. Huang, W.-Y.; Meinschein, W.G. Sterols as ecological indicators. Geochim. Cosmochim. Acta 1979, 43, 739–745. [Google Scholar] [CrossRef]
  43. George, S.C.; Krieger, F.W.; Eadington, P.J.; Quezada, R.A.; Greenwood, P.F.; Eisenberg, L.I.; Hamilton, P.J.; Wilson, M.A. Geochemical comparison of oil-bearing fluid inclusions and produced oil from the Toro sandstone, Papua New Guinea. Org. Geochem. 1997, 26, 155–173. [Google Scholar] [CrossRef]
  44. Peters, K.E. Biomarkers and Isotopes in Petroleum Systems and Earth History; Cambridge University Press: Cambridge, UK, 2005. [Google Scholar]
  45. Galimov, E.M. Isotope organic geochemistry. Org. Geochem. 2006, 37, 1200–1262. [Google Scholar] [CrossRef]
  46. Quan, Y.; Liu, J.; Hao, F.; Bao, X.; Xu, S.; Teng, C.; Wang, Z. Geochemical characteristics and origins of natural gas in the Zhu III sub-basin, Pearl River Mouth Basin, China. Mar. Pet. Geol. 2019, 101, 117–131. [Google Scholar] [CrossRef]
  47. Clayton, C. Carbon isotope fractionation during natural gas generation from kerogen. Mar. Pet. Geol. 1991, 8, 232–240. [Google Scholar] [CrossRef]
  48. Stahl, W. Carbon isotope fractionations in natural gases. Nature 1974, 251, 134–135. [Google Scholar] [CrossRef]
  49. Whiticar, M. J. Carbon and hydrogen isotope systematics of bacterial formation and oxidation of methane. Chem. Geol. 1999, 161, 291–314. [Google Scholar] [CrossRef]
  50. Liu, C.; Chen, S.; Zhao, J.; Su, Z.; Chen, G.; Liu, X.; Gao, Q. Geochemical tracer of hydrocarbon migration path of Middle Cenozoic in the south slope of the Kuqa foreland basin. Acta Geol. Sin. 2020, 94, 3488–3502. [Google Scholar] [CrossRef]
  51. Zhao, J.; Zhang, W.; Li, J.; Cao, Q.; Fan, Y. Genesis of tight sand gas in the Ordos Basin, China. Org. Geochem. 2014, 74, 76–84. [Google Scholar] [CrossRef]
  52. Jinxing, D.; Shengfei, Q.; Shizhen, T.; GuangYou, Z.; Kuimi, J. Developing trends of natural gas industry and the significant progress on natural gas geological theorirs in China. Nat. Gas Geosci. 2005, 16, 127–142. [Google Scholar]
  53. Dai, J. Identification of different hydrocarbon gas. Sci. China Ser. B Chem. 1992, 2, 185–193. [Google Scholar]
  54. Langford, F.F.; Blanc-Valleron, M.-M. Interpreting Rock-Eval pyrolysis data using graphs of pyrolizable hydrocarbons vs. total organic carbon. AAPG Bull. 1990, 74, 799–804. [Google Scholar] [CrossRef]
  55. England, W.A.; Mackenzie, A.S.; Mann, D.M.; Quigley, T.M. The movement and entrapment of petroleum fluids in the subsurface. J. Geol. Soc. 1987, 144, 327–347. [Google Scholar] [CrossRef]
  56. Larter, S.R.; Bowler, B.F.J.; Li, M.; Chen, M.; Brincat, D.; Bennett, B.; Noke, K.; Donohoe, P.; Simmons, D.; Kohnen, M.; et al. Molecular indicators of secondary oil migration distances. Nature 1996, 383, 593–597. [Google Scholar] [CrossRef]
  57. Peters, K.E.; Fowler, M.G. Applications of petroleum geochemistry to exploration and reservoir management. Org. Geochem. 2002, 33, 5–36. [Google Scholar] [CrossRef]
  58. Li, Y.; Xiong, Y.; Liang, Q.; Fang, C.; Chen, Y.; Wang, X.; Liao, Z.; Peng, P.A. The application of diamondoid indices in the Tarim oils. AAPG Bull. 2018, 102, 267–291. [Google Scholar] [CrossRef]
Figure 2. (a) API gravity and (b) sulfur content of crude oil at different depths in the Wilcox Formation and Frio Formation of the Perdido fold belt. MW: data of the Wilcox Formation in the central region; MWC: cited data of the Wilcox Formation in the central region; EWC and EFC: cited data of the Wilcox Formation and the Frio Formation in the eastern region, respectively. The green areas represent trends in API and sulfur content in the shallow Wilcox and Frio Formations. The gray lines in figure (a) represent API gravities of 30°API and 45°API; The gray line in figure (b) represents a sulfur content value of 1.2%.
Energies 18 01834 g002
Figure 3. (a) Ternary plot of oil source and (b) plot of oil thermal maturity in the Wilcox Formation and Frio Formation of the Perdido fold belt. The plates are modified after [42,44]. MW: data of the Wilcox Formation in the central region; MWC: cited data of the Wilcox Formation in the central region; EWC and EFC: cited data of the Wilcox Formation and the Frio Formation in the eastern region, respectively.
Energies 18 01834 g003
Figure 4. Natural gas compositions of the Wilcox and Frio Formations in the Perdido fold belt. MW: data of the Wilcox Formation in the central region; MWC: cited data of the Wilcox Formation in the central region; EWC and EFC: cited data of the Wilcox Formation and the Frio Formation in the eastern region, respectively.
Energies 18 01834 g004
Figure 5. (a) Genetic types and (b) thermal maturity of natural gas in the Wilcox Formation and Frio Formation of the Perdido fold belt. The plates are modified after [49,51,53]. MW: data of the Wilcox Formation in the central region; MWC: cited data of the Wilcox Formation in the central region; EWC and EFC: cited data of the Wilcox Formation and the Frio Formation in the eastern region, respectively.
Energies 18 01834 g005
Figure 6. Cross-plot of TOC content versus S2 for the Jurassic Tithonian source rocks in the Perdido fold belt. The plate is modified after [54]. The hydrogen index (HI = S2/TOC × 100) is expressed as milligrams of hydrocarbon per gram of total organic carbon (mg HC/g TOC).
Energies 18 01834 g006
Figure 7. Basin modeling results for individual wells in the Perdido fold belt. (a) Well C-2 in the central region; (b) Well M-2 in the eastern region.
Energies 18 01834 g007
Figure 8. Hydrocarbon transport systems in the Perdido fold belt. (a) Seismic profile of BB’ and (b) Interpretation result of profile BB’.
Energies 18 01834 g008
Figure 9. Relationship between depth and (a) C29αββ/(αββ + ααα) of crude oil and (b) dryness coefficient of natural gas in the Wilcox Formation of the Perdido fold belt. MW: data of the Wilcox Formation in the central region; MWC: cited data of the Wilcox Formation in the central region; EWC: cited data of the Wilcox Formation in the eastern region.
Energies 18 01834 g009
Figure 10. Distribution of maturity parameters and the preferential oil migration directions in the Wilcox Formation of the Perdido fold belt. (a) 4/1-MDBT and (b) Ts/(Ts + Tm). Larger 4/1-MDBT and Ts/(Ts + Tm) values indicate higher hydrocarbon maturity. The direction of the arrow is the direction of hydrocarbon migration. The colored filled areas are the elevation contours of the Wilcox Formation.
Energies 18 01834 g010
Figure 11. Schematic diagram of hydrocarbon accumulation in the central and eastern regions of the Perdido fold belt (profile BB’). The arrows indicate the direction of hydrocarbon migration.
Energies 18 01834 g011
Figure 12. Events chart of the petroleum system elements in the central and eastern regions of the Perdido fold belt. Dark yellow represents Wilcox Formation; Purple represents Frio Formation; Gray represents mudstone; Pink represents salt rock; Red represents gas; Green represents oil; Light blue represents reservoir preservation time; Red arrows represent the critical time of hydrocarbon charging.
Energies 18 01834 g012
Table 1. Basic data of this paper.
DataSourceSubdivisions of the Perdido Fold Belt
Central RegionEastern Region
Three-dimensional seismicThis workYesYes
Stratigraphic divisionThis workC-2M-2
GeochemistryThis workC-1, C-2, D-1, K-1, L-1, and H-1M-2
Ref. [8]T-1 and T-2E-1, M-1, M-3, N-1, and N-2
Disclaimer/Publisher’s Note: The statements, opinions and data contained in all publications are solely those of the individual author(s) and contributor(s) and not of MDPI and/or the editor(s). MDPI and/or the editor(s) disclaim responsibility for any injury to people or property resulting from any ideas, methods, instructions or products referred to in the content.

