Article

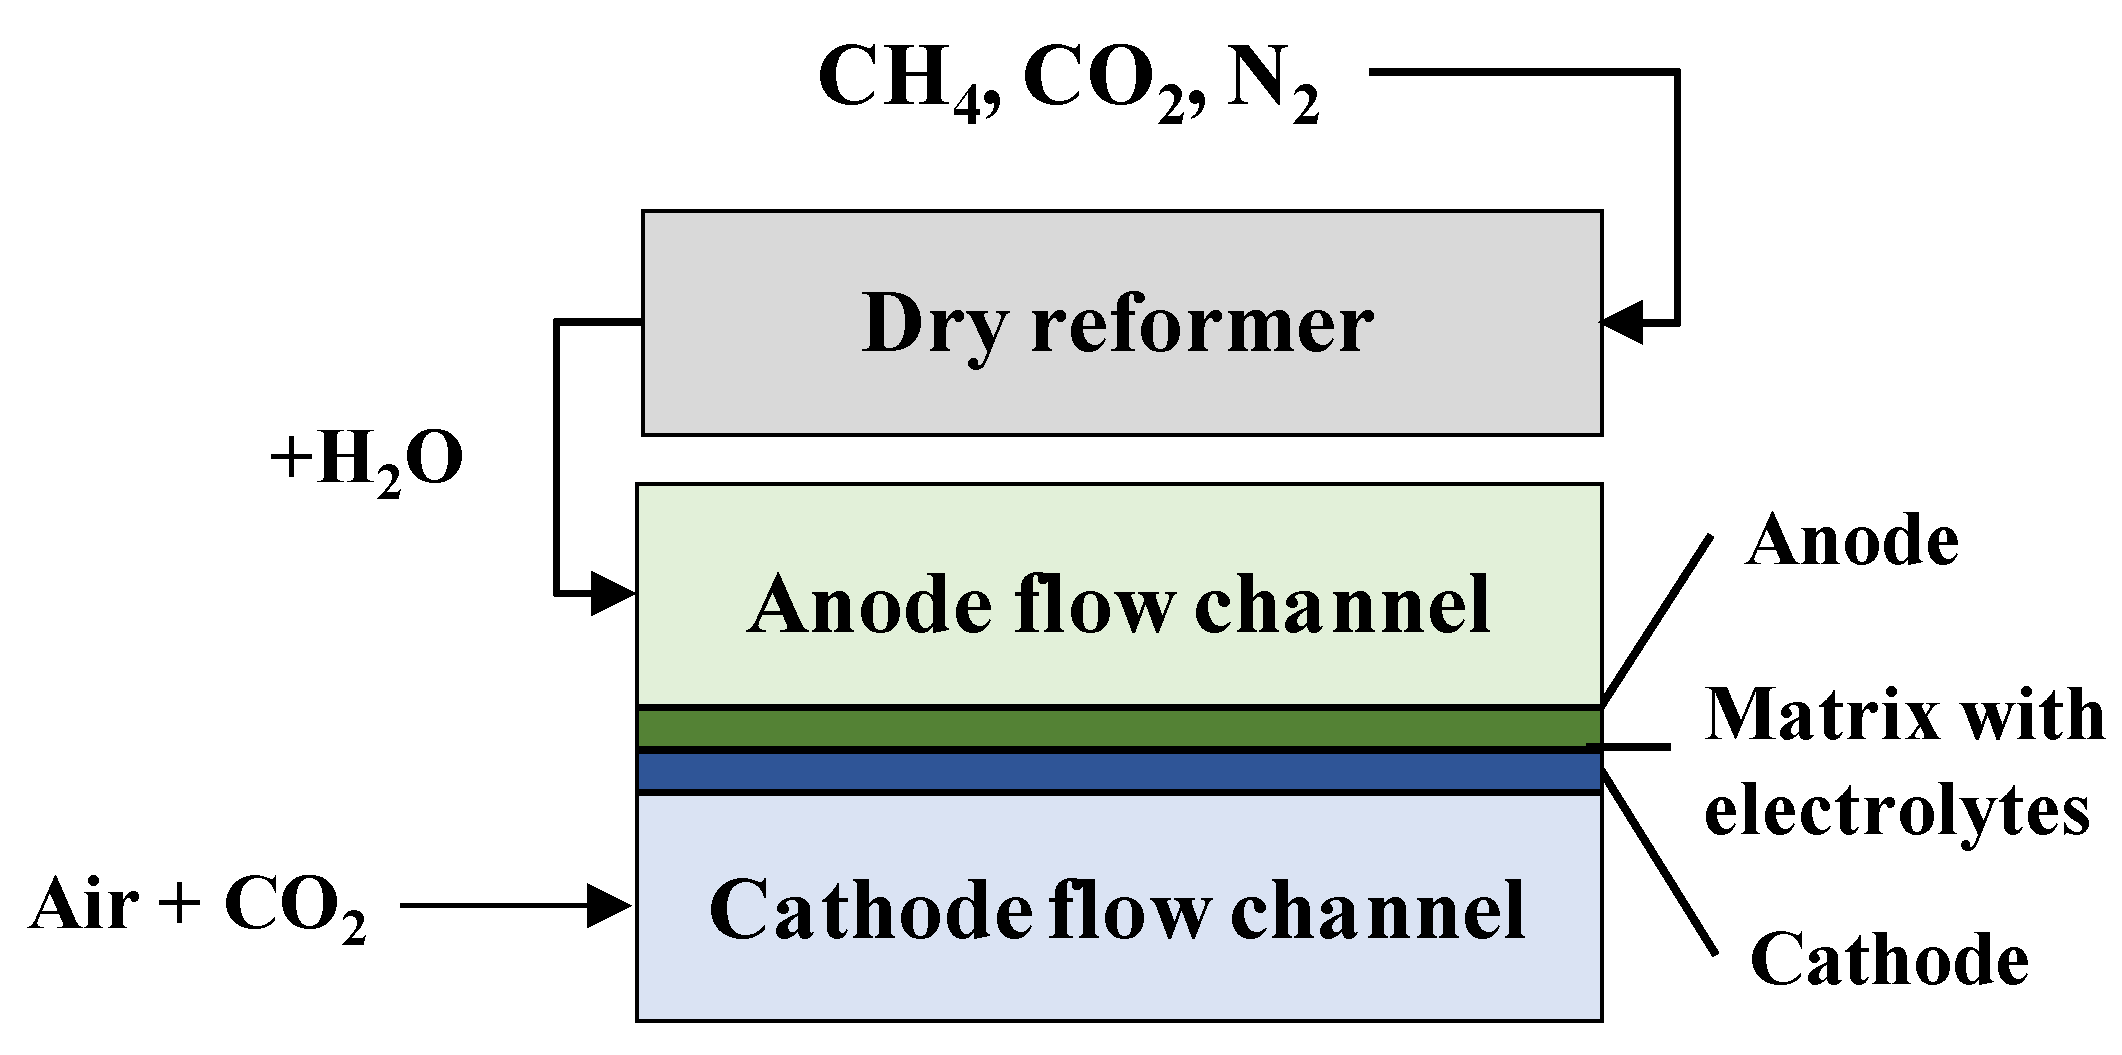
Simulation of Molten Carbonate Fuel Cell with Dry Reforming of Methane (DR-MCFC)

1
Department of Mechanical Information Engineering, Seoul National University of Science and Technology, Gongneung-ro 232, Nowon-gu, Seoul 01811, Republic of Korea
2
FCI, 41-7, Techno 11-ro, Yuseong-gu, Daejeon 34036, Republic of Korea
3
Fuel Cell Research Center, KIST, Hwarangno 14-gil 5, Seongbuk-gu, Seoul 02792, Republic of Korea
*
Author to whom correspondence should be addressed.
These authors contributed equally to this work.
Energies 2025, 18(7), 1863; https://doi.org/10.3390/en18071863
Submission received: 4 March 2025 / Revised: 23 March 2025 / Accepted: 31 March 2025 / Published: 7 April 2025

Abstract

:
This study proposes a novel system integrating a molten carbonate fuel cell (MCFC) with a dry reforming process (DR-MCFC) and develops a corresponding simulation model. In a DR-MCFC, the reacting gases from the dry reforming of methane (DRM) process are fed into a molten carbonate fuel cell. CH4 and CO2 were used as the reaction gases, while N2 was employed as the carrier gas and introduced into the DRM. Following the DRM, the reformed gases were humidified and injected into the anode of the MCFC. A simulation model combining the dry reforming process and the MCFC was developed using COMSOL Multiphysics to evaluate the system’s performance and feasibility. The mole fraction of H2 after the DRM ranged from 0.181 to 0.214 under five different gas conditions. The average current density of the fuel cell varied between 1321.5 and 1444.9 A·m−2 at a cell voltage of 0.8 V, which was up to 27.07% lower than that of a conventional MCFC operating at 923 K due to the lower hydrogen concentration in the anode. Based on these results, the integration of dry reforming with the MCFC’s operation did not cause any operational issues, demonstrating the feasibility of the proposed DR-MCFC system.

1. Introduction

Commonly adopted hydrogen production methods include byproduct hydrogen, gray hydrogen, blue hydrogen, and green hydrogen [1,2]. Green hydrogen is produced from electrolysis using electricity from renewable energy sources, such as wind, solar, or hydropower. Blue hydrogen is produced by splitting natural gas into hydrogen and carbon dioxide (CO2), with the CO2 emissions being captured and stored. Gray hydrogen is produced from natural gas or methane through reforming processes [3]. Natural gas is typically composed of more than 80% methane. Methane reforming [4] can be primarily divided into steam reforming using H2O [5] and dry reforming using CO2 [6]. The steam reforming of methane (SRM) produces hydrogen and carbon monoxide. The temperature range of the SRM is from 973 K to 1173 K. In the SMR, the steam-to-carbon ratio is an important value and ranges from two to five. However, a significant drawback of the SRM is the emission of CO2 as a byproduct. The dry reforming of methane (DRM) can reduce greenhouse gas emissions by utilizing carbon dioxide and methane as reactants. H2O is not required in the dry reforming process, unlike the steam reforming process [7]. The temperature range of the DRM is from 1023 K to 1223 K. Normally, the operating temperature of the DRM is higher than that of the SRM.
Dry reforming is an environmentally friendly hydrogen production method and can overcome the limitations of the SRM. The major obstacles to the DRM are carbon formation and sintering, which lower the activity of the catalyst [8]. The Boudouard reaction and methane thermal cracking are the main reasons for carbon deposition during the DRM [6]. Due to their remarkable coking resistance, thermal stability, and catalytic activity, noble metal catalysts, such as Rh, Ru, Pd, and Pt, are particularly attractive for high-temperature applications. Despite their excellent resistance to carbon deposition and, in some cases, higher catalytic activity, noble metals are not suitable for industrial-scale applications due to their high cost [7]. Compared to expensive noble metals, such as Rh, Ru, and Pt, low-cost bimetallic (Ni-based) and monometallic Ni catalysts are more commonly employed in dry reforming. Guczi et al. [9] investigated a NiMgAl2O4 catalyst containing 0.5 wt% gold in the dry reforming process. They studied the effects of the catalyst and gold on the formation and behavior of carbon species during dry reforming. Ce, Mg, and Y exhibited significant promotional effects in the dry reforming of methane by enhancing catalyst stability, improving metal dispersion, and reducing carbon deposition [7]. The use of noble metal catalysts on supports, such as SiO2, Al2O3, and TiO2, in dry reforming yields highly efficient catalytic performance. This approach also helps reduce carbon buildup during the reaction, thereby enhancing the overall process stability [10]. Kim et al. [10] developed a Ru-based Sr0.92Y0.08TiO0.95Ru0.05O3−d (SYTRu5) perovskite catalyst for the dry reforming process. This catalyst is capable of suppressing carbon buildup and enhancing sulfur tolerance during the reforming process.
Several studies have been conducted to develop simulation models of dry reforming. The gas flow, chemical reactions, and heat transfer have been simulated, with the model validation based on comparisons with the experimental data. Lee et al. [11] developed a simulation model for the dry reforming of methane using shell- and tube-type packed-bed reactors and a membrane reactor. Wehinger et al. [12] developed a fully three-dimensional (3D) model of a packed catalytic fixed-bed reaction for dry reforming. A comprehensive three-dimensional model of a fixed-bed reactor was developed to investigate the catalytic dry reforming of methane (DRM) using rhodium as the catalyst. Jun et al. [13] studied a perovskite-structured catalyst SYTRu5 for the DRM and developed a simulation model using COMSOL Multiphysics v5.6.
The molten carbonate fuel cell (MCFC) operates at temperatures greater than 873 K. The power generation efficiency of high-temperature fuel cells is extremely high. The electrochemical and reforming reactions can proceed simultaneously by utilizing the heat of the fuel cell. MCFCs use CO2, H2O, and O2 as reactants [14]. The MCFC electrolytes are composed of Li2CO3, K2CO3, and Na2CO3 [15]. These electrolytes are in a liquid state at the operating temperature, and the carbonate ions can move through the electrolyte [16]. The efficiency of the high-temperature fuel cell is greater than that of other fuel cells. In some MCFCs, reforming occurs inside the fuel cell; such MCFCs are referred to as MCFCs with direct internal reforming (DIR-MCFCs). Temperature reduction due to endothermic reactions during internal reforming is a research field that requires resolution. Another type of MCFC is the MCFC with indirect internal reforming (IIR-MCFC), wherein a reforming reactor is attached to the fuel cell. Pfafferodt et al. [17] studied a simulation model considering the mass and heat transfer for an IIR-MCFC. They reported that mass transfer does not affect the catalytic activity because it does not limit the overall reaction rate. Freni [18] studied an IIR-MCFC of ethanol/water. They reported that a 5% Rh/Al2O3 catalyst exhibited good reforming and fuel cell operation results in the long-term tests (48 h). Freni and Maggio [19] explored the effects of an IIR-MCFC. Based on an energy balance study, they found that the IIR-MCFC exhibited a higher efficiency than other MCFC types. Jarchlouei et al. [20] studied the total Gibbs free energy of the system (G) and minimized it by adjusting the molar amounts of each substance using a multi-dimensional optimization algorithm for determining the equilibrium of the IR-MCFC. Szablowski et al. [21] developed a numerical mathematical model to analyze steam reforming reactions in the anode channel of an MCFC, aiming to predict the concentration profiles of reactants and characterize the reaction behavior. d’Amore et al. [22] evaluated the performance of a hydrogen production plant integrated with an MCFC for post-combustion CO2 capture, introducing an innovative configuration in which the cell anode was supplied with carbon-rich off-gas from the hydrogen separation unit. Chitsaz et al. [23] investigated a comparative exergy and environmental analysis of a molten carbonate fuel cell cogeneration system, evaluating the performance differences between external and internal steam reforming configurations. The operating results of conventional MCFCs under various conditions are summarized in Table 1.
Combining dry reforming with molten carbonate fuel cells (MCFCs) offers various advantages. Unlike steam reforming, dry reforming utilizes CO2. Since molten carbonate fuel cells use H2 and CO2 as fuel at the anode, they can utilize the H2 produced from dry reforming as well as the remaining CO2 after the dry reforming reaction. In this study, we aimed to develop an analytical model for a DR-MCFC in the form of an IIR-MCFC, where the reformer is located outside the fuel cell. In addition, the applicability of an MCFC to the dry reforming process was examined. The performance of the DR-MCFC was analyzed under various operating conditions.

2. Reactions in DR-MCFC

2.1. Reactions of DRM

A schematic of the DR-MCFC is depicted in Figure 1. A dry-reforming reactor was attached to a conventional MCFC. The DRM is a chemical process wherein methane (CH4) reacts with carbon dioxide (CO2) to produce a mixture of H2 and CO. There are two main reactions and side reactions in the DRM. The two main reactions are shown in Equations (1) and (2), respectively. Equation (1) represents the reaction between CO2 and CH4, which produces CO and H2. Equation (2) describes the reverse water–gas shift (R-WGS) reaction, which occurs when the hydrogen produced during the process reacts with CO2. Equations (3)–(5) express the CH4 decomposition, carbon–steam gasification, and Boudouard reactions, respectively [29]. Additionally, Equations (1)–(5) have been labeled as Reaction 1, 2, 3, 4, and 5, respectively.
SYTRu5 was employed as the catalyst for the dry reforming process. SYTRu5 exhibited excellent performance and strong resistance to coke formation and sulfur poisoning due to its perovskite structure and Ru particles smaller than 10 nm, which increased the number of active sites on the catalyst surface. As the DRM performance of the SYTRu5 catalyst was not significantly different from that of conventional Ni catalysts, we applied kinetics from previous studies. The reaction rates of the dry reforming process are presented in Table A1 [30,31,32]. The thermodynamic and rate constants are described in Table A2 [29].
C H 4 + C O 2   2 C O + 2 H 2 ,   Δ H 1 ,   T = 298 = 247.3   k J · m o l 1
C O 2 + H 2   C O + H 2 O ,   Δ H 2 ,   T = 298 = 41.17   k J · m o l 1
C H 4   C + 2 H 2 ,   Δ H 3 ,   T = 298 = 74.87   k J · m o l 1
C + H 2 O   C O + H 2 ,   Δ H 4 ,   T = 298 = 131.325   k J · m o l 1
C + C O 2   2 C O ,   Δ H 5 ,     T = 298 = 172   k J · m o l 1

2.2. Reaction Fluxes in DRM

The volumetric reaction speed of the DRM is defined, as described in Equation (6). In Equation (6), r i is the reaction rate for the ith reaction, ρcat is the density of the catalyst, and η i is the effectiveness factor. In this work, the same values of η i used in the previous works [33] were employed. There are some differences in the catalyst’s form, specific surface area, etc. To compensate for these differences, the correction factor K was multiplied by the reaction equation, as presented in Equation (6). The correction factor K was determined from the comparison between the experiment and the simulation of the dry reforming process [13]. The reaction fluxes of the reactive gases are listed in Table 2:
R i   [ m o l · m 3 · s 1 ] = r i   [ m o l · k g 1 · s 1 ] ×   ρ c a t   [ k g · m 3 ]   ×   η i ×   K

2.3. Reactions of Molten Carbonate Fuel Cell

In conventional MCFCs, H2, H2O, and CO2 are injected into the anodes. In this case, H2 and carbonate ions combined to generate electricity from H2O and CO2 through an oxidation reaction. At the cathode, CO2 and O2 reacted to produce carbonate ions based on the reduction reaction. The generated carbonate ions moved from the cathode to the anode through the electrolyte. Then, N2, O2, and CO2 were injected into the cathode.
The reaction equations at the anode and cathode are shown in Equations (7) and (8), respectively. The voltage ( V c e l l ) at the electrode during the reaction is shown in the following Equation (9). ENernst is the Nernst potential, as shown in Equation (10). The resistance of the anode ( R A n o d e ) and cathode ( R C a t h o d e ) and the internal cell resistance ( R O h m i c ) are shown in Equations (11)–(13) [34,35]. It was hypothesized that the electrochemical reaction occurred only on the reaction surface between the electrodes. In this study, the effect of CH4 on the anode was not considered:
A n o d e :   H 2 + C O 3 2   H 2 O + C O 2 + 2 e  
C a t h o d e :   C O 2 + 1 2 O 2 + 2 e     C O 3 2
V c e l l x , y = E c e l l x , y i x , y R A n o d e x , y + R C a t h o d e x , y + R O h m i c x , y
E N e r n s t = E O + R T 2 F l n ( P H 2 A n o d e P O 2 C a t h o d e P H 2 O A n o d e P C O 2 C a t h o d e P C O 2 A n o d e )
R A n o d e = 2.27   ×   10 9 exp 6435 T P H 2 0.42 P C O 2 0.17 P H 2 O 1.0
R C a t h o d e = 7.505   ×   10 10 exp 9289 T P O 2 0.43 P C O 2 0.09
R O h m i c = 0.5   ×   10 4 exp [ 3016 1 T 1 923 ]
A WGS reaction occurred in the MCFC anode, where CO and H2O reacted to produce H2 and CO2, as expressed in Equation (14). Since the reaction has a very fast reaction rate and reaches equilibrium, the performance of the MCFC was evaluated using the equilibrium constant equation according to temperature, as shown in Equation (15) [25,36]:
C O + H 2 O H 2 + C O 2 , H W G S ,   T = 298 = 41.1   [ k J · m o l 1 ]
K W G S = P H 2 P C O 2 P H 2 O P C O = 157.02 0.447 T + 4.2777   ×   10 4 T 2 1.3871   ×     10 7 T 3

3. Gas Properties

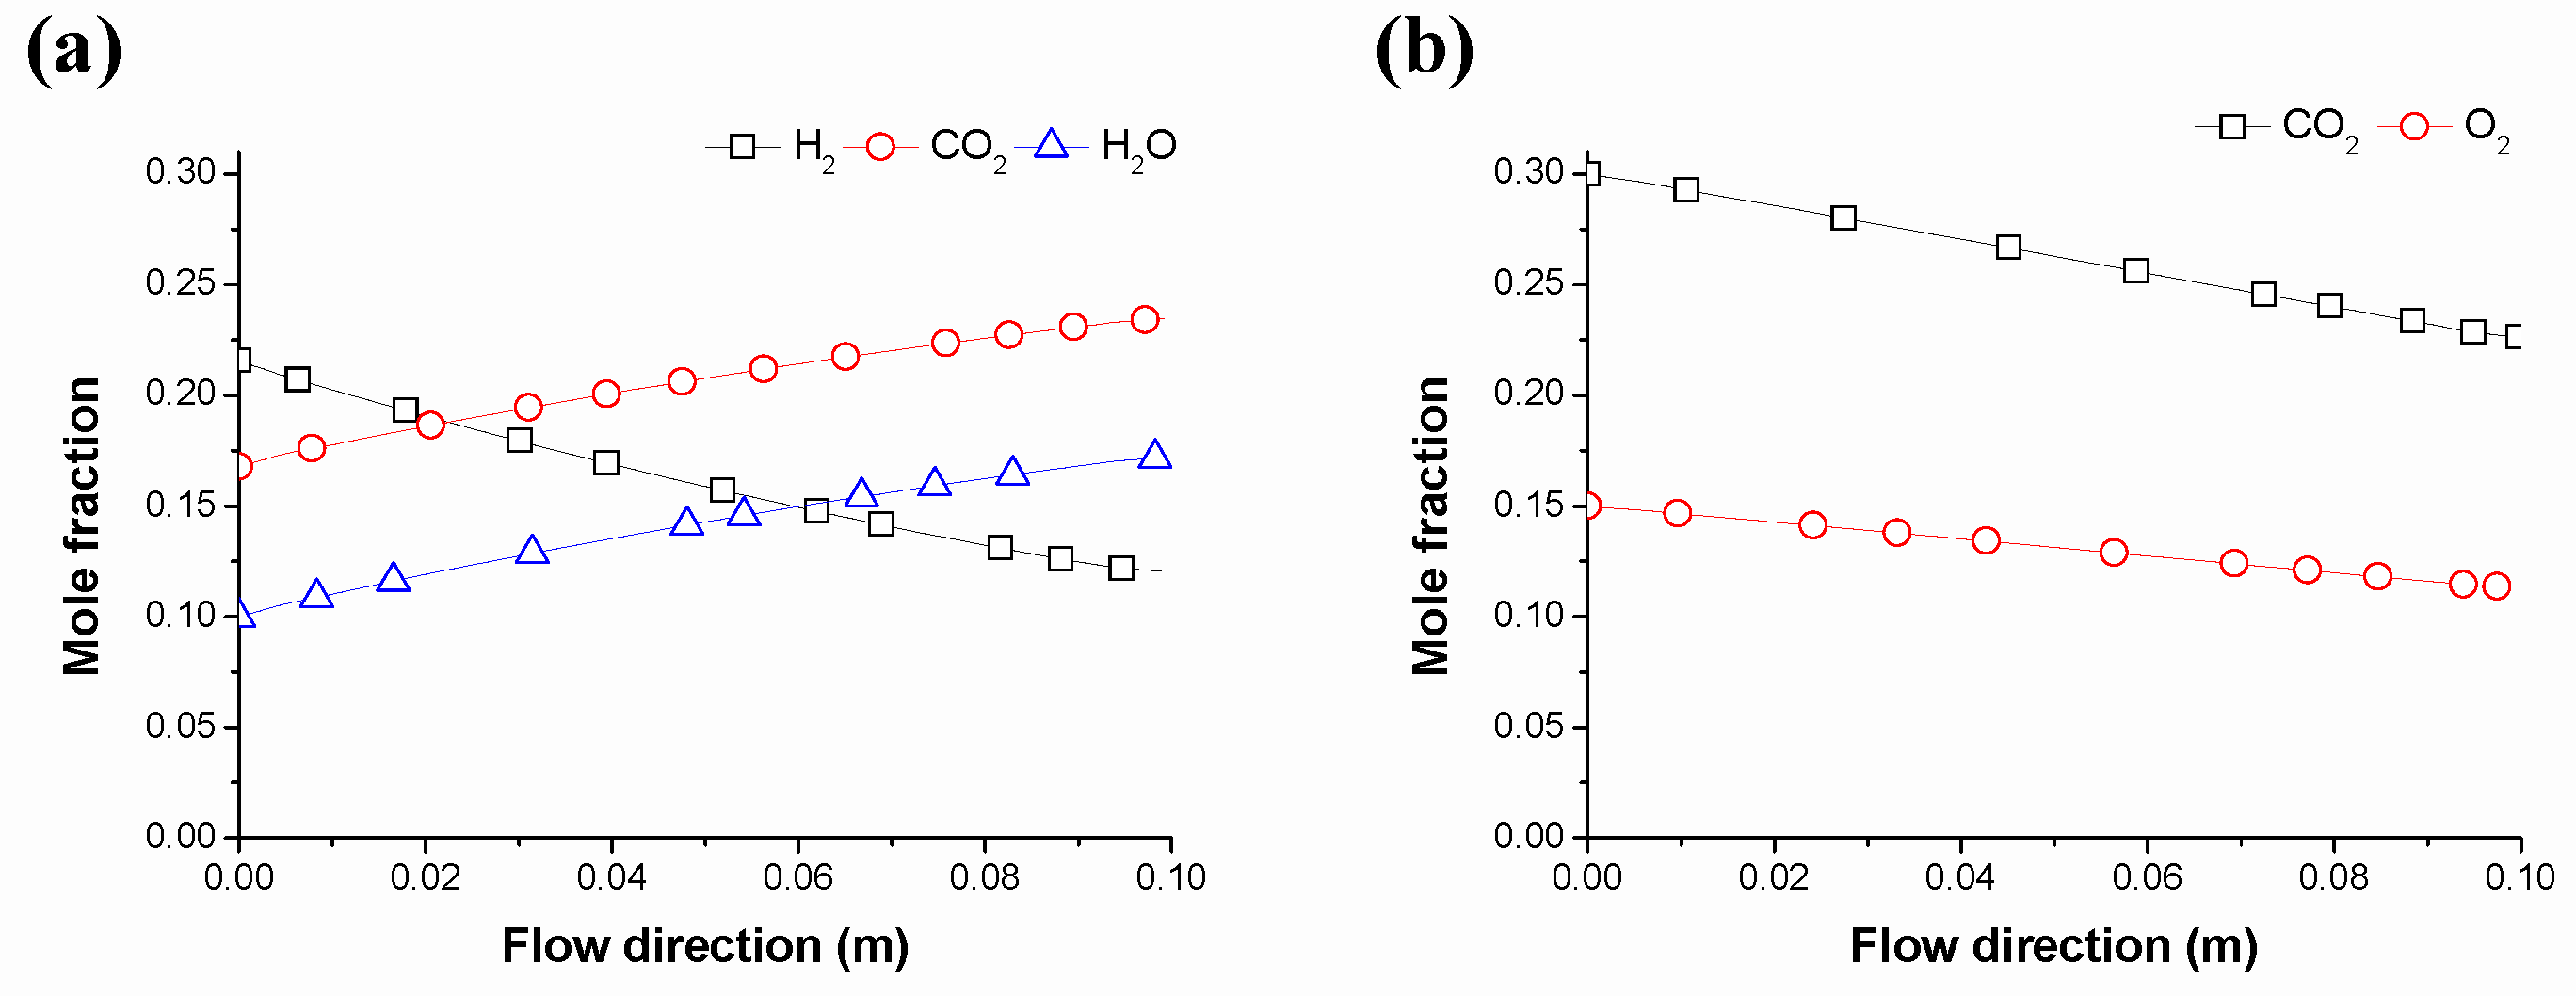
3.1. Gas Flow Characteristics

In dry reforming and fuel cell reactions, the temperature and composition of the gas may vary. Temperature- and composition-dependent gas properties were considered in the simulation model. The equation for the difference in the concentration, temperature, and pressure of reactive gases was necessary to precisely simulate a molten carbonate fuel cell with the dry reforming of methane.
First, the gas flow in the catalyst and gas flow channel is described. The gas flow in the DRM catalyst bed of DRM was assumed to be porous based on Darcy’s law, which explains how a fluid moves through a porous medium [37]. The gas flow in the current collector was modeled using Darcy’s law [25,36], which is expressed as follows:
q = k μ L P ,
In Equation (16), q is the velocity of the mixture gas, k is the permeability, L is the length of the porous media, and ΔP is the pressure drop. The velocity and pressure distributions of the reactive gas were determined using the momentum conservation principles.
The viscosity of a gas is a measure of the resistance to flow, and it depends on factors such as composition, temperature, and pressure [38]. In the present work, the viscosity of each gas is expressed as a function of temperature, as shown in Equation (17). In Equation (17), μi denotes the viscosity of the ith gas component, Aμ, Bμ, and Cμ are fitting parameters, and T represents the temperature. The viscosity of the gas mixture was calculated using Equation (18) [39]. In Equation (18), xi is the mole fraction, and Mi is the molecular weight of the ith gas component:
μ i = A μ + B μ T + C μ T 2
μ m i x = i = 1 n μ i x i M i i = 1 n x i M i
The gas diffusion is shown in Equation (19). The Maxwell–Stefan diffusion model was employed to calculate multicomponent gas diffusion [40]. In Equation (19), ω i and xi are the mass and mole fractions of the ith gas component, respectively, Ri is the reaction rate of the ith gas component, DiT is the thermal diffusion coefficient, and Dij is the multicomponent Fick diffusivity between the ith and jth gas component, as expressed in Equation (20):
· j i + ρ u · ω i = R i ,
j i = ρ ω i k D i k d k + D i T T T ,
d k = x k + 1 ρ [ ( x k ω k ) ρ ,
x k = ω k M k M n ,       M n = ( j ω j M j ) 1 ,
D i j = 1   ×     10 3 T 1.75 ( 1 M i + 1 M j ) 1 / 2 P ( v i 1 / 3 + v j 1 / 3 ) 2 ,
In Equation (19), Xi is the mole fraction, ni is the total amount of substance, Mi is the molecular weight, and Dij is the binary diffusivity between components i and j. In Equation (20), vi represents the specific diffusion volume. The diffusion volumes are presented in Table A4 in Appendix A.
The effective binary diffusion coefficient inside the porous layer, such as the catalyst layer in the DRM and the anode and cathode in the MCFC, was defined using the Bruggerman correlation described in Equation (21). In Equation (21), ε and τ are the porosity and tortuosity of the porous layer. The porosity of the SYTRu5 catalyst was 0.36 [13] and that of the anode and the cathode of the MCFC is 0.6 and 0.7, respectively:
D e f f , i j = D i j ε 1.5 = D i j ε τ ,
The thermal conductivity of the gas mixture is given by Equation (22). This is a quadratic equation for temperature [38]. To determine the thermal conductivity of the gas mixture, equations derived by Mason and Saxena [41], shown in Equation (23), were used. The fitting parameters for each gas component are presented in Table A5:
k g a s = A k + B k T + C k T 2 ,
k m i x   = i = 1 n x i k i j = 1 n x j i j ,     i j = [ 1 + ( u i u j ) 1 / 2 ( M j M i ) 1 / 4 ]   2 2 2 [ 1 + M i M j ] 1 / 2  
The equation for the heat capacity is given by Equation (24) [38]. The equation for the heat capacity of the gas mixture is given by Equation (25). The fitting parameters for each gas component are presented in Table A6 in Appendix A:
C p = A C + B C T + C C T 2 + D C T 3 + E C T 4 ,
C p , m i x = i = 1 n x i C p , i

3.2. Heat Generation in DRM

Dry reforming, CH4 decomposition, carbon–steam gasification, and the Boudouard reaction are endothermic reactions. The R-WGS reaction was exothermic. As a result, the total heat generation is presented as the sum of the product of the enthalpy and the reaction rate of each reaction, as presented in Equation (26). In the equation, ΔHi and ri mean the ith reaction of the dry reforming reaction in Equations (1)–(5):
q r = Δ H 1 r 1 Δ H 2 r 2 + Δ H 3 r 3 + Δ H 4 r 4 + Δ H 5 r 5
It was assumed that there was no heat loss between the catalyst layer where the DRM occurred and the reactive gas in the DRM reactor. This means that the temperatures of the catalyst layer and flowing gas are the same. Natural convective heat transfer occurs between the external surfaces of the gas pipe, with a convection coefficient of 15 W/m2·K. It was considered that the external temperature was constant with respect to the operating temperature [42]. In addition, the inlet temperature of the DRM reactor was assumed to be constant with respect to the operating temperature.
The thermal conductivity, heat capacity, and density of SYTRu5 were 5.5 W·m−1·K−1, 220,108 J·kg−1·K−1 [43], and 4810 kg·m−3, respectively. The thermal conductivity, heat capacity, and density of the quartz tube were 3 W·m−1·K−1, 741 J·kg−1·K−1, and 2650 kg·m−3.

3.3. Heat Generation in MCFC

Heat transfer is considered to occur only due to the fuel cell and the WGS reactions. In the fuel cell, an electrochemical reaction occurs on the reaction surface due to the change in internal enthalpy, and the calorific value ( q e ) is given by Equation (27). In addition, the WGS reaction is a strong endothermic reaction. Accordingly, the endothermic value ( q W G S ) can be calculated by multiplying the change in the molar ratio ( n C O ) of CO to the unit area by the change in enthalpy ( H W G S ), as shown in Equation (28) [44]. The thermal properties of the anode and cathode of the cell used in this research are listed in Table 3:
q e = H M C F C i 2 F V c e l l · i
q s = H W G S n C O

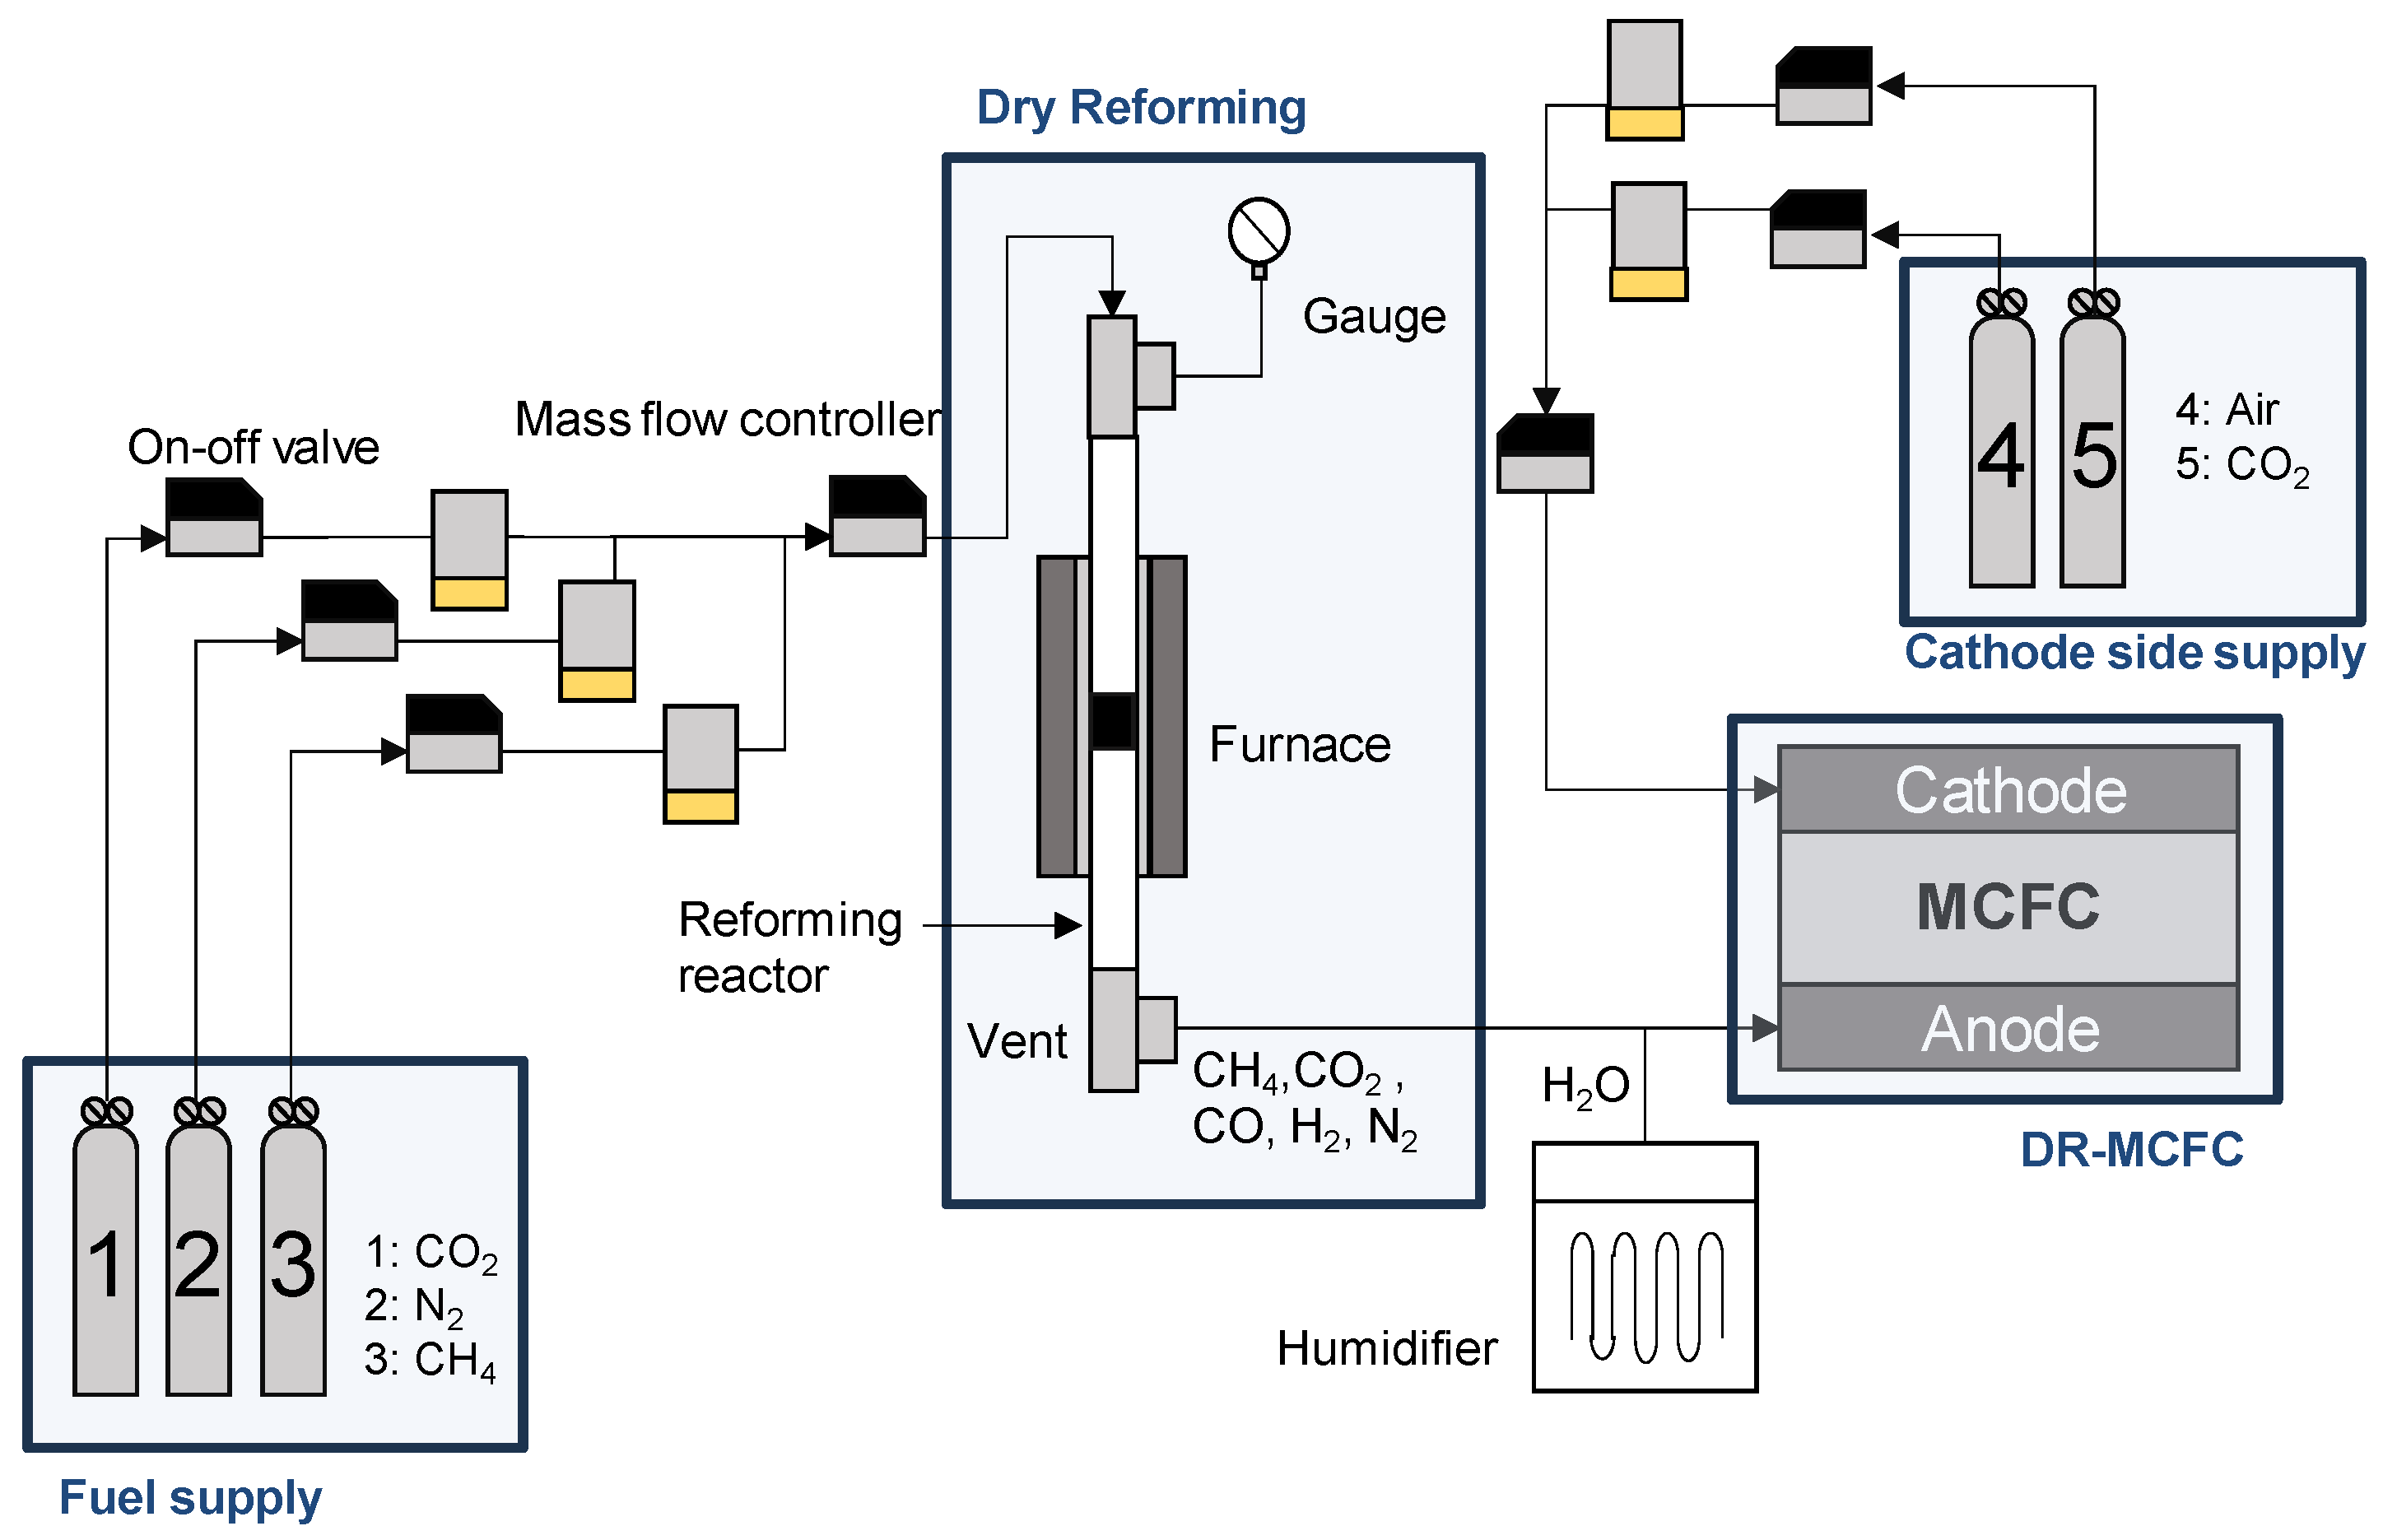
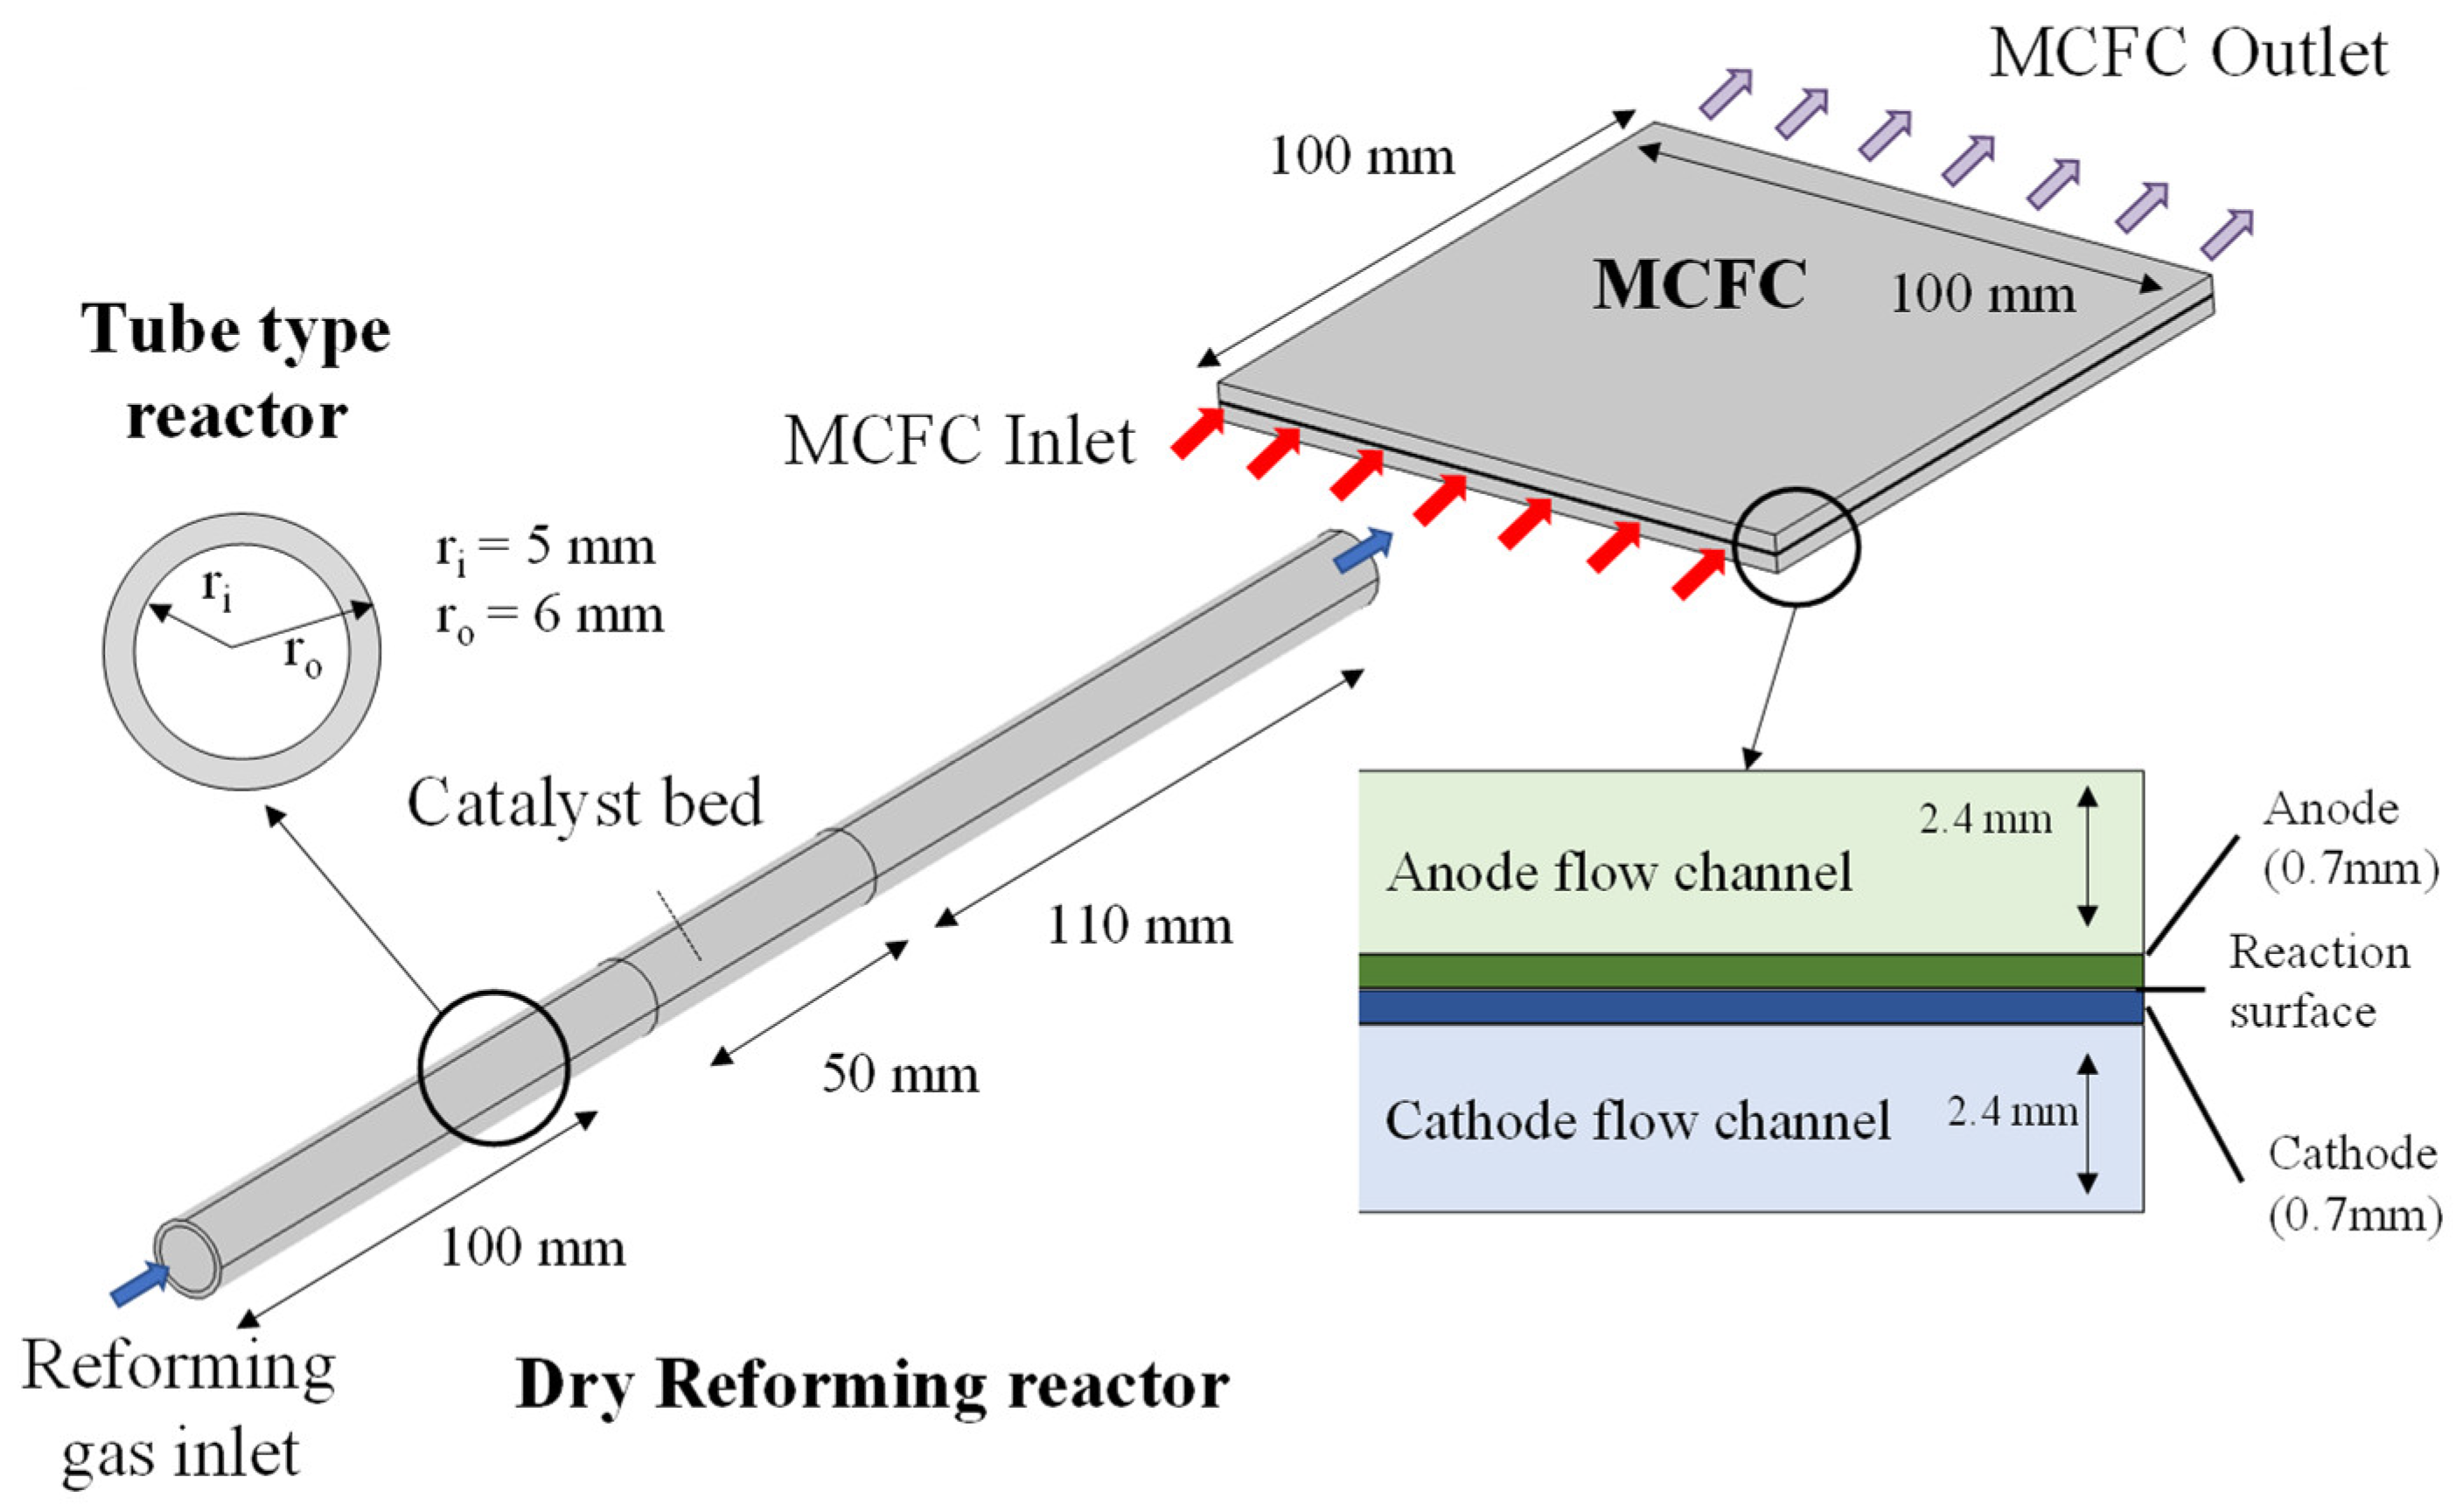
4. Simulation Model of DR-MCFC

4.1. Simulation Model

A schematic of the overall DR-MCFC process is shown in Figure 2. To generate H2, CH4, CO2, and N2 were introduced into the dry reforming reactor. H2 was produced when reactive gases passed through a dry reformer reactor. After the dry reforming process, H2O was not present in the reactive gases. Humidification of the anode gas decreases the possibility of carbon deposition because H2O in the anode gas reduces the concentration of CO through the WGS reaction [45]. For the stable operation of the MCFC, H2O was added after the dry reforming process. A humidifier was attached at the end of the reactor to add H2O, O2 and CO2 were injected into the air cathode of the fuel cell. Electricity was then generated through the fuel cell reaction.
The combined process was simplified in the simulation model. Only the dry reforming process and fuel cells were considered, as shown in Figure 3. The dry reforming reactor was assumed to be a cylindrical, catalyst-packed reactor [13]. The length, outer diameter, and inner diameter were 260, 12, and 10 mm, respectively. The catalyst was placed 100 mm from the gas inlet of the reactor with a length of 50 mm. In the simulation, the H2O was assumed to be added, and the humidifier was not modeled. After the addition of H2O, a gas composite of CH4, CO2, N2, H2, and H2O was introduced into the anode of the MCFC. For the MCFC, the anode gas flow channel, cathode gas flow channel, anode, cathode, and matrix with electrolytes were modeled. The dimensions of the fuel cell were 100 mm × 100 mm. The thicknesses of the cathode and anode were 0.7 mm. For current collectors, a corrugated plate with a trapezoidal structure was employed [26]. The height of the current collectors was 2.4 mm. It was assumed that the gas flow channel is a porous medium. The matrix with the electrolyte was assumed to possess a thin surface called the reaction surface. To simplify the DR-MCFC system, it was assumed that the reformer and the fuel cell are housed within the same chamber. In the simulation model, the operating temperatures of the reformer and the fuel cell are the same, and the external environment was assumed to be adiabatic.

4.2. Simulation Conditions

The proposed DR-MCFC model was implemented in COMSOL Multiphysics v. 5.6. COMSOL Multiphysics was used to solve energy balance, species balance, momentum, and continuity equations. As shown in Figure 3, the simulation model was composed of two parts: the DRM and the MCFC. In the DRM part, the reactions in Equations (1)–(5) were considered. Meanwhile, Equations (9)–(11) for the electrochemical reaction and Equation (15) for the WGS reaction were additionally considered in the MCFC. In each simulation model, the gas properties were calculated according to the temperature, pressure, and gas composition. It was assumed that there was no heat transfer between the DRM and the MCFC.
The simulation was performed according to the ratio of initial input gas and operating temperature, as shown in Table 4. The ratios of the initial input gases CH4:CO2:N2 were 0.25:0.25:0.5, 0.33:0.33:0.33, 0.4:0.2:0.4, 0.2:0.4:0.4, and 0.4:0.4:0.2. Based on these process conditions, an analysis model wherein an MCFC was added to the previously developed dry reforming analysis model was developed, and optimal operating conditions were derived. The gas flow rate of the input gas was fixed to 6 × 10⁻⁵ m3·s−1.
The reforming reactor and the MCFC were assumed to be in the same heating chamber; therefore, the operating temperatures of the reforming reactor and the MCFC were the same. The operating temperatures were 873, 893, and 923 K. A gas mixture of air and CO2 was injected onto the cathode side. The composition of the cathode and side gases was Air/CO2 = 0.7:0.3. The gas flow rate on the cathode side was 5.36 × 10⁻⁵ m3·s−1 at 923 K.
In the MCFC, current collectors were present in the anode and cathode gas flow channels. The flow channels were assumed to be porous media. The permeability of the current collectors was adopted from a previous study [26]. The permeability of the current collectors was 8.15 × 10⁻⁸ m2. The porosities of the anode and cathode were 0.5. The permeabilities of both the anode and cathode were 5 × 10⁻¹⁰ m2.
H2O was added after the dry reforming process. To evaluate the added H2O, the total gas volume in the initial state was obtained through equilibrium state calculations using the mole fraction of H2 generated after the reforming reaction. Thereafter, the input gas of the MCFC was calculated by multiplying the total gas volume with the molar fraction of each gas, and the final molar fraction of the input gas was calculated by adding H2O as 10% of the total gas.

5. Simulation of MCFC with Dry Reforming

5.1. Operation Conditions for Different Gas Input Conditions

The simulation results for the dry reforming process at 923 K and the gas flow rate of 6 × 10⁻⁵ m3·s−1 in Case A are shown in Figure 4. As the gas flowed through the dry reforming reactor, the dry reforming reaction occurred. The mole fractions of CH4 and CO2 decreased, while the mole fraction of H2 and CO increased. The initial and final molar fractions of CH4 were 0.25 and 0.096. The initial and final molar fractions of H2 were 0 and 0.205. The reforming rate was 61.6%. The temperature of the catalyst bed was 830.62 K, which was the lowest temperature due to the endothermic reaction of the reforming process in the dry reforming reactor. The temperature at the outlet of the dry reforming reactor rose to 869.57 K. The other four cases showed similar trends.
In the simulation, after the dry reforming process, the gas was heated through a gas line connected to the MCFC. Before inserting the reformed gases into the MCFC, 10% of H2O was added [25,44]. The mole fraction of the gas injected into the fuel cell inlet using this calculation method is listed in Table 5.

5.2. Comparison of Fuel Cell Performances

Figure 5a shows the concentration distribution of each chemical species according to the flow direction in the MCFC anode. As the fuel cell reaction progressed in the anode, H2 decreased, and H2O and CO2 increased. In the case of CO, there was a tendency to decrease by reacting with H2O through the WGS reaction. There was no significant change in the molar fraction of CH4 because CH4 did not participate in the fuel cell reaction. Figure 5b shows the concentration distribution of each chemical species according to the flow direction in the MCFC cathode, and O2 and CO2 were reduced due to the electrochemical reaction.
Table 6 presents the OCV and average current density at the cell voltage of 0.8 V under different operating conditions. The I–V curves for the five cases are shown in Figure 6. The I–V curves for the five cases were not significantly different. The average current densities of Cases A to E were 1420.5, 1427.7, 1444.9, 1321.5, and 1422.2 A·m−2 at a cell voltage of 0.8 V. The open circuit voltage (OCV) of each operating condition is also listed in Table 6. The minimum and maximum mole fractions of H2 before the fuel cell reaction were 0.181 in Case C and 0.214 in Case E.
The conventional I-V curve of the MCFC at 923 K [44] is also presented in Figure 6. The gas compositions of the anode and the cathode were H2:H2O:CO2 = 0.72:0.1:0.18 for the anode and Air/CO2 = 0.7:0.3 for the cathode. The gas flow rates of the anode side and the cathode side at 923 K were 2.25 × 10⁻⁵ m3·s−1 and 5.36 × 10⁻⁵ m3·s−1. The average current density of the conventional MCFC was 1805.7 A·m−2, which was 27.07% higher than that of Case A. Since the amount of hydrogen supplied was lower than in a conventional MCFC, the performance of the DR-MCFC was consequently lower.
Table 7 presents the polarization percentage of the MCFC at the cell voltage of 0.8 V under different operating conditions. Ohmic loss accounts for the largest percentage, followed by cathode polarization and Nernst loss. Anode polarization exhibits the lowest value due to the rapid reaction at the fuel electrode. However, in the case of the DR-MCFC, anode polarization shows a high proportion of over 25% in all cases due to the low molar fraction of H2 on the anode side. Nernst loss occurs at an average of 22.34%. This indicates that the performance of the DR-MCFC is attributed to the low hydrogen molar fraction on the anode side.
Figure 7 presents the simulation results of Top = 923 K, U = 6 × 10⁻⁵ m3·s−1, and the gas condition of Case A. The I–V curves for the five cases are shown in Figure 6. The highest current density was observed at the gas inlet region. Additionally, the anode resistance was calculated using Equation (11) and depends on the temperature and gas concentration distribution. The cathode resistance was lowest at the gas inlet and highest at the outlet. The ohmic resistance was high at the gas inlet and decreased toward the gas outlet due to the electrochemical reactions occurring along the gas flow direction, which led to a temperature increase. In the fuel electrode, the opposite trend was observed because of the increasing molar fractions of H2O and CO2. In conventional MCFCs, the cathode resistance is typically the dominant factor in performance degradation. However, in DR-MCFCs, the hydrogen supply to the fuel electrode is lower than in conventional MCFCs, resulting in the fuel electrode resistance being greater than the cathode resistance.
Figure 8 shows the comparison for Cases B and E with the initial gas flow rates of 25% (U = 0.25 U0) and 100% (U = U0). The gas composition was maintained under the above conditions. The average current density of Case B was 1427.7 A·m−2 at a gas flow rate of 0.25 U0 and 1443.6 A·m−2 at a gas flow rate of U0, respectively. The difference in the average current density between the gas flow rate of 0.25 U0 and U0 in Case B was just 15.9 A·m−2.
In Case E, the average current density at a low gas flow rate was higher than that at a high gas flow rate. The performance at low gas flow rates may be attributed to the different reforming rates. As the gas input into the reformer increased, the reforming rate decreased. Many reforming reactions occurred at the reformer inlet where the reactant gas was introduced, which led to a decrease in the temperature. Further, as the temperature decreased, the overall reforming rate decreased as the gas flow rate increased.
Figure 9 presents the distribution of H2 for Cases B and E with different gas flow rates. The mole fraction of H2 at the inlet of the MCFC was 0.304 and 0.334 for Cases B and E with the initial gas flow rate of 25%. The mole fraction of H2 was higher with the initial gas flow rate of 25% than the initial gas flow rate of 100%. This is because, as the gas flow rate decreased, more reforming reactions occurred.
However, as the gas flow rate decreased, the total amount of H2 production decreased. The mole fraction of H2 according to the initial gas flow rate in Case B and Case E is shown in Figure 9. The mole fraction of H2 at the outlet of MCFC decreased in the gas flow rate of 0.25 U0 at the cell voltage of 0.8 V. The mole fraction of H2 at the outlet of the MCFC exhibited a large difference. For Cases B and E, with the initial gas flow rate of 100%, the mole fractions at the outlet were 0.107 and 0.120, respectively. With the gas flow rate of 0.25 U0, the mole fractions at the outlet were 0.065 and 0.0841.
Figure 10 shows the current density distribution according to the gas input in Case B and Case E. The mole fraction of H2 also affected the current density distribution. The difference in current density between the inlet and outlet was more significant under an initial gas flow rate of 25% compared to 100%. Although the average current density remained similar across conditions, the shape of the current density distribution varied. This is because the consumption of molten carbonate is more likely to occur in regions with higher current density when the inlet and outlet current densities differ, as shown in Figure 10b,d. When the gas flow rate is low, the current density at the inlet and outlet differs greatly, leading to an uneven distribution of current density. This non-uniformity results in locally increased chemical reaction rates, accelerating material degradation or loss in specific areas. Therefore, injecting a higher gas flow rate is more advantageous for the long-term operation of the MCFC.
Figure 11 shows the distribution of the H2 mole fraction and current density distribution along the flow direction at the center. The mole fraction of H2 and the current density decreased according to the flow direction. The mole fractions of H2 in Cases B and E showed little difference with the initial flow gas rate of 100%. However, the mole fraction and current density distributions tended to differ with the initial gas flow rate of 25%. The mole fraction of H2 was high at the inlet and low at the outlet of the MCFC. At lower inlet flow rates, higher reforming occurred in the dry reformer; thus, there was a higher mole fraction of hydrogen in the inlet of the MCFC. However, sufficient H2 could not be introduced into the MCFC as the total H2 flow rate decreased. So, a large difference in the mole fraction of H2 at the inlet compared to the outlet occurred, and the current density was higher at the inlet and lower at the outlet of the MCFC.
Simulations were performed according to the operating temperatures of the dry reforming reactor and the MCFC to 873, 893, and 923 K in Cases C and D. The temperatures of the dry reforming reactor and fuel cell were assumed to be identical. The gas flow rate was fixed at a rate of 6 × 10⁻⁵ m3·s−1. The I–V curves of Cases C and D, according to the operating temperatures, are shown in Figure 12. As the temperature decreased, the MCFC performance degraded for all gas compositions.
The distributions of H2 under different conditions are shown in Figure 13. Lower mole fractions of H2 occurred at lower operating temperatures compared to higher operating temperatures. This is because more H2 was produced in the dry reforming reactor at higher operating temperatures. Figure 14 shows the current density distribution according to the operating temperatures in Case C and Case D. Electrochemical reactions occurred relatively more actively in the inlet region of the MCFC due to greater H2 production at higher temperatures.
Figure 15 shows the mole fraction of H2 and current density distribution along the flow direction at different temperatures. The reforming rate of the dry reformer decreased as the operating temperature of the fuel cell decreased. For a low hydrogen mole fraction at the fuel cell fuel pole inlet, the current density distribution showed similar results. The current density at the inlet decreased with the operating temperature. Overall, the average current density decreased.

6. Discussion on DR-MCFC Operating Conditions

In this study, a DR-MCFC was simulated under different operating conditions. The operating conditions had a significant impact on the conversion rate of CH4. As the temperature increases, the reforming rate of the dry reforming improves. The lifetime of SYTRu5 is also extended. For the MCFC, operation above 700 °C is not recommended because the electrolyte (Li2CO3 and K2CO3) evaporates at high temperatures and leads to electrolyte loss. Therefore, the most suitable operating condition is 650 °C, where dry reforming is still feasible, and the MCFC operation remains stable. Regarding gas flow rates, it is essential to ensure sufficient H2 production. The flow rate condition used in this study (6 × 10⁻⁵ m3·s−1) allows for adequate hydrogen production.
As shown in Table 4, even with the difference in gas input, there was no significant difference at the exit. This is because the main reaction, which is a one-to-one reaction between CO2 and CH4, is the most active in the dry reforming process. This indicates that the current density–voltage of the MCFC did not show significant differences in any of the five cases.
However, the dry reforming rate and MCFC performance decreased as the temperature decreased. In addition, lower temperatures may also increase the occurrence of carbon deposits during dry reforming. Therefore, MCFCs are expected to operate best at 923 K, which is the same temperature at which conventional MCFCs can operate.
Although not addressed in this study, one of the biggest challenges of the DR-MCFC is its long-term operational performance. In particular, for dry reforming, the most significant issue can be the degradation of catalyst performance due to carbon deposition on the catalyst surface during the reforming process [10]. In the proposed DR-MCFC, the anode gas includes CO and CH4. This decrease in performance in long-term operations must be experimentally analyzed. Additionally, carbon deposition on the anode side due to CO is detrimental to the MCFC [45]. Research on the effect of the CH4 on the anode side and carbon deposition on the anode side is required. For this purpose, an experimental study focusing on DR-MCFCs is underway.

7. Conclusions

In this work, a simulation model was developed to simultaneously study both dry reforming and molten carbonate fuel cells. Various gas properties were calculated according to both the composition of each gas and the effect of temperature. The results confirm that the DR-MCFC can operate in a typical fuel cell operating environment in the temperature range of 873–923 K.
(1)
Dry reforming was examined under various gas input conditions and operating temperatures, and its impact on the connected fuel cell was evaluated. The resulting mole fraction of H2 after dry reforming ranged from 0.181 to 0.214, directly influencing fuel cell performance. Consequently, the average current density of the fuel cell at a cell voltage of 0.8 V varied between 1321.5 and 1444.9 A·m−2, which was up to 27.07% lower than that of a conventional MCFC at 923 K due to the reduced hydrogen concentration in the anode;
(2)
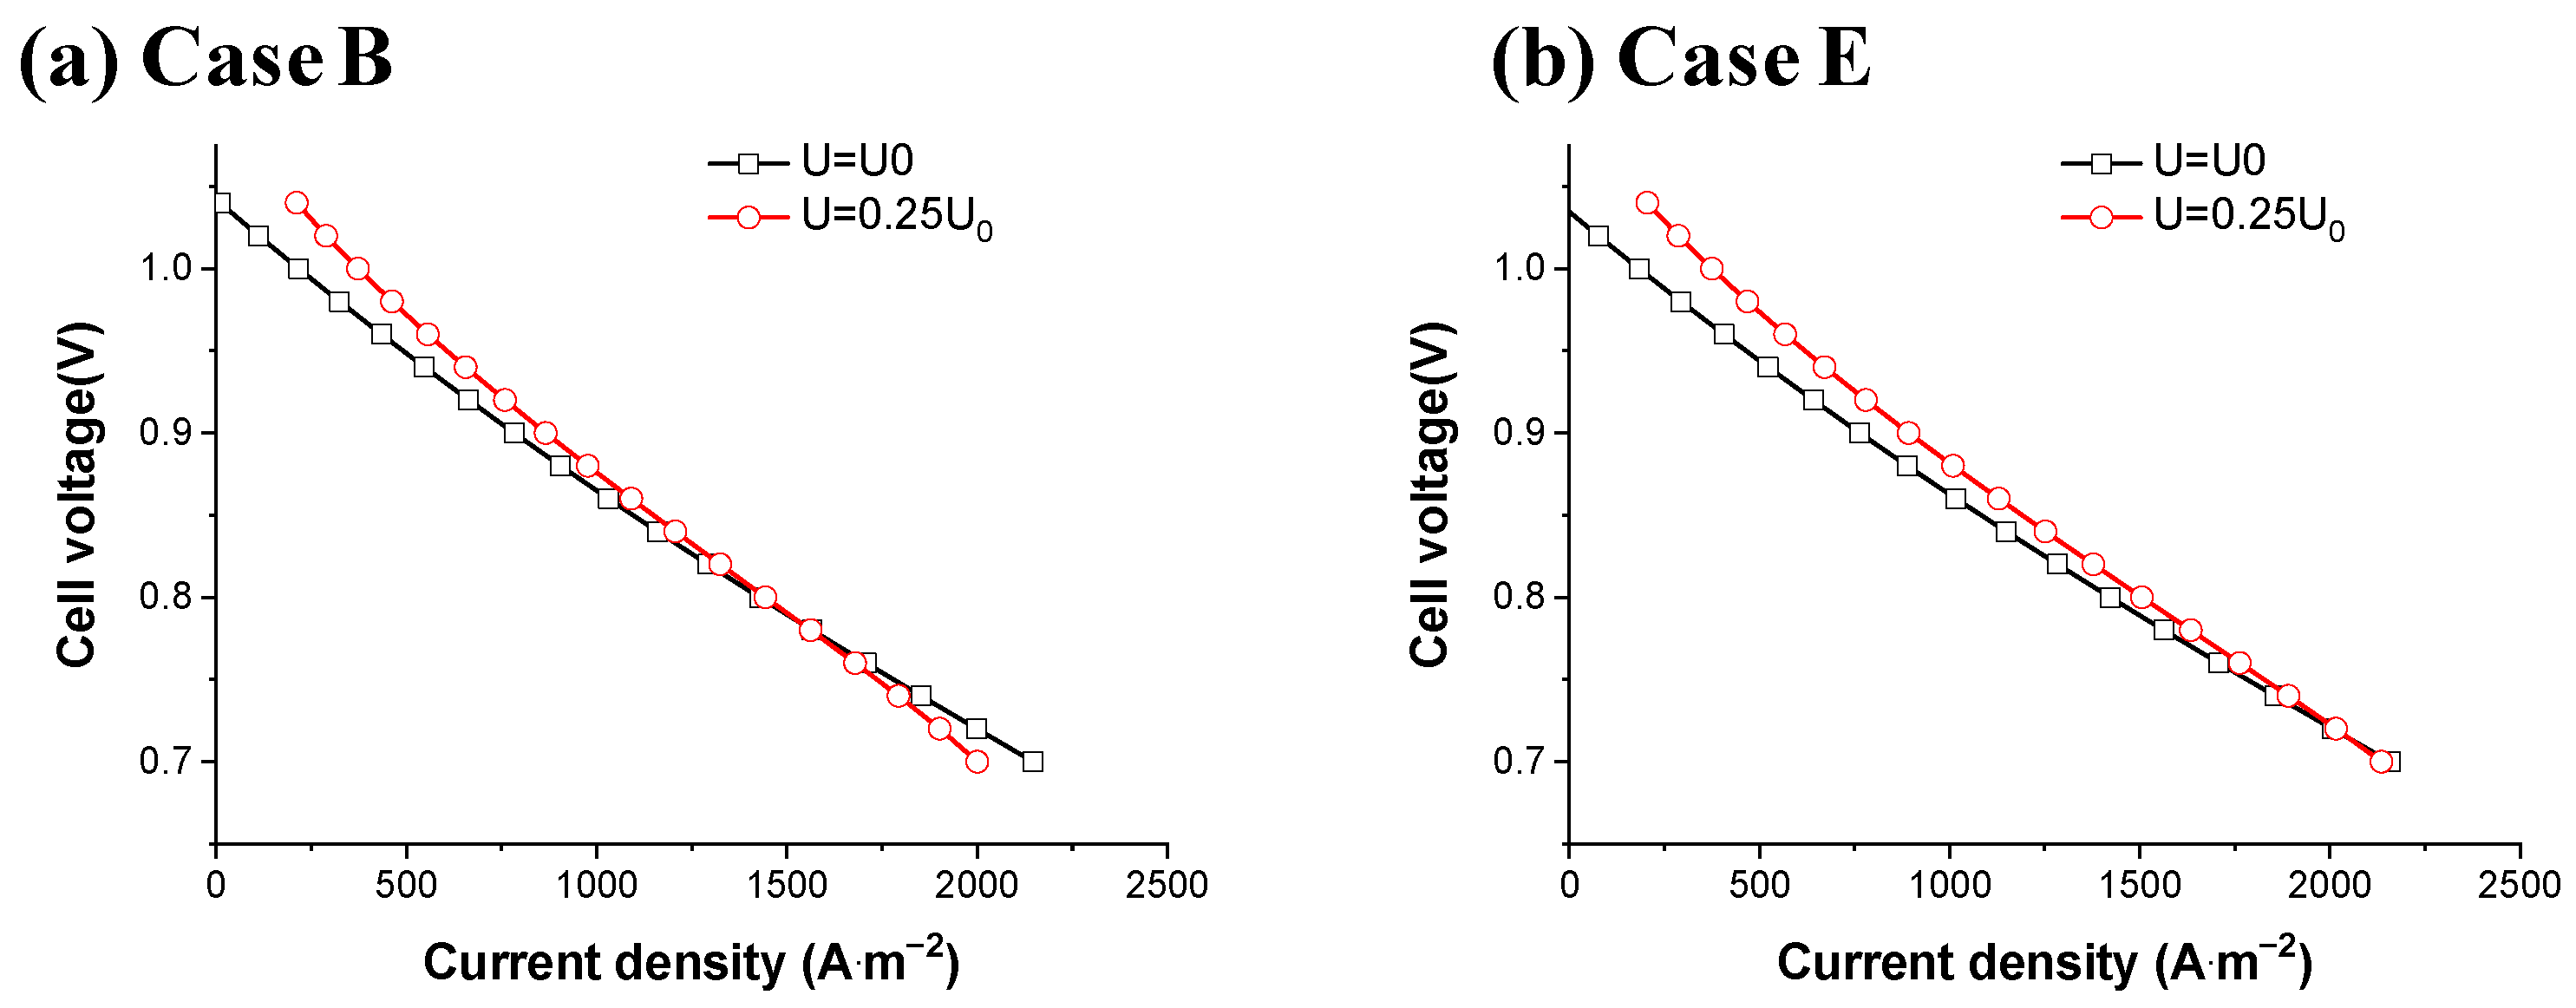
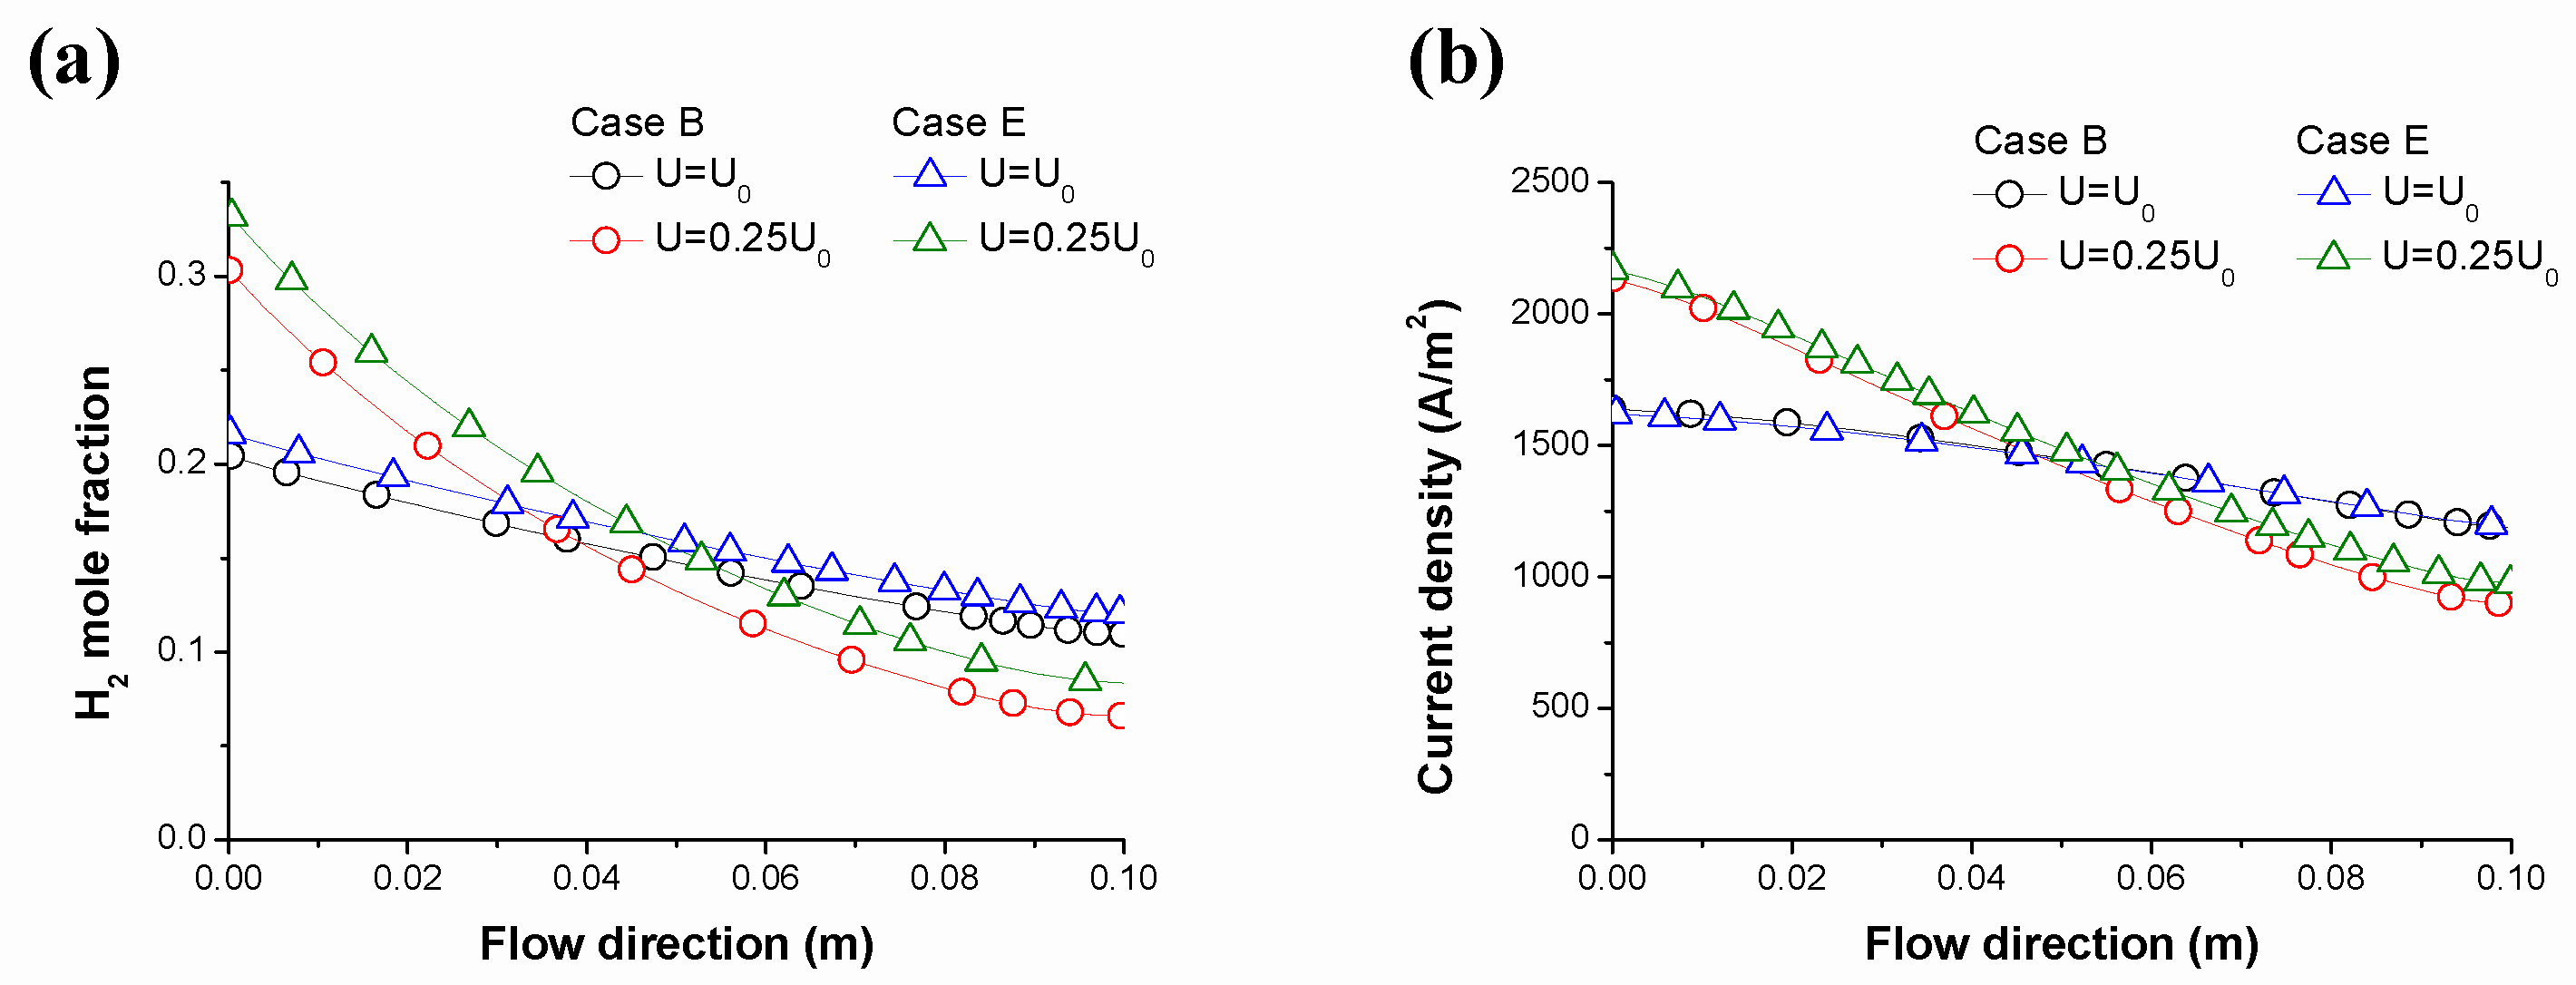
For the same gas composition, the reforming reaction became more active as the gas flow rate decreased. For this reason, the mole fraction of H2 and the current density increased at the inlet of the MCFC. However, the current density difference between the inlet and outlet decreased as the flow rate increased. Therefore, higher gas flow rates are advantageous for long-term operation;
(3)
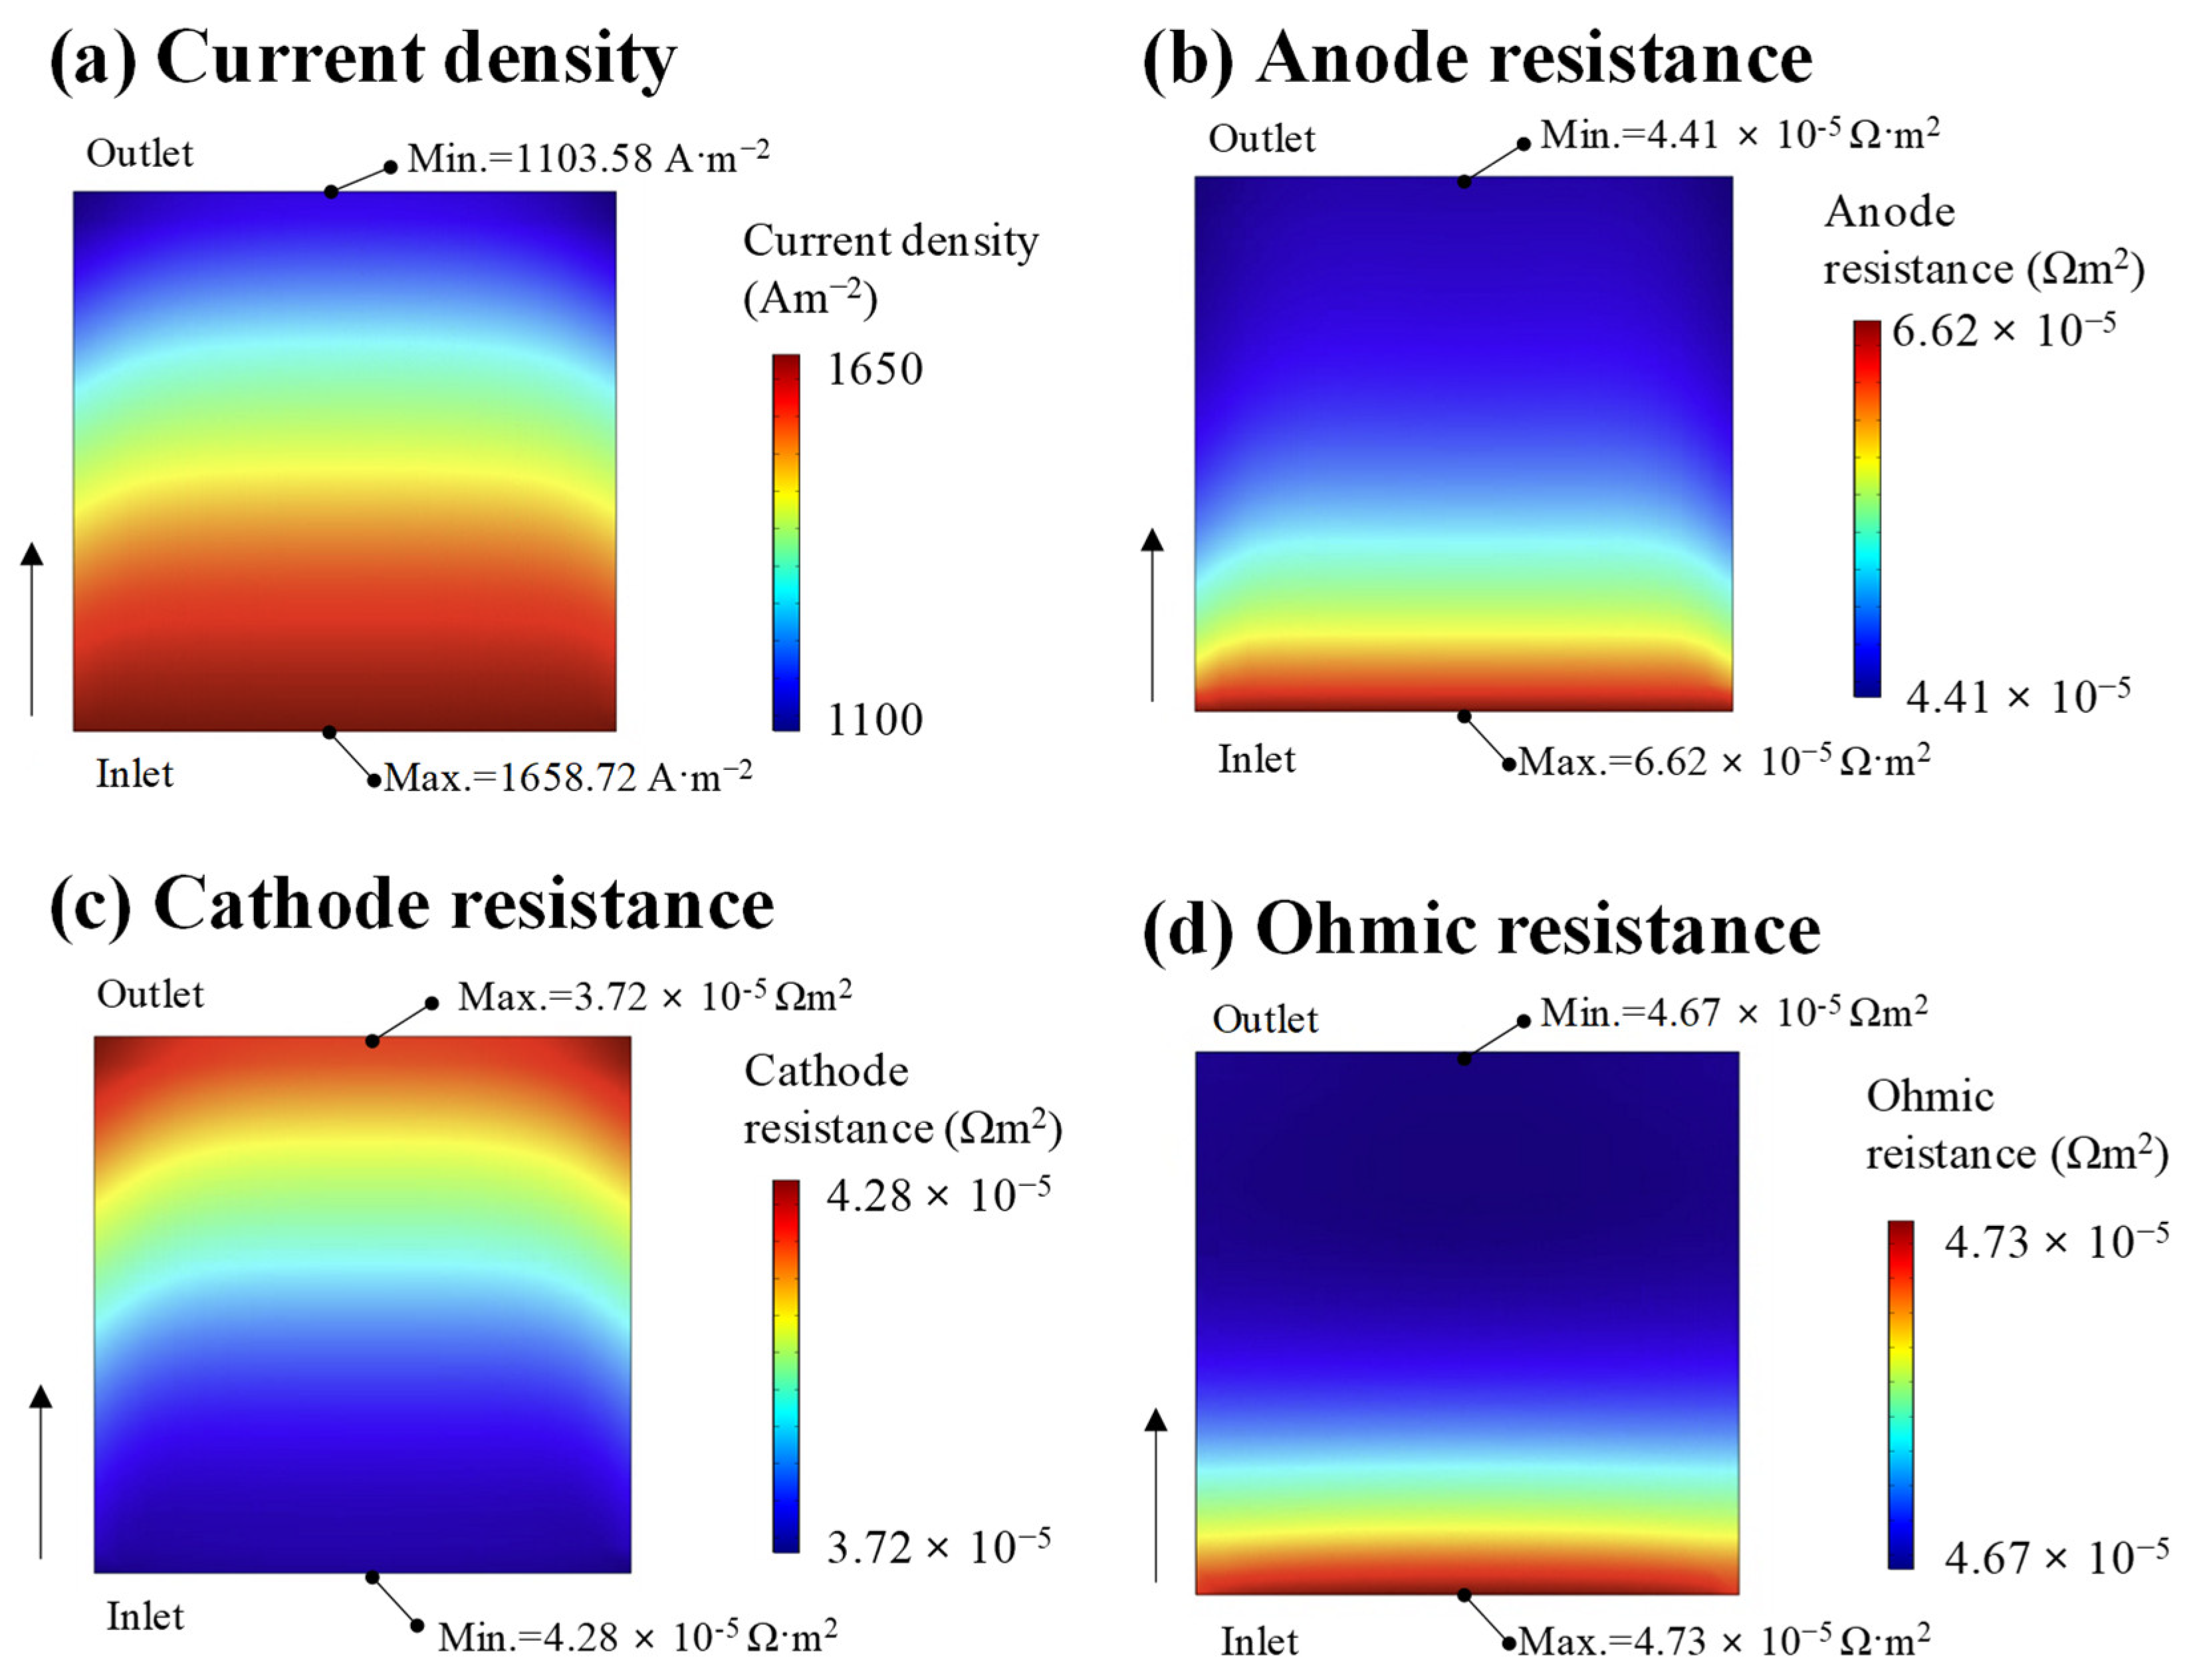
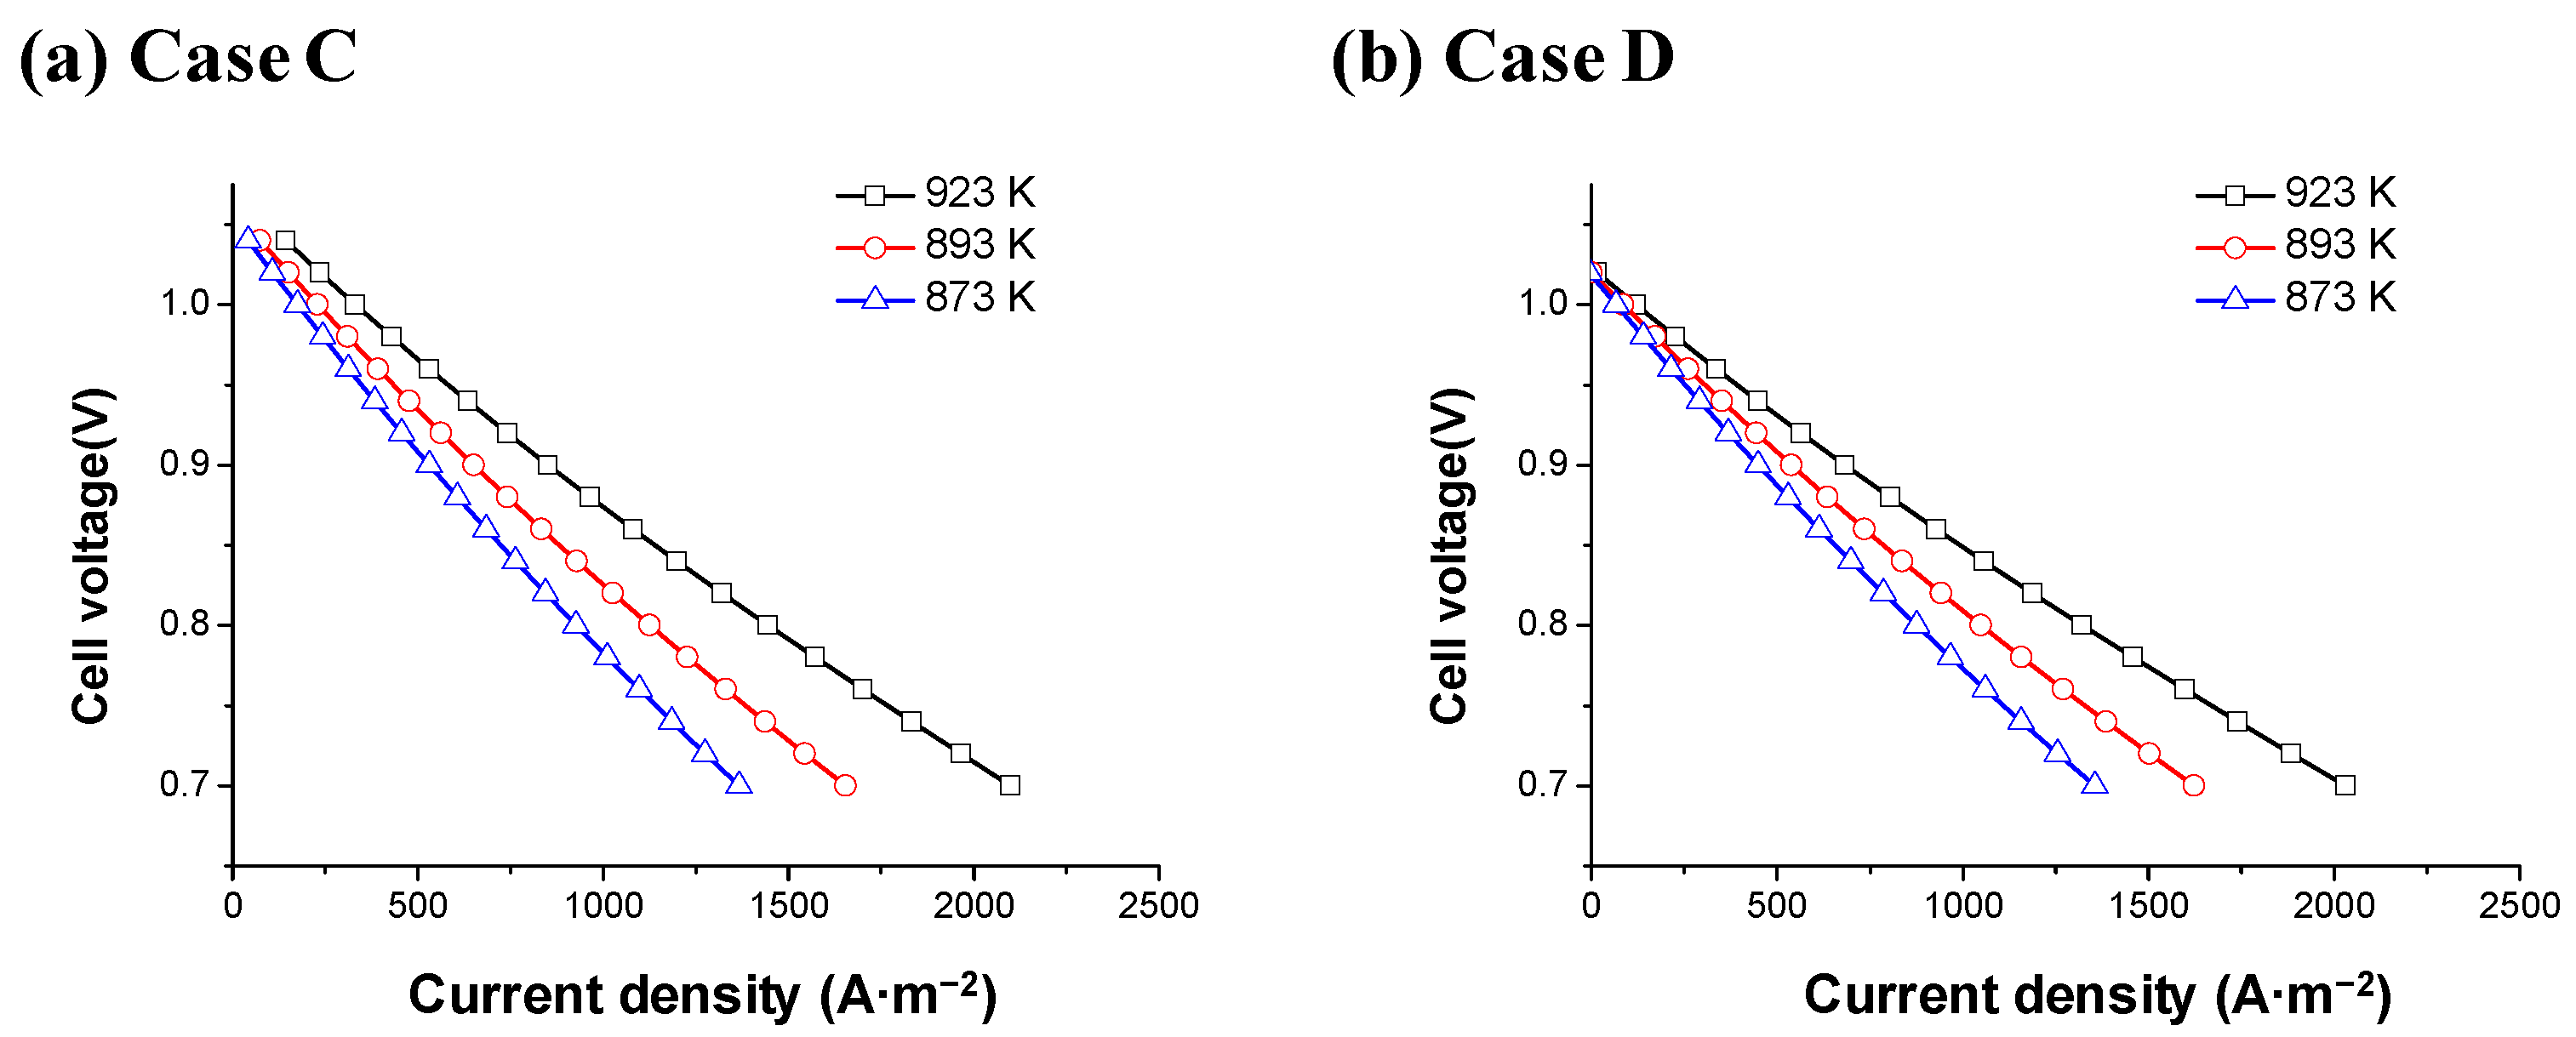
More H2 was produced as the operating temperature increased in the dry reformer. In addition, the activation resistance and ohmic resistance decreased as the operating temperature increased in the MCFC. Therefore, MCFCs must be operated at higher temperatures to improve their reforming efficiency and performance.

Author Contributions

Conceptualization, C.-W.L. and S.-P.Y.; methodology, Y.-B.J.; software, Y.-B.J. and K.-S.J.; investigation, K.-S.J. and J.-S.Y.; resources, J.-S.Y.; data curation, Y.-B.J.; writing—original draft preparation, Y.-B.J. and K.-S.J.; writing—review and editing, C.-W.L. and J.-S.Y.; funding acquisition, S.-P.Y. All authors have read and agreed to the published version of the manuscript.

Funding

This research was supported by the Renewable Energy R&D Program (No. 20213030040080) of the Korea Institute of Energy Technology Evaluation and Planning (KETEP).

Data Availability Statement

The data presented in this study are available upon request from the corresponding author. The data are not publicly available due to a policy with us.

Conflicts of Interest

K.S.-J. was employed by FCI. The remaining authors declare that the research was conducted in the absence of any commercial or financial relationships that could be construed as a potential conflict of interest.

Nomenclature

R i Reaction rate [ k m o l · k g 1 · s 1 ]
r i Reaction rate of gas component [ k m o l · k g 1 · s 1 ]
ρ c a t Density of catalyst [ k g · m 3 ]
η i Effectiveness factor [ - ]
K Correction factor [ - ]
V c e l l Cell voltage [ V ]
V N e r n s t Nernst voltage [ V ] ,
R A n o d e Resistance of anode [ V ]
R C a t h o d e Resistance of cathode [ V ]
R O h m i c Internal cell resistance [ V ]
K W G S Reaction rate of WGS [ - ]
q Velocity of mixture gas [ m · s 1 ]
k Permeability of porous media [ - ]
μ Coefficient of dynamic viscosity [ k g · m 1 · s 1 ]
L Length of porous media [ m ]
p Pressure drop of porous media [ P a ]
μ i Viscosity of gas component [ k g · m 1 · s 1 ]
T Temperature [ K ]
X i Mole fraction of gas component [ - ]
M i Molecular weight of gas component [ g · m o l 1 ]
w i Mass fraction of gas component [ - ]
D i T Thermal diffusion coefficient [ m 2 · s 1 ]
D i j Binary diffusivity of multicomponent [ m 2 · s 1 ]
v i Specific diffusion volume of component [ - ]
D e f f ,   i j Effective diffusivity of multicomponent [ m 2 · s 1 ]
ε Porosity of porous layer [ - ]
τ Tortuosity of porous layer [ - ]
k g a s Thermal conductivity of gas [ W · m 1 · K 1 ]
k m i x   Thermal conductivity of mixture gas [ W · m 1 · K 1 ]
C p Heat capacity of gas [ J · k g 1 · K 1 ]
C p , m i x Heat capacity of mixture gas [ J · k g 1 · K 1 ]
q r Heat energy of RWGS [ W ]

Appendix A

Table A1. Equations for reaction rates [30,31,32].
Reaction RateDefinition
r 1 k 1 K C O 2 K C H 4 P C O 2 P C H 4 1 + K C O 2 P C O 2 + K C H 4 P C H 4 2 × ( 1 ( P C O P H 2 ) 2 K P 1 P C H 4 P C O 2 )
r 2 k 2 K C O 2 , 2 K H 2 , 2 P H 2 P C O 2 1 + K C O 2 , 2 P C O 2 + K H 2 , 2 P H 2 2 × ( 1 P C O P H 2 O K P 2 P C O 2 P H 2 )
r 3 k 3 K C H 4 , 3 ( P C H 4 P H 2 2 K P 3 ) 1 + K C H 4 , 3 P C H 4 + P H 2 1.5 K H 2 , 3 2
r 4 k 4 K H 2 O , 4 ( P H 2 o P H 2 P C O K P 4 ) 1 + K C H 4 , 4 P C H 4 + P H 2 o K H 2 O , 4 P H 2 + P H 2 1.5 K H 2 , 4 2
r 5 k 5 K C O , 5 K C O 2 , 5 ( P C O 2 P C O P C O K P 5 ) 1 + K C O , 5 P C O + P C O 2 K C O 2 , 5 K C O , 5 P C O 2
Table A2. The thermodynamic and rate constants [29].
ParameterValueParameterValue
k 1 1.29   ×   10 6 exp ( 102,065 R T ) K H 2 O , 4 4.73   ×   10 6 exp ( 97,770 R T )
k 2 0.35   ×   10 6 exp ( 81,030 R T ) K C H 4 , 4 3.49 exp ( 0 R T )
k 3 6.95   ×   10 3 exp ( 58,893 R T ) K H 2 , 4 1.83   ×   10 13 exp ( 216,145 R T )
k 4 5.55   ×   10 9 exp ( 166,397 R T ) K C O , 5 7.34   ×   10 6 exp ( 100,395 R T )
k 5 1.34   ×   10 15 exp ( 243,835 R T ) K C O 2 , 5 2.81   ×   10 7 exp ( 104,085 R T )
K C O 2 , 1 2.61   ×   10 2 exp ( 37,641 R T ) K P 1 6.78   ×   10 14 exp ( 259,660 R T )
K C H 4 , 1 2.60   ×   10 2 exp ( 40,684 R T ) K P 2 56.4971 exp ( 36,580 R T )
K C O 2 , 2 5.77   ×   10 exp ( 9262 R T ) K P 3 2.98   ×   10 5 exp ( 84,400 R T )
K H 2 , 2 1.494 exp ( 6025 R T ) K P 4 1.3827   ×   10 7 exp ( 125,916 R T )
K C H 4 , 3 0.21 exp ( 567 R T ) K P 5 1.9393   ×   10 9 exp ( 168,527 R T )
K H 2 , 3 5.18   ×   10 7 exp ( 133,210 R T )
Table A3. Fitting parameters for the viscosity [38].
SpeciesAμBμCμ
CH43.8440.401−1.43 ×   10 4
CO211.3360.499−1.09 ×   10 4
N242.6060.475−9.88 ×   10 5
CO23.8110.539−1.54 ×   10 4
H227.7580.212−3.28 ×   10 5
O244.2240.562−1.13 ×   10 4
H2O−32.8260.429−1.62 ×   10 5
Table A4. Diffusion volumes [13].
Diffusion Volumes
C15.9O6.11
H2.31N4.54
H26.12CO226.9
N218.5CO18.0
O216.3H2O13.1
Table A5. Fitting parameters for the thermal conductivity of gases [41].
SpeciesAkBkCk
CH4−0.009351.40 ×   10 4 3.32 ×   10 8
CO2−0.011831.02 ×   10 4 −2.22 ×   10 8
N20.003097.59 ×   10 5 −1.10 ×   10 8
CO0.01508.27 ×   10 5 −1.91 ×   10 8
H20.03954.59 ×   10 4 −6.49 ×   10 8
O20.001218.62 ×   10 5 −1.33 ×   10 8
H2O0.000534.71 ×   10 5 4.96 ×   10 8
Table A6. Fitting parameters for the heat capacity of gases [38].
SpeciesACBCCCDCEC
CH434.942−4.00 ×   10 2 1.92 ×   10 4 1.53 ×   10 7 3.93 ×   10 11
CO227.4374.23 ×   10 2 −1.96 ×   10 5 4.00 ×   10 9 −2.99 ×   10 13
N229.342−3.54 ×   10 3 1.01 ×   10 5 −4.31 ×   10 9 2.59 ×   10 13
CO29.556−6.58 ×   10 3 2.10 ×   10 5 −1.22 ×   10 9 2.26 ×   10 12
H225.3992.02 ×   10 3 −3.85 ×   10 5 −3.19 ×   10 8 8.76 ×   10 12
O229.526−8.90 ×   10 3 3.81 ×   10 5 −3.26 ×   10 8 8.86 ×   10 12
H2O33.933−8.42 ×   10 3 2.99 ×   10 5 −1.78 ×     10 8 3.69 ×     10 12

References

  1. Dicks, A.L. Hydrogen generation from natural gas for the fuel cell systems of tomorrow. J. Power Sources 1996, 61, 113–124. [Google Scholar] [CrossRef]
  2. Slinn, M.; Kendall, K.; Mallon, C.; Andrews, J. Steam reforming of biodiesel by-product to make renewable hydrogen. Bioresour. Technol. 2008, 99, 5851–5858. [Google Scholar] [CrossRef] [PubMed]
  3. Ahn, S.-Y.; Kim, K.-J.; Kim, B.-J.; Hong, G.-R.; Jang, W.-J.; Bae, J.W.; Park, Y.-K.; Jeon, B.-H.; Roh, H.-S. From gray to blue hydrogen: Trends and forecasts of catalysts and sorbents for unit process. Renew. Sustain. Energy Rev. 2023, 186, 113635. [Google Scholar] [CrossRef]
  4. Ming, Q.; Healey, T.; Allen, L.; Irving, P. Steam reforming of hydrocarbon fuels. Catal. Today 2002, 77, 51–64. [Google Scholar] [CrossRef]
  5. Takeguchi, T.; Kani, Y.; Yano, T.; Kikuchi, R.; Eguchi, K.; Tsujimoto, K.; Uchida, Y.; Ueno, A.; Omoshiki, K.; Aizawa, M. Study on steam reforming of CH4 and C2 hydrocarbons and carbon deposition on Ni-YSZ cermets. J. Power Sources 2002, 112, 588–595. [Google Scholar] [CrossRef]
  6. Gao, J.; Hou, Z.; Lou, H.; Zheng, X. Chapter 7—Dry (CO2) Reforming. In Fuel Cells: Technologies for Fuel Processing; Shekhawat, D., Spivey, J.J., Berry, D.A., Eds.; Elsevier: Amsterdam, The Netherlands, 2011; pp. 191–221. [Google Scholar]
  7. Usman, M.; Wan Daud, W.M.A.; Abbas, H.F. Dry reforming of methane: Influence of process parameters—A review. Renew. Sustain. Energy Rev. 2015, 45, 710–744. [Google Scholar] [CrossRef]
  8. Jang, W.-J.; Shim, J.-O.; Kim, H.-M.; Yoo, S.-Y.; Roh, H.-S. A review on dry reforming of methane in aspect of catalytic properties. Catal. Today 2019, 324, 15–26. [Google Scholar] [CrossRef]
  9. Guczi, L.; Stefler, G.; Geszti, O.; Sajó, I.; Pászti, Z.; Tompos, A.; Schay, Z. Methane dry reforming with CO2: A study on surface carbon species. Appl. Catal. A Gen. 2010, 375, 236–246. [Google Scholar] [CrossRef]
  10. Kim, G.S.; Lee, B.Y.; Ham, H.C.; Han, J.; Nam, S.W.; Moon, J.; Yoon, S.P. Highly active and stable Sr0.92Y0.08Ti1−xRuxO3−d in dry reforming for hydrogen production. Int. J. Hydrogen Energy 2019, 44, 202–212. [Google Scholar] [CrossRef]
  11. Lee, B.; Lee, S.; Lim, H. Numerical modeling studies for a methane dry reforming in a membrane reactor. J. Nat. Gas Sci. Eng. 2016, 34, 1251–1261. [Google Scholar] [CrossRef]
  12. Wehinger, G.D.; Eppinger, T.; Kraume, M. Detailed numerical simulations of catalytic fixed-bed reactors: Heterogeneous dry reforming of methane. Chem. Eng. Sci. 2015, 122, 197–209. [Google Scholar] [CrossRef]
  13. Jun, Y.-B.; Park, J.-H.; Kim, H.-S.; Jung, K.-S.; Yoon, S.-P.; Lee, C.-W. A simulation model for ruthenium-catalyzed dry reforming of methane (DRM) at different temperatures and gas compositions. Int. J. Hydrogen Energy 2024, 49, 786–797. [Google Scholar] [CrossRef]
  14. Tomczyk, P. MCFC versus other fuel cells—Characteristics, technologies and prospects. J. Power Sources 2006, 160, 858–862. [Google Scholar] [CrossRef]
  15. Randström, S.; Lagergren, C.; Capobianco, P. Corrosion of anode current collectors in molten carbonate fuel cells. J. Power Sources 2006, 160, 782–788. [Google Scholar] [CrossRef]
  16. Kulkarni, A.; Giddey, S. Materials issues and recent developments in molten carbonate fuel cells. J. Solid State Electrochem. 2012, 16, 3123–3146. [Google Scholar] [CrossRef]
  17. Pfafferodt, M.; Heidebrecht, P.; Sundmacher, K.; Würtenberger, U.; Bednarz, M. Multiscale Simulation of the Indirect Internal Reforming Unit (IIR) in a Molten Carbonate Fuel Cell (MCFC). Ind. Eng. Chem. Res. 2008, 47, 4332–4341. [Google Scholar] [CrossRef]
  18. Freni, S. Rh based catalysts for indirect internal reforming ethanol applications in molten carbonate fuel cells. J. Power Sources 2001, 94, 14–19. [Google Scholar] [CrossRef]
  19. Freni, S.; Maggio, G. Energy balance of different internal reforming MCFC configurations. Int. J. Energy Res. 1997, 21, 253–264. [Google Scholar] [CrossRef]
  20. Jarchlouei, M.A.; Chitsaz, A.; Mahmoudi, S.M.S.; Rosen, M.A.; Bafekr, S.H. Gibbs energy minimization using Lagrange method of undetermined multipliers for electrochemical and thermodynamic modeling of a MCFC with internal steam reforming. Energy Convers. Manag. 2021, 228, 113594. [Google Scholar] [CrossRef]
  21. Szablowski, L.; Dybinski, O.; Szczesniak, A.; Milewski, J. Mathematical Model of Steam Reforming in the Anode Channel of a Molten Carbonate Fuel Cell. Energies 2022, 15, 608. [Google Scholar] [CrossRef]
  22. d’Amore, F.; Pereira, L.M.C.; Campanari, S.; Gazzani, M.; Romano, M.C. A novel process for CO2 capture from steam methane reformer with molten carbonate fuel cell. Int. J. Hydrogen Energy 2023, 48, 37366–37384. [Google Scholar] [CrossRef]
  23. Chitsaz, A.; Bafekr, S.H.; Holagh, S.G. Exergy and environmental assessments of the performance of a molten carbonate fuel cell cogeneration plant: External steam reforming against internal steam reforming. Fuel Commun. 2023, 16, 100092. [Google Scholar] [CrossRef]
  24. Di Carlo, A.; Bocci, E.; Dell’Era, A. Comparison by the use of numerical simulation of a MCFC-IR and a MCFC-ER when used with syngas obtained by atmospheric pressure biomass gasification. Int. J. Hydrogen Energy 2011, 36, 7976–7984. [Google Scholar] [CrossRef]
  25. Kim, Y.J.; Lee, M.C. Comparison of thermal performances of external and internal reforming molten carbonate fuel cells using numerical analyses. Int. J. Hydrogen Energy 2017, 42, 3510–3520. [Google Scholar] [CrossRef]
  26. Jung, K.-S.; Zhang, K.; Lee, C.-W. Simulation of Internal Manifold-Type Molten Carbonate Fuel Cells (MCFCs) with Different Operating Conditions. Energies 2023, 16, 2700. [Google Scholar] [CrossRef]
  27. Freni, S.; Maggio, G.; Cavallaro, S. Ethanol steam reforming in a molten carbonate fuel cell: A thermodynamic approach. J. Power Sources 1996, 62, 67–73. [Google Scholar] [CrossRef]
  28. Leto, L.; Dispenza, C.; Moreno, A.; Calabrò, A. Simulation model of a molten carbonate fuel cell–microturbine hybrid system. Appl. Therm. Eng. 2011, 31, 1263–1271. [Google Scholar] [CrossRef]
  29. Benguerba, Y.; Dehimi, L.; Virginie, M.; Dumas, C.; Ernst, B. Modelling of methane dry reforming over Ni/Al2O3 catalyst in a fixed-bed catalytic reactor. React. Kinet. Mech. Catal. 2015, 114, 109–119. [Google Scholar] [CrossRef]
  30. Richardson, J.T.; Paripatyadar, S.A. Carbon dioxide reforming of methane with supported rhodium. Appl. Catal. 1990, 61, 293–309. [Google Scholar] [CrossRef]
  31. Snoeck, J.W.; Froment, G.F.; Fowles, M. Steam/CO2 Reforming of Methane. Carbon Filament Formation by the Boudouard Reaction and Gasification by CO2, by H2, and by Steam: Kinetic Study. Ind. Eng. Chem. Res. 2002, 41, 4252–4265. [Google Scholar] [CrossRef]
  32. Snoeck, J.W.; Froment, G.F.; Fowles, M. Kinetic Study of the Carbon Filament Formation by Methane Cracking on a Nickel Catalyst. J. Catal. 1997, 169, 250–262. [Google Scholar] [CrossRef]
  33. De Groote, A.M.; Froment, G.F. Simulation of the catalytic partial oxidation of methane to synthesis gas. Appl. Catal. A Gen. 1996, 138, 245–264. [Google Scholar] [CrossRef]
  34. Wolf, T.L.; Wilemski, G. Molten Carbonate Fuel Cell Performance Model. J. Electrochem. Soc. 1983, 130, 48. [Google Scholar] [CrossRef]
  35. Yuh, C.Y.; Selman, J.R. The Polarization of Molten Carbonate Fuel Cell Electrodes: I. Analysis of Steady-State Polarization Data. J. Electrochem. Soc. 1991, 138, 3642. [Google Scholar] [CrossRef]
  36. Kim, Y.J.; Chang, I.G.; Lee, T.W.; Chung, M.K. Effects of relative gas flow direction in the anode and cathode on the performance characteristics of a Molten Carbonate Fuel Cell. Fuel 2010, 89, 1019–1028. [Google Scholar] [CrossRef]
  37. Murmura, M.A.; Cerbelli, S.; Annesini, M.C. An equilibrium theory for catalytic steam reforming in membrane reactors. Chem. Eng. Sci. 2017, 160, 291–303. [Google Scholar] [CrossRef]
  38. Yaws, C.L. Chemical Properties Handbook, 1st ed.; McGraw-Hill Education: New York, NY, USA, 1999. [Google Scholar]
  39. Carr, N.L.; Kobayashi, R.; Burrows, D.B. Viscosity of Hydrocarbon Gases Under Pressure. J. Pet. Technol. 1954, 6, 47–55. [Google Scholar] [CrossRef]
  40. Aydın, Ö.; Kubota, A.; Tran, D.L.; Sakamoto, M.; Shiratori, Y. Designing graded catalytic domain to homogenize temperature distribution while dry reforming of CH4. Int. J. Hydrogen Energy 2018, 43, 17431–17443. [Google Scholar] [CrossRef]
  41. Mason, E.A.; Saxena, S.C. Approximate Formula for the Thermal Conductivity of Gas Mixtures. Phys. Fluids 1958, 1, 361–369. [Google Scholar] [CrossRef]
  42. Lee, S.-J.; Lim, C.-Y.; Lee, C.-W. Design of Cell Frame Structure of Unit Cell for Molten Carbonate Fuel Cell Using CFD Analysis. Trans. Korean Hydrog. New Energy Soc. 2018, 29, 56–63. [Google Scholar] [CrossRef]
  43. Lu, Y.; Jia, D.; Gao, F.; Hu, T.; Chen, Z. First-principle calculations of the thermal properties of SrTiO3 and SrO(SrTiO3)n (n = 1, 2). Solid State Commun. 2015, 201, 25–30. [Google Scholar] [CrossRef]
  44. Lee, C.-W.; Lee, M.; Lee, M.-J.; Chang, S.-C.; Yoon, S.-P.; Ham, H.C.; Han, J. Effect of the flow directions on a 100 cm2 MCFC single cell with internal flow channels. Int. J. Hydrogen Energy 2016, 41, 18747–18760. [Google Scholar] [CrossRef]
  45. Rexed, I. Applications for Molten Carbonate Fuel Cells. Ph.D. Thesis, KTH Royal Institute of Technology, Stockholm, Sweden, 2014. [Google Scholar]
Figure 1. Schematic of DR-MCFC.
Energies 18 01863 g001
Figure 2. Schematic of the experimental set-up for the DR-MCFC.
Energies 18 01863 g002
Figure 3. Schematic of dry reforming reactor and MCFC for the CFD simulation.
Energies 18 01863 g003
Figure 4. Simulation results of the dry reforming reactor with the operating conditions of Top = 923 K and U = 6 × 10⁻⁵ m3·s of Case A: (a) CH4 mole fraction, (b) H2 mole fraction, and (c) temperature distribution.
Energies 18 01863 g004
Figure 5. Mole fraction of chemical species of MCFC along the flow direction of Case 2 with the operating conditions of Top = 923 K, U = 6 × 10⁻⁵ m3·s−1, and Vcell = 0.8 V. (a) Distribution of the mole fractions in the anode side and (b) Distribution of the mole fractions in the cathode side.
Energies 18 01863 g005
Figure 6. I–V curve by case with the operating conditions of Top = 923 K, U = 6 × 10⁻⁵ m3·s−1, and the I-V curve of the conventional MCFC at 923 K.
Energies 18 01863 g006
Figure 7. Simulation results of Top = 923 K, U = 6 × 10⁻⁵ m3·s−1, and the gas condition of Case A; (a) current density, (b) anode resistance, (c) cathode resistance, and (d) ohmic resistance distributions. (The arrow means the gas flow direction).
Energies 18 01863 g007
Figure 8. I–V curve according to changing flow rate at different flow rates with the operating conditions of Top = 923 K: (a) Case B and (b) Case E.
Energies 18 01863 g008
Figure 9. H2 mole fraction with the different flow rates under different operating conditions of U0 = 6 × 10⁻⁵ m3·s−1, Top = 923 K, and Vcell = 0.8 V: (a,b) Case B and (c,d) Case E. (The arrow means the gas flow direction).
Energies 18 01863 g009
Figure 10. Current density distribution under different operating conditions of U0 = 6 × 10⁻⁵ m3·s−1, Top = 923 K, and Vcell = 0.8 V: (a,b) Case B and (c,d) Case E. (The arrow means the gas flow direction).
Energies 18 01863 g010
Figure 11. Simulation results with different flow rates (U) under the operating conditions of Top = 923 K and Vcell = 0.8 V: (a) Distribution of H2 mole fraction along the flow direction of Cases B and E and (b) distribution of the current density along the flow direction of Cases B and E.
Energies 18 01863 g011
Figure 12. I–V curve according to gas flow rate at U0 = 6 × 10⁻⁵ m3·s−1: (a) Case C; (b) Case D.
Energies 18 01863 g012
Figure 13. H2 mole fraction with the different operating temperatures at U0 = 6 × 10⁻⁵ m3·s−1 and Vcell = 0.8 V: (a,b) Case C and (c,d) Case D. (The arrow means the gas flow direction).
Energies 18 01863 g013
Figure 14. Current density distribution with the different flow rate at U0 = 6 × 10⁻⁵ m3·s−1 and Vcell = 0.8 V: (a,b) Case C and (c,d) Case D.
Energies 18 01863 g014
Figure 15. Simulation results with different operating temperatures (Top) under the operating conditions of U0 = 6 × 10⁻⁵ m3·s−1 and Vcell = 0.8 V: (a) Distribution of H2 mole fraction along the flow direction of Case C and (b) distribution of the current density along the flow direction of Case D.
Energies 18 01863 g015
Table 1. Operating results of MCFCs under various conditions.
Fuel TypeCurrent DensityCell VoltageOperating TemperatureCell AreaReference
Direct H21200 A·m−20.83 V921 K
(Average)
Not available[24]
Direct H21200 A·m−20.826 V843 K1 m2[25]
Direct H21805.7 A·m−20.8 V
(Single cell)
923 K0.01 m2[26]
Ethanol Reforming1900 A·m−20.578 V923 KUnit area[27]
Steam Reforming1900 A·m−20.526 V923 KUnit area[27]
Steam Reforming1380 A·m−20.8 V905 K
(Average)
Not available[24]
Steam Reforming1550 A·m−20.793 V893 K0.771 m2[28]
Steam Reforming1200 A·m−20.799 V843 K1 m2[25]
Steam Reforming1100 A·m−20.775 V923 K0.01 m2[20]
Steam Reforming100 A·m−2
(Approximate value)
0.8 V
(Single cell)
923 K0.002025 m2[21]
Steam Reforming1100 A·m−20.834 V923 K0.01 m2[23]
Steam Reforming1481 A·m−20.78 V923 K0.0647 m2[26]
Table 2. Reaction fluxes of reactive gases in the dry reforming process.
SpeciesReaction Fluxes
H2 r H 2 = 2 R 1 R 2 + 2 R 3 + R 4
H2O r H 2 O = R 2 R 4
CH4 r C H 4 = R 1 R 3
CO r C O = 2 R 1 + R 2 + R 4 + 2 R 5
CO2 r C O 2 = R 1 R 2 R 5
C r C = R 3 R 4 R 5
Table 3. Thermal properties of the anode and the cathode in the molten carbonate fuel cell.
PropertiesSS316LAnode
(Ni-Cr Alloy)
Cathode
(Nickel Oxide)
Electrolyte (Li/K)2CO3
Density
[kg·m−3]
8000822067941914
Heat Capacity
[J·mol−1·K−1]
50044444,3524000
Thermal conductivity
[W·m−1·K−1]
25255.52
Porosity0.70.60.7-
Table 4. Simulation conditions of DR-MCFC.
VariableSpecification
Fuel gas composition
(CH4:CO2:N2)
Case A0.25:0.25:0.5
Case B0.33:0.33:0.33
Case C0.4:0.2:0.4
Case D0.2:0.4:0.4
Case E0.4:0.4:0.2
Operating temperature (Top)873, 893, and 923 K
Gas flow rate (U)6 × 10⁻⁵ m3·s−1
Operating pressure1.013 × 105 Pa
Cathode gas compositionAir/CO2 = 0.7:0.3
Table 5. Mole fraction of anode with the operating conditions of Top = 923 K and U = 6 × 10⁻⁵ m3·s−1.
CH4CO2N2COH2H2O
Case A0.0870.0870.3570.1840.1850.1
Case B0.1300.1310.2300.2040.2050.1
Case C0.1980.0550.2850.1800.1810.1
Case D0.0500.1930.2830.1870.1880.1
Case E0.1660.1670.1340.2160.2140.1
Table 6. The performance of MCFC under different operating conditions.
Case ACase BCase CCase DCase EConventional MCFC
OCV (V)1.0581.0421.0801.0221.0341.064
Average current density at 0.8 V (A·m−2)1420.51427.71444.91321.51422.21805.7
Table 7. The polarization percentages of the MCFC at the cell voltage of 0.8 V under different operating conditions.
Case ACase BCase CCase DCase EConventional MCFC
Nernst loss23.3%21.8%24.8%21.0%20.8%18.7%
Anode polarization28.6%27.3%29.2%27.7%26.5%14.8%
Cathode polarization21.9%23.2%21.1%23.4%24.1%31.5%
Ohmic loss26.2%27.7%25.0%28.0%28.6%35.0%
Disclaimer/Publisher’s Note: The statements, opinions and data contained in all publications are solely those of the individual author(s) and contributor(s) and not of MDPI and/or the editor(s). MDPI and/or the editor(s) disclaim responsibility for any injury to people or property resulting from any ideas, methods, instructions or products referred to in the content.

