Perspective

Challenges and Opportunities of the Dynamic Operation of PEM Water Electrolyzers

1
Department of Physical Chemistry and Materials Science, University of Szeged, Rerrich Square 1, 6720 Szeged, Hungary
2
Interdisciplinary Excellence Center, University of Szeged, Dugonics Sq. 13, 6720 Szeged, Hungary
3
Bükkábrányi Fotovoltaikus Erőmű Projekt Kft, Váci utca 38, 1056 Budapest, Hungary
*
Authors to whom correspondence should be addressed.
Energies 2025, 18(9), 2154; https://doi.org/10.3390/en18092154
Submission received: 19 March 2025 / Revised: 15 April 2025 / Accepted: 19 April 2025 / Published: 23 April 2025
(This article belongs to the Section A5: Hydrogen Energy)

Abstract

:
Hydrogen is expected to play an important role in decarbonizing different heavy industries and the transportation sector. Water electrolysis is, therefore, one of the most rapidly spreading energy technologies, with PEM electrolyzers taking a continuously increasing share in the technology mix. Most often, the aim is to form green hydrogen, utilizing electricity exclusively of renewable origin. The intermittency of such sources, however, poses several technological challenges and financial questions. Focusing on PEM electrolyzers, we discuss the effect of pressure, temperature, and reaction rate changes, induced by the intermittent operation, and general thoughts regarding system component erosion caused by the regular start–stop cycles are also considered. As a case study, we present a high-level techno-economic analysis of data from a pilot 1 MW PEM electrolysis system, coupled to a 20 MW PV farm, deployed in Hungary. We underscore the importance of the often overlooked local regulations and financial incentives, which strongly influence the most beneficial operation scenario.

1. Introduction

When highlighting the benefits of water electrolyzers, the possibility of dynamic operation is often an important claim. This renders water electrolysis, and proton exchange water electrolysis (PEMWE) in particular, an attractive solution for storing intermittently available renewable electricity, produced by photovoltaic or wind farms. Balancing the electrical grid is one of the most important bottlenecks of the transition from fossil fuel-based energy production to renewable electricity sources, limiting the further penetration of these technologies [1,2]. PEMWE is a complementary technology to (Li-ion) batteries in large-scale and long-term energy storage [3]. However, there is a lack of unambiguous scientific/technological evidence that PEMWE systems can withstand very dynamic [4] and even grid-independent operation conditions without any significant loss in performance/lifetime.
Currently, most water electrolyzer plants operate directly from the main electrical grid, while the associated renewable electricity plant is also connected to this; hence, the two technologies are integrated indirectly, mostly just in terms of finances. Many other coupling options can be envisioned (Figure 1), including the direct supply of the PEMWE system from the renewable energy source (via a proper DC/DC converter device, if needed); this could be defined as the grid-independent island operation of the whole system. This way, the fluctuations in renewable power production directly affect electrolyzer performance. To buffer these effects, integration of (small) charge storage device(s) or multiple inversion/transformation of the produced electricity can be envisioned (to ensure PEMWE operation under constant conditions), but these steps are usually associated with energy losses and additional system cost and complexity.
We formulate the question (that will define which route further development takes) of this perspective directly: is it financially/technologically beneficial to operate PEMWE systems dynamically and directly coupled to renewable energy sources? Do we possess enough data to answer this question?
An alternative is to run PEMWE at constant or slowly varied current densities in systems with a direct connection to the electrical grid or containing properly sized charge storage devices (e.g., supercapacitors and/or batteries). We note that thorough review articles summarizing the most recent results on renewable energy-powered water electrolysis are available in the open literature [5,6,7,8]. In addition, our aim is not to provide a detailed cost comparison and techno-economic analysis, as it depends highly on location, local regulations, momentary electricity prices, the system power rating, and many other factors. We aim to highlight these avenues’ pros and cons (including some cost considerations) and summarize potential degradation mechanisms that the dynamic operation can facilitate. Furthermore, we aim to highlight the role of local regulations and financial incentives, which can both notably affect the most beneficial scenario.

2. What Is the Purpose of Dynamic Operation

There are different use cases for green hydrogen. One option is to use the water electrolysis systems only for power-clipping/down-regulation/scheduling to support the maintenance of the previously submitted power generation schedule [9,10]. Note that grid-balancing is performed based on this schedule. Therefore, electricity suppliers require precise schedules, and in the case of any deviations from this, the owner of the respective renewable energy plant is charged with notable penalties. If a given PV plant produces less electric energy than it was predicted to do, a positive regulatory need occurs, and if the real power generation exceeds the forecasted amount, a negative regulatory need emerges.
Several electricity utilization scenarios (e.g., scheduling only, combining renewable energy with grid electricity) can be envisioned. When evaluating the feasibility of these avenues, local regulations must also be considered, which are often neglected when establishing techno-economical models. Here, we will focus on feed-in-tariff (FIT), a system which is applied in many countries but with very different contents [11]. This implies that techno-economic models must always consider these according to the local regulations, which can affect finding the most financially beneficial operation mode.
As a specific example, in Hungary, an FIT is currently in effect. In this, the selling price (and amount) of PV electricity is fixed during the break-even period of the PV plant. This is typically only part of the total PV energy production, while the rest can either be sold on the free market or utilized for H2 generation. This means that in some cases (depending on the FIT and actual prices), it is financially beneficial to use electricity from the grid, while the produced renewable energy is fed to the grid. In our specific example, a 1 MW PEM electrolyzer is connected to a 22 MWp peak-power solar plant in Bükkábrány, Hungary. The following options are considered here to estimate the cost of the produced green hydrogen:
  • The PEMWE system is only used for scheduling.
  • All PV energy available for electrolysis is used for H2 production, calculated with the FIT price.
  • All PV energy available for electrolysis is used for H2 production, calculated with the open-market price.
  • The PEMWE system operates using grid electricity, while PV production is fed to the grid (FIT and free-market prices).
  • The PEMWE system is used for scheduling and also utilizes available PV production, calculated with the open-market price.
  • The PEMWE system is used for scheduling and available PV production is used for H2 production, calculated with the open-market price; in addition, energy is provided from the grid to maximize electrolyzer utilization.
Depending on the various options, the capacity factor (utilization rate) of the electrolyzer stack varies between 12 and 98%. Specifically, based on the theoretical limit of hydrogen production, i.e., if the PEMWE system could operate 24/7 at its rated current maximum, it would be able to produce a total of 157,680 kg of hydrogen annually (with an energy demand of 9,460,800 kWh). The maximum amount of electricity that can be used for electrolysis from the solar power plant was 3,757,047 kWh in 2020 (note the capacity factor of the PV plant, and the power rating of the electrolyzer), which translates to about 62,617 kg H2 in 2020. This also means that by using electricity from the solar power plant alone, the capacity utilization of the electrolyzer is only approximately 40% (although the power rating of the PV farm is more than 20 times larger).
The difference between the scheduled and actual production was 2,885,900 kWh in 2020. A notable penalty of ca. EUR 70,000 was paid based on this difference. Since the electrolyzer has a capacity of 1000 kW (and overproduction has exceeded this in many cases), the electrolyzer can cover approximately 1,145,767 kWh of the produced extra electricity. This translates to regulating capacity between 30 and 70% over the year, with a higher ratio in less sunny months (Figure 2). Based on these historical data, about 39.7% of the extra electricity produced (compared to the schedule) could be used for hydrogen production over the year. Therefore, if only electricity for cut-off purposes is used for electrolysis, the electrolyzer can produce 19,096 kg with an annual capacity factor of 12.11%. The capacity factor increases drastically if grid electricity is also used. We assume a 98% capacity factor here, as production will not be affected by weather conditions or time of day (only the down-time due to regular maintenance is considered).
We carried out a techno-economic analysis of the facility, which takes into account all technological and economic parameters and other circumstances that affect the calculation of the cost of hydrogen produced (see the details in the Supplementary Materials). In our model, the technological and economic parameters determined were divided into three groups based on their validity: empirical, derived from the literature, and estimated. For the capital cost, the total project cost is included (note that this is a pilot project; therefore, costs are higher than what would be expected at larger scales and in serial deployment). In addition to the available solar power plant data from the previous year and market electricity costs, we took into account relevant data from other similar hydrogen production models and supplemented the missing elements with approximate estimates based on our assumptions.
In the different scenarios, the cost of green hydrogen produced in the Bükkábrány Pilot Plant ranges from 10.22 to 35.89 EUR/kg H2 (Table 1) depending on the operating protocol and the quantity produced. The cost is lowest in the combination cases; therefore, in addition to scheduling and the performance obligation of the energy park included in the contract of feed-in-tariff (FIT), it is definitely worth spending part of the electricity on the production of hydrogen. Our studies on capacity utilization effects have shown that by increasing capacity, cost can be reduced. It is important to highlight that different policy frameworks—such as an Emissions Trading Scheme (ETS) or renewable subsidies—can have a significant impact on the economic feasibility of hydrogen production. Given the high sensitivity of this technology to electricity prices, introducing carbon pricing (e.g., through an ETS) may increase the cost of grid electricity derived from fossil fuels, thereby improving the competitiveness of renewable energy-based hydrogen production even at lower capacity utilization rates. In contrast, renewable energy subsidies can allow the system to operate at a lower specific cost even when only intermittent PV production is available.
An important aspect that is yet neglected in our model (and in other techno-economic models) is whether the lifetime of the electrolyzer stack and the system itself and the quality of the produced hydrogen are affected by the operation mode or not. Although solid numbers describing these effects are not yet available, we will cover the most important performance fading mechanisms and qualitatively evaluate the effect of dynamic operation on these.

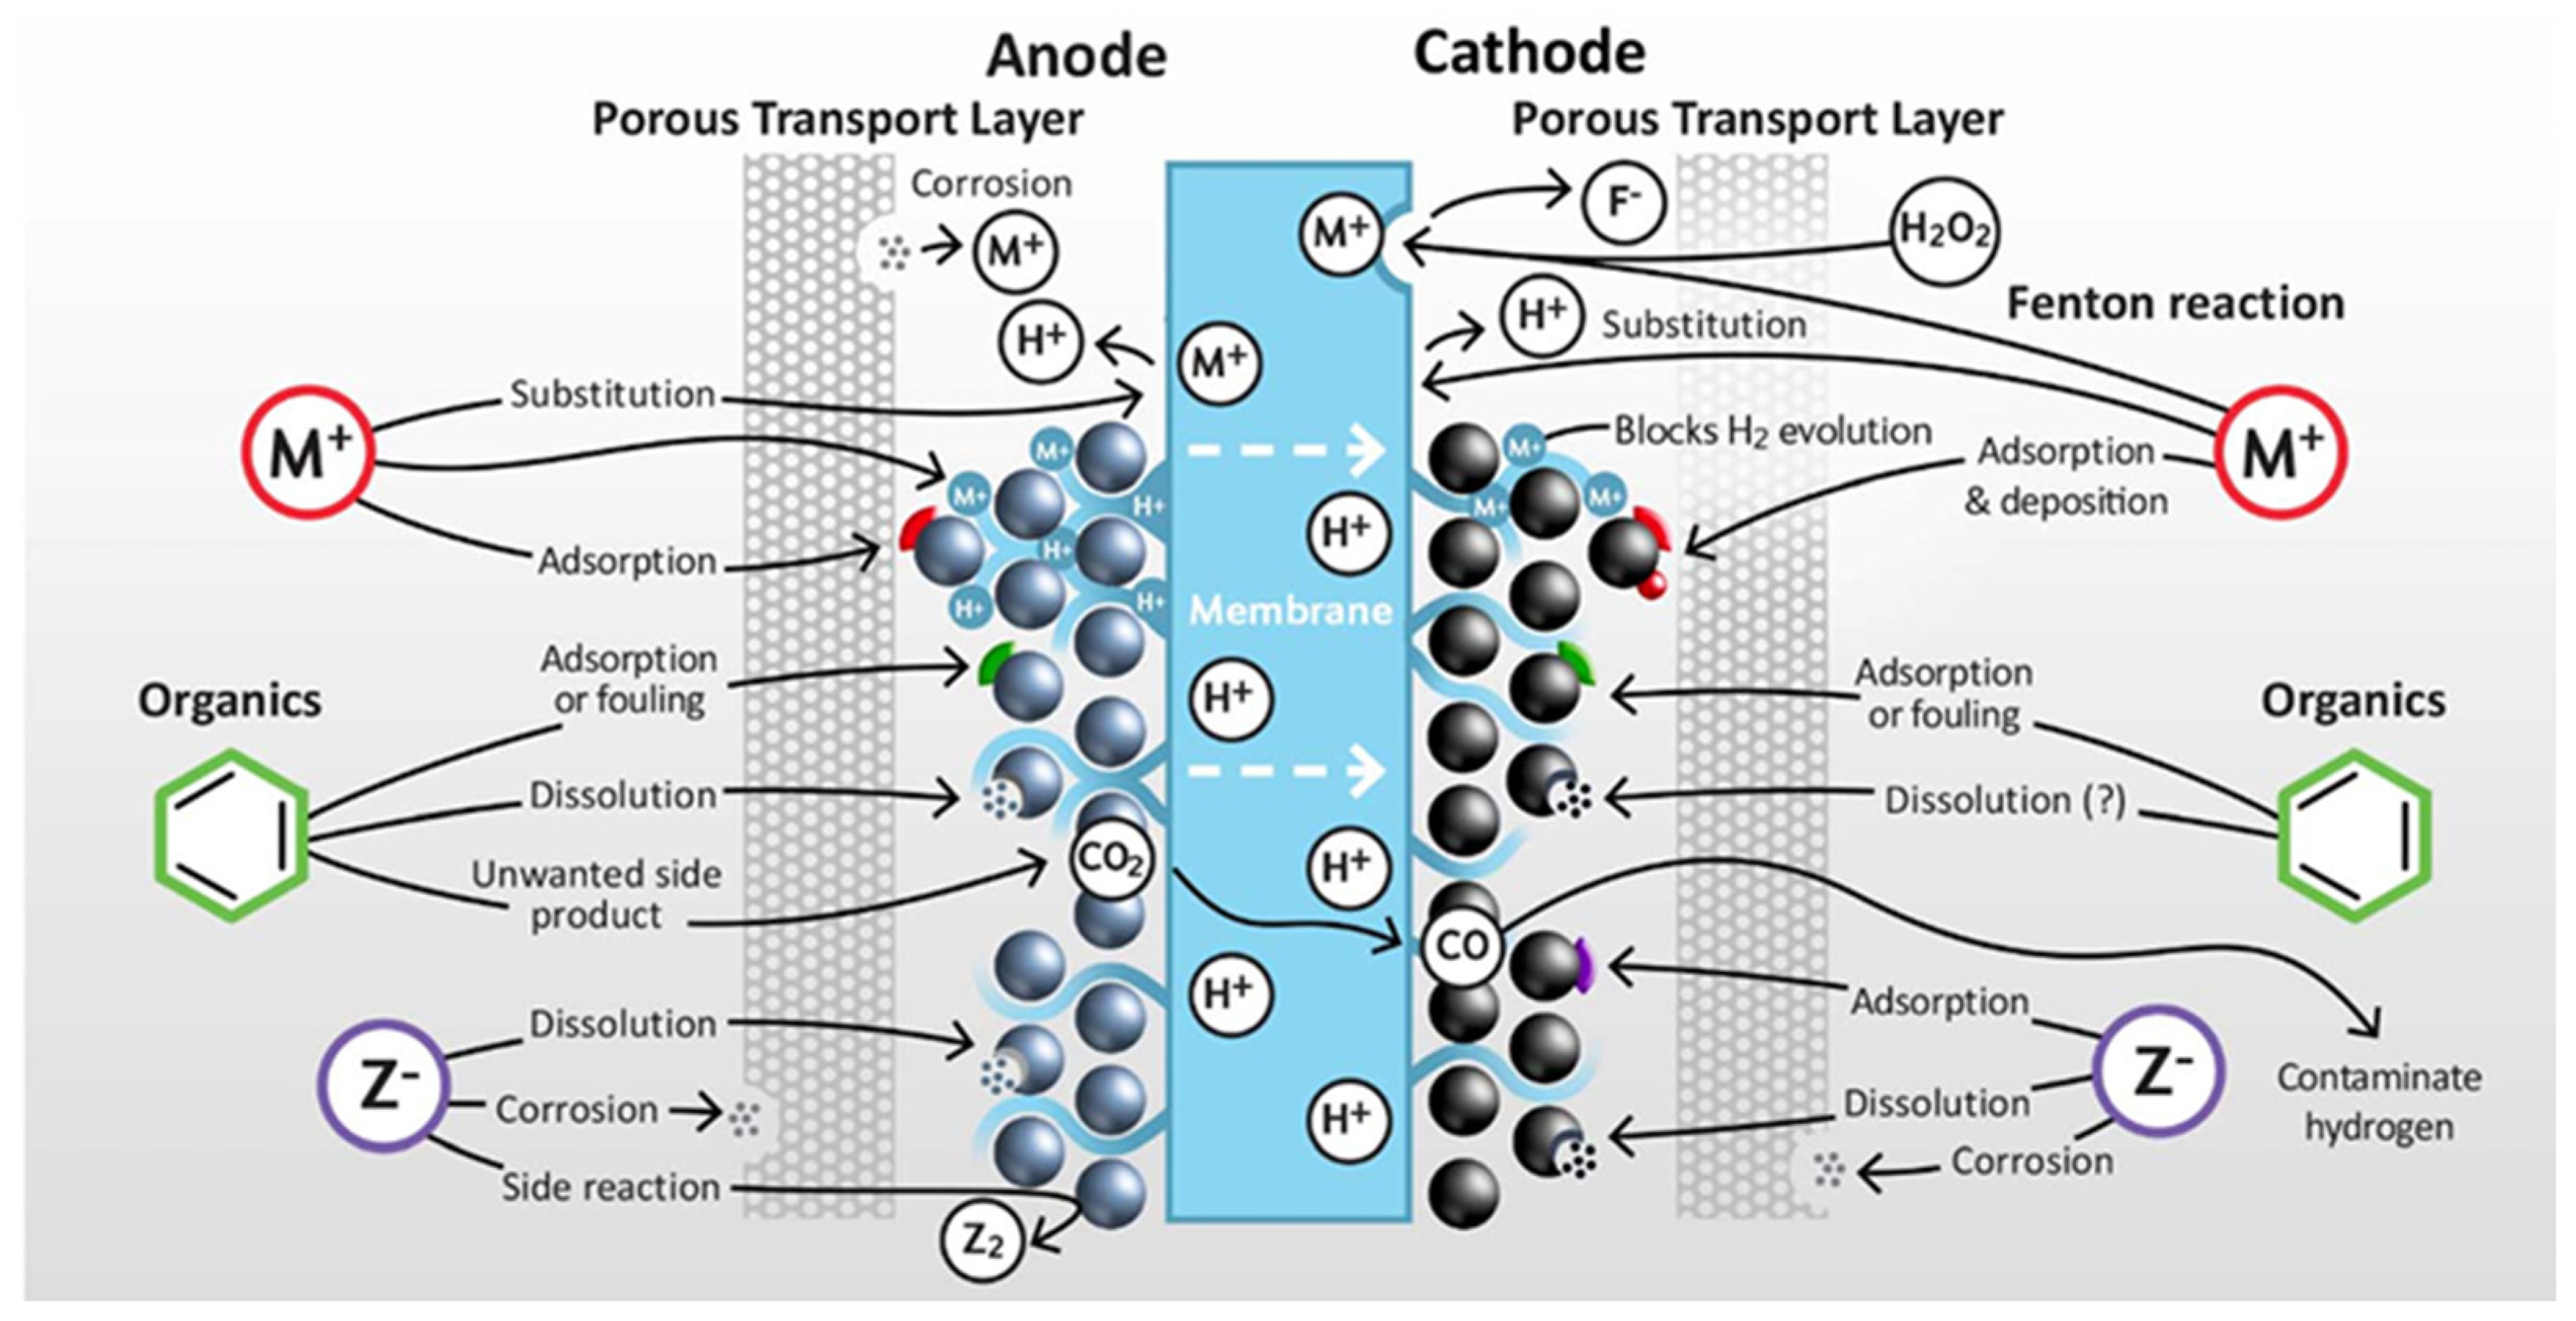
3. Dynamic Operation of PEM Water Electrolysis Systems

At first sight, PEM water electrolysis is the simplest electrochemical process that can be designed: Ultrapure water is fed to an electrolyzer stack, and it is split into pure oxygen and hydrogen, which are separated by employing a cation exchange membrane to produce pure gas streams. Ion conduction occurs purely from the anode to the cathode via the transport of H+ ions generated in the anode reaction. The membrane separates the anodically formed oxygen and the cathodically formed hydrogen, and hence the two pure gas streams can be collected separately. In commercial PEM water electrolyzers, the anode and cathode catalysts are stable, noble metals, mostly iridium and platinum, respectively. The catalyst supports and the flow channels in the cell are all optimized for the efficient removal of the formed gases; hence, these do not get stuck and block the electrochemically active surface. Considering the imperfection of cell components and long-term operation in a real system, the picture is, however, much more complex. This much oversimplified picture is complicated by many different physical/chemical phenomena, of which the following will be addressed:
  • H2 and O2 can both penetrate through the membrane; hence, the product streams are not 100% pure.
  • The transport of different gases through the membrane strongly depends on the process parameters, such as temperature, pressure, and current density.
  • H+ transport always occurs together with water transport; therefore, a large amount of water is dragged to the cathode of the electrolyzer.
  • Metal ions, originating from the corrosion of the catalysts, the cell hardware, and/or the system itself, can reach the membrane and pass to the cathode. The subsequent deposition of these decreases the electrochemical activity and increases the cell voltage.
  • Such metal ions can (quasi-) irreversibly bind to the charged groups in the membrane, hence decreasing its conductivity and increasing the cell voltage.
  • During operation, a highly acidic condition develops in the electrolyzer.
  • The transport of dissolved metal ions decreases the transference number of H+ ions, hence changing the local pH at the electrodes.
  • When starting the stack after leaving it under open-circuit conditions, the surface of the catalysts and the cell hardware oxidize or reduce.
  • The bubble formation rate and the size of the forming bubbles depend on the experimental parameters. This affects their removal efficiency.
  • Local heating might occur due to a partially blocked electrode surface, structural imperfections, or other reasons. This can lead to local catalyst and membrane overuse and subsequent membrane thinning.
  • When stopping the process, the remnant gases in the electrode compartments can induce a reverse, fuel cell-like operation.
The phenomena listed above are known and well documented in the scientific literature, and the PEM stack/system suppliers are also aware of these [12,13,14]. To counteract these negative effects, very specific instructions are provided with these products on how to start and stop their operation, how to purify the input water, and under which conditions (temperature, current density) can these be safely and efficiently operated. Regarding this last point, it is worth mentioning that all balance-of-plants components are tailored to support the stack operation under these optimized conditions and not outside this range.
Performance decay of PEMWE stacks can occur because of a multitude of reasons (Figure 3), including those attributed to the degradation or change of different cell components (Figure 4). This includes the degradation of the polymeric materials (most importantly, the membrane and the polymer binder/ionomer), a loss of (ion) conductivity, catalyst poisoning and/or loss, and changes in the transport of the formed gaseous products [15]. The extent of these degradation mechanisms depends strongly on the operation conditions of the whole system [16]. As detailed below, dynamically varying the electrolyzer load can have a notable effect on these degradation routes because of simple chemical reasons. Furthermore, the mechanical degradation of structural elements under dynamically varied pressure conditions can also hamper the performance of the electrolyzer.

4. Grid-Independent/Intermittent Operation of PEM Water Electrolysis Systems

The fully grid-independent operation of water electrolysis systems means that at a time when electricity from the renewable source is not available, the whole system stops. With a lack of any backup power, hydrogen cannot be stored safely; therefore, water electrolysis systems must contain some charge storage units with a capacity large enough for the operation of all safety functions for a certain time if long-term hydrogen storage is targeted. The length of this depends on the renewable energy source, the PEMWE system, the geographical location, and the season. In the following, we briefly discuss the challenges associated with dynamic PEMWE, first focusing on the electrolyzer stack and subsequently extending the discussion to the whole system.

4.1. Regular Starts/Stops

The operation of PV-coupled electrolysis systems is limited to sunny hours during the day; therefore, their stop for evening hours is inevitable. The remnant H2 and O2 gases in the cell compartments induce a reverse, fuel cell-like operation that can notably speed up degradation [18,19]. This can be avoided by using a polarization rectifier in the system, which adds to the capital and operating expenses. Even if a proper shutdown protocol is performed, hence avoiding the fuel cell operation of the devices, the catalyst layers’ oxidation state can change, and during the subsequent start-up, recovery induces catalyst degradation [20,21,22]. This is also true for the cell hardware, which might corrode at an accelerated rate, leading to increased cell resistance and possible contaminations simultaneously [23]. To mitigate this, applying a small protective current density during idle periods can be envisioned.

4.2. Product Crossover and Purity

Product purity is crucial for some further applications. In large electrolyzer systems, purging the hydrogen gas line and the storage tank for longer periods is typically necessary to achieve the desired purity. This is a notable difference from lab-scale studies where product analysis is performed directly from the short gas line, which can be rapidly purged. When stopping electrolysis, the following question arises: is it beneficial to leave the whole system (including the anode and the cathode) pressurized, or is it better to release the pressure from the electrolyzer stack? In a pressurized system, crossover of the formed products (oxygen and hydrogen) can occur, and therefore, flushing the hydrogen line is necessary before any re-start. Preferably, the storage tank must be closed by a valve system, but this again would require a continuous power supply.
Purity is also a question when considering operation with a dynamic load. The dominant mechanism behind the crossover of the formed gas products (H2 and O2) in PEM electrolyzers is diffusion [24]. Although certain mitigation strategies can be applied (including the use of thicker membranes, O2-H2 recombination catalysts, and/or advanced cell geometries), this phenomenon cannot be fully excluded. The diffusion rate depends on the supersaturation of these gases in the catalyst layers, which is strongly influenced by the process parameters (e.g., pressure, temperature, current density). Most importantly, the rate of hydrogen crossover increases steadily with pressure [25,26]. At low current densities (i.e., a cloudy sky in the case of the PV-coupled system), this can lead to the accumulation of hydrogen in the anodic oxygen stream, forming explosive mixtures. Furthermore, this is also an efficiency loss, as a notable portion of the product is lost.

4.3. Temperature Fluctuations

Stack performance is affected notably by the temperature for many reasons, including changes in the reversible cell voltage, reaction kinetics of the electrode processes, hydration, and conductivity of the membrane. The optimal operation temperature (which is typically in the range of 60–80 °C) is maintained by the Joule heating in the electrolyzer stack, together with the different cooling instruments implemented in the system. In a typical operation, the stack heats up from room temperature during the initial period of the electrolysis experiment, and subsequently, a steady state is reached. This steady state never really settles in the case of dynamic operation, which will either lead to large energy penalties for maintaining the stack at a constant temperature or to the operation of the stack at changing temperature. Electrolysis is therefore performed under non-optimal conditions (i.e., at higher cell voltage) for certain periods, resulting in notable losses and a potentially larger degradation rate [27]. Just to highlight one process, iridium was shown to degrade at an accelerated rate at more positive potentials [28].

4.4. Bubble Management Under Dynamic Load

Detachment and removal of the gas bubbles from the catalyst surface and the cell compartment is a crucial parameter for the electrolyzers’ efficiency and lifetime. If gas bubbles get trapped in the porous electrodes, these block part of the surface, inducing larger local current densities and accelerated degradation rates at some parts. In severe cases, momentary water starvation can occur at parts of the membrane, which eventually leads to detrimental hot spot formation [29]. During dynamic operation, residual gas accumulation occurs, leading to an increase in cell voltage, attributed to a reduction in the electrochemical surface area [30].

4.5. The Effect of Dynamic Operation on the Balance-of-Plants Components (BoP)

The degradation of PEMWE stacks under various conditions has been reported multiple times before, including studies applying dynamic loads mimicking renewable electricity-driven operation. Much less is known about the degradation of the BoP components under dynamic conditions, although temperature and pressure fluctuations and the regular start–stop cycles also affect the lifetime of these. Also, we note that the degradation products of the BoP components can accumulate in the electrolyzer stack, directly affecting its performance. As a specific contaminant, iron ions can originate from any steel component of the system. Iron contamination in the stack can lead to Fenton reactions, catalyst poisoning, and decreases in the ion exchange capacity of the Nafion membrane, all of which can reduce electrolyzer lifetime [31].
In the case of PV-coupled PEMWE, notable off times can be envisioned. During these periods, warm oxygen-saturated water is left in the anode pipes and in the liquid vessels, in direct contact with the sensors and actuators. One can consider a fully metal-free system, but in any other case, corrosion of these devices occurs, contaminating the entire system. Similarly, the vessels, cathode tubings, and all further components are exposed to a highly humid atmosphere, which can speed up their corrosion. Beyond contaminating the electrolyzer stack, these processes can also impose regular maintenance tasks, such as exchanging different fittings or sensor parts.

5. Do Accelerated Stress Tests Provide Relevant Information Regarding Electrolyzer Aging?

The goal of accelerated stress tests (ASTs) is to mimic the long-term degradation of a system in a much shorter timeframe [32]. PEM electrolyzer stack manufacturers typically offer an operational lifetime in the 50,000–100,000 h range. Validating such data would take 6–12 years, which neither producers nor customers possess in the case of every new product, scale-up, or different components/cell stack structures. Faster routes are sought to shorten this period to weeks, typically achieved by running the electrolyzer cells under extreme conditions, accounting for cumulative fatigue of the devices, which they would normally suffer over a much longer period [13,33]. This includes voltage cycling, current ramps/jumps, pressure fluctuations, and repeated start–stop cycles. These provide information on the transient effects during dynamic changes, and therefore, it is broadly accepted that ASTs describe catalyst/electrolyzer degradation properly.
The relevance of ASTs for the ageing of PEM stacks under dynamic conditions is questionable, although different protocols have already been proposed for addressing the effect of intermittent load [34,35]. These apply harsher conditions than expected during operation (e.g., higher current densities, rapid voltage changes, etc.) and/or different current/voltage profiles mimicking the power profile of an actual PV, but in a much shorter timeframe. Accounting for periods when the system is in standby or a fully shut-down state for several hours is a complex task typically not considered in these studies. As described briefly in the previous paragraphs, such periods can cause the acceleration of corrosion, product mixing, and overall system ageing. These effects are typically not covered by the ASTs, and therefore, our opinion is that the effect of dynamic PEM operation on system ageing is not yet understood and thus not quantitatively predictable. The ageing of BoP components affects system operation for multiple reasons, including increased capital costs (i.e., more frequent replacement), increased duration of plant shutdown (i.e., more complex maintenance), and possible contaminations in the system.

6. Conclusions

The island mode operation of PEM water electrolyzers is possible, as demonstrated in earlier studies. This, however, does not mean that this is optimal in terms of expected electrolyzer and system lifetime, energy efficiency, and product quality. Regular system shut-downs/start-ups pose many challenges, including the inefficient operation of PEM electrolyzers at low temperatures, bubble entrapment, increased corrosion rates, and decreased purity of the formed hydrogen. These negative effects can be mostly mitigated, but all technological solutions come at a cost. Even without considering these factors, our high-level techno-economic analysis shows that operating the PEM electrolysis system from a mixed electricity feed—grid and renewable combined—results in the most beneficial operation in terms of hydrogen price. These numbers heavily depend on local regulations and momentary electricity prices, but at the moment, high system capacity utilization seems to be the key to the lowest achievable (green) hydrogen price.

Supplementary Materials

The following supporting information can be downloaded at https://www.mdpi.com/article/10.3390/en18092154/s1, Table S1: Input data used for calculating the price of the produced H2.

Author Contributions

Substantial contributions to the conception and design of the study and data analysis and interpretation: B.E., I.S., I.B. and C.J.; data acquisition and the provision of administrative, technical, and material support: C.A.T., I.S., I.B. and M.L.; substantial contributions to the literature survey and manuscript preparation: B.E., C.A.T., I.S., I.B., M.L. and C.J.; techno-economic analysis: C.A.T., M.L. and C.J. All authors have read and agreed to the published version of the manuscript.

Funding

This research was carried out in the framework of “Development of an innovative energy storage technology utilizing renewable electricity from the Bükkábrány solar power plant”, under Call for Proposals No. 2020-3.1.2-ZFR-KVG-2020-00003.

Data Availability Statement

The data are available from the corresponding authors upon reasonable request.

Acknowledgments

Zsófia Kószó is acknowledged for her efforts in developing the initial model for the techno-economic analysis.

Conflicts of Interest

Authors István Szén and Imre Bakos were employed by the Bükkábrányi Fotovoltaikus Erőmű Projekt Kft. The remaining authors declare that the research was conducted in the absence of any commercial or financial relationships that could be construed as a potential conflict of interest.

References

  1. Hirth, L.; Ziegenhagen, I. Balancing Power and Variable Renewables: Three Links. Renew. Sustain. Energy Rev. 2015, 50, 1035–1051. [Google Scholar] [CrossRef]
  2. Al-Shetwi, A.Q.; Hannan, M.A.; Jern, K.P.; Mansur, M.; Mahlia, T.M.I. Grid-Connected Renewable Energy Sources: Review of the Recent Integration Requirements and Control Methods. J. Clean. Prod. 2020, 253, 119831. [Google Scholar] [CrossRef]
  3. Tan, K.M.; Babu, T.S.; Ramachandaramurthy, V.K.; Kasinathan, P.; Solanki, S.G.; Raveendran, S.K. Empowering Smart Grid: A Comprehensive Review of Energy Storage Technology and Application with Renewable Energy Integration. J. Energy Storage 2021, 39, 102591. [Google Scholar] [CrossRef]
  4. Hug, W.; Divisek, J.; Mergel, J.; Seeger, W.; Steeb, H. Highly Efficient Advanced Alkaline Electrolyzer for Solar Operation. Int. J. Hydrogen Energy 1992, 17, 699–705. [Google Scholar] [CrossRef]
  5. Kojima, H.; Nagasawa, K.; Todoroki, N.; Ito, Y.; Matsui, T.; Nakajima, R. Influence of Renewable Energy Power Fluctuations on Water Electrolysis for Green Hydrogen Production. Int. J. Hydrogen Energy 2023, 48, 4572–4593. [Google Scholar] [CrossRef]
  6. Sayed-Ahmed, H.; Toldy, I.; Santasalo-Aarnio, A. Dynamic Operation of Proton Exchange Membrane Electrolyzers—Critical Review. Renew. Sustain. Energy Rev. 2024, 189, 113883. [Google Scholar] [CrossRef]
  7. Ouabi, H.; Lajouad, R.; Kissaoui, M.; El Magri, A. Hydrogen Production by Water Electrolysis Driven by a Photovoltaic Source: A Review. e-Prime Adv. Electr. Eng. Electron. Energy 2024, 8, 100608. [Google Scholar] [CrossRef]
  8. Nnabuife, S.G.; Hamzat, A.K.; Whidborne, J.; Kuang, B.; Jenkins, K.W. Integration of Renewable Energy Sources in Tandem with Electrolysis: A Technology Review for Green Hydrogen Production. Int. J. Hydrogen Energy 2024, 107, 218–240. [Google Scholar] [CrossRef]
  9. Zsiboracs, H.; Vincze, A.; Pinter, G.; Baranyai, N.H. The Accuracy of PV Power Plant Scheduling in Europe: An Overview of ENTSO-E Countries. IEEE Access 2023, 11, 74953–74979. [Google Scholar] [CrossRef]
  10. Zsiborács, H.; Pintér, G.; Vincze, A.; Birkner, Z.; Baranyai, N.H. Grid Balancing Challenges Illustrated by Two European Examples: Interactions of Electric Grids, Photovoltaic Power Generation, Energy Storage and Power Generation Forecasting. Energy Rep. 2021, 7, 3805–3818. [Google Scholar] [CrossRef]
  11. Kılıç, U.; Kekezoğlu, B. A Review of Solar Photovoltaic Incentives and Policy: Selected Countries and Turkey. Ain Shams Eng. J. 2022, 13, 101669. [Google Scholar] [CrossRef]
  12. Wallnöfer-Ogris, E.; Grimmer, I.; Ranz, M.; Höglinger, M.; Kartusch, S.; Rauh, J.; Macherhammer, M.G.; Grabner, B.; Trattner, A. A Review on Understanding and Identifying Degradation Mechanisms in PEM Water Electrolysis Cells: Insights for Stack Application, Development, and Research. Int. J. Hydrogen Energy 2024, 65, 381–397. [Google Scholar] [CrossRef]
  13. Feng, Q.; Yuan, X.Z.; Liu, G.; Wei, B.; Zhang, Z.; Li, H.; Wang, H. A Review of Proton Exchange Membrane Water Electrolysis on Degradation Mechanisms and Mitigation Strategies. J. Power Sources 2017, 366, 33–55. [Google Scholar] [CrossRef]
  14. Frensch, S.H.; Fouda-Onana, F.; Serre, G.; Thoby, D.; Araya, S.S.; Kær, S.K. Influence of the Operation Mode on PEM Water Electrolysis Degradation. Int. J. Hydrogen Energy 2019, 44, 29889–29898. [Google Scholar] [CrossRef]
  15. Khatib, F.N.; Wilberforce, T.; Ijaodola, O.; Ogungbemi, E.; El-Hassan, Z.; Durrant, A.; Thompson, J.; Olabi, A.G. Material Degradation of Components in Polymer Electrolyte Membrane (PEM)Electrolytic Cell and Mitigation Mechanisms: A Review. Renew. Sustain. Energy Rev. 2019, 111, 1–14. [Google Scholar] [CrossRef]
  16. Nguyen, E.; Olivier, P.; Pera, M.-C.; Pahon, E.; Roche, R. Impacts of Intermittency on Low-Temperature Electrolysis Technologies: A Comprehensive Review. Int. J. Hydrogen Energy 2024, 70, 474–492. [Google Scholar] [CrossRef]
  17. Becker, H.; Murawski, J.; Shinde, D.V.; Stephens, I.E.L.; Hinds, G.; Smith, G. Impact of Impurities on Water Electrolysis: A Review. Sustain. Energy Fuels 2023, 7, 1565–1603. [Google Scholar] [CrossRef]
  18. Janjua, M.; Leroy, R. Electrocatalyst Performance in Industrial Water Electrolysers. Int. J. Hydrogen Energy 1985, 10, 11–19. [Google Scholar] [CrossRef]
  19. Guruprasad, N.; van der Schaaf, J.; de Groot, M.T. Unraveling the Impact of Reverse Currents on Electrode Stability in Anion Exchange Membrane Water Electrolysis. J. Power Sources 2024, 613, 234877. [Google Scholar] [CrossRef]
  20. Schalenbach, M.; Kasian, O.; Ledendecker, M.; Speck, F.D.; Mingers, A.M.; Mayrhofer, K.J.J.; Cherevko, S. The Electrochemical Dissolution of Noble Metals in Alkaline Media. Electrocatalysis 2018, 9, 153–161. [Google Scholar] [CrossRef]
  21. Cherevko, S.; Kulyk, N.; Mayrhofer, K.J.J. Durability of Platinum-Based Fuel Cell Electrocatalysts: Dissolution of Bulk and Nanoscale Platinum. Nano Energy 2016, 29, 275–298. [Google Scholar] [CrossRef]
  22. Knöppel, J.; Möckl, M.; Escalera-López, D.; Stojanovski, K.; Bierling, M.; Böhm, T.; Thiele, S.; Rzepka, M.; Cherevko, S. On the Limitations in Assessing Stability of Oxygen Evolution Catalysts Using Aqueous Model Electrochemical Cells. Nat. Commun. 2021, 12, 2231. [Google Scholar] [CrossRef]
  23. Weiß, A.; Siebel, A.; Bernt, M.; Shen, T.-H.; Tileli, V.; Gasteiger, H.A. Impact of Intermittent Operation on Lifetime and Performance of a PEM Water Electrolyzer. J. Electrochem. Soc. 2019, 166, F487–F497. [Google Scholar] [CrossRef]
  24. Trinke, P.; Haug, P.; Brauns, J.; Bensmann, B.; Hanke-Rauschenbach, R.; Turek, T. Hydrogen Crossover in PEM and Alkaline Water Electrolysis: Mechanisms, Direct Comparison and Mitigation Strategies. J. Electrochem. Soc. 2018, 165, F502–F513. [Google Scholar] [CrossRef]
  25. Omrani, R.; Shabani, B. Hydrogen Crossover in Proton Exchange Membrane Electrolysers: The Effect of Current Density, Pressure, Temperature, and Compression. Electrochim. Acta 2021, 377, 138085. [Google Scholar] [CrossRef]
  26. Schalenbach, M.; Carmo, M.; Fritz, D.L.; Mergel, J.; Stolten, D. Pressurized PEM Water Electrolysis: Efficiency and Gas Crossover. Int. J. Hydrogen Energy 2013, 38, 14921–14933. [Google Scholar] [CrossRef]
  27. Rauls, E.; Hehemann, M.; Keller, R.; Scheepers, F.; Müller, M.; Stolten, D. Favorable Start-Up Behavior of Polymer Electrolyte Membrane Water Electrolyzers. Appl. Energy 2023, 330, 120350. [Google Scholar] [CrossRef]
  28. Cherevko, S.; Geiger, S.; Kasian, O.; Mingers, A.; Mayrhofer, K.J.J. Oxygen Evolution Activity and Stability of Iridium in Acidic Media. Part 2.—Electrochemically Grown Hydrous Iridium Oxide. J. Electroanal. Chem. 2016, 774, 102–110. [Google Scholar] [CrossRef]
  29. Yuan, S.; Zhao, C.; Cai, X.; An, L.; Shen, S.; Yan, X.; Zhang, J. Bubble Evolution and Transport in PEM Water Electrolysis: Mechanism, Impact, and Management. Prog. Energy Combust. Sci. 2023, 96, 101075. [Google Scholar] [CrossRef]
  30. Lee, C.H.; Lee, J.K.; Zhao, B.; Fahy, K.F.; Bazylak, A. Transient Gas Distribution in Porous Transport Layers of Polymer Electrolyte Membrane Electrolyzers. J. Electrochem. Soc. 2020, 167, 024508. [Google Scholar] [CrossRef]
  31. Staerz, A.F.; van Leeuwen, M.; Priamushko, T.; Saatkamp, T.; Endrődi, B.; Plankensteiner, N.; Jobbagy, M.; Pahlavan, S.; Blom, M.J.W.; Janáky, C.; et al. Effects of Iron Species on Low Temperature CO2 Electrolyzers. Angew. Chem. Int. Ed. 2024, 63, e202306503. [Google Scholar] [CrossRef] [PubMed]
  32. Aßmann, P.; Gago, A.S.; Gazdzicki, P.; Friedrich, K.A.; Wark, M. Toward Developing Accelerated Stress Tests for Proton Exchange Membrane Electrolyzers. Curr. Opin. Electrochem. 2020, 21, 225–233. [Google Scholar] [CrossRef]
  33. Kuhnert, E.; Hacker, V.; Bodner, M. A Review of Accelerated Stress Tests for Enhancing MEA Durability in PEM Water Electrolysis Cells. Int. J. Energy Res. 2023, 2023, 3183108. [Google Scholar] [CrossRef]
  34. Kuhnert, E.; Mayer, K.; Heidinger, M.; Rienessel, C.; Hacker, V.; Bodner, M. Impact of Intermittent Operation on Photovoltaic-PEM Electrolyzer Systems: A Degradation Study Based on Accelerated Stress Testing. Int. J. Hydrogen Energy 2024, 55, 683–695. [Google Scholar] [CrossRef]
  35. Choi, B.B.; Jo, J.H.; Yoo, Y.S.; Jeon, S.Y.; Lee, T.; Choi, Y.J.; Chung, D.Y.; Lee, E.J.; Yoo, S.J. Accelerated Stress Test of Polymer Electrolyte Membrane Water Electrolyzer via Solar Power Generation Condition. Sustain. Energy Technol. Assess. 2023, 57, 103238. [Google Scholar] [CrossRef]
Figure 1. Some possible scenarios to couple renewable electricity production with PEM water electrolysis.
Energies 18 02154 g001
Figure 2. (A) Theoretical maximum monthly H2 production with PV energy, and when the H2 production is only performed for PV scheduling. (B) Down-regulation capability of the electrolyzer during the year.
Energies 18 02154 g002
Figure 3. A summary of the factors affecting energy efficiency, the system, and electrolyzer stability and the product purity of PEMWE systems.
Energies 18 02154 g003
Figure 4. Schematic illustration of impact of various types of impurities on PEMWEs [17].
Energies 18 02154 g004
Table 1. The annual cost and amount of hydrogen produced in the case of the different operation scenarios considered in this study. Source: own elaboration.
PV
Regulation
PV not FITPV FITGridPV Regulation + not FITPV Regulation + not FIT + Grid
Capacity
Factor
12%40%40%98%40%98%
Hydrogen production (kg/year)19.09663.0763.07154.563.072154.526
Cost of hydrogen (EUR/kg)35.89 13.04 16.06 10.412.7810.22
Disclaimer/Publisher’s Note: The statements, opinions and data contained in all publications are solely those of the individual author(s) and contributor(s) and not of MDPI and/or the editor(s). MDPI and/or the editor(s) disclaim responsibility for any injury to people or property resulting from any ideas, methods, instructions or products referred to in the content.

