Article

Sustainable Energy Storage Systems: Polypyrrole-Filled Polyimide-Modified Carbon Nanotube Sheets with Remarkable Energy Density

Department of Mechanical and Materials Engineering, University of Cincinnati, Cincinnati, OH 45221-0072, USA
*
Author to whom correspondence should be addressed.
Energies 2025, 18(9), 2158; https://doi.org/10.3390/en18092158
Submission received: 6 April 2025 / Revised: 17 April 2025 / Accepted: 21 April 2025 / Published: 23 April 2025

Abstract

:
Organic hybrid materials are gaining traction as electrode candidates for energy storage due to their structural tunability and environmental compatibility. This study investigates polyimide/carbon nanotube/polypyrrole (PI/CNTs/PPy) hybrid nanocomposites, focusing on the correlation between thermal imidization temperature, polypyrrole deposition time, and the resulting electrochemical properties. By modulating PI processing temperatures (90 °C, 180 °C, 250 °C) and PPy deposition durations (60–700 s), this research uncovers critical structure–function relationships governing charge storage behavior. Scanning electron microscopy and electrochemical impedance spectroscopy reveal that low-temperature imidization preserves porosity and enables ion-accessible pathways, while moderate PPy deposition enhances electrical conductivity without blocking pore networks. The optimized composite, processed at 90 °C with 60 s PPy deposition, demonstrates superior specific capacitance (850 F/g), high redox contribution (~70% of total charge), low charge transfer resistance, and enhanced energy/power density. In contrast, high-temperature processing and prolonged PPy deposition result in structural densification, increased resistance, and diminished performance. These findings highlight a synergistic design approach that leverages partial imidization and controlled doping to balance ionic diffusion, electron transport, and redox activity. The results provide a framework for developing scalable, high-performance, and sustainable electrode materials for next-generation lithium-ion batteries and supercapacitors.

1. Introduction

Due to global concerns about energy challenges and environmental issues, there is an urgent need for sustainable energy storage batteries to efficiently use renewable energy [1]. Current battery materials rely heavily on non-renewable minerals, which could limit their widespread use due to significant economic and resource constraints. Redox-active organic compounds emerge as promising alternatives for sustainable energy storage materials due to their advantages, such as widespread availability, environmental friendliness, ease of processing, lightweight, redox stability, a wide range of structures, recyclability of resources, potential flexibility, and affordability. Organic electrode materials, particularly as cathodes in lithium-ion batteries (LIBs), are gaining attention due to their structural diversity and as a potential replacement for inorganic battery materials [1,2]. Recent breakthroughs in the design and performance of organic cathodes have further underscored their viability. For instance, a 2023 study published in Advanced Energy Materials demonstrated high-performance organic cathode systems with improved stability and specific capacity, marking a significant advancement in the practical deployment of such materials [3]. Organic cathode materials represent a promising category of energy storage materials with wide application potential. They are characterized by several advantages compared to inorganic cathode materials: they have high theoretical specific capacities, are environmentally friendly, offer flexible structural design options, offer a high level of safety, and occur frequently in nature [4]. However, turning these potential applications into practical reality remains a major challenge. Despite numerous studies investigating various structures, it is still extremely difficult to find promising organic cathode materials that simultaneously offer high energy density, stable cycling, and low cost [5]. However, several challenges hinder their further advancement, including limited resource availability, structural degradation over prolonged cycling, safety risks, and high production costs. The growing demand for sustainable and high-performance energy storage has driven research into alternative electrode materials that can address these limitations [6]. One major challenge in LIBs is the reliance on transition metal-based cathodes (such as LiCoO2 and NMC), which are expensive, environmentally concerning, and subject to supply chain constraints. Despite their widespread use, LIBs still face significant challenges related to electrode stability, charge storage capacity, cycle life, and cost. Conventional electrode materials, including graphite anodes and transition metal-based cathodes, suffer from capacity fading, poor rate performance, high production costs, and environmental concerns. Additionally, the use of flammable liquid electrolytes poses serious safety risks, such as thermal runaway and potential battery failure [6].
Polyimides are high-performance polymers with exceptional mechanical strength, chemical resistance, and thermal stability [7]. Polyimide-based composites provide a special combination of properties appropriate for advanced electrode materials when combined with carbon nanotubes (CNTs) and PVDF [8,9,10]. The electrical performance of the composite can be greatly improved by CNTs because of their high electrical conductivity [11,12,13]. It is important to recognize that the structural and electrochemical properties of carbon nanotubes are significantly influenced by their synthesis techniques. CNTs can be synthesized via arc discharge, laser ablation, chemical vapor deposition (CVD), and more recently, rapid microwave-assisted methods, each yielding distinct morphologies, defect densities, and degrees of graphitization. For instance, microwave synthesis offers a fast, energy-efficient route to produce CNTs with tailored length, diameter, and wall number, potentially influencing their conductivity, mechanical behavior, and interaction with polymer matrices [14]. However, in this study, single-walled CNTs synthesized via CVD were employed to ensure uniformity and reproducibility in the fabrication process. Future work could explore how different CNT morphologies, especially those obtained via microwave methods, impact composite behavior. Polyimide (PI) films are employed as thermal control coatings and protective layers for electronic devices and space applications. This is attributed to their remarkable optical properties, such as transparency, low solar absorption, and infrared emission. Additionally, they exhibit high thermal stability, and a wide service temperature range from −300 to +300 °C. PI films are also known for their radiation resistance, enhanced electrical insulation (dielectric constant 3.4–3.5), low density, toughness, flexibility, and high mechanical stability [15]. Generally, aromatic polyimide (PI) is produced through a two-step process.
The first step involves the synthesis of poly(amic acid), PAA, from dianhydride and diamine monomers by a polycondensation reaction in a dipolar solvent, such as N-methyl pyrrolidone (NMP). The second step is the imidization reaction, which occurs after the solvent is eliminated from the PAA, as illustrated in Figure 1.
An aromatic PI is electroactive, and it is reduced to its anions via a two-step 2e- reduction process at potentials lower than 1.0 V versus Li/Li+ 22. At higher applied potentials between 2.0 and 2.5 V, PI-based electrode material produces its highest possible specific capacity.
Recent developments have explored organic-based and hybrid electrode materials as viable alternatives. Conducting polymers, such as polypyrrole (PPy) and polyimide (PI), offer high conductivity, flexibility, and sustainability, making them attractive candidates for LIB electrodes. Additionally, integrating carbon nanotubes (CNTs) into polymeric matrices enhances charge transport, mechanical stability, and ion diffusion, leading to improved electrochemical performance [16,17,18,19,20,21,22,23].
This study optimizes the conductivity and ion transport properties of polyimide (PI)/carbon nanotube (CNT)/polypyrrole (PPy) hybrid nanocomposites for energy storage applications. Organic electrode materials offer a promising alternative to conventional inorganic materials, which, despite their high energy density, suffer from low cycling stability, environmental concerns, and high costs. By systematically analyzing the effects of PI processing temperature and PPy deposition time, this work demonstrates that controlled imidization at lower temperatures enhances porosity, improves ion diffusion, and reduces bulk resistance, leading to superior electrochemical performance. PI-based cathodes exhibit high specific capacities between 2.0 and 2.5 V, retaining 83–95% of their initial capacity after 100 cycles at 0.2 C, with conductivity further improved by incorporating conductive additives such as CNTs or graphene [24,25,26,27]. Notably, a PI/graphene composite with 10% graphene achieved a reversible capacity of 232.6 mAhg−1 at 10 C, maintaining 94% capacity retention after 1000 cycles at 20 C [28]. Similarly, PI/CNT composites demonstrated high capacities and exceptional cycling stability due to their reversible multi-electron redox processes and conductive 3D network [29]. Recent research highlights the potential of PI/PPy composites, emphasizing the importance of optimizing synthesis conditions to balance mechanical stability, ion mobility, and electrochemical efficiency for next-generation energy storage technologies [30]. Polyimide shown in Figure 2a is synthesized by condensation polymerization of aromatic dianhydride and diamine to form poly(amic acid) followed by thermal imidization at about 300 °C [31,32]. PPy, as shown in Figure 2b, can be synthesized by solution oxidative polymerization and by anodic electrodeposition [18,33].
The properties of carbon materials [34,35,36,37,38,39] polyimide [8,40,41,42,43], and polypyrrole [44,45,46] presented in Table 1 and Table 2 are compiled from previously published literature and manufacturer specifications. Similarly, the properties of polypyrrole (PPy), such as electrical conductivity and electrochemical characteristics, are adapted from Sigma-Aldrich material specifications. These sources provide a comprehensive basis for understanding the structural and functional characteristics of the materials used in this study. In line with these advancements, our recent study demonstrated the development of polypyrrole-based hybrid nanocomposite electrodes with outstanding specific capacitance and promising charge storage behavior [47]. The work highlighted the synergistic role of conductive polymers and carbon nanostructures in achieving enhanced electrochemical performance, providing a strong foundation for further exploration into organic–inorganic hybrid systems for energy storage applications.
This study aims to optimize the processing parameters of PI/CNT/PPy hybrid nanocomposites by evaluating the effects of polyimide processing temperature (90 °C, 180 °C, and 250 °C) and polypyrrole deposition time (60 s to 700 s) on their electrochemical performance and structural characteristics. By systematically investigating these parameters, this work seeks to develop electrode materials with improved porosity, ion transport, and charge storage efficiency, contributing to the advancement of sustainable and high-performance lithium-ion batteries and supercapacitors.

2. Experimental

2.1. Materials and Reagent

The following reagents were used in this study: Polypyrrole (PPy) was sourced from Sigma-Aldrich (purity ≥ 98%, St. Louis, MO, USA). Polyimide precursors (Poly(amic acid)—PAA) were all purchased from Sigma-Aldrich (purity ≥ 99%, USA). Single-walled carbon nanotubes (CNTs) were acquired from Nanocyl (purity > 95%, Sambreville, Belgium). N-Methyl-2-pyrrolidone (NMP) was purchased from Sigma-Aldrich (purity ≥ 99.5%, USA). Sulfuric acid (H2SO4) was analytical grade (≥99%) from Sigma-Aldrich, St. Louis, MO, USA. Deionized (DI) water with 18.2 MΩ·cm resistivity was obtained from chemistry lab at University of Cincinnati. All reagents were used as received without further purification.

Apparatus and Instrumentation

The synthesis and characterization of the PI/CNTs-PPy composites were conducted using the following equipment: an electrochemical workstation (Gamry 3000 Potentiostat (Gamry Instruments, Warminster, PA, USA) in a three-electrode cell setup with an Ag/AgCl reference electrode, USA) for cyclic voltammetry (CV), electrochemical impedance spectroscopy (EIS), and galvanostatic charge–discharge (GCD) measurements. Scanning electron microscope (SEM): Hitachi SU8230 (Hitachi High-Tech, Tokyo, Japan) for morphological and structural analysis. X-ray diffraction (XRD): Rigaku Miniflex 600 (Rigaku Corporation Tokyo, Japan) for crystalline structure identification. Thermogravimetric analyzer (TGA): TA Instruments Q500 (TA Instruments, New Castle, DE, USA) for thermal stability assessment.

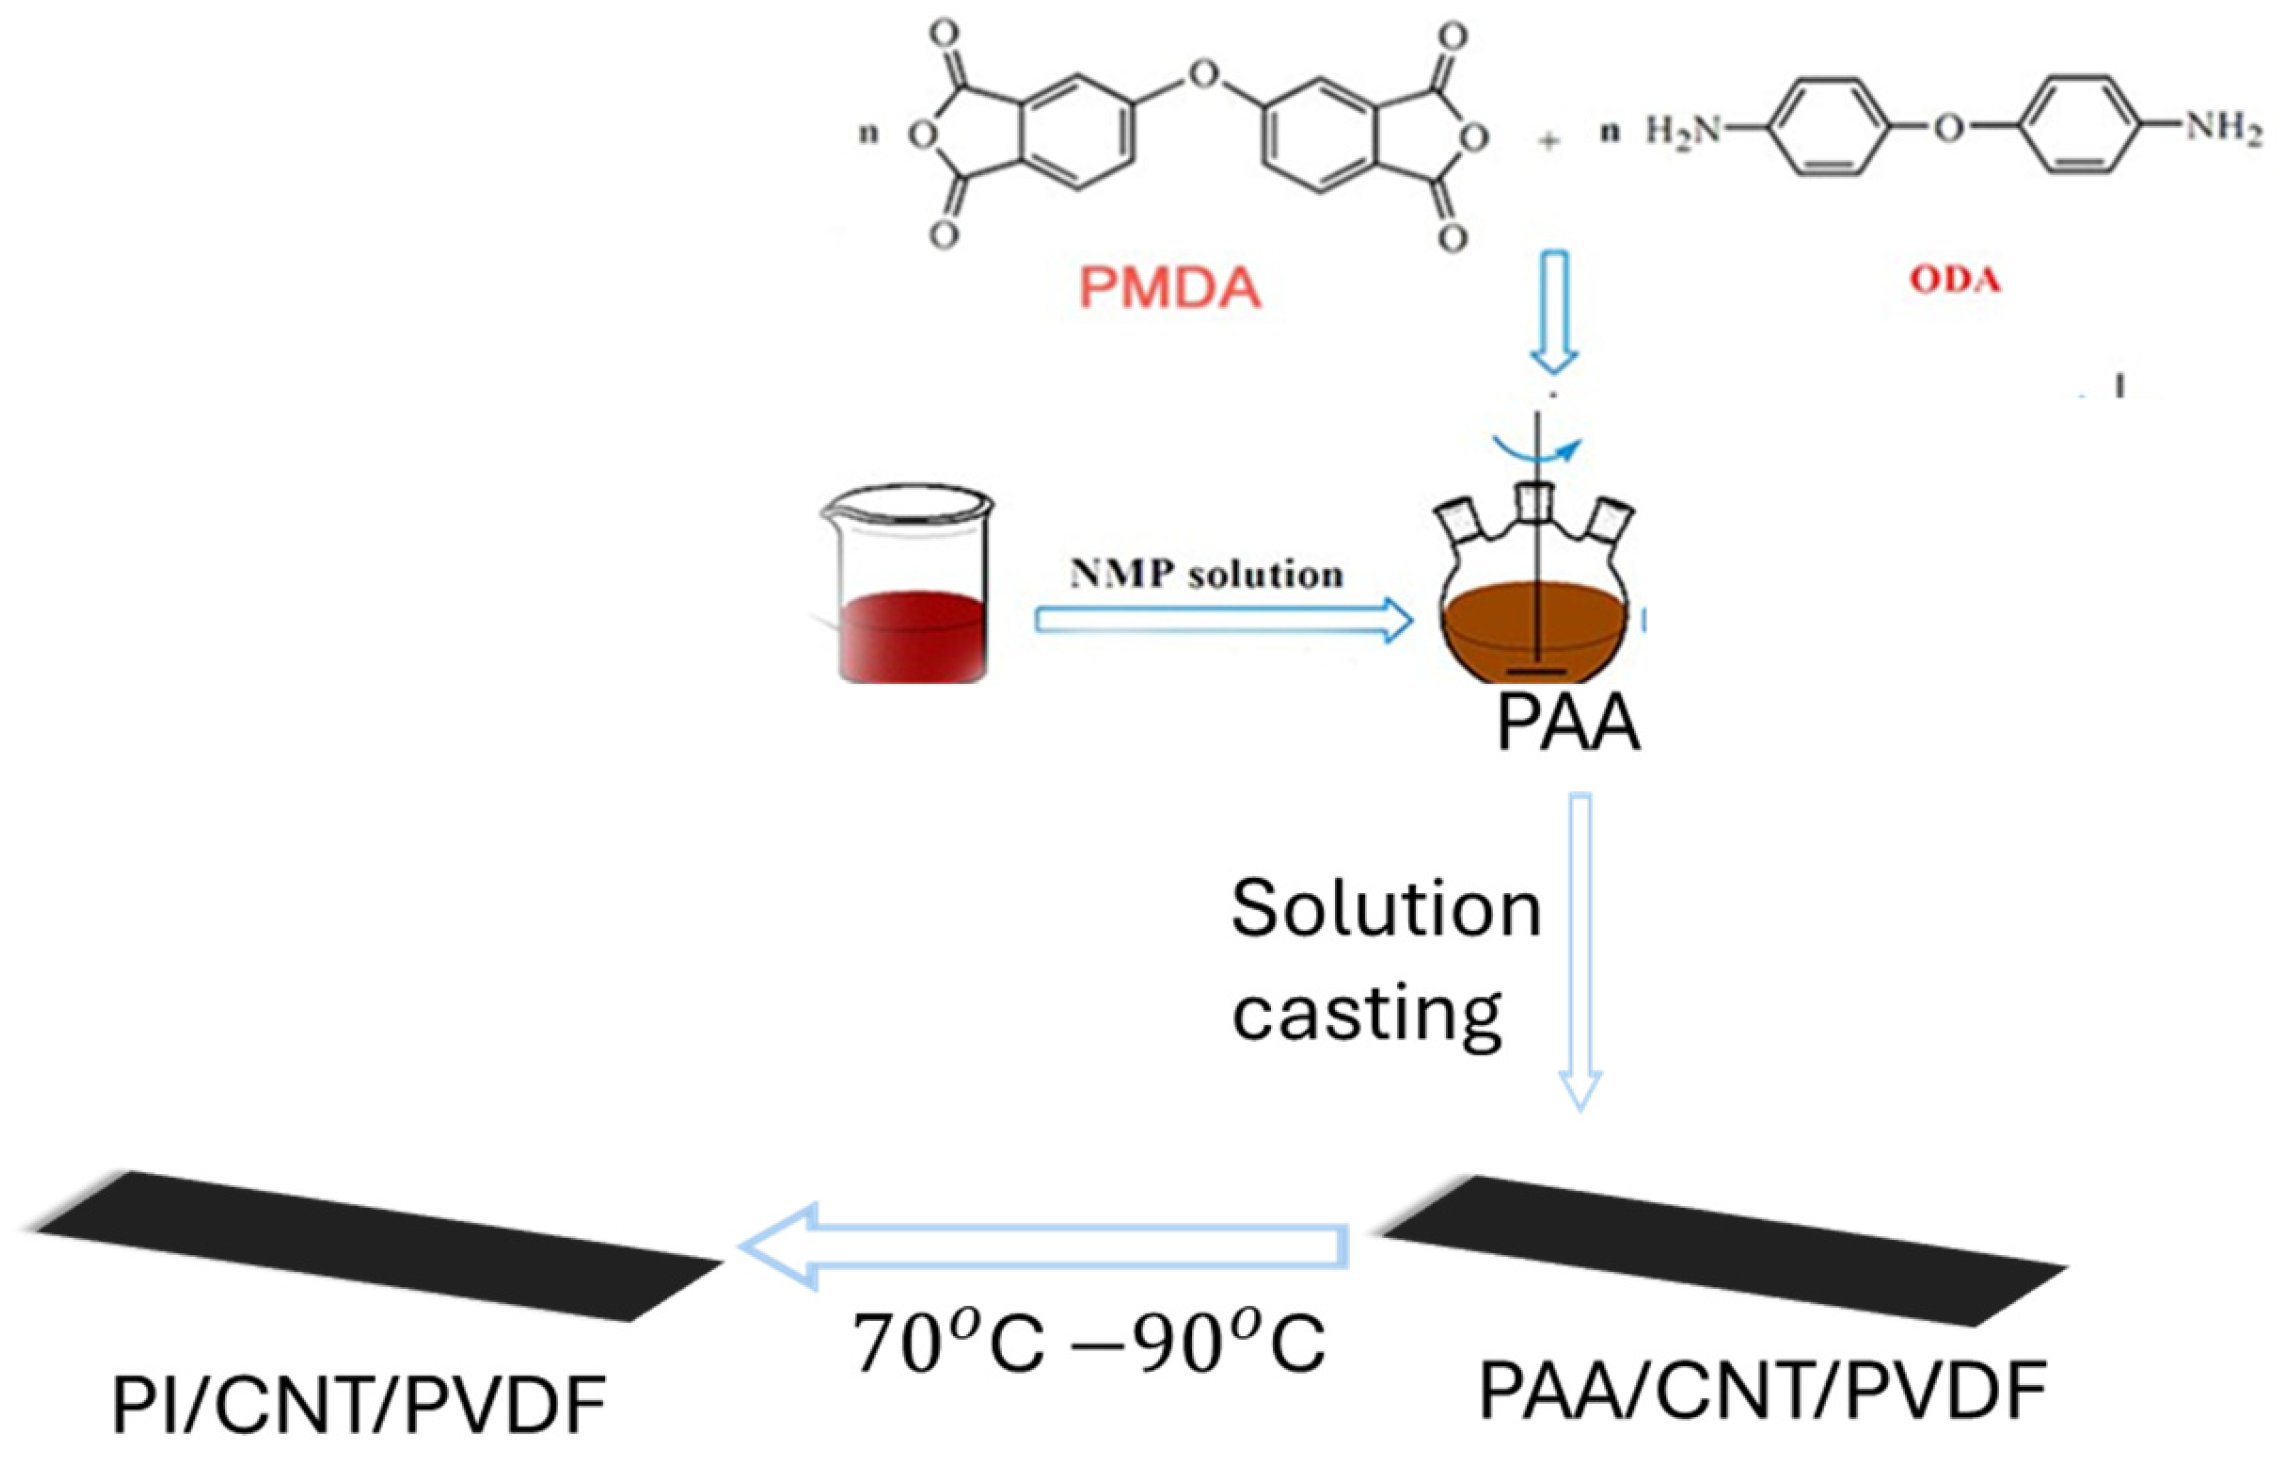
2.2. Synthesis of Polyimide and Processing of Hybrid Nanocomposites

A polyvinylidene fluoride (PVDF) matrix containing up to 90 wt.% carbon nanotubes (CNTs) was employed to fabricate the PI/CNT hybrid nanocomposite. To prepare the composite, a 10 wt.% solution of poly(amic acid) (PAA) was synthesized by reacting equimolar amounts of pyromellitic dianhydride (PMDA) and oxydianiline (ODA) in N-methyl-2-pyrrolidone (NMP). This PAA solution was uniformly applied to the CNT sheet using the solution casting technique. The coated CNT sheet underwent an initial drying phase in a vacuum oven at 70 °C for six hours to eliminate any residual solvent. Following this, a stepwise thermal curing process was implemented, gradually increasing the temperature to 90 °C for an additional six hours under a vacuum pressure of 28 in. Hg, as shown in Figure 3. This thermal treatment promoted the conversion of PAA to polyimide, resulting in a stable and mechanically durable composite material. After cooling, the composite sheet was carefully removed from the substrate, yielding a PI-CNT/PVDF film uniformly coated with polyimide. This film was then utilized as the working electrode for the subsequent electrochemical deposition of polypyrrole (PPy). The fabrication approach was meticulously controlled to maintain the structural integrity of the film and minimize potential defects or shrinkage. The same fabrication process was repeated for samples processed at 180 °C and 250 °C. This enabled a systematic investigation of how varying thermal treatments influence the structural and electrochemical properties of the composite. The choice of 90 °C, 180 °C, and 250 °C as processing temperatures was strategically made to explore the effects of low, medium, and high thermal conditions on the composites’ microstructure and performance. At 90 °C, the focus was on achieving uniform polyimide formation while maintaining porosity and effective CNT dispersion. Higher temperatures of 180 °C and 250 °C were selected to examine the influence of increased thermal energy on structural densification and potential thermal degradation. These specific temperatures were chosen to provide a broad spectrum of thermal processing conditions, facilitating a comprehensive analysis of the relationship between temperature, microstructural changes, and electrochemical behavior. Although additional temperature points could offer further insights, the selected range effectively balances experimental feasibility and the need to identify key trends for optimizing processing conditions.
The PI-modified CNT sheet was then studied by differential scanning calorimetry (DSC) before it was doped with polypyrrole by electrochemical polymerization of pyrrole (Py).

3. Characterization

3.1. Scanning Electron Microscopy (SEM)

A Thermo Fisher SCIOS DualBeam scanning electron microscope (SEM) (Thermo Fisher Scientific, Waltham, MA, USA) was used to analyze the surface morphology and composition of the samples. Both surface and cross-sectional imaging were conducted to assess the extent of polypyrrole (PPy) electrodeposition and the porosity generated during the process. Furthermore, the impact of PPy incorporation on the structural features of the PI/CNTs-PPy composite electrode was examined. Due to the samples’ inherent electrical conductivity, Ag sputtering was not required prior to imaging.

3.2. X-Ray Diffraction (XRD)

The crystalline structure and phase composition of the samples were analyzed using an X-ray diffractometer (XRD) from Thermo Fisher Scientific, Waltham, MA, USA. XRD patterns were obtained to evaluate the structural modifications induced by polyimide processing and polypyrrole (PPy) deposition. The diffraction data provided insights into crystallinity, phase transitions, and molecular interactions within the PI/CNTs-PPy composite. The measurements were conducted using Cu-Kα radiation (λ = 1.5406 Å) at a scanning rate of X°/min over a 2θ range of Y–Z°, ensuring precise characterization of the material’s structural properties.

3.3. Electrochemical Deposition of Polypyrrole

Electrodeposition of polypyrrole (PPy) was conducted in a three-electrode electrochemical cell using the PI/CNT hybrid nanocomposite as the working electrode, a conducting glass rod as the counter electrode, and an Ag/AgCl reference electrode. The electrolyte solution consisted of 0.05 M pyrrole and 0.0225 M p-toluene sulfonic acid (TsOH) in deionized water, continuously stirred at 25 °C to ensure uniform mass transport. Electrodeposition was performed potentiostatically at 2 V vs. Ag/AgCl, with deposition times ranging from 60 to 700 s to investigate their effect on film thickness and conductivity. After deposition, the electrodes were rinsed with deionized water and dried at room temperature. TsOH was chosen as the dopant for its ability to enhance the electrical conductivity and stability of PPy. The applied potential was optimized to prevent overoxidation, and all experiments were conducted in triplicate to ensure reproducibility.

3.4. Differential Scanning Calorimetry

Differential scanning calorimetry (DSC) was used to study the extent of imidization of polyimide. DSC revealed how the processing temperature influenced the conversion of poly(amic acid) (PAA) to polyimide (PI). DSC of the neat PAA and PAA cast onto CNT sheets and CNTs was carried out at a heating rate of 5 °C/min in a temperature range between 80 and 350 °C. The neat PAA sample exhibited two reaction endotherms at 65 °C due to poly(amic acid) formation and between 170 and 250 °C due to the cyclodehydration (imidization) process. For hybrid nanocomposites, in samples processed at lower temperatures, ≤90 °C, poly(amic acid) endotherm was prominent, as well as the polyimide formation endotherm at temperatures ≤ 250 °C. Imidization was completed when the peak for imidization had completely disappeared.

3.5. Electrochemical Characterization (EC)

A Gamry 3000 Potentiostat, configured in a three-electrode setup, was used to perform electrochemical characterization. EC experiments were conducted in a 1 M H2SO4 electrolyte solution. A glassy carbon rod was the counter electrode, while an Ag/AgCl electrode was the reference electrode. The working electrodes consisted of free-standing films of the samples, which were immersed in the electrolyte solution.
Cyclic voltammetry (CV) was done in a voltage range between 0 V to 1 V at three different scan rates of 5, 10, and 25 mV/s for 10 cycles to determine the peak current and charge storage capacity of the nanocomposite electrode.

3.6. Electrochemical Characterization

A Gamry 3000 Potentiostat, configured in a three-electrode setup (Figure 4), was employed for the experiments conducted in a 1 M H2SO4 electrolyte solution. A glassy carbon rod was the counter electrode, while an Ag/AgCl electrode was the reference electrode. The working electrodes consisted of free-standing films of the samples, which were immersed in the electrolyte solution.
Cyclic voltammetry (CV) was performed in a voltage range between 0 V to 1 V at two different scan rates of 5, 10, and 25 mV/s for 10 cycles to determine the peak current and charge storage capacity or higher capacitance of the nanocomposite electrode.
A gravimetric charge–discharge test was performed at a current density of 0.5 A/g, between a potential range of 0 to 0.8 V. Samples were cycled under galvanostatic conditions.
The EIS test was performed between 106 Hz and 10−2 Hz, with applied DC voltage of 1 V open circuit potential. The porosity of the composite materials was determined by using the modified Archie’s law and the bulk resistivity Ru of the working electrode. Ru was obtained from the complex Nyquist curve fitted with a 5-element Randle’s cell circuit model. Equation (1) was utilized to determine the specific capacitance (Cp) in F/g, where I(A) represents the response current recorded during the voltage sweep ΔV (V) at a given scan rate v (mV/s) for the specific active material mass m (g). The term I d V   denotes the integrated area under the cyclic voltammetry curve.
C p = I d V 2 m × v × V
EIS models for determining specific capacitance (Cp) utilize the Bode and Nyquist plots according to equation [2], where f represents the Bode frequency (s−1) at the peak of the Nyquist plot, Zmax is the maximum imaginary impedance (Ω), and m denotes the mass of the active material (g):
C p = 1 2 π f Z ʹ m a x × m
The specific capacitance ( C p ) from charge–discharge curves can be calculated using Equation (3). In this equation, I m is the discharge current density (A/g), Δt is the duration of the discharge (s), and ΔV is the voltage drop (V) observed during the discharge period.
C p = I m t V
The energy density (Eg) and power (Pg) density were obtained from Equations (4) and (5).
E g = 0.5 C p ( V 2 )
P g = E g t

4. Results and Discussion

4.1. X-Ray Diffraction (XRD)

X-ray diffraction (XRD) patterns for the fabricated samples are presented in Figure 4. In Figure 4a, neat CNTs (i) display a broad peak near 2θ ≈ 25.8°, corresponding to the (002) plane of graphitic carbon. This feature indicates the semi-crystalline nature and turbostratic structure of CNTs. Upon incorporating polyimide at 90 °C (ii), peak broadening and intensity reduction are observed due to amorphous PI embedding and coating. At 250 °C (iii), further intensity loss indicates densification and the loss of long-range graphitic order. Additionally, a slight hump is observed between 25 and 30°, which is attributed to partial graphitic ordering and π–π stacking interactions between CNTs, likely induced by thermal rearrangement and matrix densification during high-temperature imidization. This feature reflects localized short-range ordering within the otherwise amorphous composite structure. In Figure 4b, PI/CNTs–PPy–90 °C (i) and PI/CNTs–Ppy–250 °C (ii) both exhibit diffused profiles, typical of amorphous polypyrrole deposition, with further reduction in crystalline signatures. No sharp peaks for crystalline phases are evident across the samples, confirming the disordered nature of the polymer composites. Crystallite size and microstrain were not calculated due to the absence of well-defined peaks. These results are consistent with SEM and EIS analyses and reinforce the composite’s suitability for electrochemical performance over crystalline order. Similarly, in our recent publication, SEM and EDX imaging showed how the morphology of PI/CNTs-PPy varies with different processing conditions [45]. Additionally, the XRD analysis was performed on powdered samples, which were carefully scraped from the surfaces of the thermally processed and polypyrrole-coated films to ensure uniformity and sufficient sample quantity for accurate diffraction measurements.

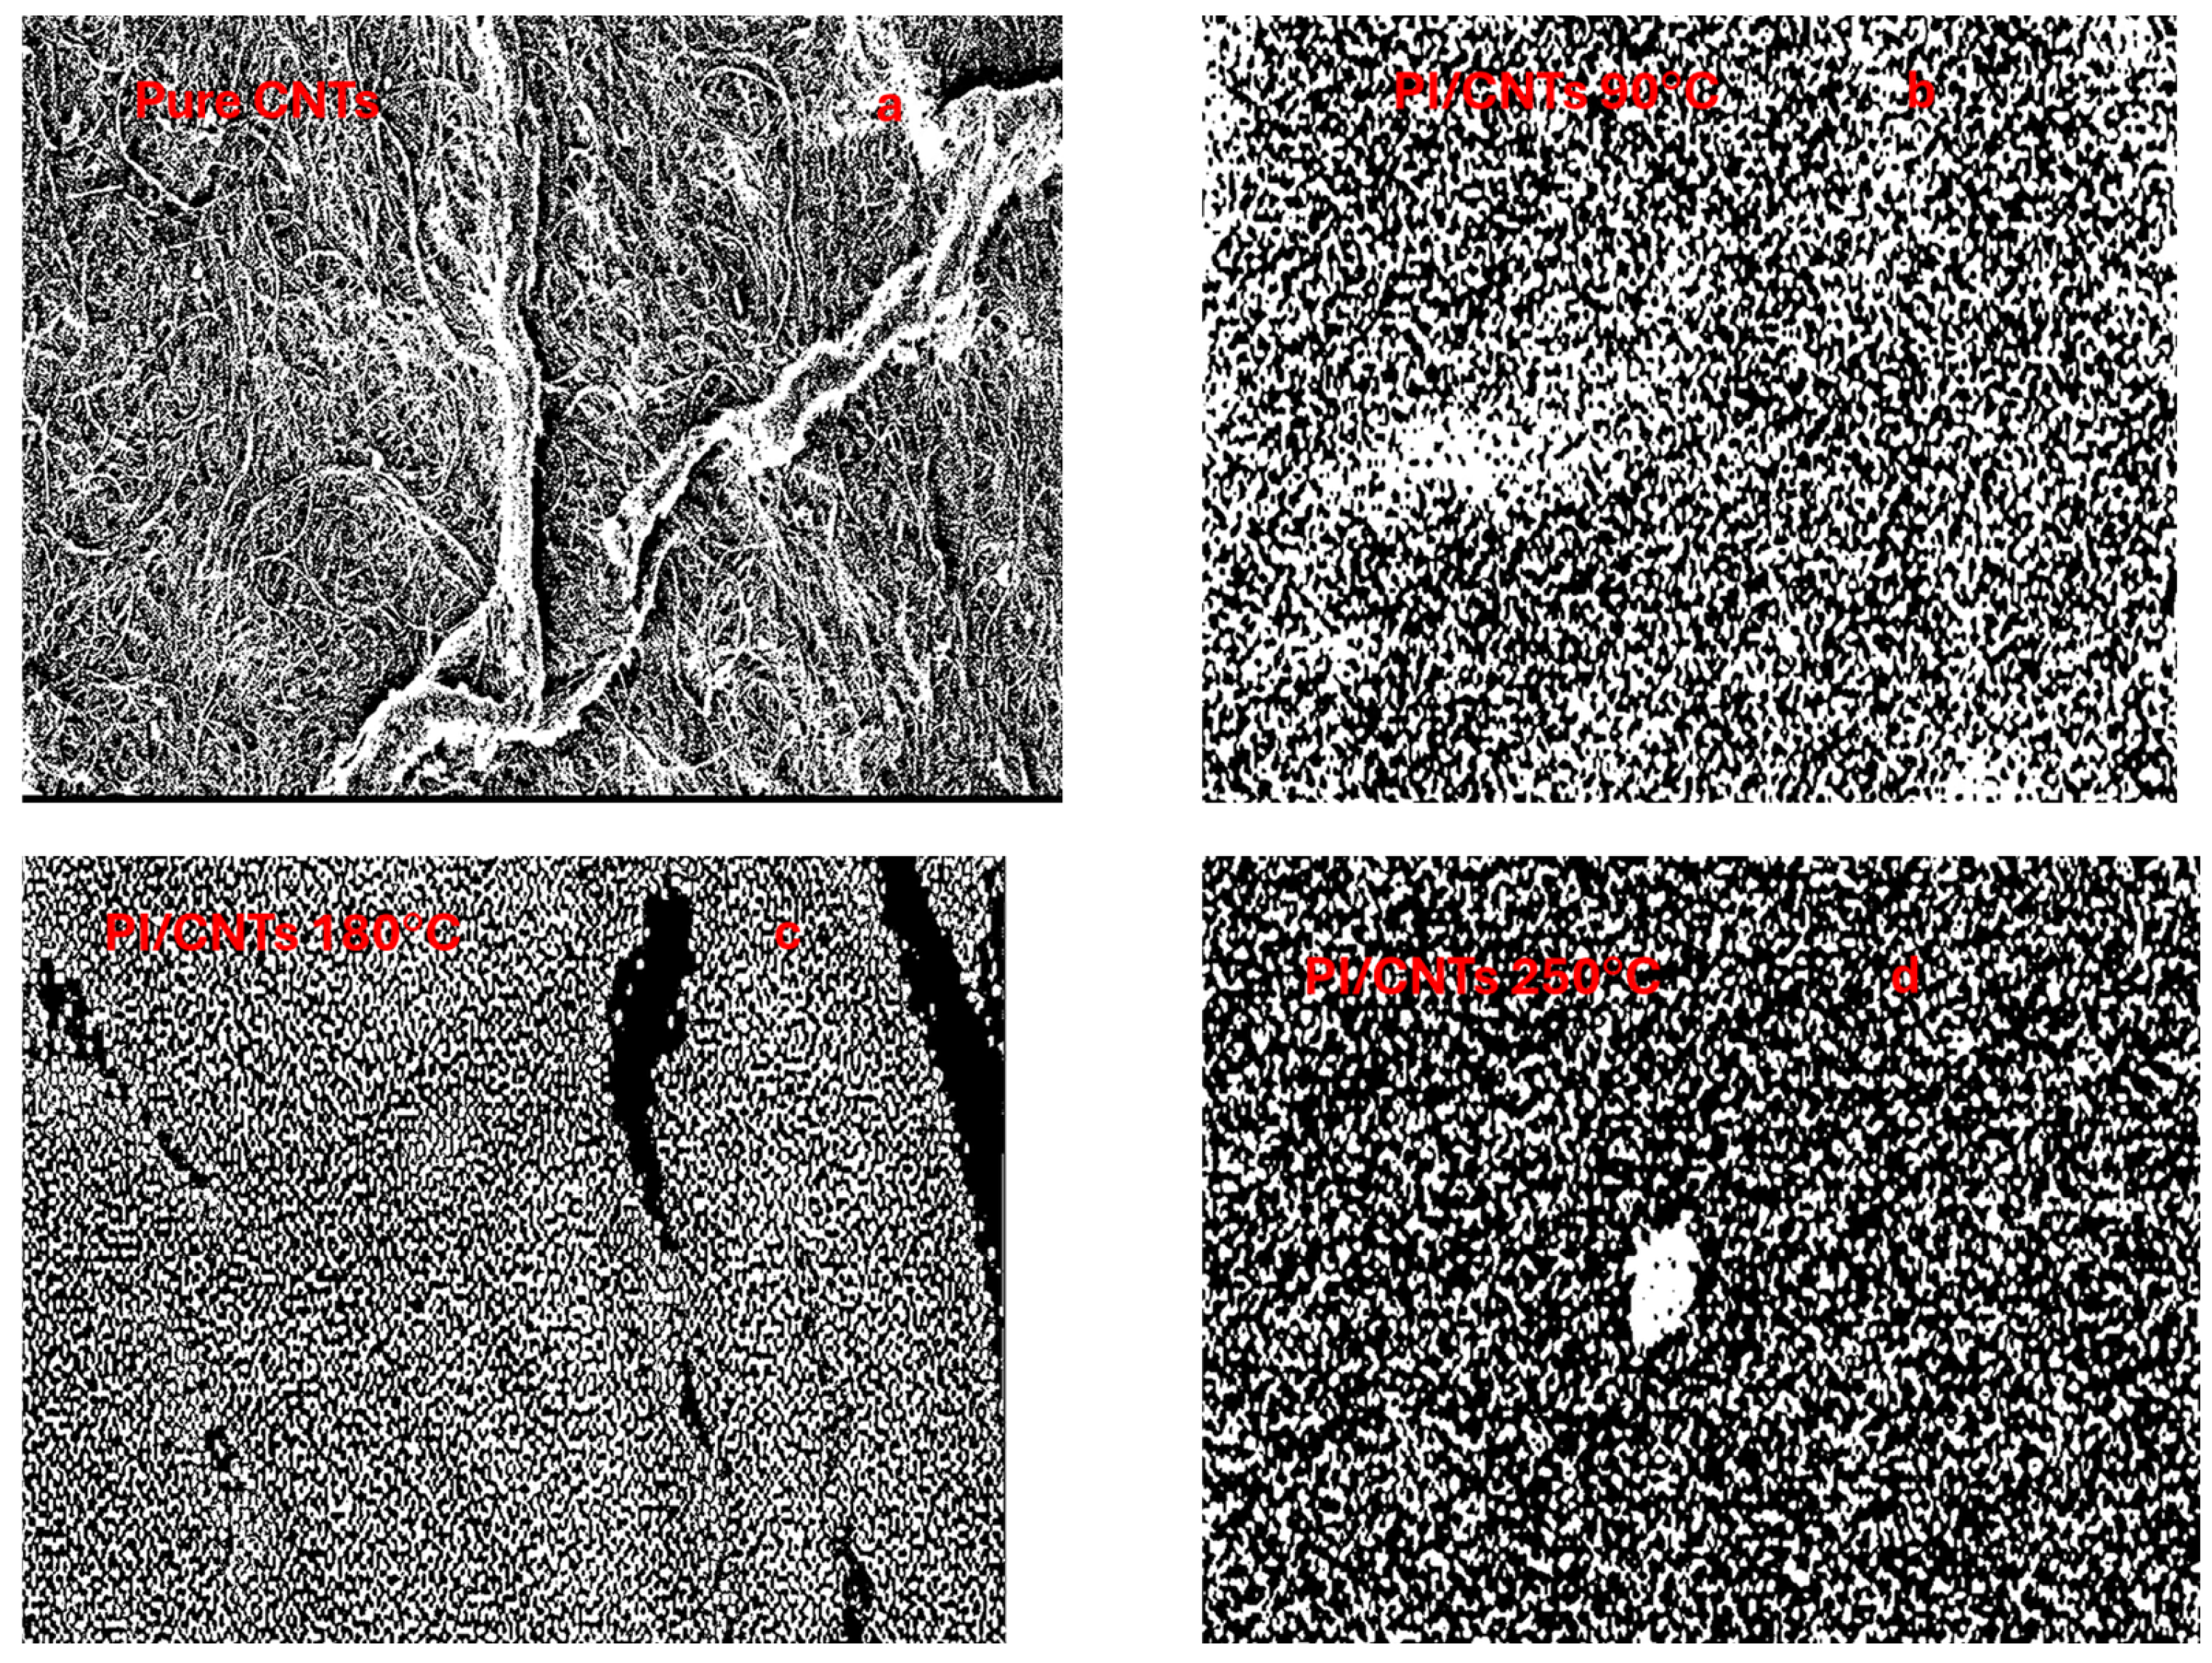
4.2. Scanning Electron Microscopy (SEM)

Figure 5 shows SEM micrographs of (a) neat CNTs, (b) PI/CNTs annealed at 90 °C, (c) PI/CNTs annealed at 180 °C, and (d) PI/CNTs annealed at 250 °C. The images were processed using local thresholding techniques to quantify porosity. As annealing temperature increases, the poly(amic acid) matrix transitions more completely to polyimide, resulting in reduced porosity and a denser microstructure. This trend is evident in both areal and through-thickness porosity measurements obtained from SEM image analysis.
Figure 6 illustrates the microstructural changes and porosity evolution of PI/CNTs–PPy composites annealed at 90 °C, 180 °C, and 250 °C. SEM micrographs in Figure 6a–c show a clear reduction in surface porosity with increasing temperature, as the initially open and porous structure at 90 °C becomes progressively denser at 180 °C and most compact at 250 °C. These visual trends align with the quantitative values in Table 3, where surface porosity after PPy deposition drops from 38.57% at 90 °C to 22.03% at 180 °C and 10.19% at 250 °C. Cross-sectional SEM analysis further confirms this progression, with through-thickness porosity decreasing from 37.08% at 90 °C to 24.79% and 16.06% at 180 °C and 250 °C, respectively. Figure 6d schematically contrasts surface-visible pores with ion-accessible pathways, explaining why EIS-based porosity is typically lower than SEM-measured values, as only interconnected pores contribute to ionic transport. Together, Figure 5 and Figure 6 highlight how thermal treatment and PPy deposition influence pore structure and connectivity, impacting ion diffusion and electrochemical performance.

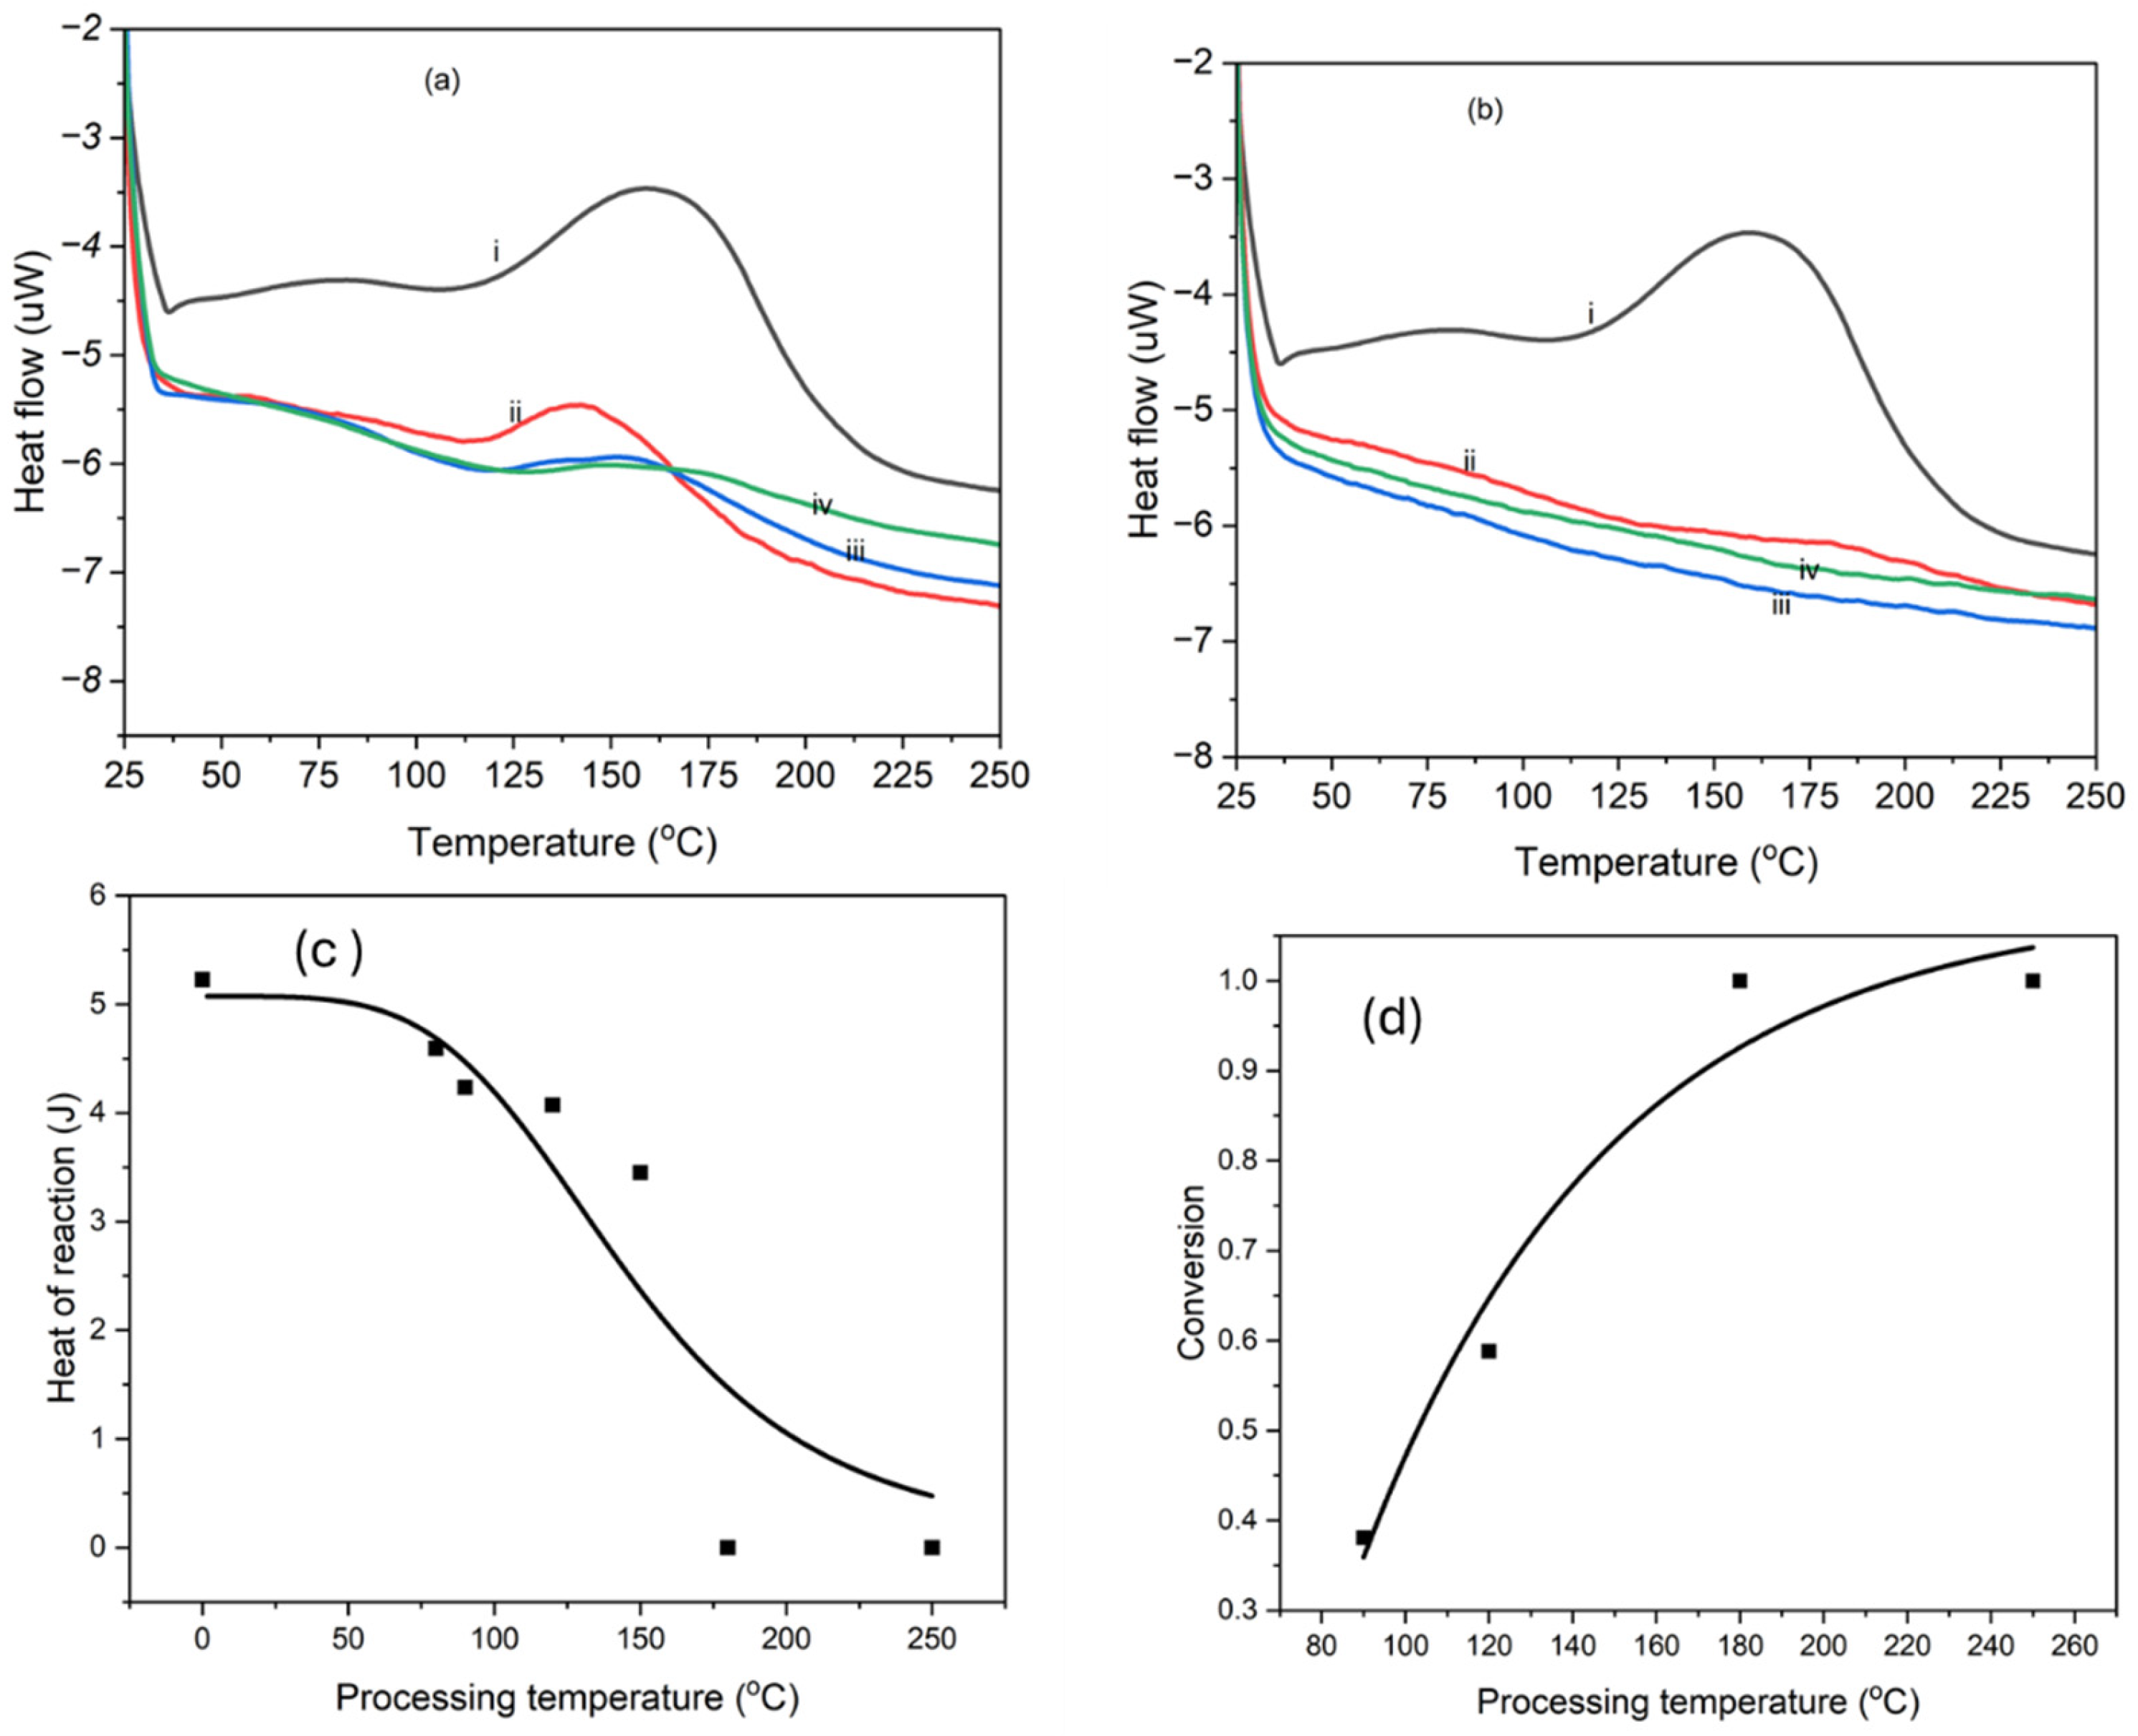
4.3. Thermal Analysis and Imidization

The DSC thermograms for the neat PAA and PAA-CNTs sheets thermally treated between 80 and 250 °C are shown in Figure 7a,b. It is shown that the heat of imidization is highest for the control PAA sample. The heat of imidization decreases with increasing temperature of imidization. The PI/CNTs composites show significantly lower heat of imidization than the neat PAA. It is shown that the heat of imidization decreases with increasing imidization temperature.
At 120 °C, the heat of the reaction decreased as imidization reaction increased, producing a denser structure, while at 150 °C, a significant reduction in heat of the imidization reflected a nearly completed imidization process. Samples processed at 180 °C and 250 °C produced negligible heat of imidization, confirming full imidization and the formation of dense, thermally stable microstructures (Figure 7a,b). The differential scanning calorimetry (DSC) data clearly indicate varying degrees of imidization for PI/CNTs composites processed at different temperatures. Using Equation (6), the degree of imidization (DOI) was quantitatively determined by comparing the enthalpy of imidization for each sample against the theoretical maximum for complete conversion. The calculated DOI values are approximately 38.3% at 90 °C, 98.9% at 180 °C, and reach 100% at 250 °C, as summarized in Table 3. These values demonstrate the progressive completion of the imidization reaction with increasing temperature, leading to reduced porosity and structural densification observed in SEM and EIS analyses. The DOI values correlate strongly with electrochemical performance: composites with lower imidization (e.g., 90 °C) retain higher porosity and exhibit enhanced ionic transport and capacitance, while fully imidized systems (250 °C) show limited ion accessibility due to densification, despite improved mechanical stability. This quantitative insight confirms that the degree of imidization serves as a key design parameter in tailoring the structural and electrochemical properties of PI-based hybrid electrodes.
The degree of imidization was calculated by using Equation (6).
a = 1 H T H o
where H T is the heat of imidization at the test temperature and H o is the heat of imidization for PAA. The heat of imidization decreased while the extent of imidization increased with increasing testing temperature, as shown in Figure 7c,d.
The electrochemical analysis focused on samples processed at 90 °C, 180 °C, and 250 °C, with the 90 °C sample showing the best performance due to its partially imidized microstructure that balances porosity and ion transport for effective charge storage. The 180 °C sample exhibited reduced performance as the denser structure from advanced imidization restricted ion diffusion despite improved stability. The 250 °C sample showed the lowest performance, as complete imidization resulted in a highly dense structure with minimal porosity, limiting ion accessibility and redox activity. These findings highlight how processing temperature affects thermal behavior, microstructural evolution, and electrochemical performance in hybrid nanocomposites for energy storage applications.

4.4. Electrodeposition of Polypyrrole

The transient current–time curves obtained during potentiostatic electrochemical polymerization of pyrrole onto the hybrid nanocomposite electrodes are shown in Figure 8a. As the polymerization time increased, the steady-state current approached 0.06 A. The sample prepared under 60 s of deposition showed the highest initial current of about 0.16 A, which rapidly dropped to approximately 0.08 A due to the formation of a thin, uniform PPy layer. This sharp initial current drop is primarily attributed to the rapid nucleation and growth of PPy at electroactive sites on the electrode surface. During this stage, pyrrole monomers are oxidized at high rates, resulting in an initial current spike. As polymer chains begin to form and coalesce into a film, the number of exposed active sites decreases, thereby reducing the current. Additionally, the development of a resistive polymeric layer contributes to the drop by increasing interfacial resistance and limiting further monomer diffusion. Nevertheless, the thin PPy layer deposited at 60 s maintains high ionic accessibility and low charge transfer resistance, which contributes to enhanced electrochemical performance.
To further support this interpretation, the total charge passed during electrodeposition was calculated for each deposition time using the relation Q = I a v g × t . For 60 s, 600 s, and 700 s deposition periods; the estimated charges that were passed were 7.2 C, 33.0 C, and 14.0 C, respectively as Table 4. These values align with the trend observed in electrode weight gain (Figure 8b) and support the conclusion that prolonged deposition results in thicker, less porous films that may hinder ion transport.

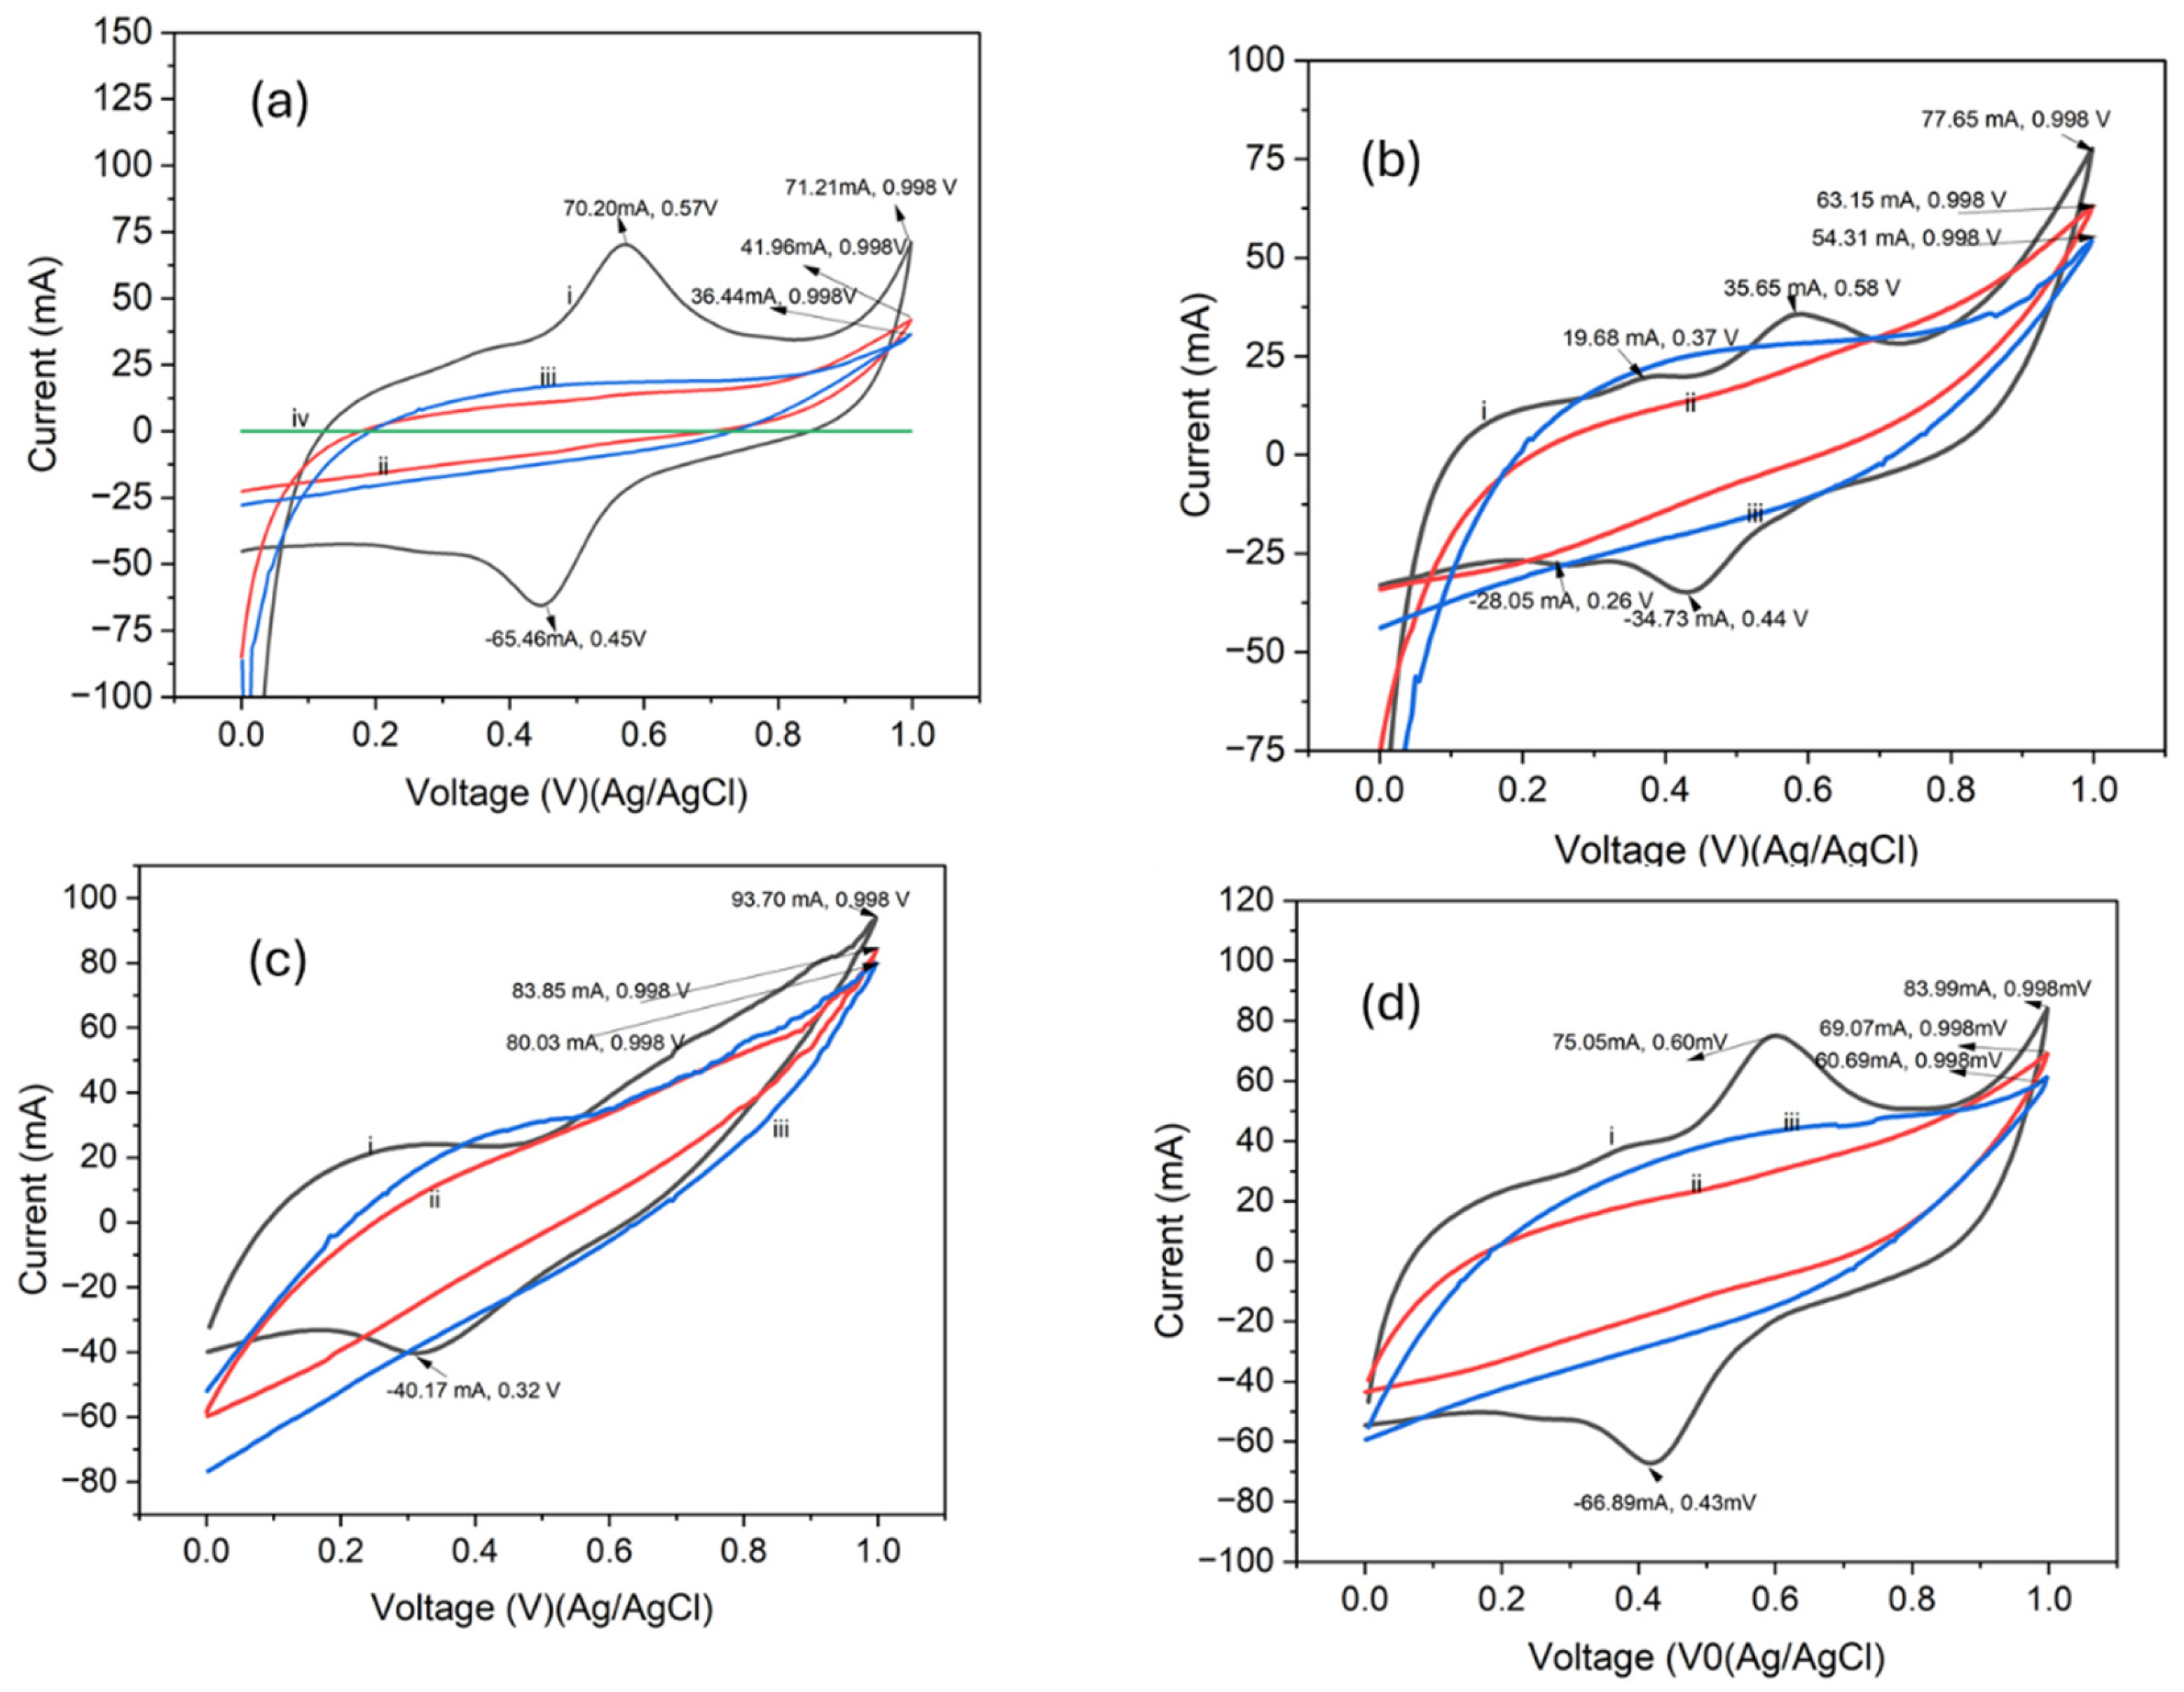
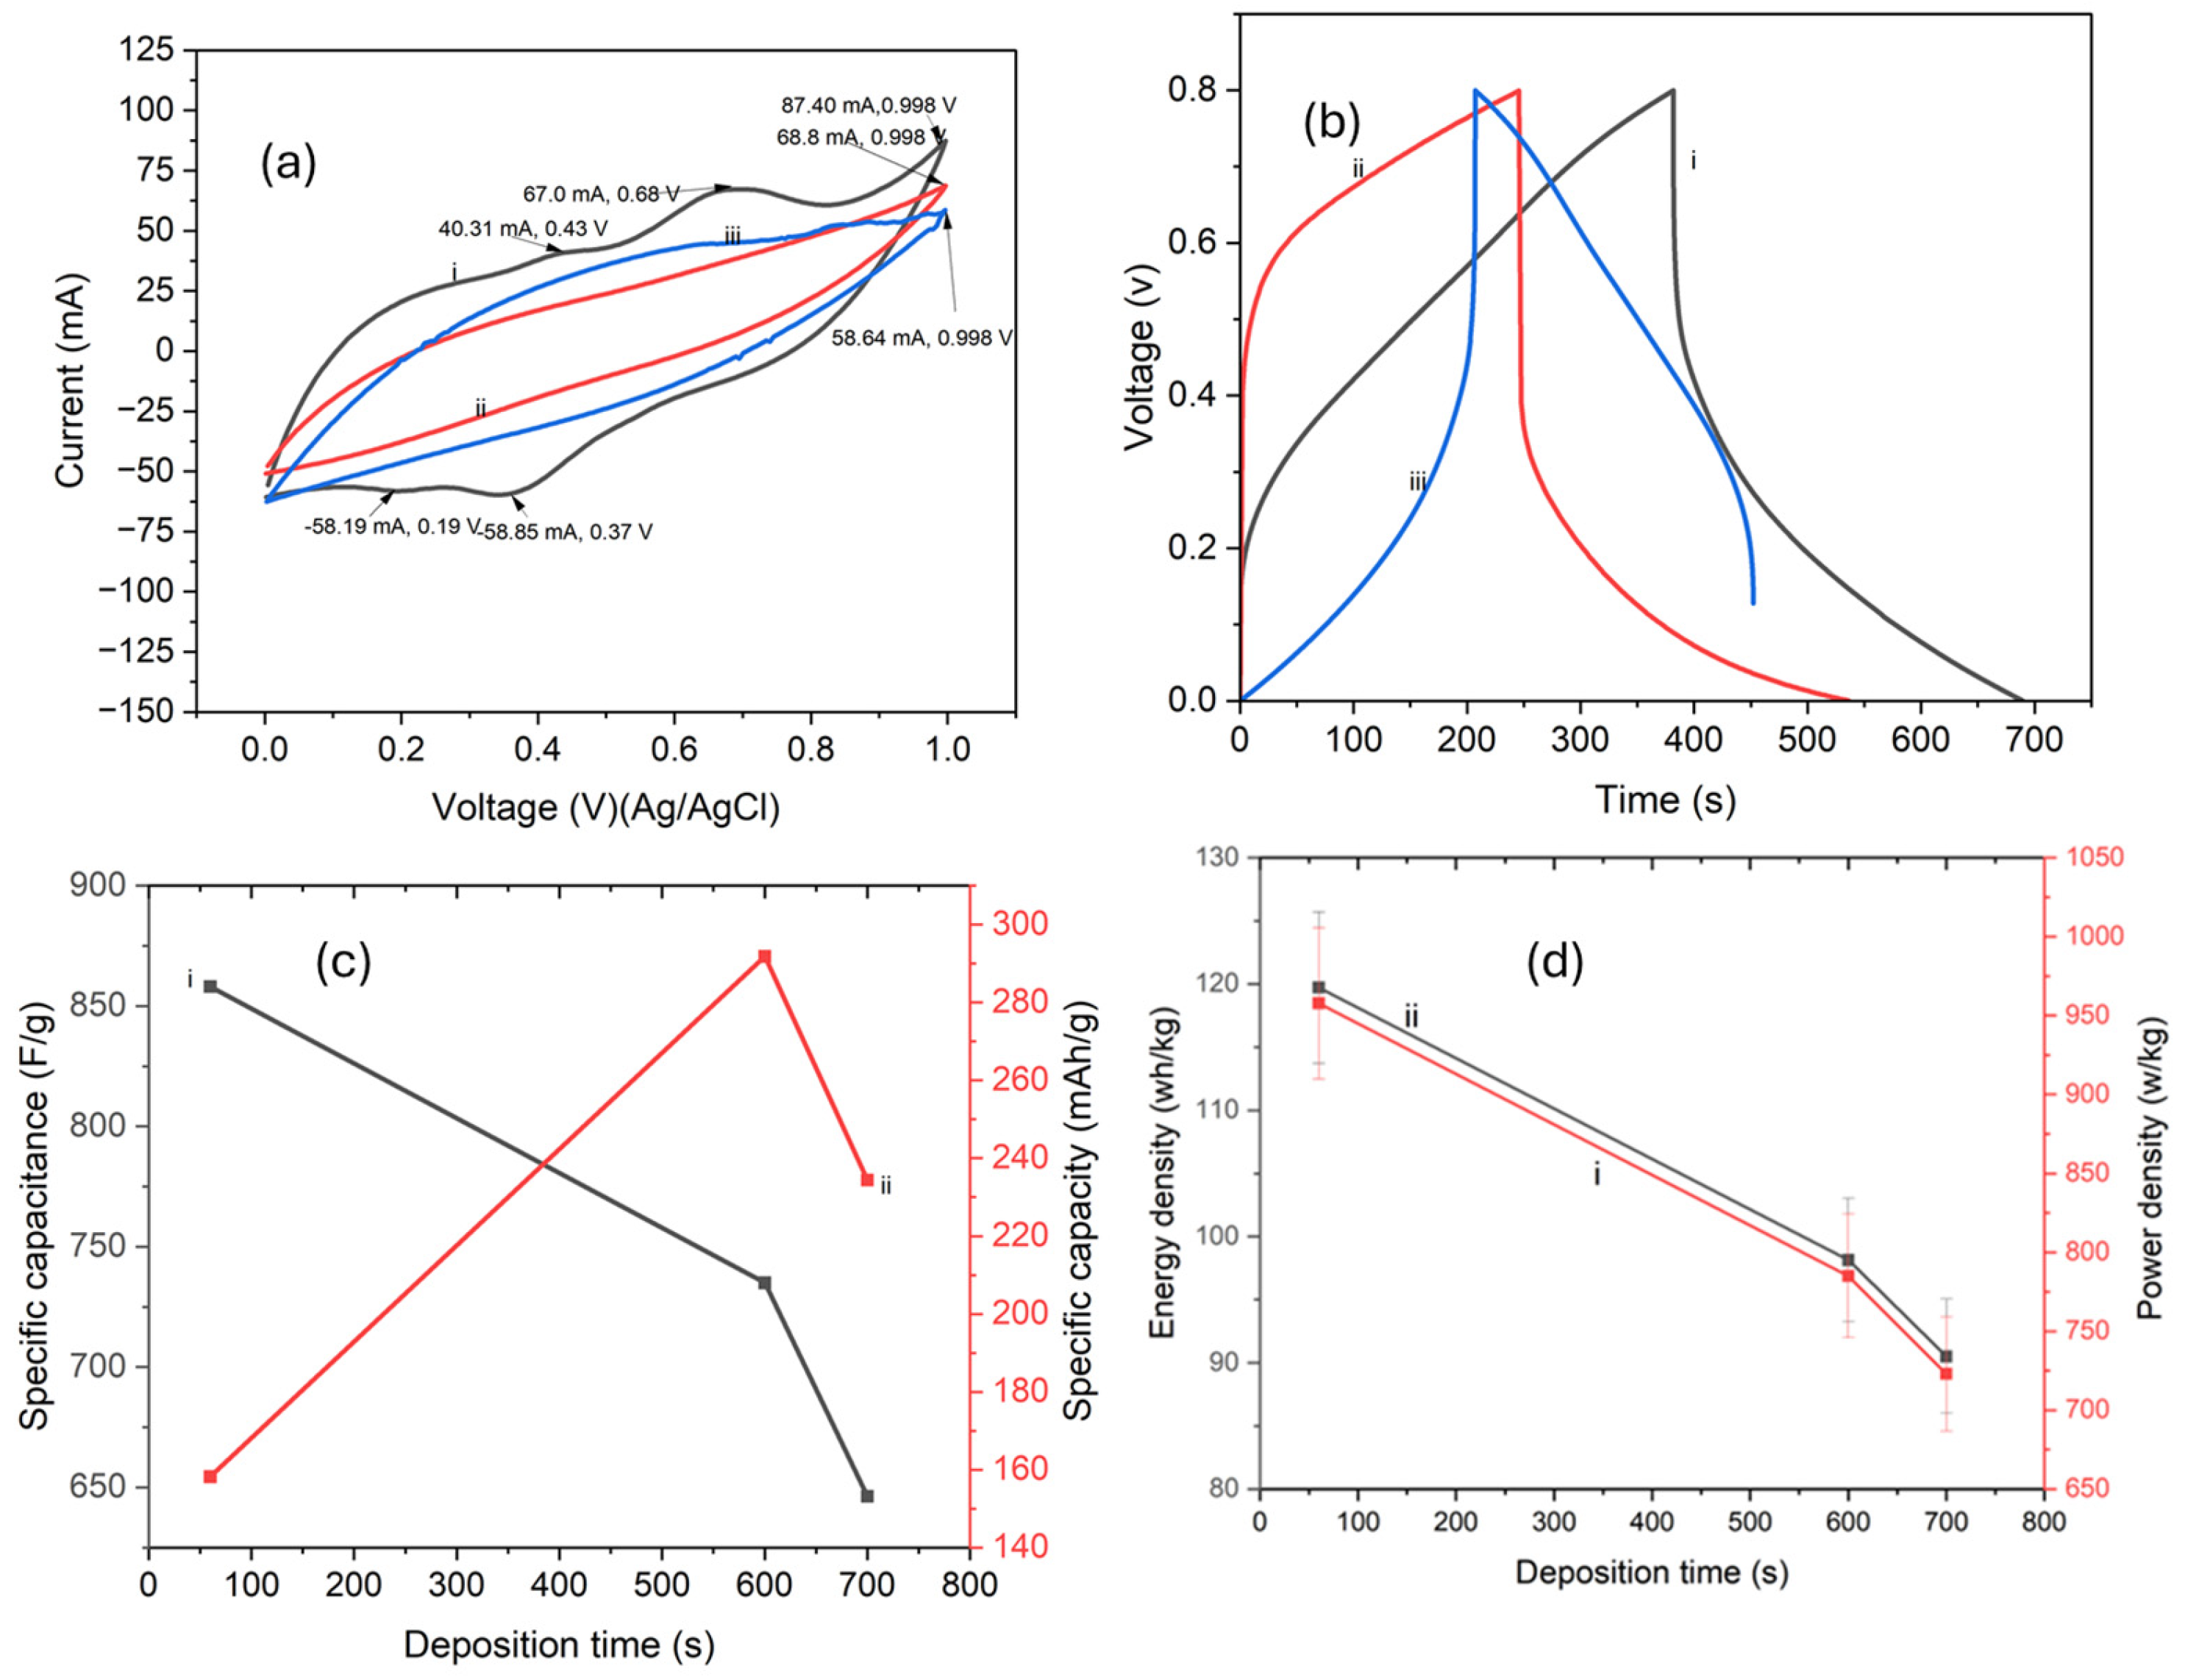
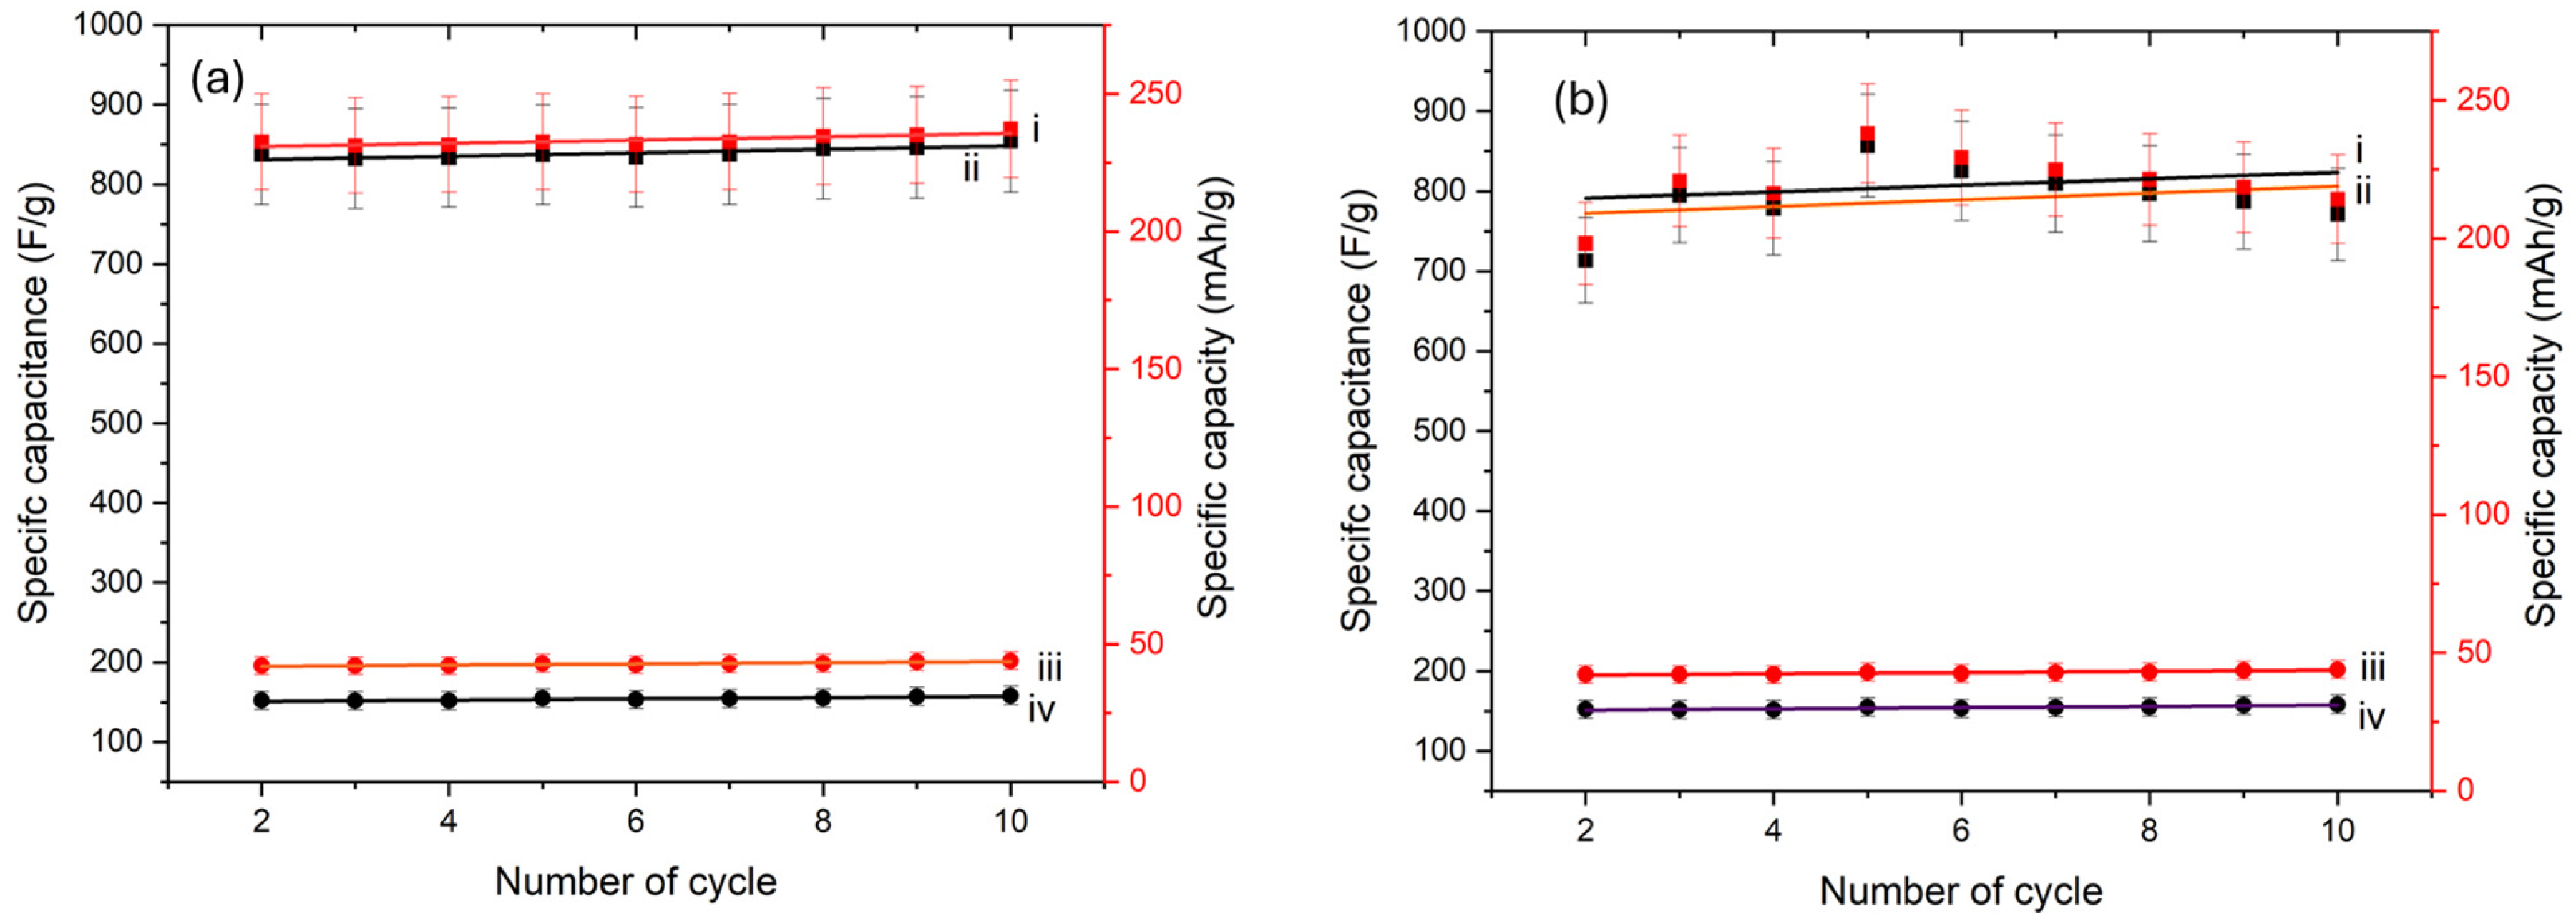
4.5. Electrochemical Properties

Figure 9, Figure 10 and Figure 11a show the cyclic voltammograms obtained at scan rates of 5, 10, and 25 mV/s. The CV data were used to determine the specific gravimetric capacitance (Cp) of the electrode material before and after deposition of PPy. Figure 9 presents the cyclic voltammetry (CV) curves for PI/CNTs/PPy composites processed at different deposition times and scan rates. The CV profiles of the 90 °C and 60 s deposition sample exhibit a nearly rectangular shape with minor redox peaks, indicating a combination of double-layer capacitance and pseudocapacitive behavior. This characteristic suggests that the sample has a well-balanced charge storage mechanism, leading to high charge efficiency and rapid ion transport. In contrast, samples with longer deposition times (600 s and 700 s) show distorted CV curves with lower current response, which can be attributed to increased polymer thickness limiting charge transfer and ion diffusion. Additionally, at higher scan rates, the 60 s deposition sample maintains its rectangular shape better than the other samples, indicating superior rate capability and enhanced electrochemical kinetics.
Figure 10 illustrates the relationship between the shape and size of the voltammograms and the scan rate for 5 cycles and 10 cycles of CV. The 60 s deposition sample exhibits both redox processes and diffusion loop for all scan rates, emphasizing its excellent charge storage capability. As the scan rate increases, a gradual decrease and disappearance of the redox peaks is observed for all samples, but the 60 s deposition composite retained a significant portion the redox peaks, reinforcing the notion that thinner, uniformly distributed PPy layers facilitate efficient charge storage. In contrast, the 600 s and 700 s samples experience a more pronounced capacitance drop at higher scan rates, further supporting the hypothesis that excessive deposition hinders ion transport due to reduced porosity and increased charge-transfer resistance.
Figure 11 presents the electrochemical performance of PI/CNTs hybrid nanocomposites processed at 90 °C followed by the electrodeposition of PPy at different deposition times.
Figure 11a illustrates the cyclic voltammograms (CVs) of the composites at 25 mV/s over 10 cycles. The 60 s deposition sample exhibits a well-defined quasi-rectangular CV shape, indicative of efficient charge storage and high capacitive behavior. As the deposition time increases to 600 s and 700 s, the CV curves become slightly distorted, suggesting increased resistive effects and reduced electrochemical activity due to the formation of a thicker PPy layer, which limits ion diffusion and charge transport. Figure 11b presents the galvanostatic charge–discharge (GCD) profiles of the composite electrodes at different deposition times. The 60 s deposition sample exhibits the longest discharge duration, confirming its superior charge storage capacity and lower internal resistance. As deposition time increases, the charge–discharge curves show increased IR drops, with the 700 s sample exhibiting the shortest discharge duration due to higher charge transfer resistance and lower capacitance retention. Figure 11c provides a quantitative comparison of the specific capacitance and specific capacity of the composites. The highest specific capacitance is observed for the 60 s deposition sample, reinforcing its optimal balance of porosity and conductivity. In contrast, as deposition time increases, specific capacitance decreases due to excessive PPy deposition, which hinders ion accessibility and reduces active surface area. Similarly, specific capacity follows the same trend, with the 700 s deposition sample exhibiting the lowest values, further confirming the adverse effects of excessive deposition on electrochemical performance. Figure 11d compares the power density and energy density of the composites. Even though these were originally calculated at the electrode level, this approach is not fully compliant with standard regulations, as these parameters are conventionally applicable to full supercapacitor devices rather than individual electrodes. The 60 s deposition sample demonstrates the highest energy and power densities, making it the most efficient configuration for energy storage applications. The 600 s and 700 s samples show a decline in both parameters due to increased internal resistance and reduced charge storage efficiency. These findings are consistent with the CV and GCD results, further confirming that an optimized PPy deposition time of 60 s enhances electrochemical performance, while excessive deposition leads to performance degradation. Overall, the data from Figure 11 highlight the importance of optimizing deposition time to achieve a balance between conductivity, porosity, and charge transport properties, ensuring improved capacitive performance and energy storage efficiency.
Figure 12 illustrates the comparison of specific capacitance and specific capacity for PI/CNTs/PPy composites processed at different temperatures (90 °C, 180 °C, and 250 °C). The data indicate that composites processed at 90 °C exhibit the highest specific capacitance and specific capacity, which is attributed to the retention of porosity and partially imidized structure, enhancing ion diffusion and charge storage efficiency. This suggests that lower processing temperatures favor the formation of an electrode material with optimal electrochemical properties. Conversely, samples processed at 250 °C show a significant decline in both specific capacitance and specific capacity. This can be attributed to the extensive imidization at high temperatures, leading to a denser structure with reduced porosity, which in turn restricts ion mobility and charge storage. The trend observed at 180 °C represents an intermediate state, where partial imidization results in moderate electrochemical performance, balancing structural stability with charge storage capacity. These findings emphasize the importance of processing temperature optimization in the fabrication of PI/CNTs/PPy composites for energy storage applications. Lower-temperature processing (90 °C) maintains porosity and enhances charge transfer properties, while higher temperatures (250 °C) reduce these beneficial characteristics due to complete imidization. Therefore, controlling the imidization temperature is critical in tailoring the electrochemical properties of these composites to achieve maximum energy storage efficiency.
Figure 13 presents a detailed analysis of redox behavior and charge storage characteristics of the PI/CNTs/PPy composites over multiple cycles, offering insight into how processing temperature influences electrochemical performance. Figure 13a shows the evolution of the redox peak ratio, which reflects the reversibility and balance of the redox reactions. A ratio closer to unity indicates symmetrical oxidation and reduction processes, characteristic of efficient and stable charge transfer. Composites processed at lower temperatures (notably 90 °C) exhibit a higher and more consistent redox ratio, suggesting enhanced electron transfer kinetics and improved pseudocapacitive behavior. In contrast, samples processed at higher temperatures show a decrease in redox ratio due to structural densification, which reduces ion accessibility and hinders charge transfer dynamics.
Figure 13b illustrates the redox charge, calculated as the sum of anodic and cathodic charges. This value quantifies the total charge transferred via faradaic processes, reflecting the active redox contribution to energy storage. The increasing trend in redox charge with cycling indicates electrode activation and improved utilization of redox-active sites, particularly in the 90 °C-processed sample.
Figure 13c presents the fractional charge represents the total charge including both redox and double-layer contributions. This metric reveals the relative contribution of faradaic (redox) processes to the overall energy storage mechanism. Values ranging from 60% to 70% over 10 cycles suggest a dominant pseudocapacitive behavior, with redox processes accounting for a substantial portion of the stored charge. Notably, the highest fractional redox contribution is observed in samples processed at 90 °C, reinforcing the effectiveness of low-temperature imidization in preserving porosity and enhancing ionic/electronic transport.
Together, these results underscore the critical role of processing temperature in determining redox activity and charge storage efficiency. Lower thermal treatment temperatures retain a porous and electrochemically accessible network that supports fast ion diffusion and efficient redox reactions. As processing temperature increases, the resulting structural densification restricts ion transport and lowers both redox contribution and charge transfer efficiency. These findings validate the hypothesis that moderate thermal processing particularly at 90 °C optimizes the structural and electrochemical properties of PI/CNTs/PPy composites, making them highly promising for high-performance energy storage applications.
Figure 14a presents the electrochemical impedance spectroscopy (EIS) Nyquist plots for PI/CNT hybrid nanocomposites processed at 90 °C with varying polypyrrole (PPy) deposition times (60 s, 600 s, and 700 s). The intercept on the real axis (Z′) represents the solution resistance (Rs), which encompasses both the electrolyte resistance and the contact resistance at the electrode–electrolyte interface. A progressive shift in this intercept toward higher values with increased deposition time reflects a rise in bulk resistance, attributed to the formation of thicker and denser PPy films. This increase limits ionic accessibility and impairs charge transfer efficiency. Electrochemical impedance spectroscopy (EIS) analysis was further conducted to extract quantitative parameters from the data, using a simplified Randles circuit model. As summarized in Table 5, the sample polymerized for 60 s exhibited the lowest charge transfer resistance (Rct = 9.56 Ω) and the highest double-layer capacitance (Cdl = 192.1 µF), indicating efficient interfacial charge transfer resulting from a thin, uniform PPy layer. In contrast, longer deposition times of 600 s and 700 s resulted in significantly higher Rct values and lower Cdl, signifying hindered ion diffusion and reduced electronic conductivity due to excessive PPy accumulation. Additionally, the absence of a near-vertical region in the low-frequency domain of the Nyquist plots points to Warburg impedance, characteristic of diffusion-limited charge transport. This behavior is particularly pronounced in the 600 s and 700 s samples, where excessive PPy thickness obstructs ion pathways. Notably, the Nyquist plot for the 60 s sample exhibits a single semicircle, representing a dominant and straightforward charge transfer process at the electrode–electrolyte interface. In contrast, the 600 s and 700 s samples display two semicircles, indicating the emergence of multiple interfacial processes such as layered charge transport within the bulk of the thicker PPy film or the formation of distinct resistive interfaces—reflecting a more complex electrochemical response. The overall impedance response suggests a mixed charge storage mechanism involving both Faradaic (pseudocapacitive) and double-layer capacitance processes. These findings reinforce that a moderate PPy deposition time of 60 s offers an optimal balance between film thickness, conductivity, interfacial charge transfer, and ion diffusion. Overextended deposition leads to higher internal resistance and degraded electrochemical performance, underscoring the importance of tailoring deposition conditions in hybrid nanocomposite design for efficient energy storage applications.
The phase diagram (Figure 14b) further supports these findings by illustrating that lower processing temperatures result in composites with a higher capacitive response. Retaining a partially imidized structure at 90 °C facilitates greater ion mobility and improves charge storage efficiency. The comparison of energy and power densities (Figure 14c) highlights the advantages of lower-temperature processing as summarized in Table 6, where PI/CNTs processed at 90 °C achieve the highest energy density among the tested conditions. This finding emphasizes the importance of optimizing imidization temperature and deposition time to maximize electrochemical performance.
Overall, Figure 14 reinforces the conclusion that moderate processing conditions (90 °C with 60 s deposition) produce composites with the best balance of structural stability and electrochemical efficiency. These results underscore the necessity for precise synthesis parameter control to achieve enhanced energy storage capabilities.
Figure 15 presents the EIS Bode plot and phase angle analysis for PI/CNTs/PPy hybrid nanocomposites processed at different deposition times. Figure 15a illustrates the Bode plot, which provides information on frequency-dependent impedance behavior. The sample processed at 90 °C with a deposition time of 60 s exhibits the lowest impedance across the frequency range, indicating superior charge transfer characteristics. As deposition time increases to 600 and 700 s, impedance values increase, reflecting the formation of thicker PPy layers that hinder ion transport and increase charge-transfer resistance. Figure 15b presents the phase angle plot, which provides insights into capacitive and resistive behavior. The sample processed at 90 °C with 60 s deposition shows the highest phase angle in the mid-frequency range, indicating better capacitive behavior and enhanced charge storage efficiency. Samples processed at 600 and 700 s demonstrate a reduced phase angle, which suggests increased resistive behavior due to the denser and less porous PPy layer. These findings highlight the significance of optimizing deposition time to balance porosity, ion transport, and conductivity in PI/CNTs/PPy composites. The shorter deposition time (60 s) results in a thin, uniform PPy layer that maximizes ion accessibility and electrochemical performance. In contrast, excessive deposition time leads to thicker, resistive coatings that impede charge storage efficiency.
Table 7 presents the volume resistance and porosity trends for PI/CNTs-PPy composites at different deposition times. The results indicate a direct correlation between deposition time and volume resistance, with longer deposition times leading to increased resistance. This trend is primarily attributed to the thickening of the PPy layer, which introduces higher charge-transfer resistance (Rct) and restricts ion mobility. For the 60 s deposition time, the composite exhibits low bulk resistance (17.7 Ω) and high porosity (12.2%), facilitating efficient ion diffusion and charge transfer. This balance between conductivity and porosity enables superior electrochemical performance. However, as the deposition time increases to 600 s (42.2 Ω, 7.2% porosity) and further to 700 s (61.9 Ω, 4.3% porosity), a denser PPy layer forms, reducing available pore space for electrolyte penetration. This impedes ion transport, increasing overall resistance and limiting charge storage efficiency. The decline in porosity with extended deposition time can be explained by the continuous deposition of PPy, which progressively fills microvoids within the composite structure. While a thin PPy layer (at 60 s deposition) enhances conductivity without significantly hindering porosity, excessive deposition results in a compact structure that restricts electrolyte infiltration and ion diffusion. Consequently, charge storage capacity is reduced due to limited electrochemical active sites and increased internal resistance. These findings highlight the importance of optimizing deposition time to balance conductivity, porosity, and electrochemical efficiency. The 60 s deposition condition provides the best trade-off, ensuring high porosity for ion transport while maintaining sufficient PPy coverage to enhance charge storage capabilities. Longer deposition times, while increasing PPy content, introduce excessive resistance, diminishing the overall performance of the electrode material.

5. Effect of Time and Temperature on the Hybrid Nanocomposite

The deposition time and temperature effect on polyimide hybrid nanocomposites significantly impact their electrochemical performance, porosity, and resistance characteristics. As shown in Figure 8, shorter deposition times, such as 60 s, generally produce thinner polypyrrole (PPy) layers, which enhance porosity and ion transport, yielding high specific capacitance and lower charge transfer resistance (Rct) in electrochemical impedance spectroscopy (EIS) measurements. However, as deposition time increases to 600 and 700 s, the PPy layer thickens (Figure 8b), decreasing porosity and increasing Rct due to reduced ion diffusion, which impedes charge storage capacity. Similarly, processing temperature influences these properties, with lower temperatures (90 °C) preserving porosity and enhancing ion transport, leading to better electrochemical performance (Figure 12). Higher temperatures (such as 180 °C and 250 °C) promote a more extensive imidization process in the polyimide matrix, which strengthens the composite but may also reduce porosity and increase bulk resistance (Figure 14 and Figure 15).
The cyclic voltammograms presented in Figure 9, Figure 10 and Figure 11 demonstrate that samples processed at 90 °C with a deposition time of 60 s exhibit a nearly rectangular CV shape, indicative of efficient charge storage. The higher-temperature samples (250 °C) show a distorted CV profile, suggesting increased internal resistance. The galvanostatic charge–discharge curves in Figure 12b further support this observation, with the 60 s deposition sample displaying the longest discharge time and highest capacitance retention. The influence of temperature and deposition time on energy storage efficiency is further illustrated in Figure 13, which highlights the differences in redox charge and charge transfer efficiency. The results confirm that lower temperatures and shorter deposition times facilitate greater ion mobility and charge storage, making them the optimal conditions for electrode fabrication. Additionally, the X-ray diffraction (XRD) results in Figure 4 provide insights into the structural modifications induced by different processing conditions. The diffraction patterns indicate that at 90 °C, the PI/CNT composite retains broader peaks, suggesting an amorphous structure with enhanced ionic accessibility. Conversely, at higher temperatures (250 °C), the XRD peaks become sharper, indicating a more crystalline structure that may hinder ion diffusion and impact electrochemical performance. The inclusion of PPy further alters the crystallinity, as seen in Figure 4b, where peak broadening and shifts suggest strong interaction between the polymer matrix and CNTs, reinforcing the conductive network.
This combined effect of temperature and deposition time indicates that lower temperatures and shorter deposition times are generally more favorable for producing high-performance polyimide hybrid nanocomposites, as they maintain an optimal balance of structural integrity, ion transport, and electrochemical activity suitable for energy storage applications.

6. Conclusions

This study demonstrates a systematic approach to engineering PI/CNTs–PPy hybrid nanocomposites for energy storage applications by controlling the imidization temperature of polyimide and the electrochemical deposition time of polypyrrole. The results reveal that low-temperature processing (90 °C) preserves porosity and provides accessible ion transport pathways, while moderate PPy deposition (60 s) significantly improves electrical conductivity and redox activity without compromising the structural integrity of the composite. In contrast, higher imidization temperatures (180 °C and 250 °C) and prolonged PPy deposition times (600–700 s) lead to densification, increased charge transfer resistance, and a decline in specific capacitance and energy density.
The hybrid design strategy presented in this work offers a tunable platform for tailoring the physical and electrochemical properties of nanocomposites by manipulating thermal and electrochemical processing conditions. This approach allows for the fabrication of multifunctional electrode materials that combine structural stability, enhanced redox contribution, and high specific capacitance. The optimized composite achieved a specific capacitance of 850 F/g and an energy density of 274.56 Wh/kg values that are competitive with or exceed those reported in recent literature.
Overall, this study provides a scalable and environmentally conscious pathway for fabricating hybrid polymer/conductive nanomaterials, with potential applicability in next-generation supercapacitors and lithium-ion battery cathodes. Future work will focus on exploring alternative dopants and co-polymer architectures to further improve charge storage, cycling stability, and interfacial conductivity.

Author Contributions

J.O.I. and A.A. conceptualized the study and developed the methodology, with A.A. handling software implementation. J.O.I. and A.A. conducted validation, while A.A. carried out formal analysis and investigation. J.O.I. managed data curation, and A.A. drafted the original manuscript. Both J.O.I. and A.A. contributed to writing, reviewing, and editing. J.O.I. oversaw visualization, supervision, and project administration, as well as securing funding. All authors have read and agreed to the published version of the manuscript.

Funding

This research received no external funding.

Data Availability Statement

The original contributions presented in this study are included in the article. Further inquiries can be directed to the corresponding author.

Acknowledgments

The authors express their gratitude to the Mechanical and Materials Engineering Department and the Polymers and Composites Laboratory at the University of Cincinnati for their support. They also sincerely appreciate the Director of the Advanced Materials Characterization Center (AMCC) and her team for their valuable assistance with the XRD analysis.

Conflicts of Interest

The authors declare no conflicts of interest.

References

  1. Xu, F.; Wang, H.; Wu, M.; Nan, J.; Li, T.; Cao, S.A. Electrochemical properties of poly (anthraquinonyl imide) s as high-capacity organic cathode materials for Li-ion batteries. Mater. Chem. Phys. 2018, 214, 120–125. [Google Scholar] [CrossRef]
  2. Sui, D.; Xu, L.; Zhang, H.; Sun, Z.; Kan, B.; Ma, Y.; Chen, Y. A 3D cross-linked graphene-based honeycomb carbon composite with excellent confinement effect of organic cathode material for lithium-ion batteries. Carbon 2020, 157, 656–662. [Google Scholar] [CrossRef]
  3. Shi, C.; Takeuchi, S.; Alexander, G.V.; Hamann, T.; O’Neill, J.; Dura, J.A.; Wachsman, E.D. High sulfur loading and capacity retention in bilayer garnet sulfurized-polyacrylonitrile/lithium-metal batteries with gel polymer electrolytes. Adv. Energy Mater. 2023, 13, 2301656. [Google Scholar] [CrossRef]
  4. Lyu, H.; Sun, X.G.; Dai, S. Organic Cathode Materials for Lithium-Ion Batteries: Past, Present, and Future. Adv. Energy Sustain. Res. 2021, 2, 2000044. [Google Scholar] [CrossRef]
  5. Shi, T.; Li, G.; Han, Y.; Gao, Y.; Wang, F.; Hu, Z.; Cai, T.; Chu, J.; Song, Z. Oxidized indanthrone as a cost-effective and high-performance organic cathode material for rechargeable lithium batteries. Energy Storage Mater. 2022, 50, 265–273. [Google Scholar] [CrossRef]
  6. Andezai, A.; Iroh, J.O. Overview of Organic Cathode Materials in Lithium-Ion Batteries and Supercapacitors. Energies 2025, 18, 582. [Google Scholar] [CrossRef]
  7. Zhang, M.; Wang, L.; Xu, H.; Song, Y.; He, X. Polyimides as Promising Materials for Lithium-Ion Batteries: A Review. Nano-Micro Lett. 2023, 15, 135. [Google Scholar] [CrossRef]
  8. Liu, S.; Yang, H.; Sui, L.; Jiang, S.; Hou, H. Self-Adhesive Polyimide (PI)@Reduced Graphene Oxide (RGO)/PI@Carbon Nanotube (CNT) Hierarchically Porous Electrodes: Maximizing the Utilization of Electroactive Materials for Organic Li-Ion Batteries. Energy Technol. 2020, 8, 2000397. [Google Scholar] [CrossRef]
  9. Rathod, V.T.; Kumar, J.S.; Jain, A. Polymer and ceramic nanocomposites for aerospace applications. Appl. Nanosci. 2017, 7, 519–548. [Google Scholar] [CrossRef]
  10. Barbosa, J.C.; Fidalgo-Marijuan, A.; Dias, J.C.; Gonçalves, R.; Salado, M.; Costa, C.M.; Lanceros-Méndez, S. Molecular design of functional polymers for organic radical batteries. Energy Storage Mater. 2023, 60, 102841. [Google Scholar] [CrossRef]
  11. Guo, W.; Liu, C.; Sun, X.; Yang, Z.; Kia, H.G.; Peng, H. Aligned carbon nanotube/polymer composite fibers with improved mechanical strength and electrical conductivity. J. Mater. Chem. 2012, 22, 903–908. [Google Scholar] [CrossRef]
  12. Wang, Q.; Dai, J.; Li, W.; Wei, Z.; Jiang, J. The effects of CNT alignment on electrical conductivity and mechanical properties of SWNT/epoxy nanocomposites. Compos. Sci. Technol. 2008, 68, 1644–1648. [Google Scholar] [CrossRef]
  13. Ma, P.C.; Liu, M.Y.; Zhang, H.; Wang, S.Q.; Wang, R.; Wang, K.; Wong, Y.K.; Tang, B.Z.; Hong, S.H.; Paik, K.W.; et al. Enhanced electrical conductivity of nanocomposites containing hybrid fillers of carbon nanotubes and carbon black. ACS Appl. Mater. Interfaces 2009, 1, 1090–1096. [Google Scholar] [CrossRef] [PubMed]
  14. Shchegolkov, A.V.; Babaev, A.A.; Shchegolkov, A.V.; Chumak, M.A. Synthesis of Carbon Nanotubes by Microwave Method: Mathematical Modeling and Practical Implementation. Theor. Found. Chem. Eng. 2024, 58, 929–935. [Google Scholar] [CrossRef]
  15. Sezer Hicyilmaz, A.; Celik Bedeloglu, A. Applications of polyimide coatings: A review. SN Appl. Sci. 2021, 3, 363. [Google Scholar] [CrossRef]
  16. Wang, H.; Lin, J.; Shen, Z.X. Polyaniline (PANi) based electrode materials for energy storage and conversion. J. Sci. Adv. Mater. Devices 2016, 1, 225–255. [Google Scholar] [CrossRef]
  17. Chougule, M.A.; Pawar, S.G.; Godse, P.R.; Mulik, R.N.; Sen, S.; Patil, V.B. Synthesis and characterization of polypyrrole (PPy) thin films. Soft Nanosci. Lett. 2011, 1, 6–10. [Google Scholar] [CrossRef]
  18. Ramanavičius, A.; Ramanavičienė, A.; Malinauskas, A. Electrochemical sensors based on conducting polymer—Polypyrrole. Electrochim. Acta 2006, 51, 6025–6037. [Google Scholar] [CrossRef]
  19. Gooneratne, R.; Iroh, J.O. Polypyrrole Modified Carbon Nanotube/Polyimide Electrode Materials for Supercapacitors and Lithium-ion Batteries. Energies 2022, 15, 9509. [Google Scholar] [CrossRef]
  20. An, H.; Wang, Y.; Wang, X.; Zheng, L.; Wang, X.; Yi, L.; Bai, L.; Zhang, X. Polypyrrole/carbon aerogel composite materials for supercapacitor. J. Power Sources 2010, 195, 6964–6969. [Google Scholar] [CrossRef]
  21. Mi, H.; Zhang, X.; Xu, Y.; Xiao, F. Synthesis, characterization, and electrochemical behavior of polypyrrole/carbon nanotube composites using organometallic-functionalized carbon nanotubes. Appl. Surf. Sci. 2010, 256, 2284–2288. [Google Scholar] [CrossRef]
  22. Wang, G.X.; Yang, L.; Chen, Y.; Wang, J.Z.; Bewlay, S.; Liu, H.K. An investigation of polypyrrole-LiFePO4 composite cathode materials for lithium-ion batteries. Electrochim. Acta 2005, 50, 4649–4654. [Google Scholar] [CrossRef]
  23. Wang, J.; Chen, J.; Konstantinov, K.; Zhao, L.; Ng, S.H.; Wang, G.X.; Guo, Z.P.; Liu, H.K. Sulfur-polypyrrole composite positive electrode materials for rechargeable lithium batteries. Electrochim. Acta 2006, 51, 4634–4638. [Google Scholar] [CrossRef]
  24. Wang, M.; Zhang, H.; Cui, J.; Yao, S.; Shen, X.; Park, T.J.; Kim, J.K. Recent advances in emerging nonaqueous K-ion batteries: From mechanistic insights to practical applications. Energy Storage Mater. 2021, 39, 305–346. [Google Scholar] [CrossRef]
  25. Li, K.; Wang, Y.; Gao, B.; Lv, X.; Si, Z.; Wang, H.G. Conjugated microporous polyarylimides immobilization on carbon nanotubes with improved utilization of carbonyls as cathode materials for lithium/sodium-ion batteries. J. Colloid Interface Sci. 2021, 601, 446–453. [Google Scholar] [CrossRef]
  26. Xu, F.; Wang, H.; Lin, J.; Luo, X.; Cao, S.A.; Yang, H. Poly (anthraquinonyl imide) as a high capacity organic cathode material for Na-ion batteries. J. Mater. Chem. A 2016, 4, 11491–11497. [Google Scholar] [CrossRef]
  27. Wang, Y.; Liu, Z.; Wang, C.; Hu, Y.; Lin, H.; Kong, W.; Ma, J.; Jin, Z. π-Conjugated polyimide-based organic cathodes with extremely long cycling life for rechargeable magnesium batteries. Energy Storage Mater. 2020, 26, 494–502. [Google Scholar] [CrossRef]
  28. Luo, C.; Ji, X.; Hou, S.; Eidson, N.; Fan, X.; Liang, Y.; Deng, T.; Jiang, J.; Wang, C. Azo compounds derived from electrochemical reduction of nitro compounds for high performance Li-ion batteries. Adv. Mater. 2018, 30, 1706498. [Google Scholar] [CrossRef]
  29. Long, Z.; Shi, C.; Wu, C.; Yuan, L.; Qiao, H.; Wang, K. Heterostructure Fe2O3 nanorods@imine-based covalent organic framework for long cycling and high-rate lithium storage. Nanoscale 2022, 14, 1906–1920. [Google Scholar] [CrossRef]
  30. Andezai, A.; Iroh, J.O. Influence of the Processing Conditions on the Rheology and Heat of Decomposition of Solution Processed Hybrid Nanocomposites and Implication to Sustainable Energy Storage. Energies 2024, 17, 3930. [Google Scholar] [CrossRef]
  31. Bong, S.K.; Sang, H.B.; Park, Y.H.; Kim, J.H. Polyimide/Carbon Nanotubes Composite Films: A Potential for FPCB. In Proceedings of the 2006 International Conference on Nanoscience and Nanotechnology, Brisbane, QLD, Australia, 3–7 July 2006; pp. 407–410. [Google Scholar] [CrossRef]
  32. Seetala, N.; Hendon, C.; Tull-Walker, N.; Van Behr, J.; Hester, B.; Lebron-Colon, M.; Meador, M. Synthesis and characterization of polyimide-carbon nanotube composites. World J. Eng. 2014, 11, 193–198. [Google Scholar] [CrossRef]
  33. Harraz, F.A. Electrochemical Polymerization of Pyrrole into Nanostructured p-Type Porous Silicon. J. Electrochem. Soc. 2006, 153, C349. [Google Scholar] [CrossRef]
  34. Li, J.; Yin, D.; Qin, Y. Carbon materials: Structures, properties, synthesis and applications. Manuf. Rev. 2023, 10, 13. [Google Scholar] [CrossRef]
  35. Sankaran, K.J.; Haenen, K. Properties of Carbon Bulk Materials: Graphite and Diamond. In Synthesis and Applications of Nanocarbons; Wiley: Hoboken, NJ, USA, 2020; pp. 1–23. [Google Scholar] [CrossRef]
  36. Min, J.H.; Patel, M.; Koh, W.G. Incorporation of conductive materials into hydrogels for tissue engineering applications. Polymers 2018, 10, 1078. [Google Scholar] [CrossRef]
  37. Ansaldo, A.; Bondavalli, P.; Bellani, S.; Del Rio Castillo, A.E.; Prato, M.; Pellegrini, V.; Pognon, G.; Bonaccorso, F. High-Power Graphene–Carbon Nanotube Hybrid Supercapacitors. ChemNanoMat 2017, 3, 436–446. [Google Scholar] [CrossRef]
  38. Bandaru, P.R. Electrical properties and applications of carbon nanotube structures. J. Nanosci. Nanotechnol. 2007, 7, 1239–1267. [Google Scholar] [CrossRef]
  39. DiLeo, R.A.; Frisco, S.; Ganter, M.J.; Rogers, R.E.; Raffaelle, R.P.; Landi, B.J. Hybrid germanium nanoparticle–single-wall carbon nanotube free-standing anodes for lithium ion batteries. J. Phys. Chem. C 2011, 115, 22609–22614. [Google Scholar] [CrossRef]
  40. Irwin, P.C.; Cao, Y.; Bansal, A.; Schadler, L.S. Thermal and Mechanical Properties of Polyimide Nanocomposites. In Proceedings of the 2003 Annual Report Conference on Electrical Insulation and Dielectric Phenomena, Albuquerque, NM, USA, 19–22 October 2003; pp. 120–123. [Google Scholar]
  41. Liaw, D.J.; Wang, K.L.; Huang, Y.C.; Lee, K.R.; Lai, J.Y.; Ha, C.S. Advanced polyimide materials: Syntheses, physical properties and applications. Prog. Polym. Sci. 2012, 37, 907–974. [Google Scholar] [CrossRef]
  42. Georgiev, A.; Dimov, D.; Spassova, E.; Assa, J.; Dineff, P.; Danev, G. Chemical and Physical Properties of Polyimides: Biomedical and Engineering Applications; InTech: London, UK, 2012. [Google Scholar]
  43. Jiang, X.; Bin, Y.; Matsuo, M. Electrical and mechanical properties of polyimide–carbon nanotubes composites fabricated by in situ polymerization. Polymer 2005, 46, 7418–7424. [Google Scholar] [CrossRef]
  44. Zhang, X.; Bai. Surface electric properties of polypyrrole in aqueous solutions. Langmuir 2003, 19, 10703–10709. [Google Scholar] [CrossRef]
  45. Patois, T.; Lakard, B.; Monney, S.; Roizard, X.; Fievet, P. Characterization of the surface properties of polypyrrole films: Influence of electrodeposition parameters. Synth. Met. 2011, 161, 2498–2505. [Google Scholar] [CrossRef]
  46. Wolfart, F.; Dubal, D.P.; Vidotti, M.; Holze, R.; Gómez-Romero, P. Electrochemical supercapacitive properties of polypyrrole thin films: Influence of the electropolymerization methods. J. Solid State Electrochem. 2016, 20, 901–910. [Google Scholar] [CrossRef]
  47. Andezai, A.; Iroh, J.O. Polypyrrole Hybrid Nanocomposite Electrode Materials with Outstanding Specific Capacitance. Energies 2025, 18, 1304. [Google Scholar] [CrossRef]
Figure 1. Synthesis of polyimide.
Energies 18 02158 g001
Figure 2. Chemical structure of (a) polyimide and (b) polypyrrole.
Energies 18 02158 g002
Figure 3. Solution casting of PAA/CNTs hybrid composites.
Energies 18 02158 g003
Figure 4. XRD plot for (a) (i) neat CNTs, (ii) PI/CNTs 90 °C, (iii) PI/CNTs 250 °C; (b) (i) PI/CNTs-PPy—90 °C, (ii) PI/CNTs-PPy—250 °C.
Energies 18 02158 g004
Figure 5. SEM micrographs of (a) neat CNTs, (b) PI/CNTs—90 °C, (c) PI/CNTs—180 °C, and (d) PI/CNTs—250 °C.
Energies 18 02158 g005
Figure 6. SEM micrographs of (a) PI/CNTs-PPy—90 °C, (b) PI/CNTs-PPy—180 °C, and (c) PI/CNTs-PPy—250 °C. (d) Comparison between SEM surface porosity and EIS ion-accessible pathways.
Energies 18 02158 g006
Figure 7. (a) DSC analysis of (i) neat PAA, (ii) 80 °C, (iii) 90 °C, and (iv) 120 °C processed hybrid nanocomposite, at the rate 10 °C/min from 25 °C to 350 °C. (b) DSC analysis of (i) neat PAA, (ii) 150 °C, (iii) 180 °C, and (iv) 250 °C processed hybrid nanocomposite, at the rate 10 °C/min from 25 °C to 350 °C. (c) Heat of reaction for imidization. (d) Degree of conversion.
Energies 18 02158 g007
Figure 8. (a) Transient i–t curves obtained during potentiostatic polymerization of 0.05 M pyrrole in a 0.0225 M toluene sulphonic acid solution at an applied potential of 2 V onto PI/CNTs hybrid nanocomposite working electrodes processed at (i) 90 °C for 60 s, (ii) 90 °C for 600, and (iii) 90 °C for 700 s. (b) (i) Porosity, (ii) weigh gain percent, and (c) electrochemical synthesis of polypyrrole. (d) A simplified Randles cell model for EIS failed coating fitting.
Energies 18 02158 g008
Figure 9. Cyclic voltammograms of PI/CNTs hybrid nanocomposites processed at 90 °C followed by electrodeposition of PPy using an Ag/AgCl reference electrode and a graphite rod counter electrode for (a) (i) 60 s 1 cycle at 5 mV/s, (ii) 600 s 1 cycle at 5 mV/s, (iii) 700 s 1 cycle at 5 mV/s, and (iv) no deposition; (b) (i) 60 s 1 cycle at 10 mV/s, (ii) 600 s 1 cycle at 10 mV/s, and (iii) 700 s 1 cycle at 10 mV/s; (c) (i) 60 s 1 cycle at 25 mV/s, (ii) 600 s 1 cycle at 25 mV/s, and (iii) 700 s 1 cycle at 25 mV/s; (d) (i) 60 s 5 cycle at 5 mV/s, (ii) 600 s 5 cycle at 5 mV/s, and (iii) 700 s 5 cycle at 5 mV/s.
Energies 18 02158 g009
Figure 10. Cyclic voltammograms of PI/CNTs hybrid nanocomposites processed at 90 °C followed by electrodeposition of PPy using an Ag/AgCl reference electrode and a graphite rod counter electrode for (a) (i) 60 s 5 cycle at 10 mV/s, (ii) 600 s 5 cycle at 10 mV/s, and (iii) 700 s 5 cycle at 10 mV/s; (b) (i) 60 s 5 cycle at 25 mV/s, (ii) 600 s 5 cycle at 25 mV/s, and (iii) 700 s 5 cycle at 25 mV/s; (c) (i) 60 s 10 cycle at 5 mV/s, (ii) 600 s 10 cycle at 5 mV/s, and (iii) 700 s 10 cycle at 5 mV/s; (d) (i) 60 s 10 cycle at 10 mV/s, (ii) 600 s 10 cycle at 10 mV/s, and (iii) 700 s 10 cycle at 10 mV/s.
Energies 18 02158 g010
Figure 11. Cyclic voltammograms of PI/CNTs hybrid nanocomposites processed at 90 °C followed by electrodeposition of PPy using an Ag/AgCl reference electrode and a graphite rod counter electrode for (a) (i) 60 s 10 cycle at 25 mV/s, (ii) 600 s 10 cycle at 25 mV/s, and (iii) 700 s 10 cycle at 25 mV/s. (b) Charge/discharge curve of PI/CNTs–PPy at different deposition times: (i) 90 °C 60 s, (ii) 90 °C 600 s, and (iii) 90 °C 700 s. (c) (i) Specific capacitance, (ii) specific capacity, (d) (i) power density, and (ii) energy density.
Energies 18 02158 g011
Figure 12. Comparison of specific capacitance and capacity for (a) 90 °C: (i) specific capacitance, (ii) specific capacity; 250 °C: (iii) specific capacitance, (iv) specific capacity; (b) 180 °C: (i) specific capacitance, (ii) specific capacity; 250 °C: (iii) specific capacitance, (iv) specific capacity.
Energies 18 02158 g012
Figure 13. (a) Plot for the redox ratio, (b) fraction charge, and (c) redox charge.
Energies 18 02158 g013
Figure 14. (a) EIS plot with model fit for (i) 90 °C 60 s, (ii) 90 °C 600 s, and (iii) 90 °C 700 s. (b) Phase Diagram of PI-CNTs-PPy hybrid nanocomposite properties at different temperatures. (c) Comparison of energy and power densities of different electrode materials for (i) PI/CNTs at 90 °C, (ii) PI/CNTs at 180 °C, (iii) PI/CNTs at 250 °C, a-[29], b-[30], c-[31], and d-[32].
Energies 18 02158 g014
Figure 15. (a) EIS Bode plot for PI/CNTs hybrid nanocomposite processed at (i) 90 °C at 60 s deposition, (ii) 90 °C at 600 s deposition, and (iii) 90 °C at 700 s deposition of PPy. (b) Phase angle plot for hybrid nanocomposite processed at (i) 90 °C at 60 s deposition, (ii) 90 °C at 600 s deposition, and (iii) 90 °C at 700 s deposition of PPy.
Energies 18 02158 g015
Table 1. Properties of carbon materials.
PropertyStandalone CNT SheetsGraphene SheetsActivated CarbonCarbon Fibers
Electrical Conductivity~103–104 S/cm (highly conductive).~104–105 S/cm (extremely high for high-quality graphene).~10–100 S/cm (moderate conductivity).~102–103 S/cm (depends on fiber alignment and purity).
Tensile Strength~150–300 MPa (moderate strength).~100–150 MPa (weaker but improves when stacked).~20–80 MPa (low due to porous structure).~1–5 GPa (exceptionally high for advanced fibers).
Young’s Modulus~10–20 GPa (high stiffness).~1–5 GPa (lower stiffness due to 2D nature).~0.5–2 GPa (weak mechanical stability).~70–300 GPa (extremely high for structural uses).
Thermal Conductivity~1000–2000 W/m·K (exceptionally high).~5000 W/m·K (highest known for pure graphene).~1–10 W/m·K (low due to high porosity).~100–600 W/m·K (moderate, improves with alignment).
Porosity~10–50 nm (moderate porosity, defined by CNT bundle packing).~Few nanometers (depends on stacking, typically low).~0.1–1 μm (high porosity due to activated structure).Negligible (dense and aligned structure).
Density~1.3–1.5 g/cm3 (lightweight).~1–2 g/cm3 (depends on number of layers and defects).~0.5–0.9 g/cm3 (very lightweight).~1.8–2.0 g/cm3 (heavier due to structural density).
Specific Capacitance~10–50 F/g (limited to double-layer capacitance).~50–200 F/g (depends on surface area and electrolyte).~100–300 F/g (high due to extensive surface area).~10–50 F/g (low due to dense structure).
Thermal StabilityStable up to ~600–800 °C in inert environments.Stable up to ~400 °C in air, higher in inert atmospheres.Stable up to ~600 °C (depends on activation process).Stable up to ~1000 °C in inert conditions.
FlexibilityHigh; bendable and stretchable.High for single-layer graphene; reduced for stacked layers.Low; brittle and prone to cracking.Low; rigid and prone to fracture under bending.
ScalabilityChallenging; uniformity over large areas is difficult.Difficult; large-scale production of defect-free sheets is hard.High; widely available and inexpensive.Moderate; high-quality fibers are expensive to produce.
Table 2. Properties of polyimide and polypyrrole.
PropertiesPolypyrrole (PPy)Polyimide (PI)
Electrical Conductivity~10–100 S/cm (doped with appropriate agents like p-toluene sulfonic acid)~10−12 S/cm (intrinsic); can be increased with conductive additives like CNTs.
Redox ActivityExhibits pseudocapacitance; specific capacitance values range from 200–600 F/g, depending on structure and doping.No intrinsic redox activity; primarily used as a structural matrix.
Mechanical StrengthModerate; tensile strength ranges from 10–50 MPa, brittle in pure form.High; tensile strength ranges from 80–200 MPa, depending on processing and reinforcement.
Thermal StabilityDegrades above 150–200 °C, depending on polymerization and doping conditions.High stability: thermal degradation starts at ~400 °C, suitable for high-temperature applications.
Porosity ContributionCan form layers with pores in the range of 10–50 nm (dependent on deposition conditions).Porosity is tunable; partial imidization at 90 °C results in a porous structure, while full imidization at 250 °C reduces porosity.
Chemical StabilitySensitive to over-oxidation in electrolytes; stability depends on the potential range.Excellent chemical stability; resistant to solvents, acids, and bases.
Young’s Modulus~1–2 GPa (moderate, brittle polymer).~2–8 GPa (high, depends on reinforcement and processing conditions).
Density~1.5 g/cm3 (bulk material).~1.4 g/cm3 (varies slightly with processing).
Specific CapacitanceRanges from 200–600 F/g (varies with doping and structure).Not applicable; PI does not contribute directly to capacitance.
ScalabilityEasily deposited via chemical or electrochemical polymerization.Scalable synthesis through imidization of polyamic acid, suitable for large-scale applications.
Table 3. Porosity characteristics of PI/CNTs and PI/CNTs–PPy composites processed at 90 °C, 180 °C, and 250 °C, EIS, degree of imidization, including surface porosity, porosity after PPy deposition, cross-sectional thickness, and through-thickness porosity (all values were extracted from thresholded SEM micrographs using pixel-based image analysis).
SamplePorosity (%)Porosity (%) with PPyThickness (µm)Porosity Through Thickness (%)EIS Porosity
(%)
Degree of Imidization (%)
Pure CNTs52.09-----
PI/CNTs—90 °C50.5938.5734.837.0812.238.3
PI/CNTs—180 °C40.5722.0347.024.790.7498.9
PI/CNTs—250 °C36.99%10.1950.316.060.42100
Table 4. Charge passed during deposition.
Deposition Time Time
(s)
Average Current
(A)
Charge
(Q)
60 s600.127.2
600 s6000.05533
700 s7000.0214
Table 5. EIS fitting parameters.
Sample (Processing Conditions)Rs (Ω)Rct (Ω)Cdl (µF)
90 °C, 60 s (i)1.989.56192.1
90 °C, 600 s (ii)2.1215.84138.6
90 °C, 700 s (iii)2.3624.17101.3
Table 6. Energy and power densities of PI/CNTs composites at different processing temperatures compared with values from the literature.
Sample/Material SystemPower Density (W/kg)Energy Density (Wh/kg)Reference
PI/CNTs—90 °C (This work)957.78274.56This study
PI/CNTs—180 °C (This work)597.26261.72This study
PI/CNTs—250 °C (This work)375.7943.21This study
Ref. [29]25015Ref. [29]
Ref. [30]141148.3Ref. [30]
Ref. [31]20,600141Ref. [31]
Ref. [32]142119.722Ref. [32]
Table 7. Parameter of PI/CNTs-PPy obtained using EIS.
Deposition TimeBulk Resistance
(Ω)
Porosity
(%)
60 s17.712.2
600 s42.27.2
700 s61.94.3
Disclaimer/Publisher’s Note: The statements, opinions and data contained in all publications are solely those of the individual author(s) and contributor(s) and not of MDPI and/or the editor(s). MDPI and/or the editor(s) disclaim responsibility for any injury to people or property resulting from any ideas, methods, instructions or products referred to in the content.

