

Enhancing Energy Sustainability in Remote Mining Operations Through Wind and Pumped-Hydro Storage; Application to Raglan Mine, Canada


Abstract
1. Introduction
- Provide an overview of the PHSP solution;
- Introduce the stochastic models;
- Formulate, implement, and validate a performance prediction method;
- Size the PHSP according to the power needed, topology, wind power capacity, required decarbonization level, and financial viability.
2. Stochastic Models and Variable Speed of Hydraulic Turbines
2.1. Stochastic Models
- Renewable energy production from various sources within the energy mix;
- Meteorological conditions (which directly affect renewable generation);
- Variations in energy demand;
- Electricity market prices in deregulated environments.
- Economic indicators: capital and operating expenditures, energy price, payback period, and net present value (NPV);
- Technical indicators: installed capacity and power, number of wind turbines, wind penetration rate, and greenhouse gas (GHG) emission reduction.
2.2. Variable-Speed Hydraulic Turbines
3. Methodology
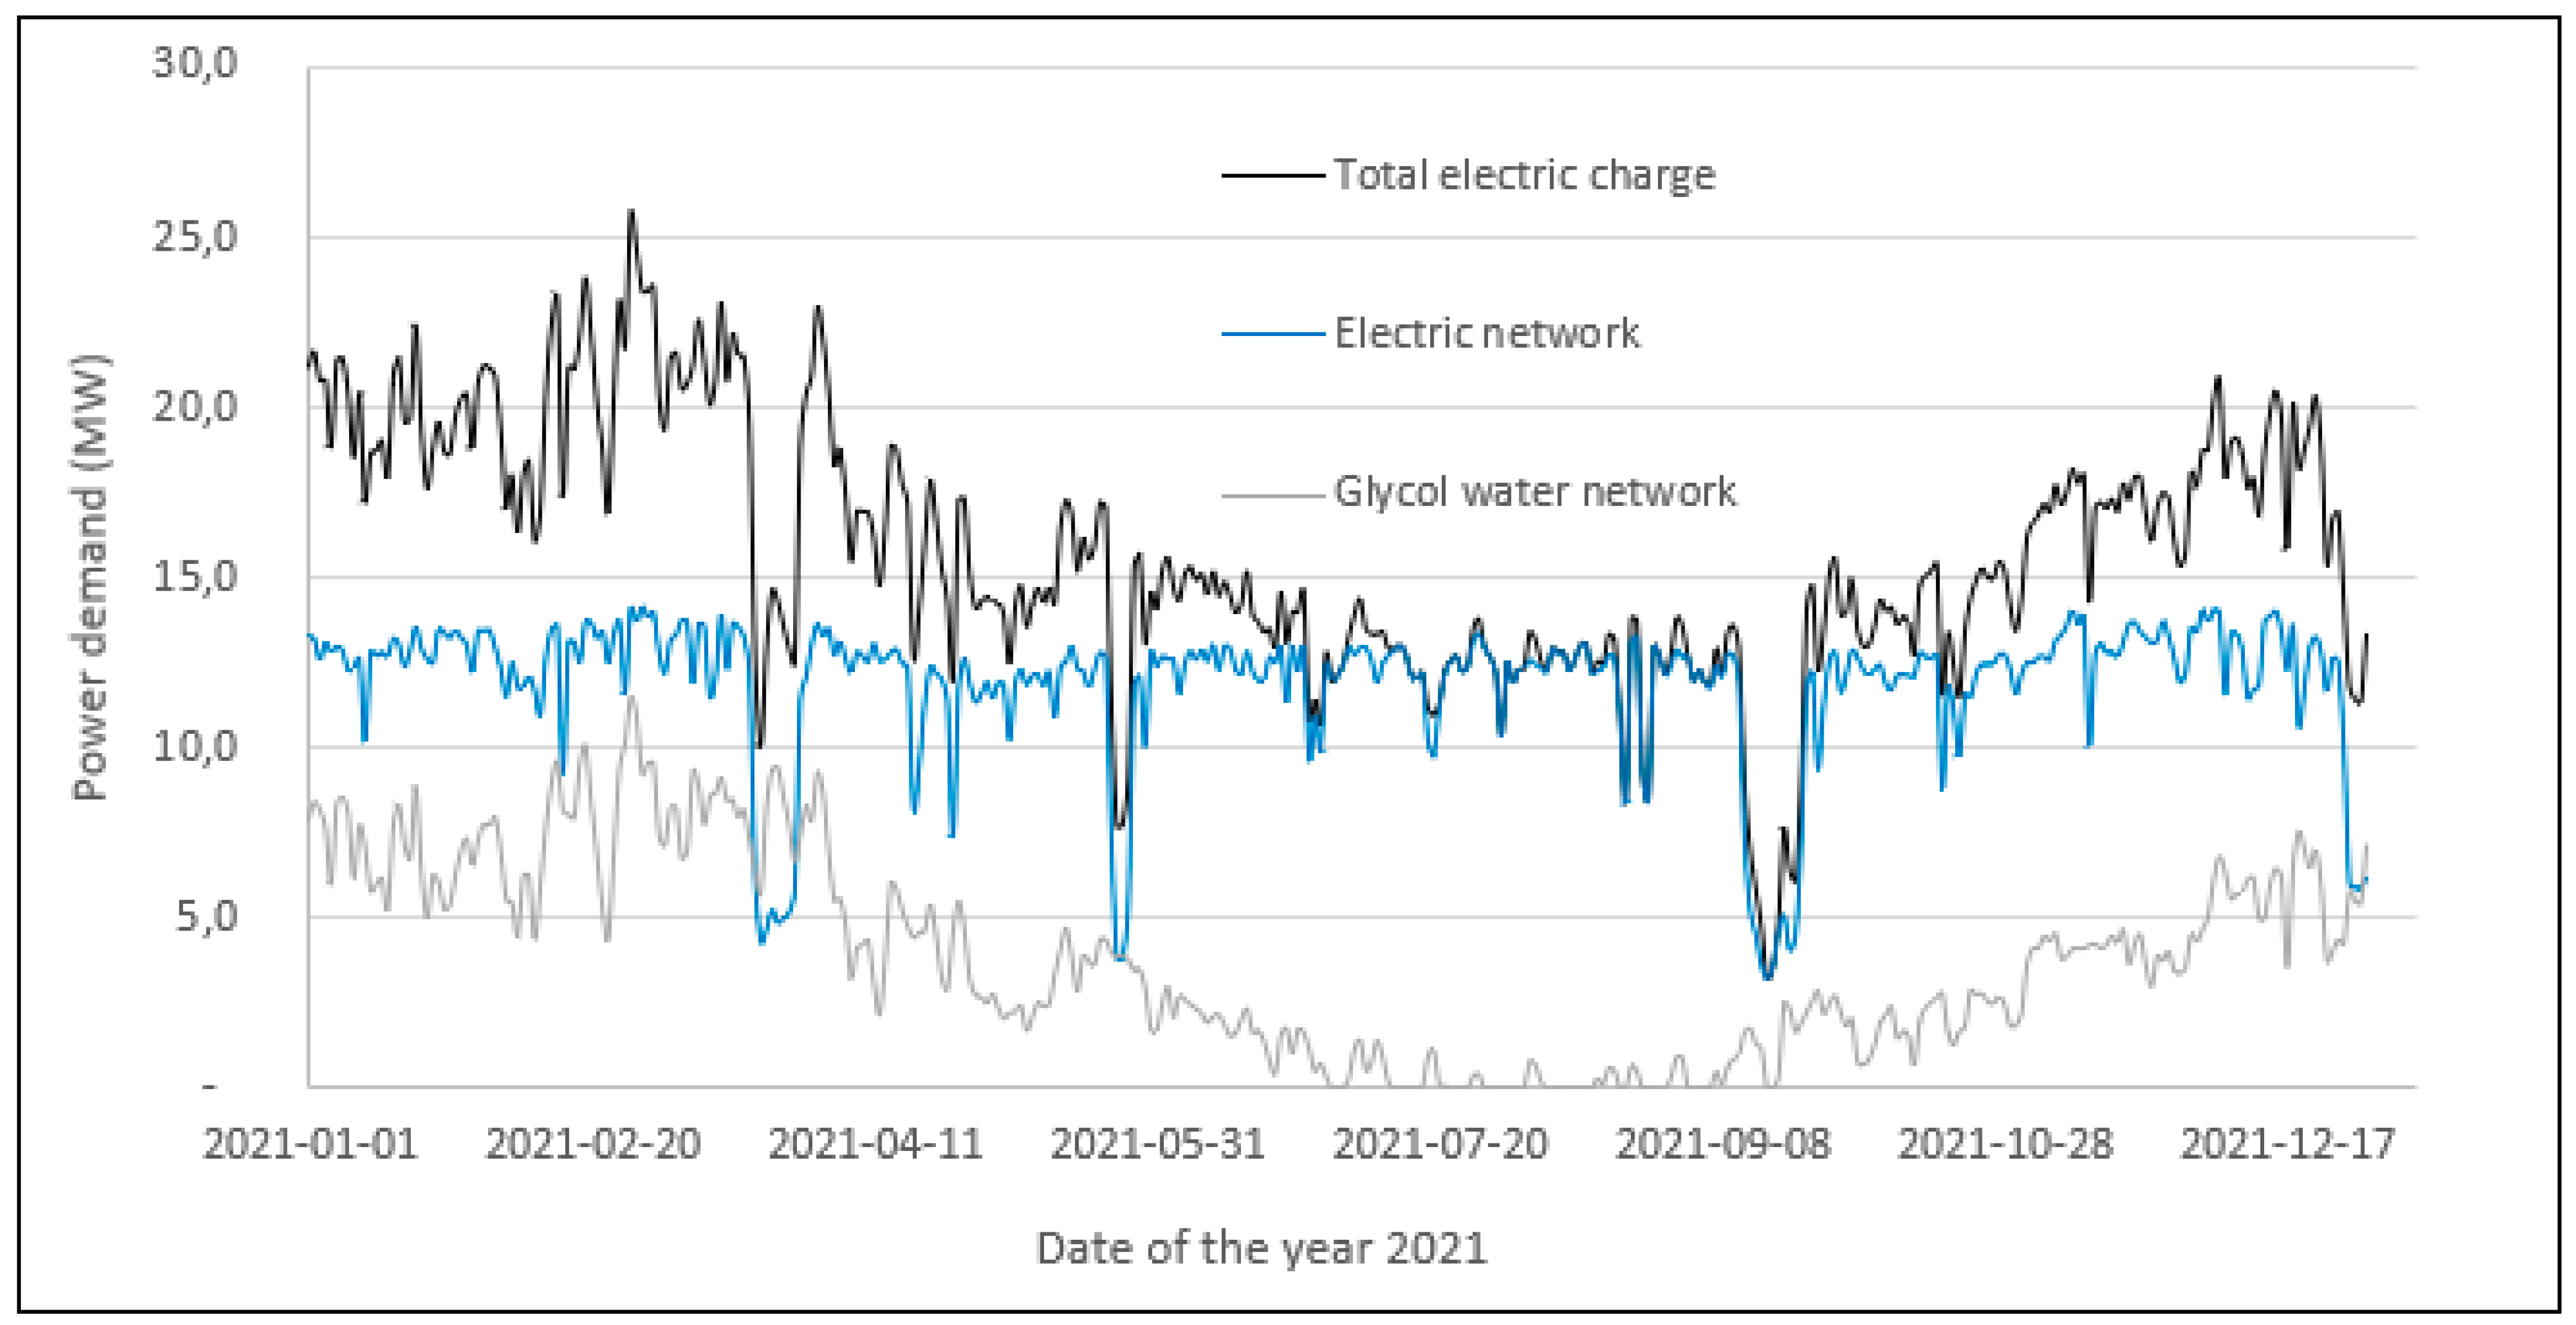
3.1. Electric Needs
3.1.1. Decarbonation Scenario
3.1.2. Generator Capital Expenditures (CAPEX) and Operating Expenditures (OPEX)
3.2. Wind Turbine Plant
3.2.1. Assumptions
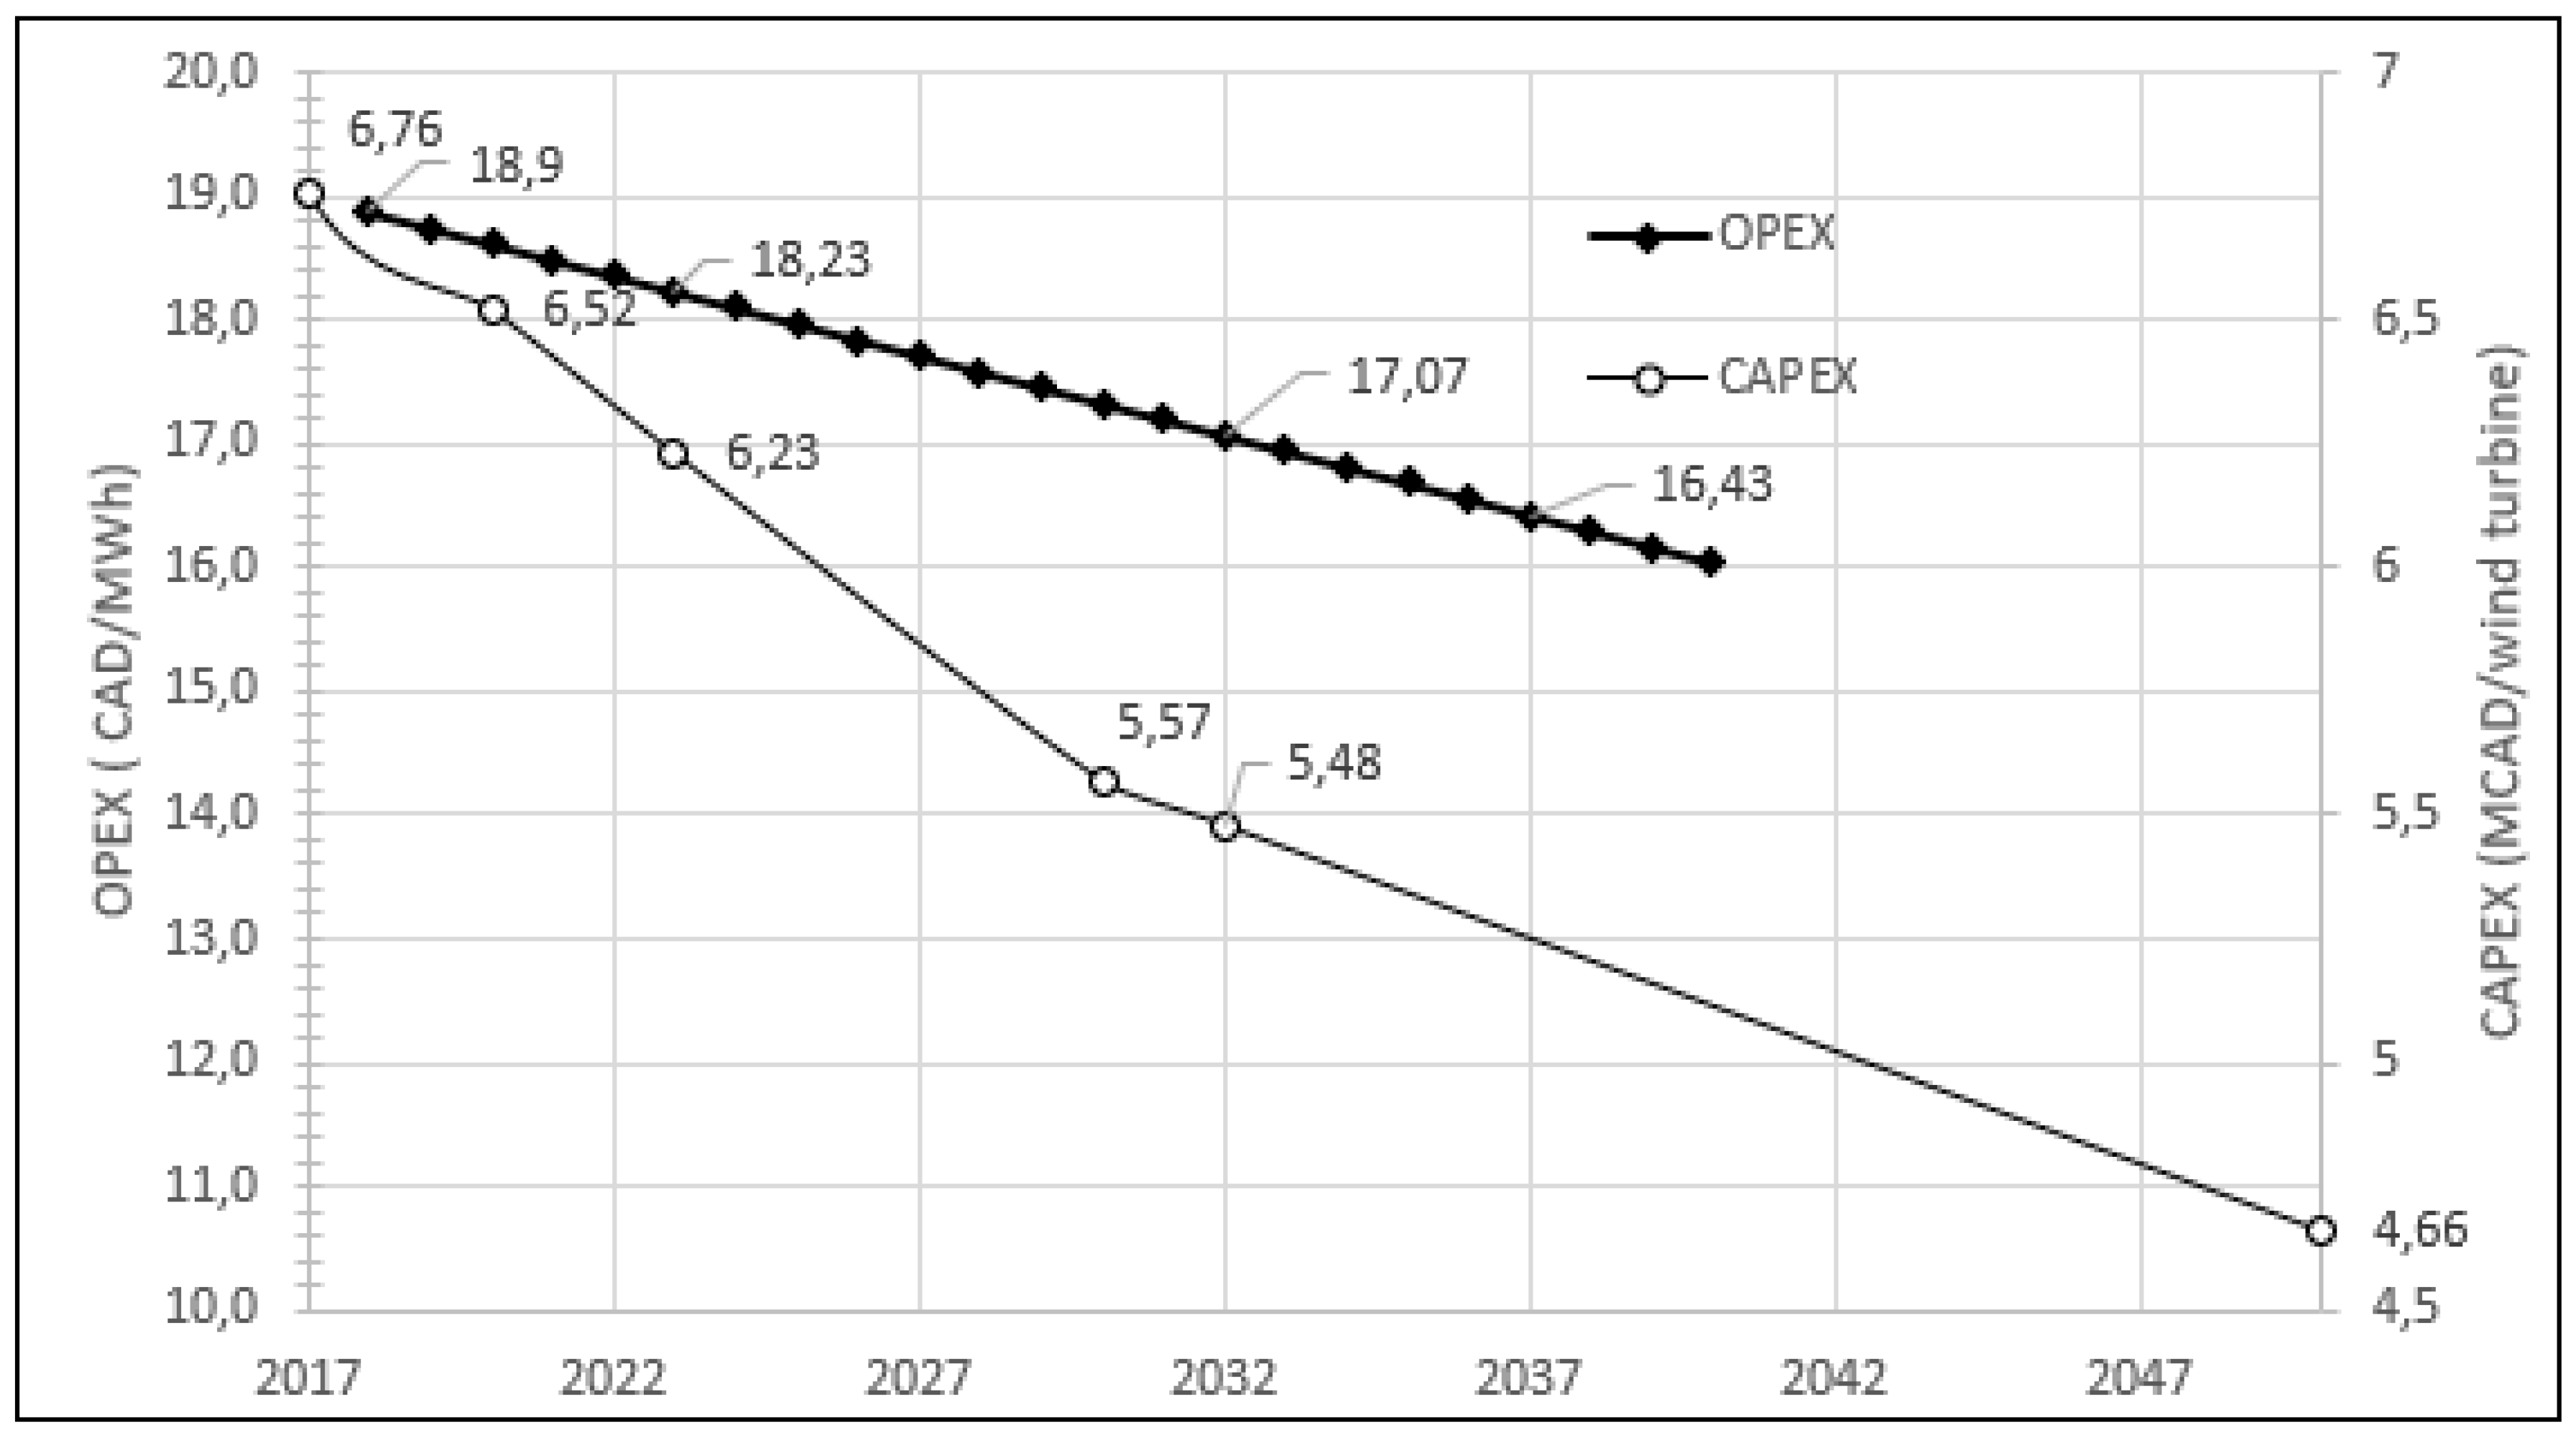
3.2.2. Wind Farm Capital and Operation Expenditures
3.3. PHSP Characteristics and Size
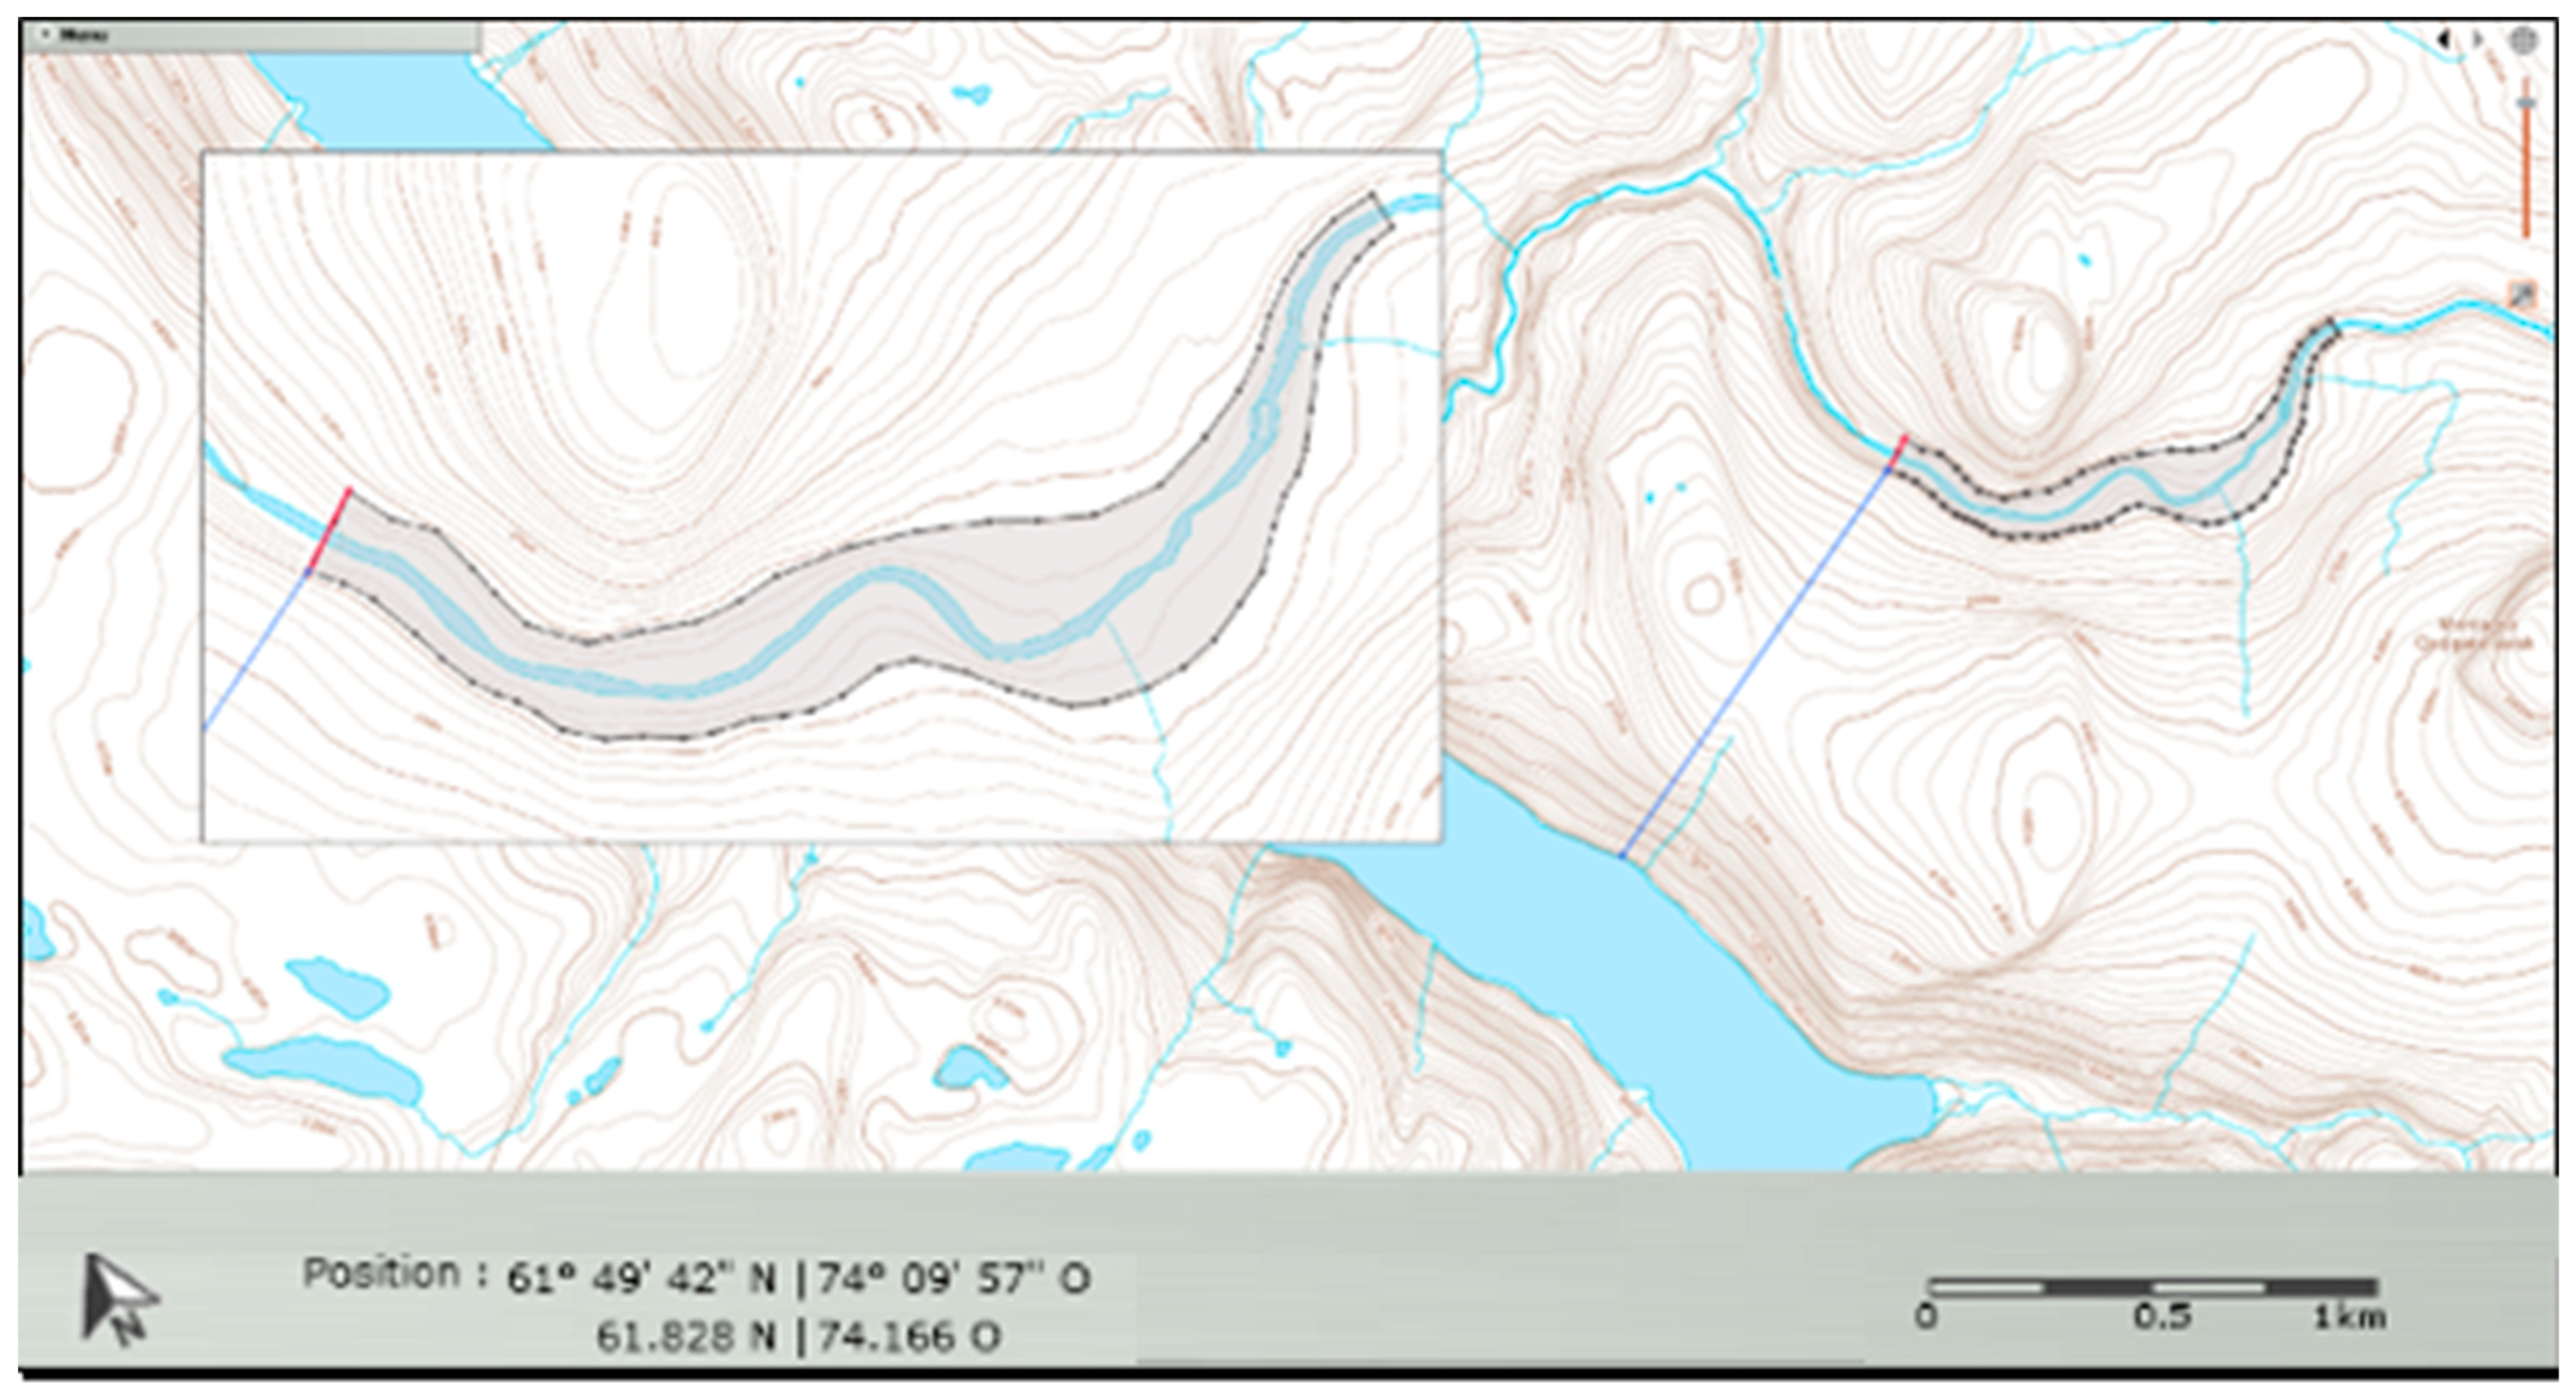
3.3.1. Selected Site
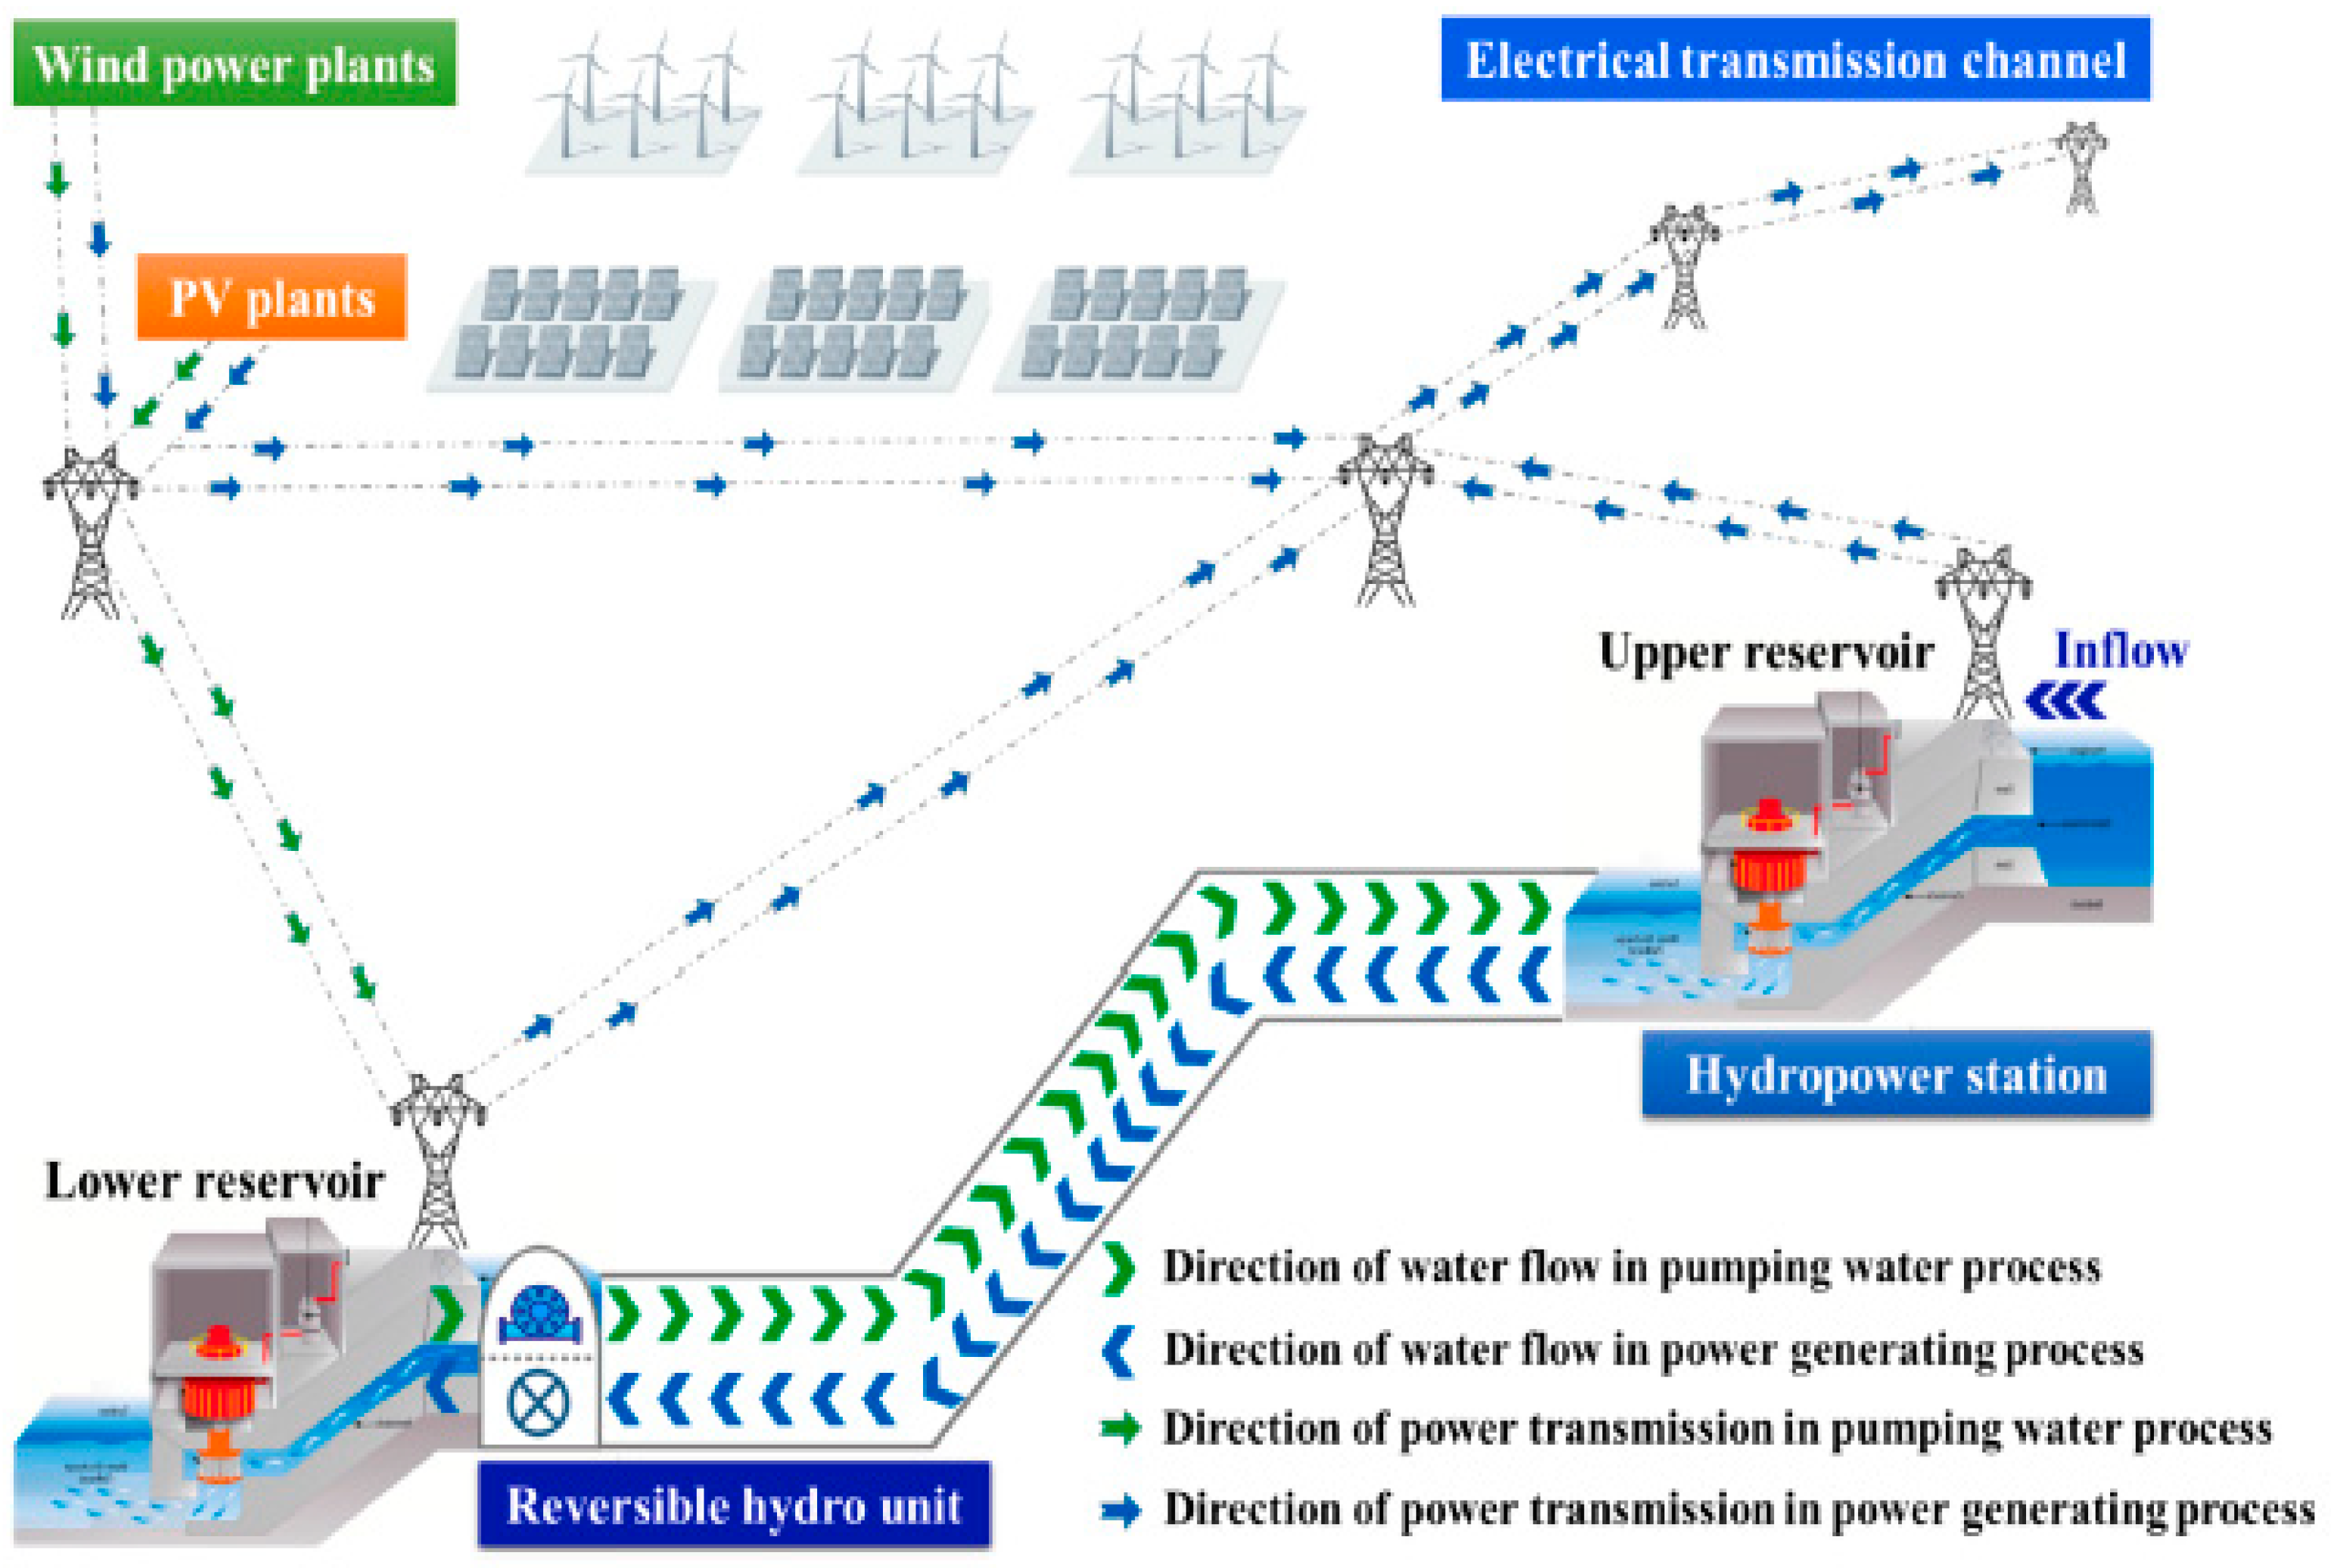
3.3.2. PHSP Topology
3.3.3. Size of Penstocks
3.3.4. PHSP Capital and Operation Expenditures
4. Modeling and Simulations
4.1. Project Variables
4.1.1. Input Data
4.1.2. Output Data
- The network’s ability to meet the electricity needs of the mine;
- The renewable integration rate and the PHSP’s ability to significatively increase this rate.
- The net present value (NPV) is calculated using both a discount and an inflation rate. Following the report [66], their respective values are implemented at 8 and 2%:
- The payback period,
- The initial investment required.
4.2. Algorithm and Programming
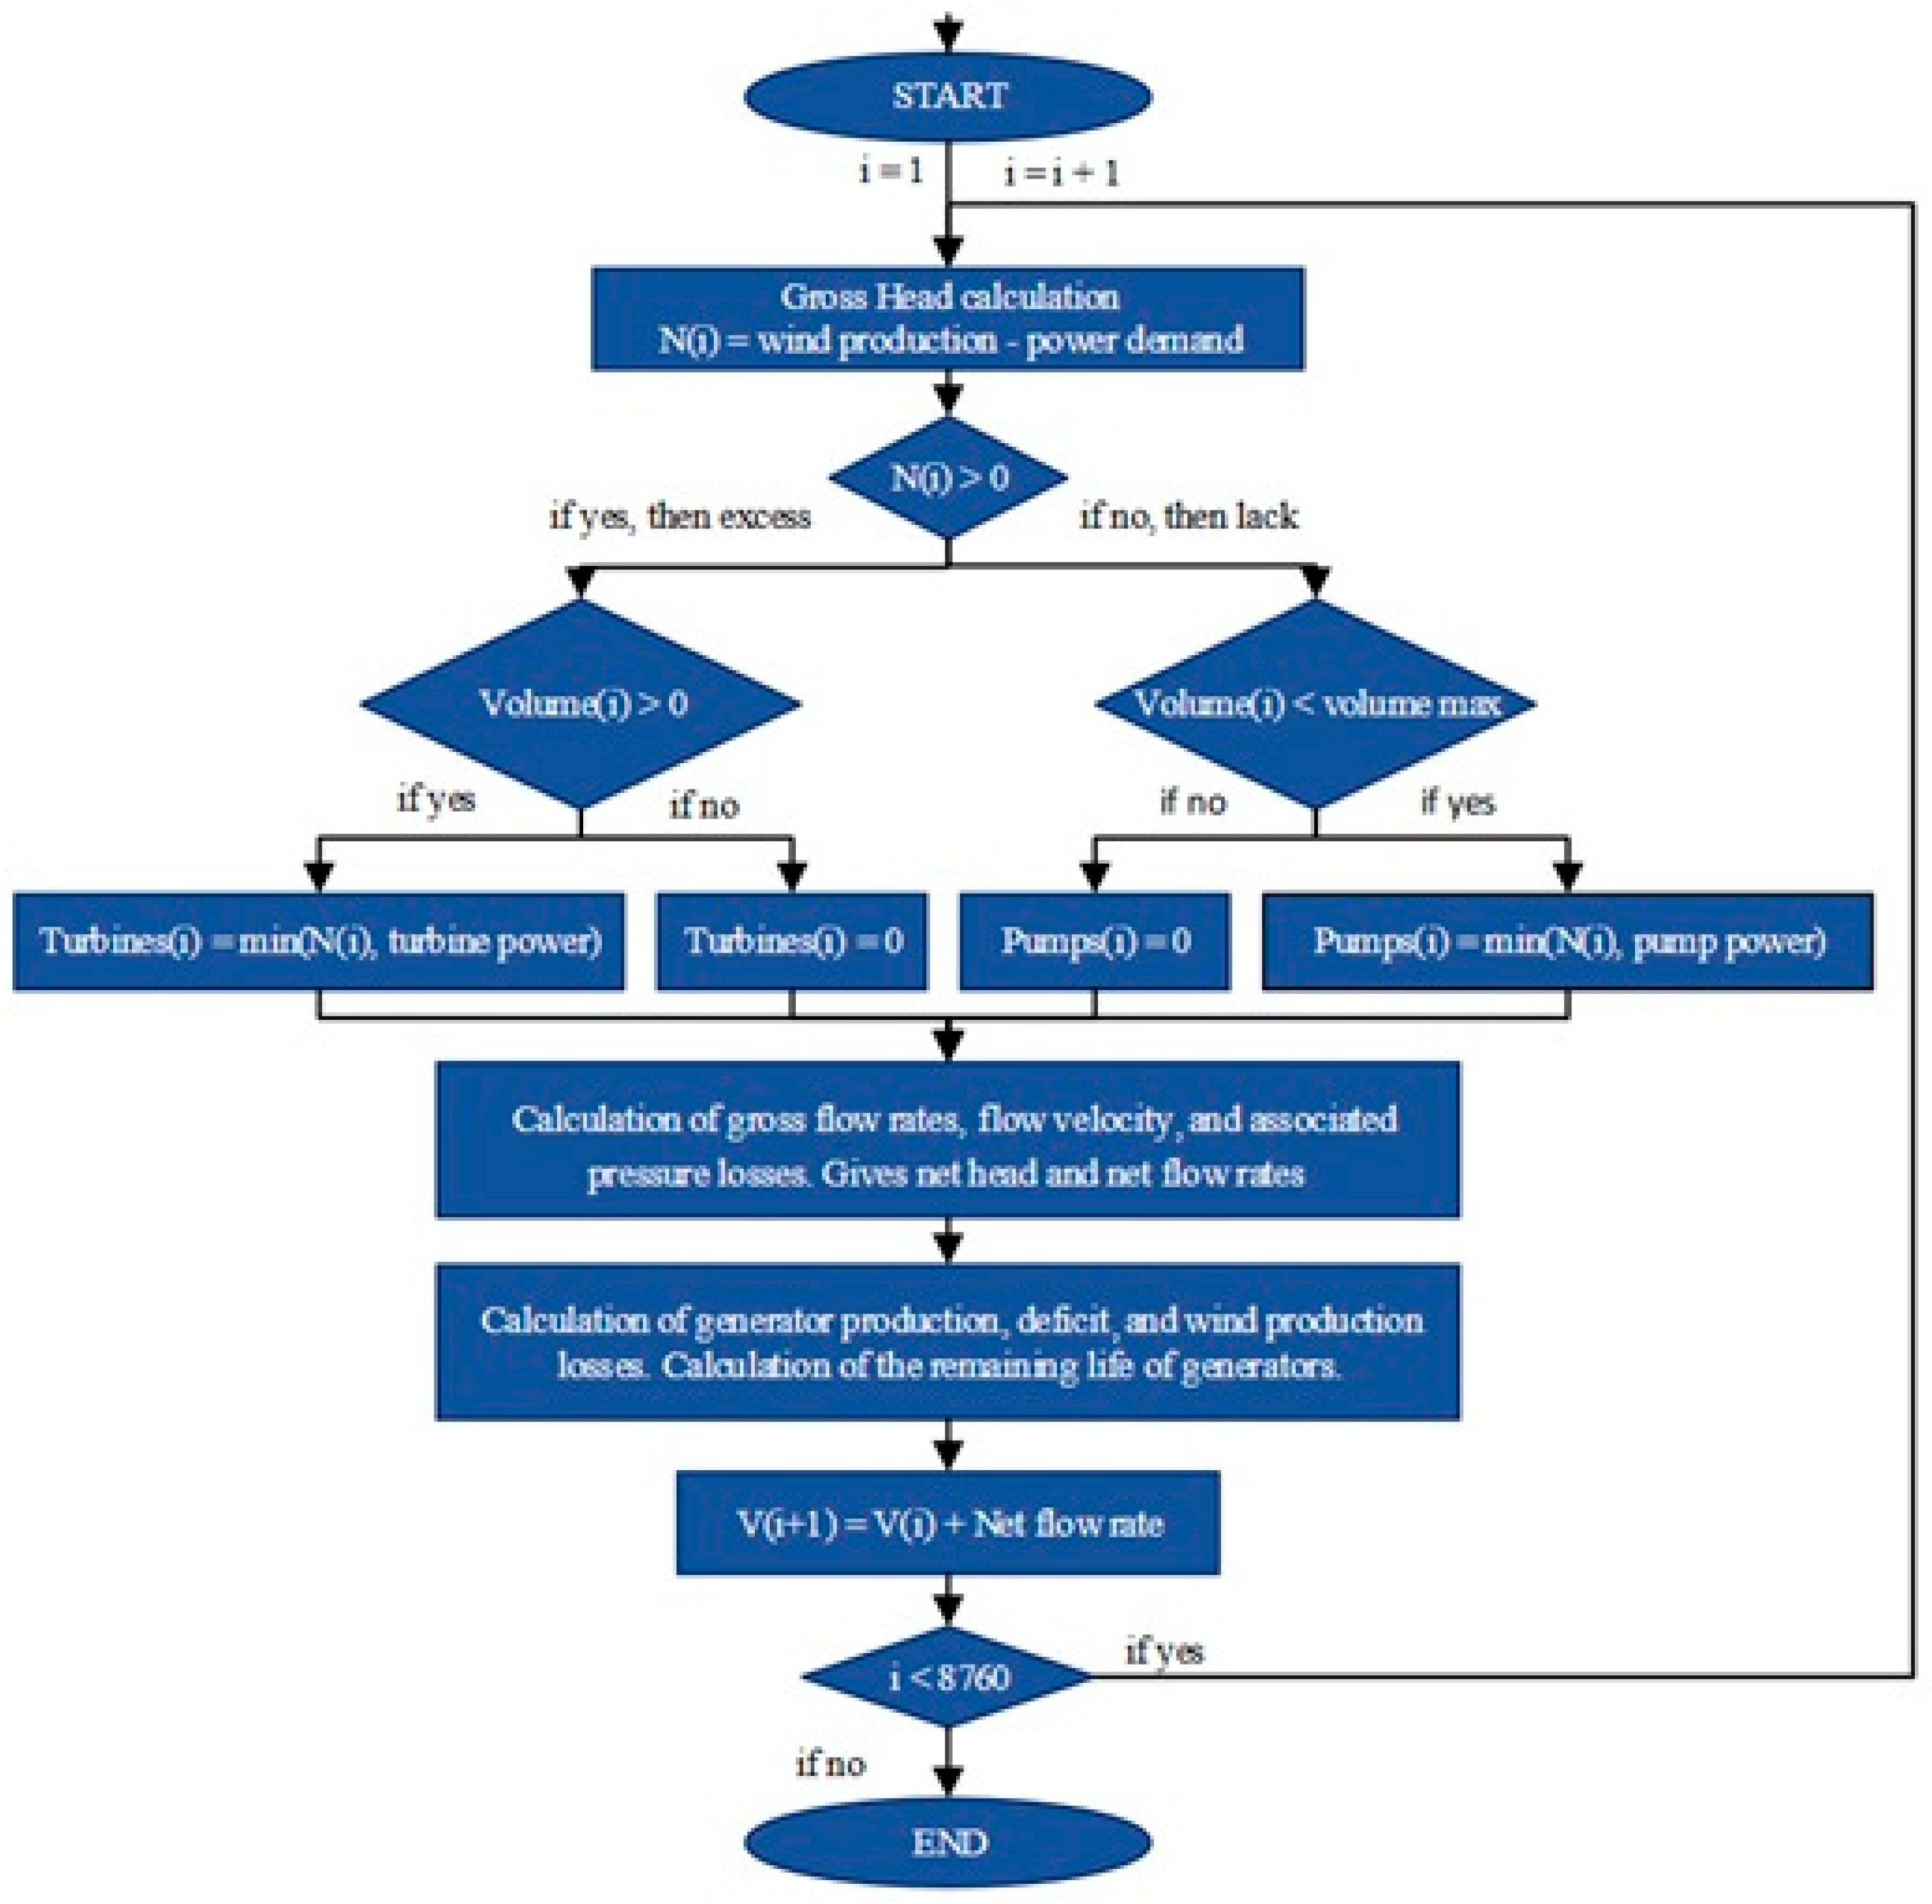
4.2.1. MATLAB Program
4.2.2. Technical and Economic Analysis
4.2.3. Aspects Related to Energy Sizing
- Head height: This is site-specific and represents the naturally available hydraulic head, directly influencing the potential power output.
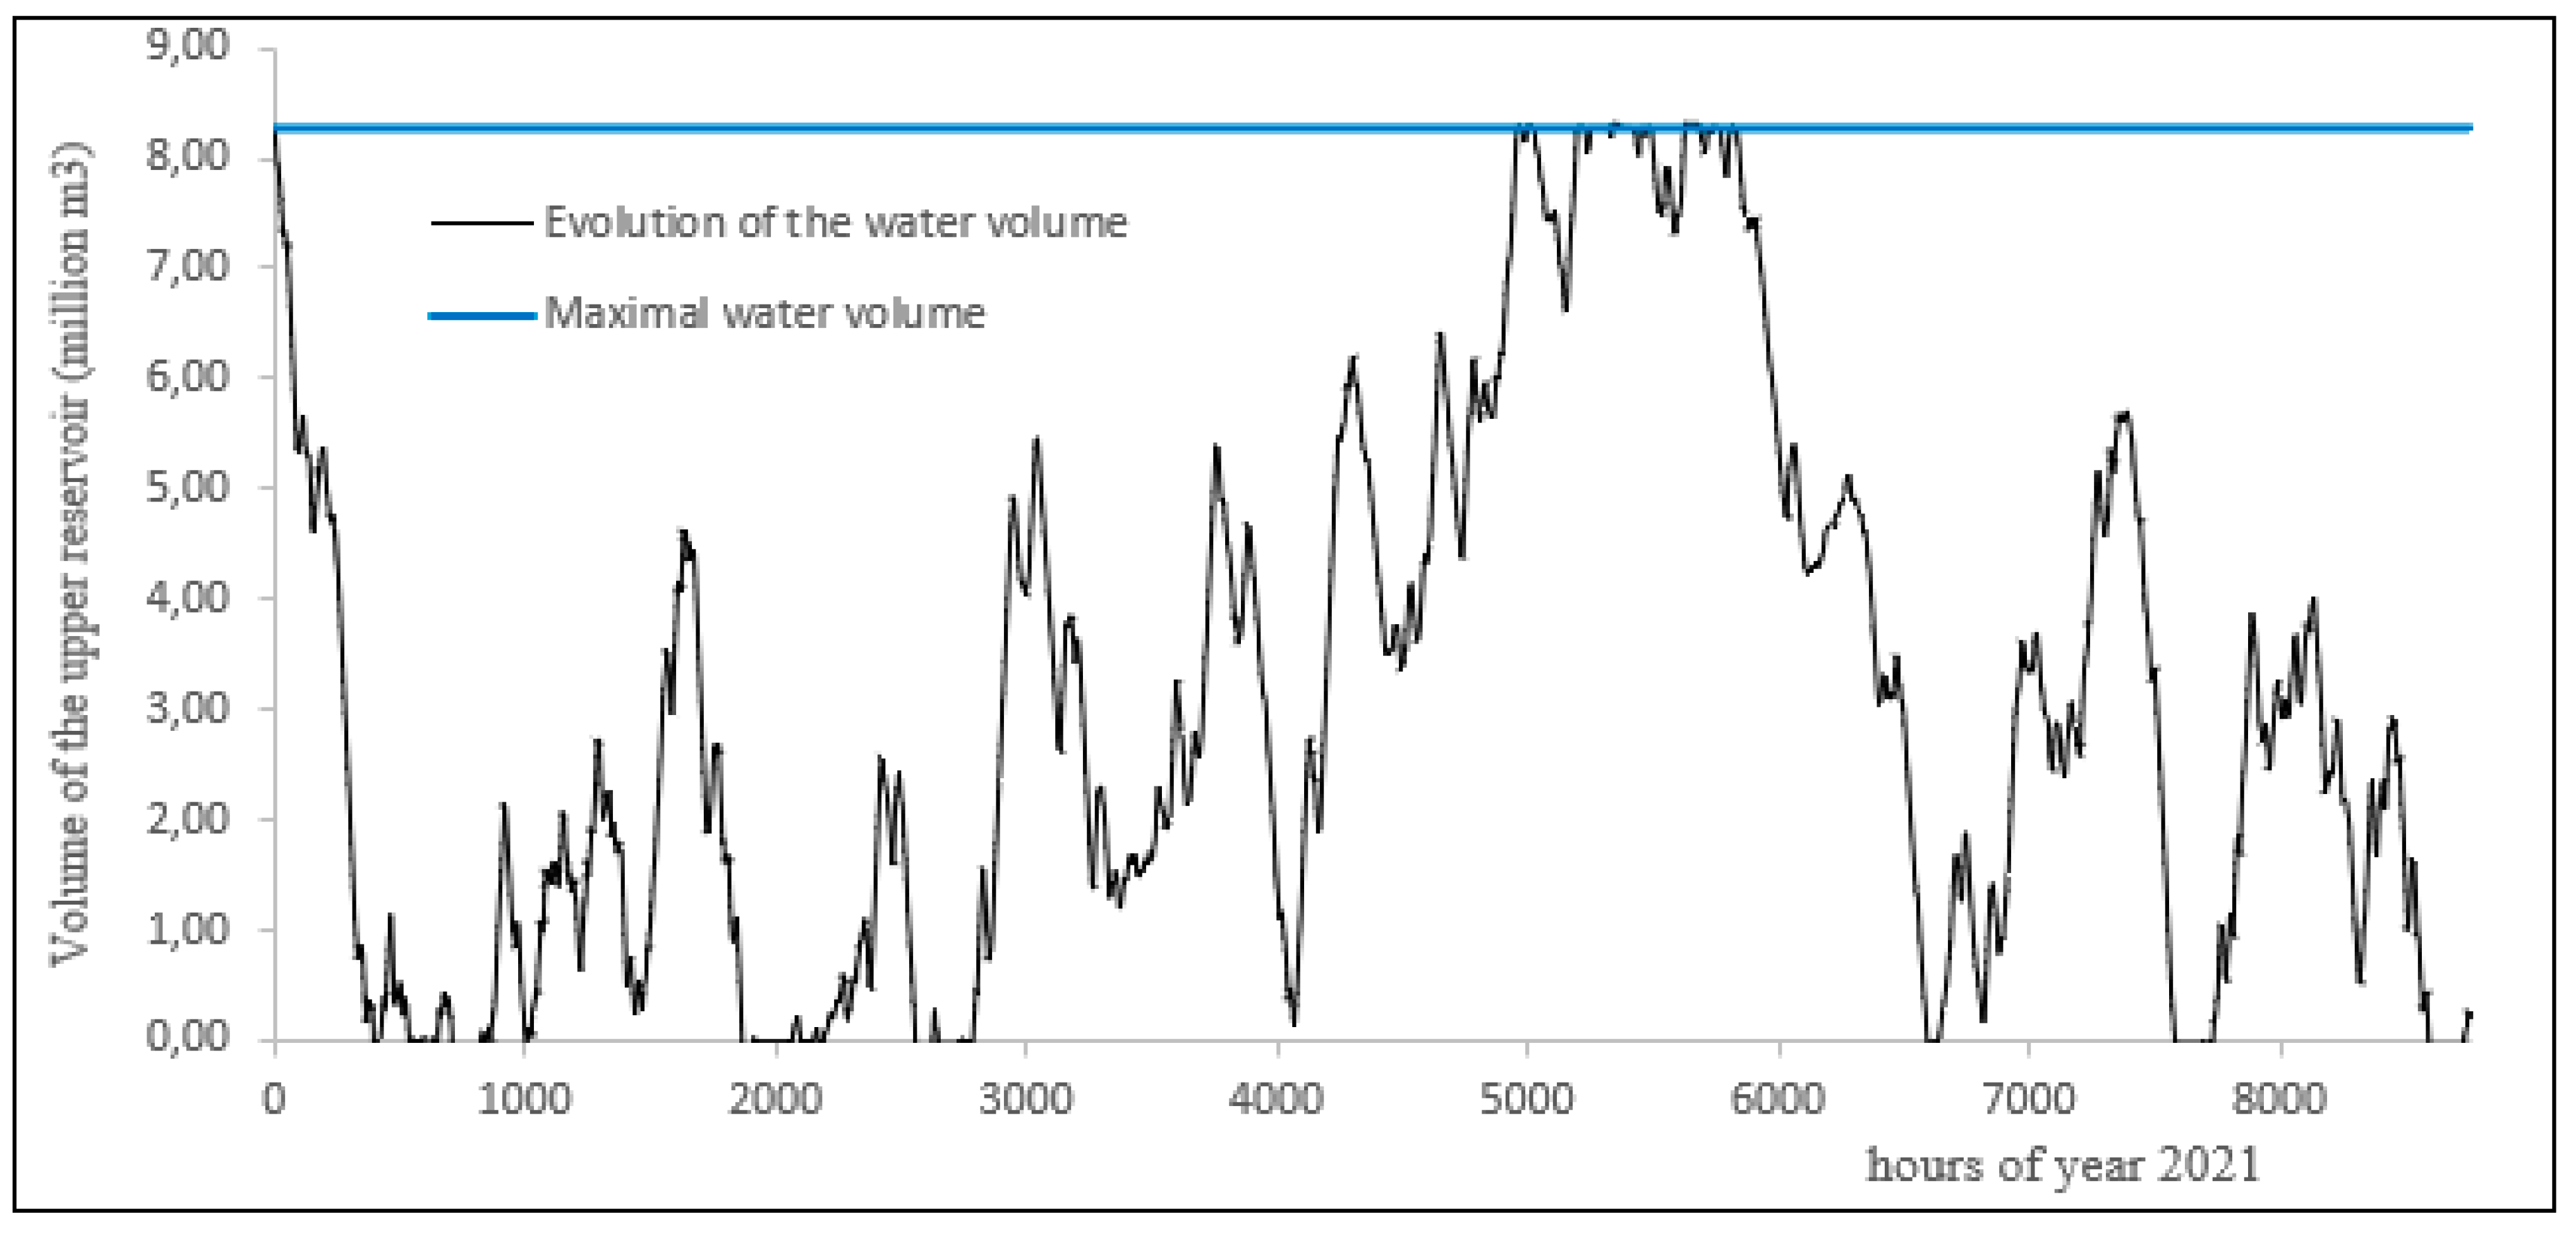
- Storage capacity: Defined by the volume of the upper and lower reservoirs, this determines the energy autonomy of the PHSP system—i.e., the duration for which it can operate at maximum output without recharge. This factor is essential in supporting a high share of variable renewable energy on the local grid.
- Flow rate: This is the primary controllable variable and plays a key role in system performance. The maximum flow rate influences the dimensioning of penstocks and turbines and pressure losses within the system.
5. Results and Discussions
5.1. Dimensions and Performances
5.1.1. Technical Feasibility
- The energy deficit is zero, which means that the production units meet all the network needs;
- The production of the turbines represents 25% of the energy mix targeted by decarbonization, which proves the importance of the PHSP. Moreover, the “renewable energy rate compared to the objective”, which refers to this share of the energy mix, reveals satisfactory results as 91.8% of the target is reached.
5.1.2. Economic Feasibility
5.2. Discussion and Complementary Studies
5.2.1. Discussion on the Main Hypothesis
5.2.2. Complementary Studies
6. Results Validation
7. Conclusions
Author Contributions
Funding
Data Availability Statement
Acknowledgments
Conflicts of Interest
Declaration of Generative AI and AI-Assisted Technologies in the Writing Process
Appendix A
Appendix B
Appendix C

Appendix D

| Equation | Variable | Observation | Meaning of Terms |
|---|---|---|---|
| Linear pressure losses | Definition of the nature of the flow: Kinematic viscosity of water, If Re < 2000, the flow is laminar and λ = 64/Re according to the Hagen–Poiseuille law. On the other hand, if Re > 3000, then the regime is turbulent, and the coefficient can be determined by several laws or graphically via the Moody diagram. | Re: Reynolds number | |
| Hydraulic flow | |||
| Net present value (NPV) | Each investor is free to choose their own inflation and discount rates to judge the economic feasibility of their projects. | ||
| Gross drop | The gross drop corresponds to a real difference in altitude between the inlet and the outlet of the hydraulic network. | ||
| Hydraulic power | From these equations, an analogy with electrical quantities can be observed. | ||
| Stochastic optimization problems | This work uses stochastic forecasting models, which are mathematical models that consider the probable error inherent in the chosen parameters. | With f being the objective function, X the problem variables, the variable errors, and g the constrained functions of the problem. |
References
- United Nations Framework Convention on Climate Change. Report of the Conference of the Parties on Its Twenty-First Session, Held in Paris from 30 November to 11 December 2015—Part One: Proceedings; United Nations Framework Convention on Climate Change: Paris, France, 2016; p. 42. [Google Scholar]
- Government of Canada. Greenhouse Gas Emissions Canadian Environmental Sustainability Indicators; Environment and Climate Change Canada: Gatineau, QC, Canada, 2025. [Google Scholar]
- Jahangiri, Z.; Hendriks, R.; McPherson, M. A Machine Learning Approach to Analysis of Canadian Provincial Power System Decarbonization. Energy Rep. 2024, 11, 4849–4861. [Google Scholar] [CrossRef]
- Government of Canada. Canada’s Official Greenhouse Gas Inventory. Annex 13—Electricity in Canada. Available online: https://open.canada.ca/data/en/dataset/779c7bcf-4982-47eb-af1b-a33618a05e5b (accessed on 9 January 2025).
- Government of Canada. Canadian Net-Zero Emissions Accountability Act. Available online: https://www.canada.ca/en/services/environment/weather/climatechange/climate-plan/net-zero-emissions-2050/canadian-net-zero-emissions-accountability-act.html (accessed on 9 January 2025).
- Saffari, M.; McPherson, M. Assessment of Canada’s Electricity System Potential for Variable Renewable Energy Integration. Energy 2022, 250, 123757. [Google Scholar] [CrossRef]
- Du, Y.; Shen, X.; Kammen, D.M.; Hong, C.; Nie, J.; Zheng, B.; Yao, S. A Generation and Transmission Expansion Planning Model for the Electricity Market with Decarbonization Policies. Adv. Appl. Energy 2024, 13, 100162. [Google Scholar] [CrossRef]
- Balaban, G.; Dumbrava, V.; Lazaroiu, A.C.; Kalogirou, S. Analysis of Urban Network Operation in Presence of Renewable Sources for Decarbonization of Energy System. Renew. Energy 2024, 230, 120870. [Google Scholar] [CrossRef]
- Dongsheng, C.; Ndifor, E.Z.; Temidayo Olayinka, A.-O.; Ukwuoma, C.C.; Shefik, A.; Hu, Y.; Bamisile, O.; Dagbasi, M.; Uzun Ozsahin, D.; Adun, H. An EnergyPlan Analysis of Electricity Decarbonization in the CEMAC Region. Energy Strategy Rev. 2024, 56, 101548. [Google Scholar] [CrossRef]
- Obiora, S.C.; Bamisile, O.; Hu, Y.; Ozsahin, D.U.; Adun, H. Assessing the Decarbonization of Electricity Generation in Major Emitting Countries by 2030 and 2050: Transition to a High Share Renewable Energy Mix. Heliyon 2024, 10, e28770. [Google Scholar] [CrossRef]
- Roshan Kumar, T.; Beiron, J.; Marthala, V.R.R.; Pettersson, L.; Harvey, S.; Thunman, H. Combining Exergy-Pinch and Techno-Economic Analyses for Identifying Feasible Decarbonization Opportunities in Carbon-Intensive Process Industry: Case Study of a Propylene Production Technology. Energy Convers. Manag. X 2025, 25, 100853. [Google Scholar] [CrossRef]
- Paraschiv, L.S.; Paraschiv, S. Contribution of Renewable Energy (Hydro, Wind, Solar and Biomass) to Decarbonization and Transformation of the Electricity Generation Sector for Sustainable Development. Energy Rep. 2023, 9, 535–544. [Google Scholar] [CrossRef]
- Wang, X.; Bamisile, O.; Chen, S.; Xu, X.; Luo, S.; Huang, Q.; Hu, W. Decarbonization of China’s Electricity Systems with Hydropower Penetration and Pumped-Hydro Storage: Comparing the Policies with a Techno-Economic Analysis. Renew. Energy 2022, 196, 65–83. [Google Scholar] [CrossRef]
- Lee, H.; McJeon, H.; Yu, S.; Liu, Y.; Kim, H.; Eom, J. Decarbonization Pathways for Korea’s Industrial Sector towards Its 2050 Carbon Neutrality Goal. J. Clean. Prod. 2024, 476, 143749. [Google Scholar] [CrossRef]
- Onodera, H.; Delage, R.; Nakata, T. The Role of Regional Renewable Energy Integration in Electricity Decarbonization—A Case Study of Japan. Appl. Energy 2024, 363, 123118. [Google Scholar] [CrossRef]
- IHA. Innovation Pumped Storage Hydropower Configurations and Uses; IHA: London, UK, 2021. [Google Scholar]
- Zhao, K.; Wang, J.; Qiu, L. Approval and Progress Analysis of Pumped Storage Power Stations in Central China during the 14th Five-Year Plan Period. J. Energy Storage 2024, 102, 114104. [Google Scholar] [CrossRef]
- Silva, C.S.; Couceiro, D.; Castro, R.M.G. The Role of Pumped Hydro Storage in the Portuguese National Plan for Energy and Climate for 2030: A Hybrid Approach Using Energy PLAN and Machine Learning. J. Energy Storage 2024, 103, 114194. [Google Scholar] [CrossRef]
- Jing, Z.; Wang, Y.; Chang, J.; Wang, X.; Guo, A.; Meng, X. Construction of Pumped Storage Power Stations among Cascade Reservoirs to Support the High-Quality Power Supply of the Hydro-Wind-Photovoltaic Power Generation System. Energy Convers. Manag. 2025, 323, 119239. [Google Scholar] [CrossRef]
- Canadian Energy Regular. Market Snapshot: Pumped-Storage Hydro—The Largest Form of Energy Storage in Canada and a Growing Contributor to Grid Reliability; Canadian Energy Regular: Calgary, AB, Canada, 2025. [Google Scholar]
- Li, X.; Tan, Z.; Shen, J.; Yang, J.; Fan, W.; Zhao, H.; Zhang, T. Research on the Operation Strategy of Joint Wind-Photovoltaic-Hydropower-Pumped Storage Participation in Electricity Market Based on Nash Negotiation. J. Clean. Prod. 2024, 442, 140981. [Google Scholar] [CrossRef]
- Xiang, C.; Xu, X.; Zhang, S.; Qian, H.; Duan, Z. Current Situation of Small and Medium-Sized Pumped Storage Power Stations in Zhejiang Province. J. Energy Storage 2024, 78, 110070. [Google Scholar] [CrossRef]
- Wang, H.; Yuan, L.; Wang, W.; Song, M. Distributionally Robust Optimization for Pumped Storage Power Station Capacity Expanding Based on Underwater Hydrogen Storage Introduction. Energy 2024, 310, 133254. [Google Scholar] [CrossRef]
- Liu, Y.; Zhang, H.; Guo, P.; Li, C.; Wu, S. Optimal Scheduling of a Cascade Hydropower Energy Storage System for Solar and Wind Energy Accommodation. Energies 2024, 17, 2734. [Google Scholar] [CrossRef]
- Li, Y.; Fan, Y.; Ke, X.; Huo, C.; Zhou, M.; Yang, Y.; Wang, J.; Xin, Y. Cost Recovery for Variable-Speed Pumped Storage Power Plants in the Market Environment. Energies 2025, 18, 153. [Google Scholar] [CrossRef]
- IHA. Pumped Storage Hydropower Capabilities and Costs; IHA, Pumped Storage Hydropower International Forum: Paris, France, 2021; p. 24. [Google Scholar]
- Simao, M.; Ramos, H.M. Hybrid Pumped Hydro Storage Energy Solutions towards Wind and PV Integration: Improvement on Flexibility, Reliability and Energy Costs. Water 2020, 12, 2457. [Google Scholar] [CrossRef]
- Zhou, Y.; Zhu, Y.; Luo, Q.; Wei, Y.; Mei, Y.; Chang, F.-J. Optimizing Pumped-Storage Power Station Operation for Boosting Power Grid Absorbability to Renewable Energy. Energy Convers. Manag. 2024, 299, 117827. [Google Scholar] [CrossRef]
- Zhou, Y.; Ning, Z.; Huang, K.; Guo, S.; Xu, C.-Y.; Chang, F.-J. Sustainable Energy Integration: Enhancing the Complementary Operation of Pumped-Storage Power and Hydropower Systems. Renew. Sustain. Energy Rev. 2025, 210, 115175. [Google Scholar] [CrossRef]
- Wu, D.; Xiang, H.; Li, D.; Yang, J.; Liu, Z. Study on the Simulation of Electric Power Production in the Integrated Base of Hydro-Wind-Photovoltaic-Storage. Energy Rep. 2024, 12, 4617–4630. [Google Scholar] [CrossRef]
- Global Greenfield Pumped Hydro Energy Storage Atlas—RE100—ANU. Available online: http://re100.eng.anu.edu.au/global/ (accessed on 13 June 2022).
- Ghorbani, N.; Makian, H.; Breyer, C. A GIS-Based Method to Identify Potential Sites for Pumped Hydro Energy Storage—Case of Iran. Energy 2019, 169, 854–867. [Google Scholar] [CrossRef]
- Joint Research Centre, Institute for Energy and Transport European Commision. Assessment of the European Potential for Pumped Hydropower Energy Storage: A GIS Based Assessment of Pumped Hydropower Storage Potential; Publications Office of the European Union: Luxembourg, 2013. [Google Scholar]
- Wu, Y.; Zhang, T.; Xu, C.; Zhang, X.; Ke, Y.; Chu, H.; Xu, R. Location Selection of Seawater Pumped Hydro Storage Station in China Based on Multi-Attribute Decision Making. Renew. Energy 2019, 139, 410–425. [Google Scholar] [CrossRef]
- Madlener, R.; Specht, J.M. An Exploratory Economic Analysis of Underground Pumped-Storage Hydro Power Plants in Abandoned Deep Coal Mines. Energies 2020, 13, 5634. [Google Scholar] [CrossRef]
- Matos, C.R.; Carneiro, J.F.; Silva, P.P. Overview of Large-Scale Underground Energy Storage Technologies for Integration of Renewable Energies and Criteria for Reservoir Identification. J. Energy Storage 2019, 21, 241–258. [Google Scholar] [CrossRef]
- Fan, J.; Xie, H.; Chen, J.; Jiang, D.; Li, C.; Ngaha Tiedeu, W.; Ambre, J. Preliminary Feasibility Analysis of a Hybrid Pumped-Hydro Energy Storage System Using Abandoned Coal Mine Goafs. Appl. Energy 2020, 258, 114007. [Google Scholar] [CrossRef]
- Mongird, K.; Viswanathan, V.; Alam, J.; Vartanian, C.; Sprenkle, V.; Baxter, R. 2020 Grid Energy Storage Technology Cost and Performance Assessment; Department of Energy: Washington, DC, USA, 2020. [Google Scholar]
- Morabito, A.; Steimes, J.; Bontems, O.; Zohbi, G.A.; Hendrick, P. Set-up of a Pump as Turbine Use in Micro-Pumped Hydro Energy Storage: A Case of Study in Froyennes Belgium. J. Phys. Conf. Ser. 2017, 813, 012033. [Google Scholar] [CrossRef]
- Pujades, E.; Orban, P.; Jurado, A.; Ayora, C.; Brouyère, S.; Dassargues, A. Water Chemical Evolution in Underground Pumped Storage Hydropower Plants and Induced Consequences. Energy Procedia 2017, 125, 504–510. [Google Scholar] [CrossRef]
- Katsaprakakis, D.A.; Christakis, D.G.; Pavlopoylos, K.; Stamataki, S.; Dimitrelou, I.; Stefanakis, I.; Spanos, P. Introduction of a Wind Powered Pumped Storage System in the Isolated Insular Power System of Karpathos–Kasos. Appl. Energy 2012, 97, 38–48. [Google Scholar] [CrossRef]
- Ioakimidis, C.S.; Genikomsakis, K.N. Integration of Seawater Pumped-Storage in the Energy System of the Island of São Miguel (Azores). Sustainability 2018, 10, 3438. [Google Scholar] [CrossRef]
- Katsaprakakis, D.A.; Christakis, D.G. Seawater Pumped Storage Systems and Offshore Wind Parks in Islands with Low Onshore Wind Potential. A Fundamental Case Study. Energy 2014, 66, 470–486. [Google Scholar] [CrossRef]
- Portero, U.; Velázquez, S.; Carta, J.A. Sizing of a Wind-Hydro System Using a Reversible Hydraulic Facility with Seawater. A Case Study in the Canary Islands. Energy Convers. Manag. 2015, 106, 1251–1263. [Google Scholar] [CrossRef]
- Pradhan, A.; Marence, M.; Franca, M.J. The Adoption of Seawater Pump Storage Hydropower Systems Increases the Share of Renewable Energy Production in Small Island Developing States. Renew. Energy 2021, 177, 448–460. [Google Scholar] [CrossRef]
- Ding, H.; Hu, Z.; Song, Y. Stochastic Optimization of the Daily Operation of Wind Farm and Pumped-Hydro-Storage Plant. Renew. Energy 2012, 48, 571–578. [Google Scholar] [CrossRef]
- Bhayo, B.A.; Al-Kayiem, H.H.; Gilani, S.I.U.; Ismail, F.B. Power Management Optimization of Hybrid Solar Photovoltaic-Battery Integrated with Pumped-Hydro-Storage System for Standalone Electricity Generation. Energy Convers. Manag. 2020, 215, 112942. [Google Scholar] [CrossRef]
- Yahia, Z.; Pradhan, A. Simultaneous and Sequential Stochastic Optimization Approaches for Pumped Storage Plant Scheduling with Random Breakdowns. Energy 2020, 204, 117896. [Google Scholar] [CrossRef]
- Wild, K. Coupled Operation of a WF and PS Facility—Technico-Economic Modelling and Stochastic Optimization. Master’s Thesis, University of Toronto, Toronto, ON, Canada, 2009. [Google Scholar]
- Dilley, L.M. The Economic Feasibility of Pumped Storage Hydropower. Ph.D. Dissertation, Washington State University, Washington, DC, USA, 2016. [Google Scholar]
- Laurent, B. Modélisation et Optimisation d’un Système de Stockage Couplé à une Production Electrique Renouvelable Intermittente. Ph.D. Thesis, Université de la Réunion, Saint-Denis, France, 2016. [Google Scholar]
- Bakhshaei, P.; Askarzadeh, A.; Arababadi, R. Operation Optimization of a Grid-Connected Photovoltaic/Pumped Hydro Storage Considering Demand Response Program by an Improved Crow Search Algorithm. J. Energy Storage 2021, 44, 103326. [Google Scholar] [CrossRef]
- Akbari-Dibavar, A.; Mohammadi-Ivatloo, B.; Zare, K. Optimal Stochastic Bilevel Scheduling of Pumped Hydro Storage Systems in a Pay-as-Bid Energy Market Environment. J. Energy Storage 2020, 31, 101608. [Google Scholar] [CrossRef]
- Makhdoomi, S.; Askarzadeh, A. Optimizing Operation of a Photovoltaic/Diesel Generator Hybrid Energy System with Pumped Hydro Storage by a Modified Crow Search Algorithm. J. Energy Storage 2020, 27, 101040. [Google Scholar] [CrossRef]
- Kuwabara, T.; Shibuya, A.; Furuta, H.; Kita, E.; Mitsuhashi, K. Design and Dynamic Response Characteristics of 400 MW Adjustable Speed Pumped Storage Unit for Ohkawachi Power Station. IEEE Trans. Energy Convers. 1996, 11, 376–384. [Google Scholar] [CrossRef]
- Alizadeh Bidgoli, M.; Yang, W.; Ahmadian, A. DFIM versus Synchronous Machine for Variable Speed Pumped Storage Hydropower Plants: A Comparative Evaluation of Technical Performance. Renew. Energy 2020, 159, 72–86. [Google Scholar] [CrossRef]
- Sivakumar, N.; Das, D.; Padhy, N.P. Variable Speed Operation of Reversible Pump-Turbines at Kadamparai Pumped Storage Plant—A Case Study. Energy Convers. Manag. 2014, 78, 96–104. [Google Scholar] [CrossRef]
- Gao, C.; Yu, X.; Nan, H.; Men, C.; Zhao, P.; Cai, Q.; Fu, J. Stability and Dynamic Analysis of Doubly-Fed Variable Speed Pump Turbine Governing System Based on Hopf Bifurcation Theory. Renew. Energy 2021, 175, 568–579. [Google Scholar] [CrossRef]
- Feng, C.; Zheng, Y.; Li, C.; Mai, Z.; Wu, W.; Chen, H. Cost Advantage of Adjustable-Speed Pumped Storage Unit for Daily Operation in Distributed Hybrid System. Renew. Energy 2021, 176, 1–10. [Google Scholar] [CrossRef]
- EIA. Annual Energy Outlook. Available online: https://www.eia.gov/outlooks/aeo/tables_side_xls.php (accessed on 2 August 2022).
- Ressources Naturelles Canada, Gouvernement du Canada Ressources Naturelles Canada. L’Atlas du Canada, Toporama. Available online: https://atlas.gc.ca/toporama/fr/index.html (accessed on 6 June 2022).
- USSD Committee on Materials for Embankment Dams. Materials for Embankments Dams; U.S. Society on Dams: Denver, CO, USA, 2009; ISBN 978-1-884575-49-5. [Google Scholar]
- Gouvernement du Québec. Fiches Régionales de Sensibilisation: Les Enjeux Régionaux Des Changements Climatiques; Gouvernement du Québec: Québec, QC, Canada, 2025; p. 115. [Google Scholar]
- Black & Veatch. Cost and Performance Data for Power Generation Technologies; Black & Veatch Compagny: Overland Park, KS, USA, 2012. [Google Scholar]
- Oladosu, G.; Sasthav, C. Hydropower Capital and O&M Costs: An Exploration of the FERC Form 1 Data; Oak Ridge National Laboratory: Oak Ridge, TN, USA, 2022. [Google Scholar]
- Montmarquette, C.; Scott, I. Taux D’actualisation Pour L’évaluation Des Investissements Publics Au Québec; CIRANO: Montréal, QC, Canada, 2007. [Google Scholar]
- France-Renouvelables. Innovations Récentes Dans L’énergie Éolienne: Quelles Sont Les Améliorations Techniques? France-Renouvelables: Paris, France, 2025. [Google Scholar]
- Government of Canada. Loi Sur La Tarification de La Pollution Causée Par Les Gaz à Effet de Serre: Rapport Annuel Au Parlement Pour 2020; Environnement et Changement Climatique Canada: Gatineau, QC, Canada, 2022; p. 29. [Google Scholar]
- Sens, L.; Neuling, U.; Kaltschmitt, M. Capital Expenditure and Levelized Cost of Electricity of Photovoltaic Plants and Wind Turbines—Development by 2050. Renew. Energy 2022, 185, 525–537. [Google Scholar] [CrossRef]
- Wiser, R.; Bolinger, M.; Lantz, E. Assessing Wind Power Operating Costs in the United States: Results from a Survey of Wind Industry Experts. Renew. Energy Focus 2019, 30, 46–57. [Google Scholar] [CrossRef]
- Stehly, T.; Beiter, P.; Duffy, P. 2019 Cost of Wind Energy Review; National Renewable Energy Laboratory: Golden, CO, USA, 2020; p. 86. [Google Scholar]
- Statistique Canada Gouvernement du Canada. Taux de Change Moyens MENSUELS en dollars Canadiens, Banque du Canada. Available online: https://www150.statcan.gc.ca/t1/tbl1/fr/tv.action?pid=3310016301 (accessed on 13 June 2022).

| Variable | Characteristic | Influence | |
|---|---|---|---|
| Fixed variables | Power call | Determines the needs of electricity and heat networks. | The wind farm size, the installed capacity of pumps/turbines, and the amount of water required in the reservoirs. The scenarios impose a thermal production in the balance. |
| Production of wind turbines | Provides renewable power injectable into the network. | The necessary autonomy of the PHSP is caused by periods without wind and the number of wind turbines in the park to meet the power demand. | |
| Location | Each site has its own opportunities and limitations. | The fall, the capacity, the pressure losses, the civil engineering works, and, therefore, the CAPEX of the PHSP. | |
| Sizing variables | Number of wind turbines | Provides the total renewable production on the network at any time. | The integration rate, and, therefore, the amount of hydraulic and thermal production required, influences the park’s CAPEX and OPEX. |
| Turbine power | Defines the range of electrical power that can be injected into the grid. | This parameter determines the PHSP’s ability to support wind energy production and reduce reliance on thermal generation. It directly impacts both capital (CAPEX) and operating (OPEX) costs. | |
| Pump power | Provides the power range that can be subtracted from the network. | The power range available for pumping water. It influences the amount of wind energy lost, the rate at which the upper basin fills, and, by extension, the energy available for the turbines. | |
| Network performance | Useful wind power production | Amount of wind energy injected into the grid directly or via turbines. | Influences the integration rate, GHG reduction, as well as OPEX of wind turbines and thermal generators. |
| Turbine production | Amount of energy injected into the network via the PHSP. | Influences the integration rate, GHG reduction, as well as OPEX of wind turbines and thermal generators. | |
| Wind losses | Amount of surplus energy that could not be pumped. | Opens opportunities for other storage. Losses are influenced by the installed pump power, the water capacity of the reservoirs, and the number of wind turbines. | |
| Production of generators | Share of the energy mix remaining carbon-based. | Influences OPEX related to diesel and carbon taxes. Influences GHG emissions. | |
| Generator operating hours | Represents the aging rate of the generators. | Influences their lifespan and, therefore, their replacement CAPEX. | |
| Feasibility | Technical feasibility |
| |
| Economic feasibility |
| ||
| GHG emissions | There is no precise indicator, but the most significant possible reduction is targeted. | ||
| Generator | Replacement | O&M | Lifetime | Spinning Reserve Units |
|---|---|---|---|---|
| EMD (3.6 MW) | 2.6 MCAD/MW | 19.2 CAD/MWh | 120,000 h | 2 |
| MAN (4.5 MW) | 2.6 MCAD/MW | 38.5 CAD/MWh | 120,000 h | 1 |
| CAT (1.8 MW) | 1.5 MCAD | 58.8 CAD/MWh | 65,000 h | 6 |
| Quantities | Price/Unit | Source | x | Price | |||||
|---|---|---|---|---|---|---|---|---|---|
| Lower reservoir | Excavation | 0 | m3 | 396 | CAD/m3 | Raglan | 1 | 0 | CAD |
| Solid dam | 0 | m3 | 50 | CAD/m3 | 1 | 0 | |||
| Embankment dam | 0 | m3 | 20 | CAD/m3 | 1 | 0 | |||
| Upper reservoir | Excavation | 0 | m3 | 396 | CAD/m3 | Raglan [35] | 1 | 0 | CAD |
| Solid dam | 97,957 | m3 | 50 | CAD/m3 | 1 | 4,897,866 | |||
| Embankment dam | 227,607 | m3 | 20 | CAD/m3 | 1 | 4,552,134 | |||
| Tunnels | Excavation | 22,700 | m3 | 396 | CAD/m3 | Raglan | 1 | 8,989,200 | CAD |
| Road | Construction | 27 | km | 70,000 | CAD/km | Raglan | 1 | 18,900,000 | CAD |
| Power lines | Construction | 40 | km | 500,000 | CAD/km | Raglan | 1 | 20,000,000 | CAD |
| Powerhouse | Equipment | 26,500 | kW | 600 | USD/kW | [38] | 1 | 20,654,100 | CAD |
| Structure | |||||||||
| Excavation | 26,500 | kW | 97 | USD/kW | [64] | 2 | 6,678,159 | CAD | |
| DIRECT COST (DirC) | 85 | MCAD | |||||||
| Engineering and construction management Financial costs (contingency and insurance) Development costs | 25% (DirC) | ||||||||
| INDIRECT COST | 21 | MCAD | |||||||
| TOTAL COST | 106 | MCAD | |||||||
| Variables | Results | Units |
|---|---|---|
| Number of wind turbine | 17 | Dimensionless |
| Hydraulic turbine power | 23 | MW |
| Hydraulic pump power | 30 | MW |
| Wind energy used | 126,000 | MWh/year |
| Wind energy lost | 9700 | MWh/year |
| Hydraulic turbine generation | 40,200 | MWh/year |
| Liters of diesel consumed | 14.6 | ML/year |
| Total GHG emissions | 40,500 | /year |
| Need to install a new generator | None | Dimensionless |
| Renewable energy rate compared to the grid | 48.1 | % |
| Renewable energy rate compared to the objective | 91.8 | % |
| Energy deficit | 0 | MWh |
| Sources | Price (MCAD) |
|---|---|
| Diesel | 191 |
| Carbon taxes | 0 |
| Maintenance | 17 |
| Replacement | 0 |
| Total generator cost | 208 |
| Wind OPEX | 37.6 |
| Wind CAPEX 2023 | 93.5 |
| Wind CAPEX 2032 | 9.4 |
| Total wind cost | 140.5 |
| PHSP OPEX | 28.8 |
| PHSP CAPEX | 135 |
| Total PHSP cost | 163.8 |
| Total cost | 512.3 |
| Index | Price | Units |
|---|---|---|
| Total discounted cost | 346 | MCAD |
| Net present value (NPV) | 5.6 | MCAD |
| Total cost without discount | 512.3 | MCAD |
| Final balance without discount | 122 | MCAD |
| Payback | 2034 | Dimensionless |
| Average OPEX without discount (15 years) | 18.3 | MCAD/year |
| CAPEX in 2023 without discount | 228.5 | MCAD |
| Cost of PHSP [CAD/kW installed] | ||
| Madler and Specht [35] | Present model | Difference |
| 2925–4680 | 3100–4000 | 14.53% |
| GHG emissions [t CO2 eq/an] | ||
| Government of Canada [68] | Present model | Margin |
| 50,000 | 40,500 | 19% |
| Yield of PHSP [-] | ||
| IHA [26] | Present model | Error |
| 0.86 | 0.85 | 1.16% |
Disclaimer/Publisher’s Note: The statements, opinions and data contained in all publications are solely those of the individual author(s) and contributor(s) and not of MDPI and/or the editor(s). MDPI and/or the editor(s) disclaim responsibility for any injury to people or property resulting from any ideas, methods, instructions or products referred to in the content. |
© 2025 by the authors. Licensee MDPI, Basel, Switzerland. This article is an open access article distributed under the terms and conditions of the Creative Commons Attribution (CC BY) license (https://creativecommons.org/licenses/by/4.0/).
Share and Cite
Tardy, A.; Rousse, D.R.; Mungyeko Bisulandu, B.-J.R.; Ilinca, A. Enhancing Energy Sustainability in Remote Mining Operations Through Wind and Pumped-Hydro Storage; Application to Raglan Mine, Canada. Energies 2025, 18, 2184. https://doi.org/10.3390/en18092184
Tardy A, Rousse DR, Mungyeko Bisulandu B-JR, Ilinca A. Enhancing Energy Sustainability in Remote Mining Operations Through Wind and Pumped-Hydro Storage; Application to Raglan Mine, Canada. Energies. 2025; 18(9):2184. https://doi.org/10.3390/en18092184
Chicago/Turabian StyleTardy, Adrien, Daniel R. Rousse, Baby-Jean Robert Mungyeko Bisulandu, and Adrian Ilinca. 2025. "Enhancing Energy Sustainability in Remote Mining Operations Through Wind and Pumped-Hydro Storage; Application to Raglan Mine, Canada" Energies 18, no. 9: 2184. https://doi.org/10.3390/en18092184
APA StyleTardy, A., Rousse, D. R., Mungyeko Bisulandu, B.-J. R., & Ilinca, A. (2025). Enhancing Energy Sustainability in Remote Mining Operations Through Wind and Pumped-Hydro Storage; Application to Raglan Mine, Canada. Energies, 18(9), 2184. https://doi.org/10.3390/en18092184