Article

Cost Breakeven Point of Offshore Wind Energy in Brazil

by
Rodrigo Vellardo Guimarães
1,2,
Milad Shadman
3,*,
Saulo Ribeiro Silva
2,
Segen F. Estefen
3,4,
Maurício Tiomno Tolmasquim
1,4 and
Amaro Olimpio Pereira, Jr.
1,*
1
Energy Planning Program (PPE), COPPE, Universidade Federal do Rio de Janeiro (UFRJ), Centro de Tecnologia, bloco C, sala 211, Cidade Universitária, Ilha do Fundão, Rio de Janeiro 21941-914, Brazil
2
Energy Research Company (EPE), Praça Pio X, 54—Centro, Rio de Janeiro 20091-040, Brazil
3
Offshore Renewable Energy Group (GERO), Ocean Engineering Program, COPPE, Universidade Federal do Rio de Janeiro, Rio de Janeiro 21941-972, Brazil
4
National Institute for Ocean Research (INPO), 4th Floor, Building 3, Rua Aloísio Teixeira, 278—Ilha da Cidade Universitária, Rio de Janeiro 21941-850, Brazil
*
Authors to whom correspondence should be addressed.
Energies 2025, 18(9), 2198; https://doi.org/10.3390/en18092198
Submission received: 6 February 2025 / Revised: 8 April 2025 / Accepted: 21 April 2025 / Published: 25 April 2025
(This article belongs to the Section A: Sustainable Energy)

Abstract

:
Brazil has abundant natural resources and a largely renewable electricity matrix, with about 90% of its capacity from clean sources. Despite strong offshore wind potential, its economic viability remains uncertain due to the lack of a domestic supply chain and reliance on international cost estimates. This study assesses offshore wind competitiveness in Brazil using the investment decision model (IDM), which minimizes expansion and operational costs through 2031. Capacity factors (CF) from ERA5 data support monthly energy production estimates across load levels. Three scenarios were analyzed: (i) a reference case based on Brazil’s 10-Year Energy Plan (PDE 2031); (ii) mandatory addition of 500 MW/year of offshore wind to assess cost impact; and (iii) a breakeven case with gradual CAPEX and OPEX reductions until offshore wind became cost-competitive. The results indicate that offshore wind energy can become economically viable with a CAPEX range of approximately USD 1500–1550/kW and an OPEX of USD 50–55/kW·year in locations with a CF above 60%. These cost levels have already been observed in global markets and may be achievable in Brazil. However, challenges, such as the lack of a domestic supply chain and volatility in the exchange rate, remain significant barriers.

1. Introduction

Brazil has a vast territorial area and abundant natural and energy resources. Therefore, approximately 90% of the power in the national electricity system comes from renewable sources [1]. Furthermore, 62% of the total installed power comes from hydroelectric plants, which significantly contribute to the operational flexibility of the system and meeting peak demand [1]. On the other hand, despite having an excellent offshore wind resource, with almost 8000 km of coastline and an extensive continental shelf, offshore wind energy is not yet part of the Brazilian energy matrix. Is offshore wind energy competitive in Brazil, which already has several cheaper and consolidated renewable sources in its electrical matrix? In any case, the country has recently been attracting some entrepreneurs to this market, currently involving 97 projects in the process of environmental licensing at IBAMA (Brazilian Institute of Environment and Renewable Natural Resources) [2], totaling 234 GW of installable capacity. Regarding regulatory aspects, which are still under development, Law No. 15,097, of 10 January 2025 [3], has been approved by the National Congress and sanctioned by the President. It regulates the use of energy resources within the Union’s maritime space. The following key aspects of this so-called “Offshore Wind Power Framework” are worth highlighting:
  • The responsibility of the executive branch to define the areas eligible for the installation of wind farms, the authorization or concession of the areas [4,5], including the bidding process, and the definition of the wind prism;
  • Payment for the use of marine space [6].
In addition to Decree No. 10,946 of 25 January 2022 [5], which establishes the guidelines for the transfer of use of physical spaces and the use of natural resources in inland waters under the jurisdiction of the Union, in the territorial sea, in the exclusive economic zone and on the continental shelf, with the aim of generating electricity from offshore projects, such as wind farms, as well as two interministerial ordinances [7,8], which deal with the subject but still do not offer a robust regulatory framework. Despite some progress in opening the market and advancing the legal framework, economic uncertainties persist—particularly regarding CAPEX and OPEX—since Brazil lacks a commercial-scale domestic supply chain. As a result, there are still no reliable local cost estimates, and pricing remains based solely on international benchmarks [9]. Considering that Brazil has an extensive and shallow continental shelf, port infrastructure along the entire coast, and average wind speeds above the world average, it is possible to obtain both CAPEX and OPEX that are more competitive than international reference prices. In addition to costs, space-time criteria should also be analyzed in an integrated manner, considering the Brazilian Electric System (SEB), due to time–season complementarity, creating a portfolio effect [10], which can be an important attribute for the SEB.
The objective of this paper, therefore, is to evaluate the competitiveness of offshore wind energy and to provide a perspective on the potential of the source for its insertion into the SEB within a regulated market. To assess economic competitiveness, an electricity sector expansion model is used, which is an optimization model to minimize the total cost of operation and expansion over the study horizon (until 2031). This model is used by the Energy Research Company (EPE) in medium-term studies (10 years) called the investment decision model (IDM) [1]. With this methodology, the “breakeven point” is obtained, that is, at what CAPEX and OPEX cost the source would be viable without increasing the cost of expanding the Brazilian electricity system, taking as a reference the cost of expansion of the 2031 Ten-Year Energy Expansion Plan.

2. Materials and Methods

The electricity production and transmission system in Brazil, the Brazilian Electric System (SEB), is a large hydrothermally renewable system, with a predominance of hydroelectric plants in terms of power and energy [1]. Although generation and transmission are owned by private companies, the dispatch operation, however, is carried out centrally, by the National Electric System Operator [11]. The National Interconnected System (SIN) comprises 4 subsystems and 180,000-km transmission lines, as shown in Figure 1.
The interconnection of these subsystems, through transmission lines, allows for synergistic gains (portfolio effect) and explores the diversity and complementarity [12,13] of renewable resources, promoting the integration of generation and transmission resources, allowing demand to be met safely and economically.
In recent years, the installation of wind and photovoltaic plants has shown strong growth, increasing the importance of this generation for serving the market, as well as the challenges for operation, considering the variability of generation [1]. Thermoelectric plants, which are generally located close to the main load centers, play an important strategic role in the security of the SIN. These plants are dispatched according to current hydrological conditions, allowing the management of water stocks stored in the reservoirs of hydroelectric plants to guarantee future service [14].
For this study, hydroelectric generation is represented in an expansion model of the electric sector, the MDI, using power and generation series, which are available monthly in the study horizon [15]. In this way, simulation simplifies the representation of the system’s operation by incorporating mechanisms, such as risk aversion, deficit cost functions, and the modeling of renewable sources. It does so through a hydrothermal simulation based on the output of the SUISHI model (Simulator of Individual Plants in Interconnected Hydrothermal Systems), developed by CEPEL (Electric Power Research Center) [16]. In addition, the maximum hydroelectric power available for the peak load level is calculated considering that all the water resources used in the month can be displaced to the peak level, as long as there are sufficient water resources in the other levels to guarantee the minimum flow turbidity. In summary, as shown in Figure 2, the model simulates hydraulic generation to maximize the generation at the peak load while restricting the generation outside this level [17]. If the system has technological options that meet the base load, hydroelectric plants will have the role of meeting the system’s flexibility demand, that is, peak demand.
The procedure for defining the hydrological series used in this work is described in [10,16]. Based on the historical series of flow rates from 1931, 70 synthetic hydrological series were generated by the SUISHI model. However, to provide a good statistical representation without overloading the computational time, a subset of 3 series was selected. The energy and power series available for each plant are the input data for the model, which decides the best distribution of this energy between the load levels while respecting the minimum and maximum limits. The power contribution methodology of each source is described in [10]. Annex A of [12] provides a tutorial for modeling and optimizing linear programming problems using PYOMO.
For this study, the same IDM model used by EPE in the PDE 2031 (Energy Expansion Plan 2031) [1] was used. Based on an integrated view of mixed energy sources and considering the uncertainties associated with a foresight exercise, this study was constructed using the open-source PYOMO package and then solved using linear mixed-integer programming techniques using the IBM CPLEX Studio 12.9. Appendix A of [10] provides a tutorial for modeling this investment decision problem.

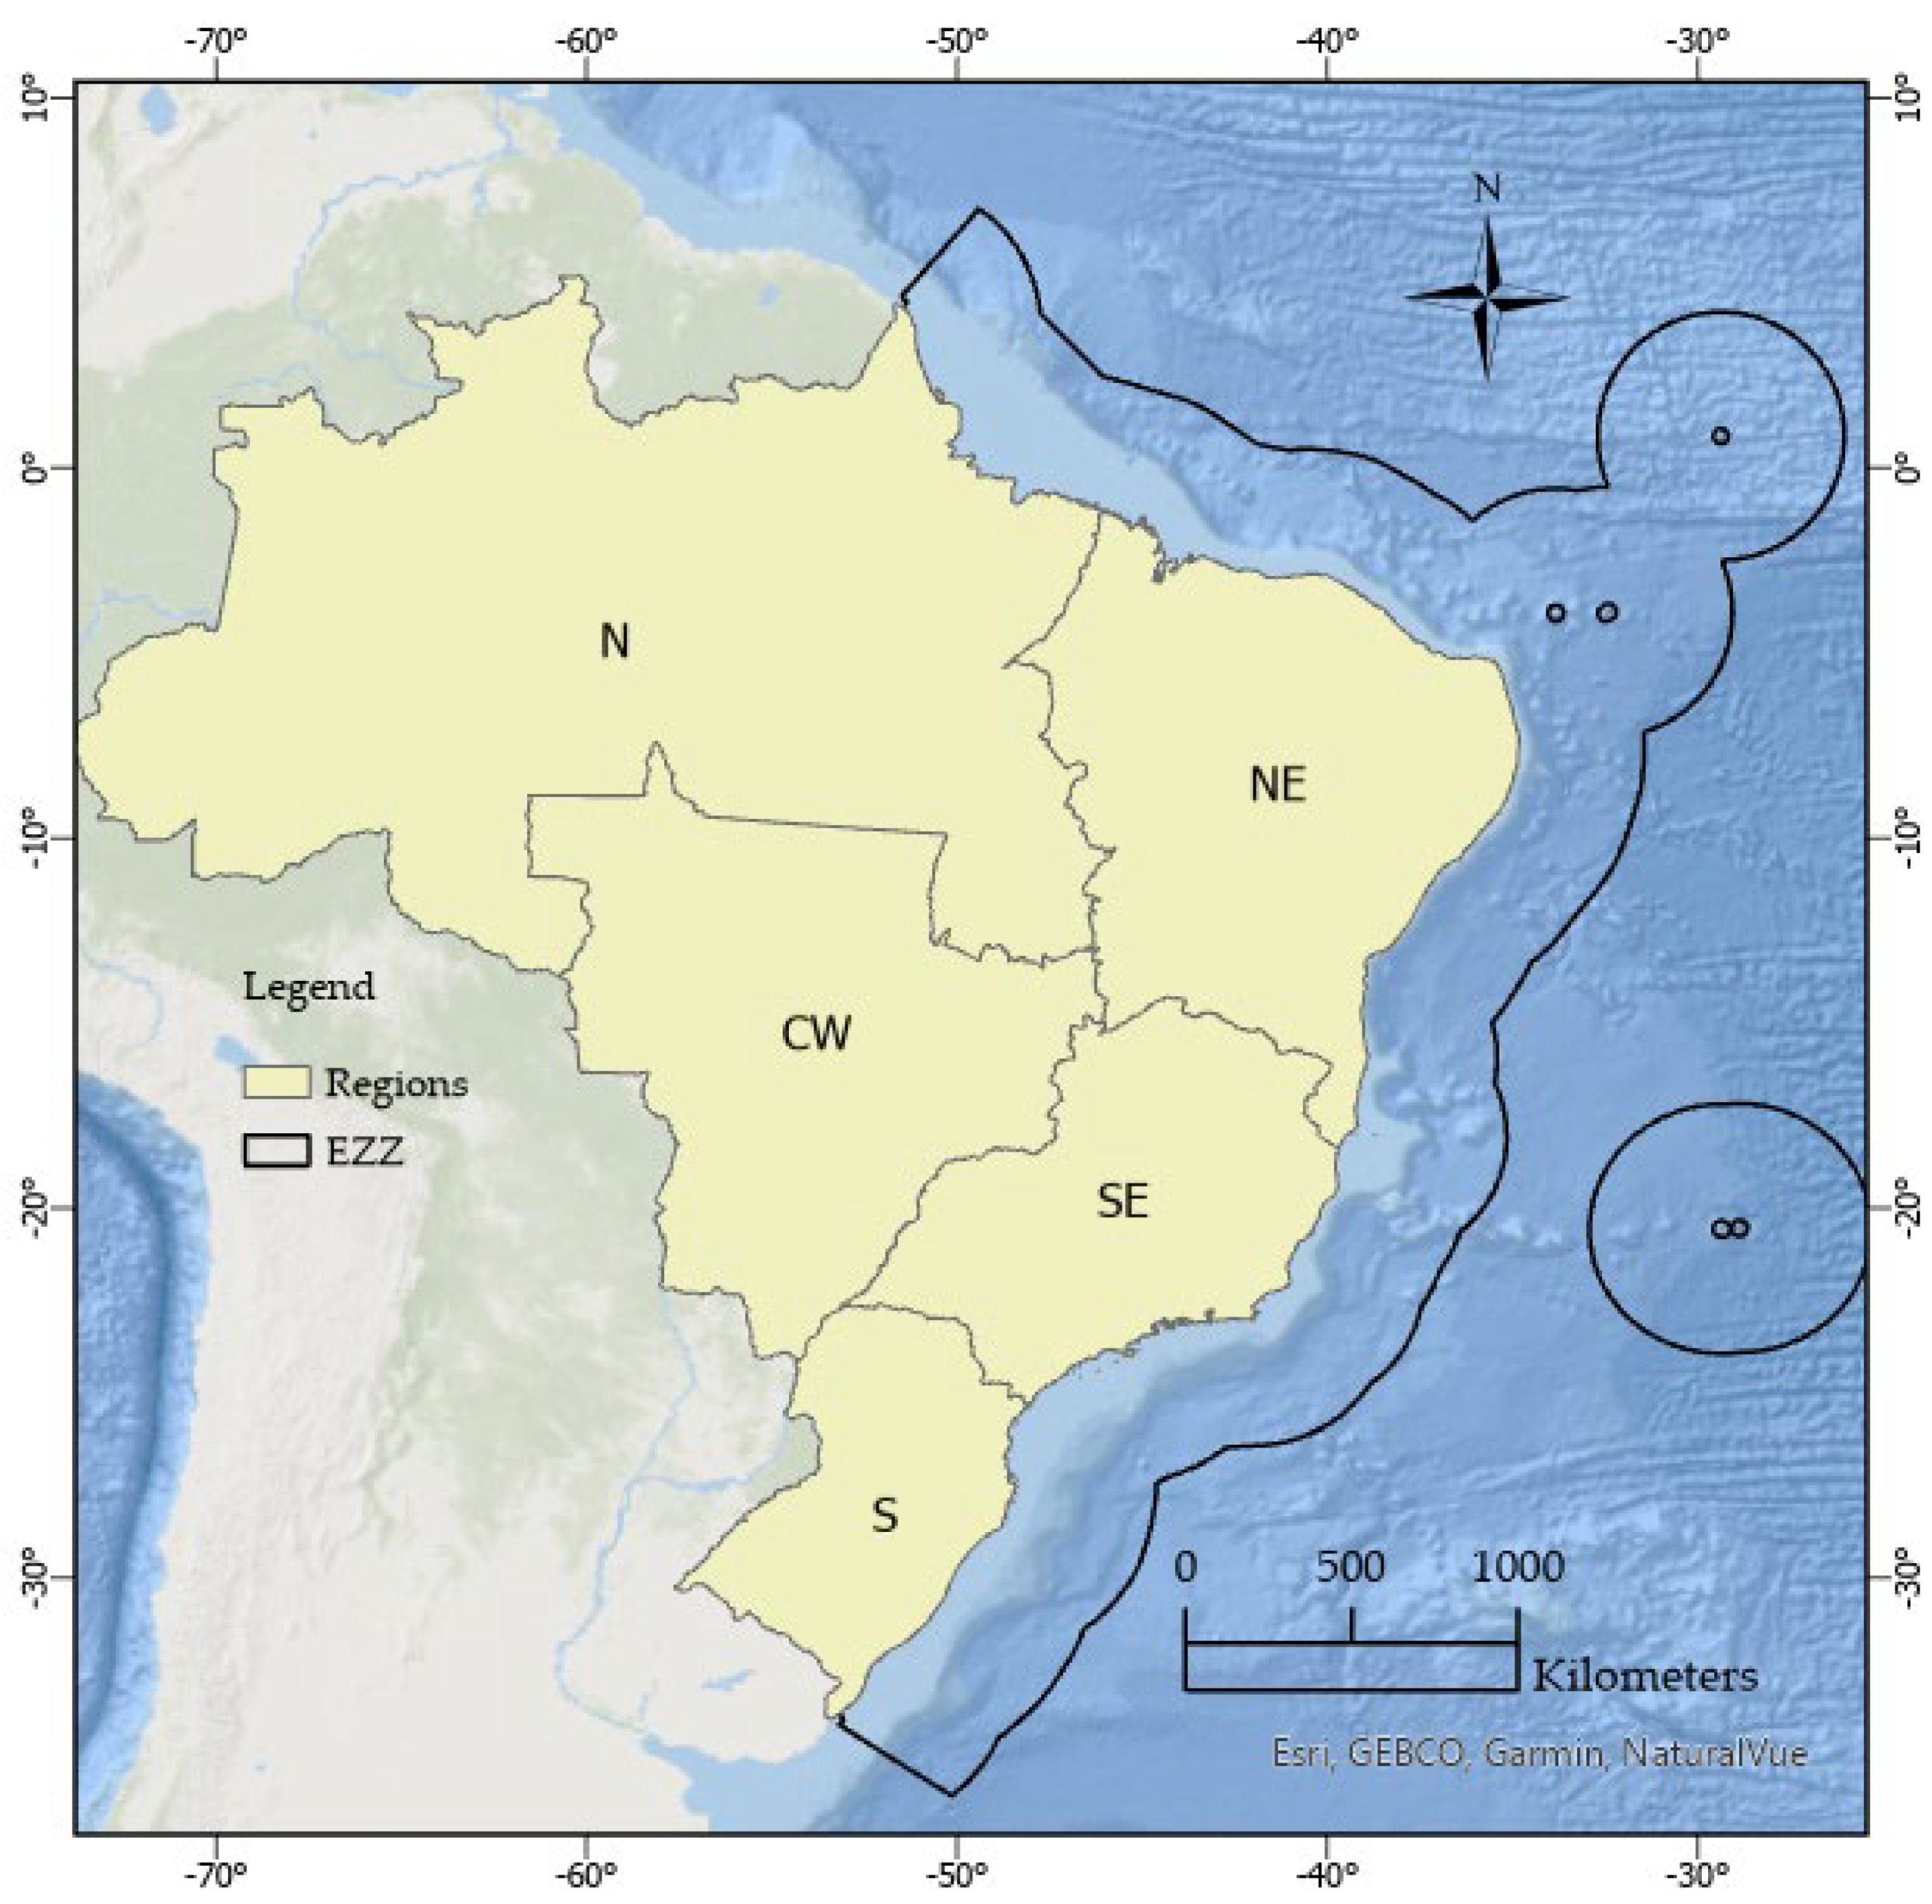
2.1. Study Area and Wind Data

The study area is located on the coast of Brazil, in an area called the EEZ (exclusive economic zone), which is a region located 200 nautical miles from the coastline, also considering the islands as an extension of the continental shelf. The polygon that delimits the area is shown in Figure 3.
In the study area along the coast, technical, economic, and environmental restrictions were introduced to exclude unsuitable areas. After determining the best points in each geographic region of the country, offshore windfalls were simulated under three economic scenarios. The workflow is shown in Figure 4.
To evaluate wind data over the ocean, which are scarce and often have inadequate spatial and temporal coverage, atmospheric reanalysis data were used. This technique is an option for robust analysis of offshore wind resources because of its continuity in time and space [18]. The results of the wind speed at 100 m from the ECMWF Atmospheric Reanalysis fifth generation (ERA5) [19] were used in the calculation of the capacity factor of the three wind turbines. The ERA5 reanalysis used a 4D-Var assimilation method with a hybrid Sigma pressure of 137 and model top at 0.01 hPa. The temporal resolution was hourly, and the horizontal spatial resolution was 0.25° × 0.25°.

2.2. Logarithmic Extrapolation

ERA5 wind data are available at 100 m above sea level [19]. However, in this study, three different wind turbines were considered. Therefore, it is necessary to extrapolate the wind data to the hub heights of the wind turbines. The extrapolation was performed through log law with some considerations already assumed in previous studies [20,21] for the Brazilian coast, such as the stability of the neutral atmosphere and an approximate coefficient for the open and calm sea of Z_* = 0.2 mm [5,6,7]. The wind variation was calculated by Equation (1)
v ( Z ) = v r e f Z Z * Z r e f Z *
where v(Z) represents the wind speed at the desired height and Vref the wind speed at the reference height Zref.

2.3. Weibull Probability Density Function

Weibull is a bi-parametric statistical model represented as a probability density function f(v) [22,23], widely used in wind energy studies to model wind speed distribution. In the calculation of the Weibull function, two parameters are required: scale (c) and shape (k) parameters. The parameter c is linked to the wind intensity distribution and is represented by the mean wind speed. Then, it was calculated using Equation (2) [24].
k = σ v _ 1.086
k is the measure of the shape distribution and is linked to the standard deviation. It was estimated by Equation (3) [24].
c = v _ Γ   1 + 1 k
where f(v) refers to the probability of a certain wind speed V occurring.

2.4. Capacity Factor

The capacity factor (CF) gives the ratio of the energy produced to the energy that could be produced if the turbine were to operate full time at the rated power (P_n) [25]. The given turbine output (P_t) was estimated by the Weibull probability density function and turbine production function (P(v)) according to Equation (4) and annual energy production (AEP) by Equation (5). Subsequently, the CF was calculated using Equation (6)
P t = 0 P   ( v )   f   ( v )   d v
AEP = P t   T
CF = A E P   P n   T
where T represents the number of hours in the year (8760 h).
In this study, AEP and CF calculations were performed considering three different wind turbines, including LW 8MW (leanwind reference turbine) [26], DTU 10MW (Technical University of Denmark) [27], and IEA 15-MW (International Energy Agency) [28], with hub heights of 110, 119, and 150 m. Figure 5 illustrates the power curve of each turbine.

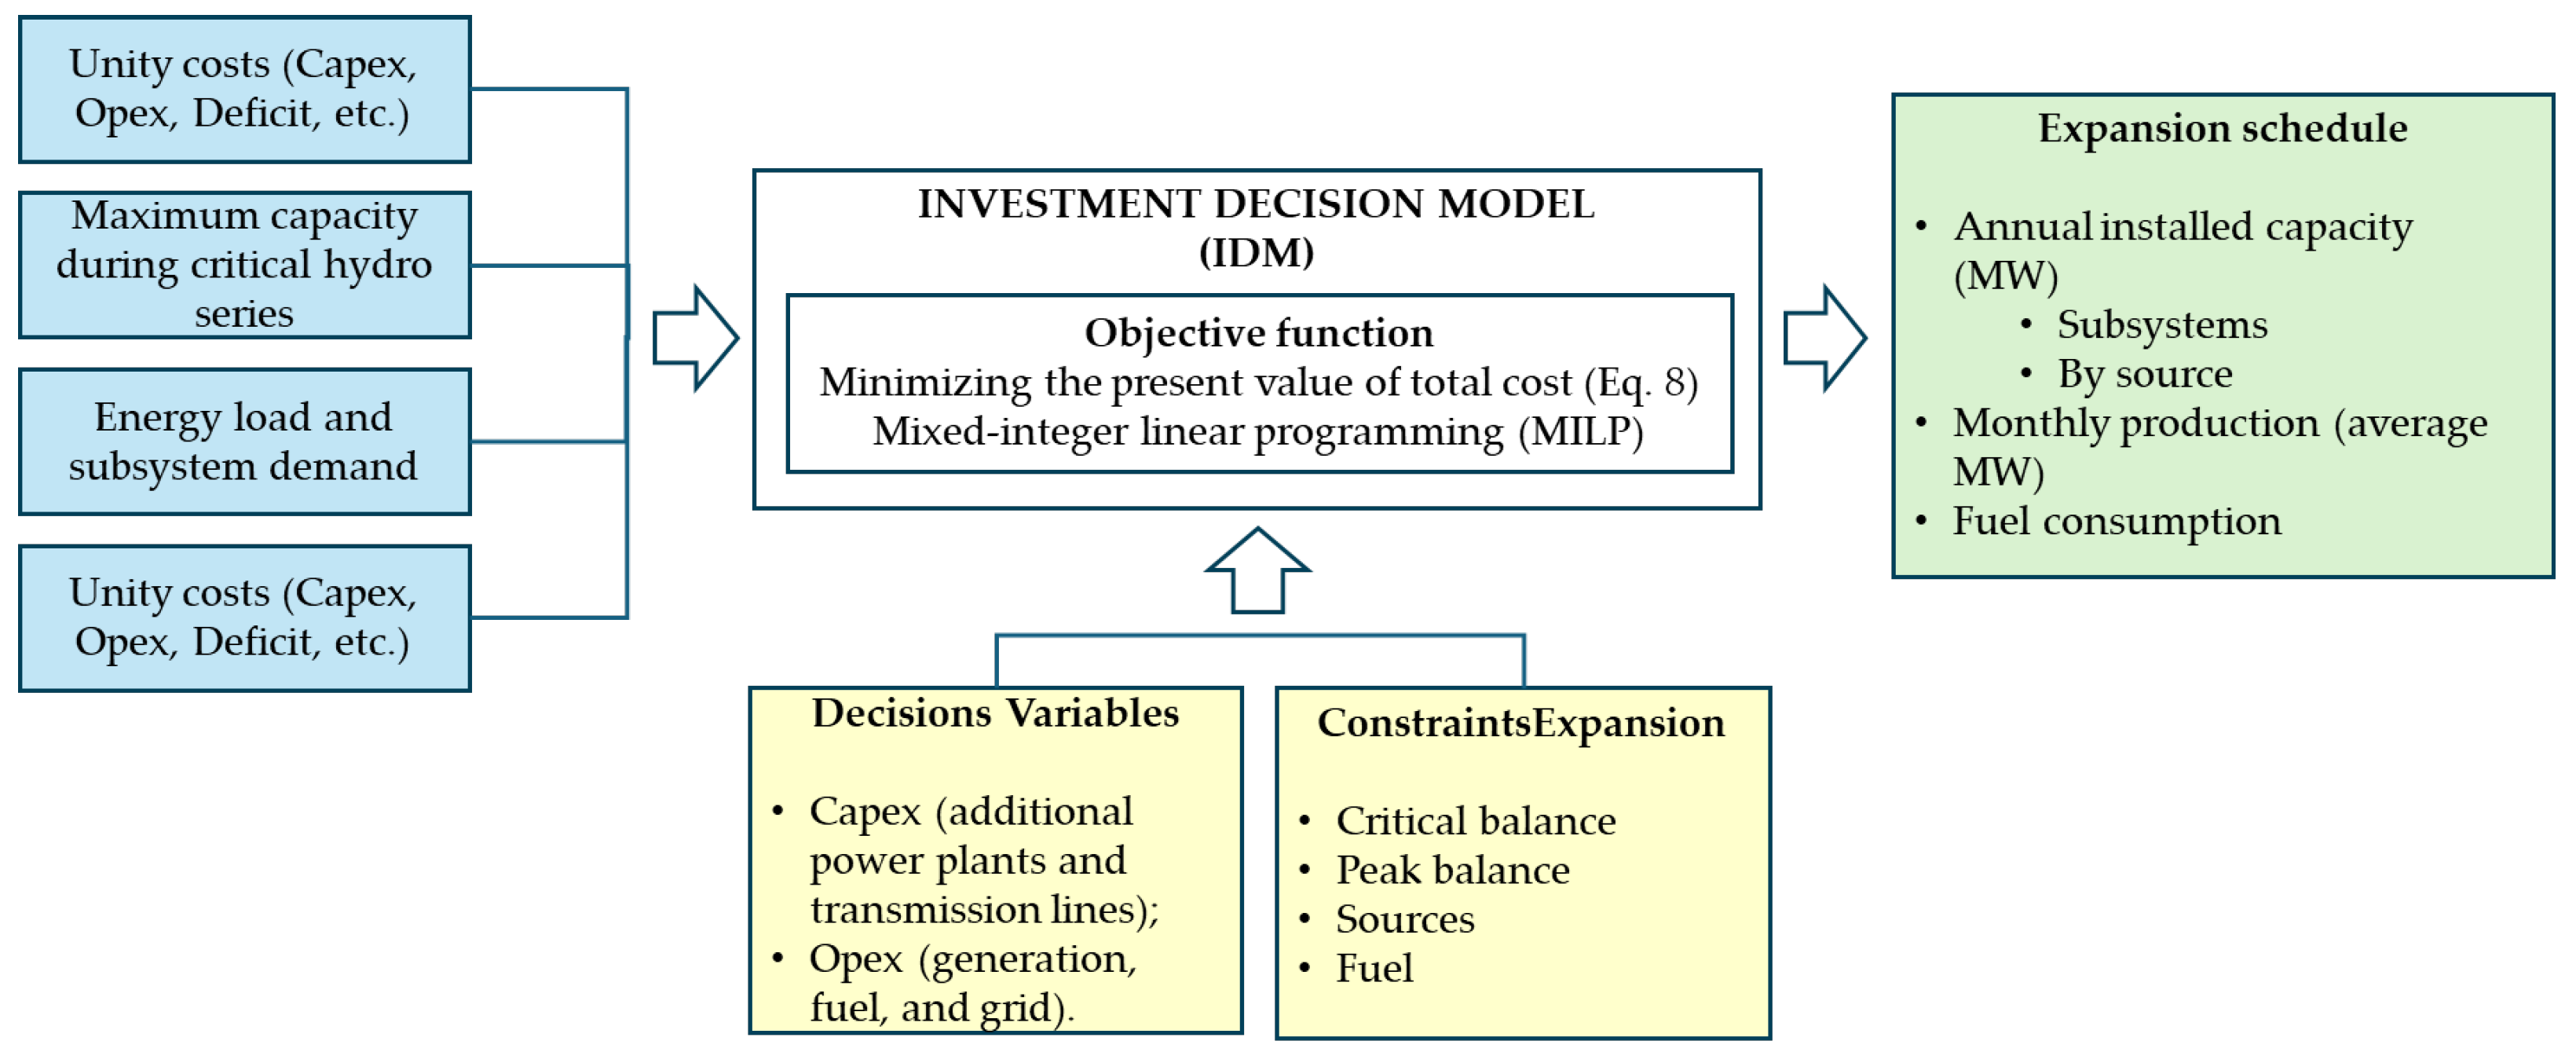
2.5. Competitiveness Assessment of Candidate Sources for Expansion

The investment decision model (IDM) is an optimization model used to make an economic decision indicating the optimal investment option to meet the demand for electricity, subject to the technical constraints of the candidate sources. The objective of the model is to minimize the present value (PV) of the total cost of system expansion, taking into account the capital expenditures (CAPEX) derived from new plants, including hydroelectric, thermal, and other renewables, such as biomass, solar, onshore, and offshore wind, etc., as well as the operating costs (OPEX) of the generation of the entire system during the study period. The CAPEX of a new plant is the total costs associated with project planning, purchasing, installation, and commissioning. On the other hand, OPEX includes the ongoing cost of operation and maintenance of the plants. As shown in Equation (7) Tx, the PV is the total future value (FV) discounted at a discount rate of X%. Then, the objective function can be expressed by Equation (8) [9].
P V = F V 1 + T x k
n k = 1 K 1 1 + T X k · j J i H P h j k · x h j k + j J i R P r j k · x r j k + j J i T P t j k · x t i , j k + j J i Z P z j k · x z j k + h ^ = m e d , c r i t E h ~ · j H i l = 1 , , L γ j , h k · h ~ j , h ^ k , l + j R i l = 1 , , L γ j , r k · r ~ j , h ^ k , l + j T i l = 1 , , L γ j , t k · t ~ j , h ^ k , l + l = 1 , , L δ i , h ~ k · ω ~ i , h ~ k , l
where k, l, i, and j represent the years of study, time segmentation of the year, subsystems, and projects, respectively. HP, TP, and RP are hydropower, thermoelectric, and other renewable projects, respectively. ZP represents the interconnection projects of the transmission system between two subsystems x h j k , x t j k ,   x r j k , and x z j k are binary variables representing the construction decision for hydropower, thermoelectric, other renewables, and interconnection project j in year k, respectively. h j k , t j k , r j k , and z j k are the CAPEX (USD/kW) of hydropower, thermoelectric, other renewables, and interconnection project j in year k, respectively. h ^ and E h ~ are the hydrological condition and probability of occurrence of hydrological condition. h ^ , γ j , h ^ k ,   γ j , t ^ k , and   γ j , r k are the OPEX (USD/kWy) of the hydropower, thermoelectric, and other renewable power plant j in year k, respectively. h ~ j , h ^ k , l ,     t ~ j , h ^ k , l , and     r ~ j , h ^ k , l represent the energy production, in MWh/year, of the hydropower, thermoelectric, and other renewables power plant j in year k, month l, and hydrological condition h ^ , respectively. δ j k is the energy deficit cost in year k and hydrological condition h ^ . ω ~ i , h ^ k , l is the energy deficit of the subsystem i in year k, month l, and hydrological condition h ^ .
The present value (PV) represents the sum of the capital expenditures (CAPEX) associated with the deployment of new plants and potential expansions of the transmission system, alongside the operational expenditures (OPEX) of the entire operating system under varying hydrological conditions and the cost of deficits. It is noteworthy that capacity expansions are driven not only by economic criteria but also by the necessity of meeting all problem constraints, particularly ensuring energy balances during peak periods. This is commonly referred to as the reliability criterion.
The constraints of the linear programming model are defined as follows: expansion project constraints (expansion), limited annually based on estimates of the supply chain capacity for each technology; operational constraints (critical and peak balance), modeling each predicted hydrological scenario, considering the most critical periods and ensuring energy demand is met at various load levels in each subsystem across all months within the study years; and resource constraints, accounting for the availability of renewable and non-renewable resources, factoring in the seasonality of each source, such as the sugarcane harvest period or the windy season. To integrate the electricity and energy sectors, fuel consumption constraints were incorporated into the model, specifically designed to limit fossil fuel consumption within the study horizon. Maximum allowable fuel usage can be determined annually, and to support critical hydrological situations requiring increased thermoelectric generation, these limits may vary by hydrological scenario. The optimization problem was constructed using the open-source package PYOMO and solved through mixed-integer linear programming (MILP) with the IBM ILOG CPLEX Studio. Figure 6 illustrates the flowchart of the optimization process.
Three scenarios were developed to explore the potential integration of offshore wind energy into the Brazilian electricity system. The purpose of these scenarios was to compare and evaluate an optimization model that minimizes total costs—for both simplified operation and for expansion—by incorporating input values for CAPEX, OPEX, and capacity factors. The goal is to ensure that the solution cost, including both the marginal cost of operation and the marginal cost of system expansion, remains consistent with the values of the reference scenario, which serves as a benchmark for stakeholders in the Brazilian electricity sector. Starting from the reference scenario, successive comparative iterations were conducted to assess the competitiveness of offshore wind energy against other candidate sources for expansion in the regulated market of the Brazilian electricity grid while considering the model’s assumptions, incentive policies, and constraints. The three scenarios developed are as follows:

2.6. Reference Expansion Scenario

This reference scenario, based on the assumptions outlined in the Energy Expansion Plan 2031 (PDE) prepared by the Energy Research Company (EPE), was used to compare the total cost of the solution, comprising the marginal cost of expansion and the marginal cost of operation over the study horizon. Within this framework, investments in new electricity generation projects aim to meet the projected demand for the ten-year horizon, taking into account commercially available technologies, their technical limitations, and resource seasonality, with input values derived from international publications and energy auctions in Europe [29]. Detailed information about the costs of the modeled technologies is provided in Appendix A. For offshore wind, the CAPEX was set at USD 2500.00/kW, assuming a 20-year project lifespan and O&M costs ofUSD 100 per kW·year. Cost reductions were projected by factoring in the learning curve and economies of scale [30]. In addition, certain energy policies impose constraints, including minimum, maximum, and mandatory input requirements.

2.7. What-If Analysis: Mandatory Offshore Wind Energy

In this round, to meet the expansion demand for 2031, the same cost assumptions for the technologies as in the reference round were used, as well as the same technical and resource constraints. However, in this scenario, with a mandatory entry of 500 MW per year of offshore wind energy from 2026 to 2031, the same CAPEX (USD 2500/kW) and OPEX (USD 100 kW·year) values from all sources were used. This simulation evaluates the impact of the insertion of the source by a public politician on the marginal cost of operation and expansion.

2.8. What-If Analysis: Breakeven Point

In this simulation, the objective is to estimate the CAPEX and OPEX values that would enable the entry of offshore wind power into the Brazilian electricity grid while maintaining the estimated operation and expansion costs at the same level as the reference scenario without relying on subsidies or public incentive policies. In this round, the investment and operating costs for other technologies were kept constant, along with the same demand and hydrological series. The CAPEX evaluation began with a 5% reduction in both CAPEX and OPEX relative to the reference value, progressively decreasing these values until reaching a point where the optimization model selected offshore wind power as a viable candidate for indicative expansion among the available options.

3. Results

3.1. Offshore Wind Farm Local Definition

To determine the locations, the points along the coast within the exclusive economic zone (EEZ) with the highest capacity factors were selected, choosing one point for each geographic region. Figure 7 illustrates the annual mean offshore wind speed at a height of 100 m along the Brazilian coast, derived from the ERA5 reanalysis data. As shown, four hotspots with annual mean wind speeds exceeding 8 m/s were identified along the coastline, corresponding to the South (S), Southeast (SE), Northeast (NE), and initial portions of the North (N) regions. These areas include the states of Rio Grande do Norte (RN), Ceará (CE), Piauí (PI), Maranhão (MA), Espírito Santo (ES), Rio de Janeiro (RJ), Santa Catarina (SC), and Rio Grande do Sul (RS).
Although relatively high wind speeds make these regions attractive for offshore wind energy projects, various local factors—such as water depth, logistical and electrical infrastructure, and environmental constraints—can significantly impact the feasibility of energy development. For instance, in the Northeast and North regions, shallow waters less than 50 m within a broad continental shelf provide favorable conditions for bottom-mounted offshore wind turbines [31]. In contrast, in the Southeast region, significant wind resources are found at greater distances from the coast, in waters exceeding depths of 100 m and reaching up to 3000 m. These characteristics often necessitate floating wind turbine installations, longer submarine cable systems, extended licensing periods, and other complexities, resulting in more intricate and costly projects [32,33].
These technical constraints effectively limit the usable ocean area for offshore wind energy deployment. In this study, to ensure a realistic and industry-relevant analysis, the usable ocean area is defined by applying key technical constraints, including: (a) minimum annual average wind speed, (b) water depth limit, (c) distance to the port, (d) accessibility of the onshore substation terminal, (e) marine protection areas, and (f) minimum distance from the shore to mitigate visual impact. Table 1 lists the detailed values of these parameters.
Constraint criteria were applied along the North (N), Northeast (NE), Southeast (SE), and South (S) coasts using wind reanalysis data and geographic information system (GIS) datasets. To estimate wind speed in areas without direct measurements, a bilinear interpolation method was employed [34]. The optimal wind farm location for each region was determined by identifying the point at the highest average annual wind speed (Table 2).

3.2. Monthly Capacity Factor

The monthly mean capacity factor (CF) values were calculated for three wind turbine configurations: LW 8-MW, DTU 10-MW, and IEA 15-MW. Generally, the highest CF values were observed in the southern hemisphere during spring months (September, October, and November), while the lowest values occurred in autumn, specifically during March and May (Figure 8). Across all four locations and seasons, the IEA 15-MW turbine consistently demonstrated higher CF values than the other turbines.
The states of Maranhão (MA) and Rio Grande do Norte (RN) exhibited the highest CF values, reaching approximately 90% for the IEA 15-MW turbine. However, these states exhibited greater seasonality than Rio de Janeiro (RJ) and Rio Grande do Sul (RS). This seasonal variability was significantly influenced by the intertropical convergence zone (ICZ). When the ICZ was positioned farther north (August–September), the southeast trade winds intensified, resulting in higher CF values. Conversely, at the southernmost position (March–April), southeast trade winds weakened, resulting in lower CF values.
In RJ and RS, the CF peaks were approximately 60% and 65% for the 15-MW IEA turbine, respectively. The wind climate in the South and Southeast of Brazil is shaped by the interaction of transient frontal systems, the semi cyclonic-anticyclonic South Atlantic Subtropical High (SASH), and other factors. These interactions resulted in lower seasonal variability compared to the MA and RN regions.
Regardless of location, offshore wind resources demonstrated seasonal complementarity with hydroelectric generation, contributing to the resilience of the Brazilian Electricity System (SEB). Table 3 presents the potential exploitable area (PEA) and average annual CF for each turbine at the selected locations.
Figure 8a–d illustrate the results, highlighting the selected offshore wind farm locations along the coasts of Maranhão (MA), Rio Grande do Norte (RN), Rio de Janeiro (RJ), and Rio Grande do Sul (RS) in the N, NE, SE, and S regions, respectively.

3.3. Offshore Wind Inclusion Scenarios

3.3.1. Reference Expansion Scenario

Based on the established assumptions, the location with the highest capacity factor (CF) along the Brazilian coast was selected as a candidate source to compete with other technologies in the optimization model for expansion planning, simulating production using the integrated decision model (IDM). The evolution of the annual installed capacity over the 10-year horizon, categorized by typographic source, is presented in Table 4. Additionally, Figure 9 illustrates the variation in installed capacity according to technology between the initial configuration in May 2024 and the expanded configuration at the end of 2031. This graphic also includes the variation in distributed generation, approximately 85% of which, by the end of the period, is represented by photovoltaic technology.
Considering the total expansion, wind, solar, and natural gas emerge as the primary drivers of growth in electricity supply over the study horizon. In this simulation round, summarized in Table 4—System expansion summary, the CAPEX and OPEX assumptions from PDE 2031 [1], derived from international references, are applied. Despite this, offshore wind power was not selected for the expansion of the cost-minimization optimization model. The total investment cost over the period amounted to USD 84.2 billion, with a total installed capacity reaching 46 GW.

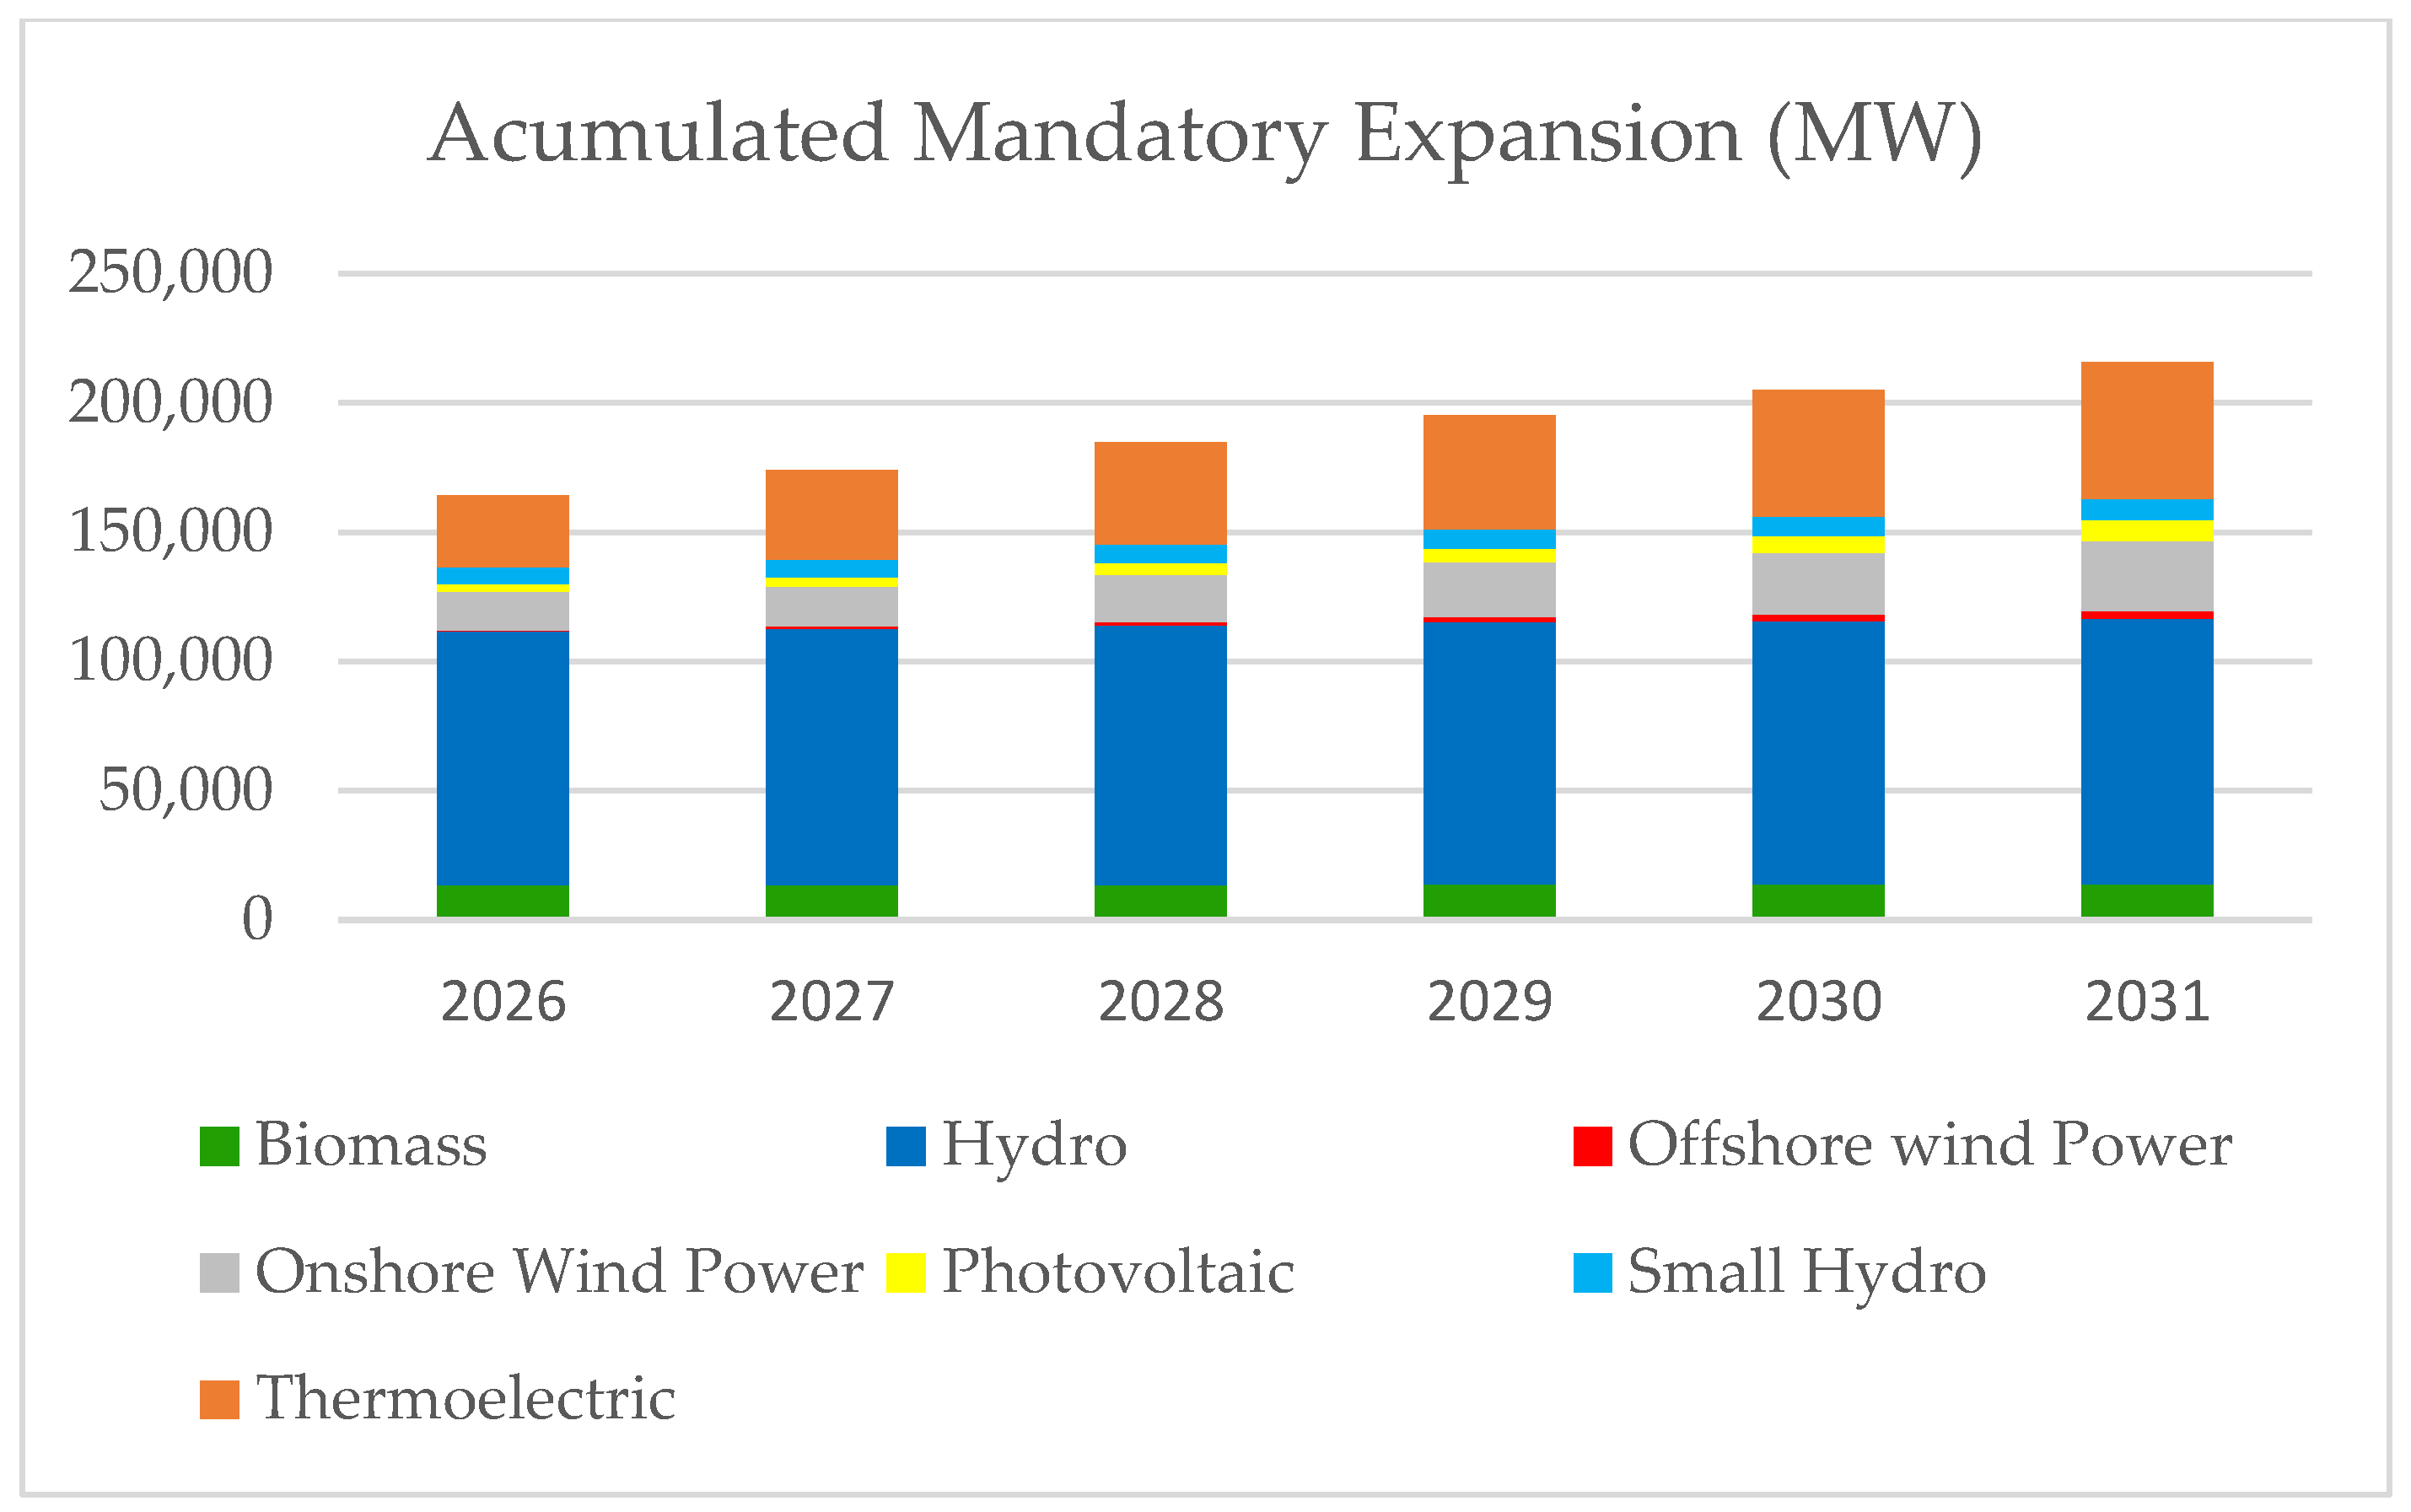
3.3.2. What-If Analysis: Mandatory Offshore Wind Energy

In this simulation, summarized in Table 5 and Figure 10, the CAPEX and OPEX for offshore wind energy were maintained at the same levels as in the reference scenario, and the same technological options were considered. However, this simulation mandated the inclusion of at least 500 MW per year of offshore wind capacity between 2026 and 2031. The total investment cost for the period was approximately USD 89.1 billion, representing a 5.6% increase compared to the reference scenario.
Additionally, the resulting energy matrix included a higher proportion of thermal power plants using fossil fuels, with an additional 2.8 GW compared to the reference scenario. This shift may be attributed to the increased demand for power and system flexibility. Furthermore, some previously inventoried hydroelectric projects were “displaced”, as were variable renewable sources such as onshore wind and photovoltaic technologies.

3.3.3. What-If Analysis: Breakeven Point

The global if analysis: breakeven point advancement in offshore wind technology, along with progress in technical, economic, and socio-environmental studies and the establishment of regulations in Brazil, could improve the competitiveness of this technology, enabling its deployment in the coming years and providing significant benefits to the electrical system. However, currently, the exact installation and operating costs of offshore wind energy in Brazil remain uncertain, with estimates relying on international references. As shown in Table 6, these uncertainties are primarily influenced by key technical and economic constraints.
This scenario aims to determine the CAPEX and OPEX levels at which offshore wind energy can become competitive without increasing the total expansion costs of the energy solution. In the scenario with the estimated breakeven point, successive reductions of 5% in CAPEX and OPEX were applied in each iteration until the linear programming optimization model, focused on cost minimization, achieved the same total expansion and operating cost of approximately USD 147 billion. The breakeven point of CAPEX and OPEX values were found to be USD 1500/kW and USD 55/kW·year, respectively, representing a 40% reduction compared to the initial assumptions. These values fell within the range projected by the IEA for the 2030 horizon [30], as illustrated in Figure 11.
At the end of the period, the breakeven scenario resulted in an energy matrix with a slight reduction in natural gas capacity approximately 500 MW less, and a modest reduction in onshore wind capacity, by approximately 3500 MW less. The share of other energy sources in the matrix remained unchanged.

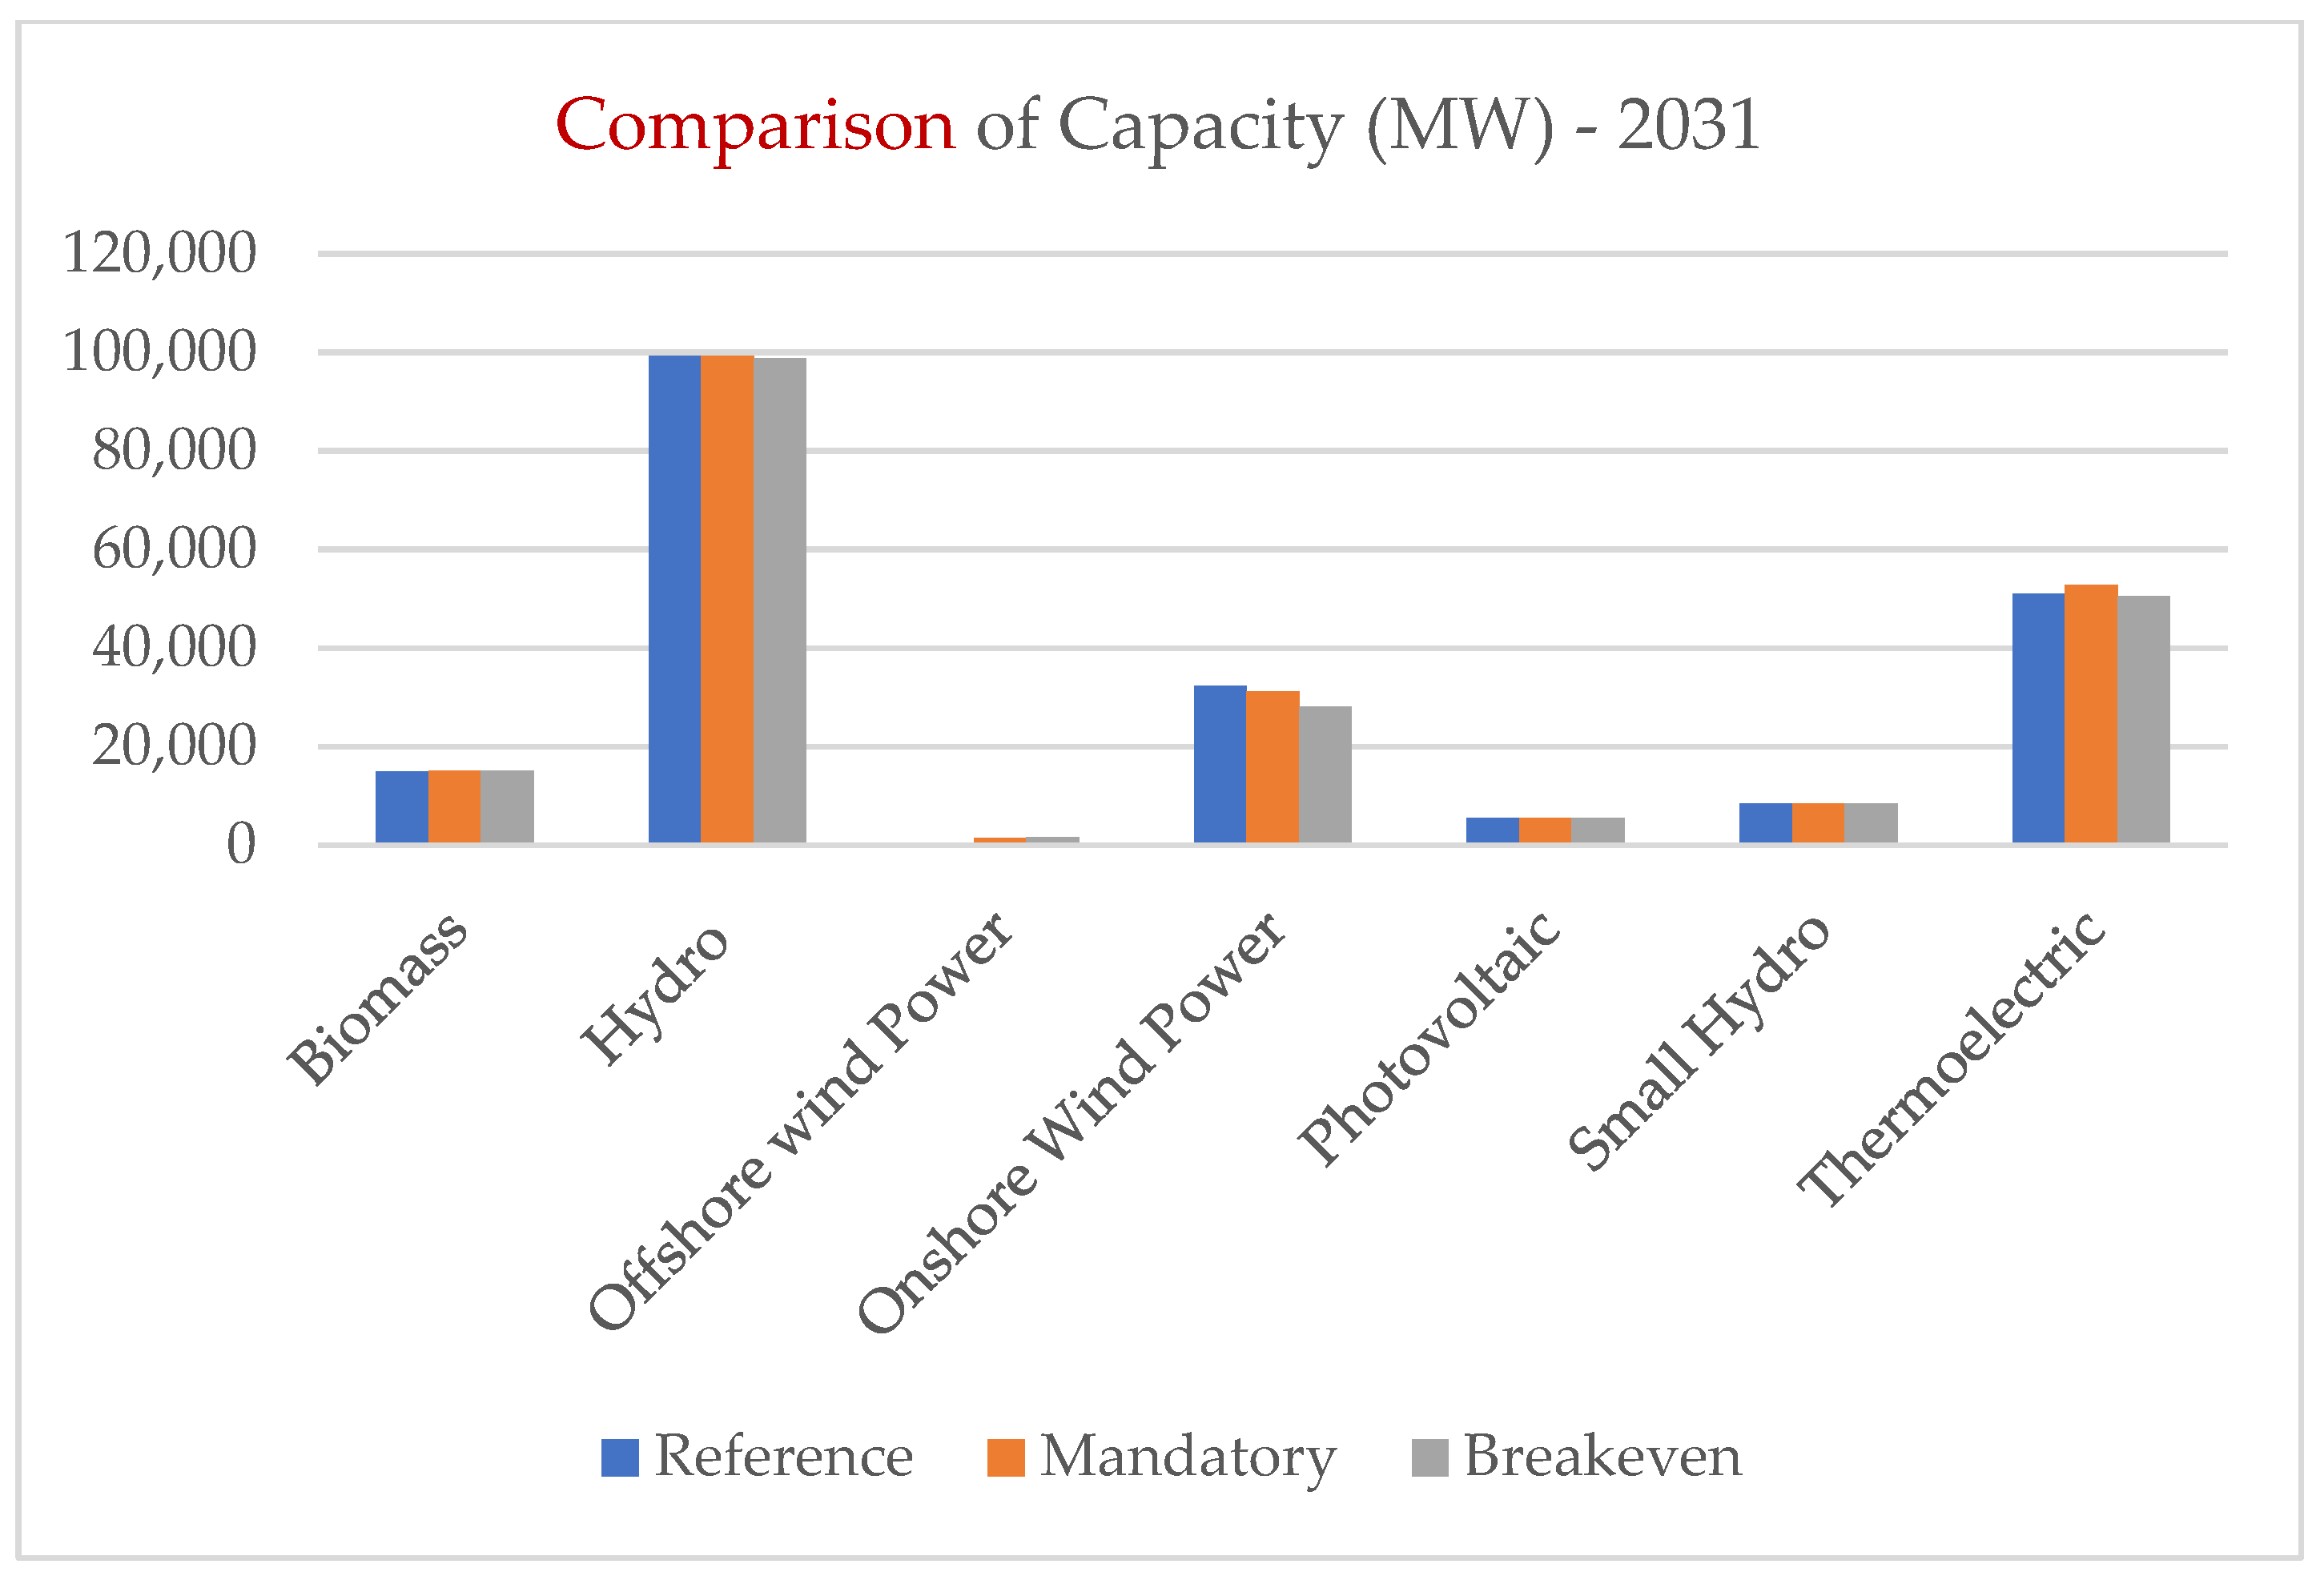
3.3.4. Comparison Between Scenarios

When comparing the scenarios based on the premises outlined in this study, it was evident that the inclusion of offshore wind energy in the Brazilian electricity matrix did not substantially alter the distribution of technologies. The matrix remained predominantly renewable, with variations occurring mainly among variable renewable sources and controllable fossil fuel-based technologies.
By the end of the study horizon, the total installed capacity was nearly identical across all three scenarios at approximately 215 GW, as shown in Table 7 and illustrated in Figure 12.
In terms of costs, only the mandatory scenario showed a slight increase of approximately 5% in energy and investment costs compared to the other scenarios (Table 8).

4. Discussion

Based on the results presented, it can be concluded that while offshore wind energy has higher CAPEX and OPEX than onshore wind energy, it offers a higher capacity factor (CF). This means that, despite its higher costs, it can remain competitive because it generates more energy over its lifetime. In the analyzed scenarios, offshore wind energy can become a viable candidate for electricity generation expansion within the studied horizon if CAPEX is reduced to USD 1500–1550/kW and OPEX is reduced to USD 50–55/kW·year, achievable at sites with a CF above 40%. These cost levels have already been observed in global energy auctions [35,36,37,38] and are plausible for Brazil, given its developed port infrastructure, shallow waters, favorable wind conditions, and absence of severe weather events.
An important observation from the simulations is that the investment decision model tends to slightly displace onshore wind projects, fossil-based thermal plants (e.g., simple cycle gas), small hydroelectric plants, and photovoltaic solar sources. To further refine these estimates, in situ wind measurements should be conducted in areas of interest to validate the secondary data.
Economic barriers such as currency devaluation and the lack of a fully national supply chain present challenges for offshore wind development in Brazil [39]. However, the push for decarbonization to meet COP15 NDC goals, combined with carbon taxation and pricing, could enhance the competitiveness of offshore wind [40,41]. Integration with Brazil’s oil and gas industry offers another potential driver, leveraging existing infrastructure and expertise to accelerate offshore technology deployment [42].
Onshore wind energy continues to expand, even as the best sites have already been developed [1]. However, offshore wind energy requires more significant CAPEX reductions to become viable, especially when compared to the available high-quality onshore resources [29]. It is worth noting the precedent set by onshore wind energy in Brazil, which, despite being initially expensive (USD 80/MWh), benefited from the federal Proinfa program and is now auctioned at around USD 16/MWh [41,43,44].
The simulations indicate that with a 40% reduction in CAPEX compared to the 2031 projections [1], offshore wind energy was selected in the investment decision model for system expansion. This occurred without significantly altering the national generation profile and maintaining the same total system cost as in the reference scenario.
In this context, Law 15.097/2025 provides a regulatory framework that may enhance the competitiveness of offshore wind energy by offering legal certainty, structured procedures for maritime area allocation, and transparent permitting processes. These elements are key to attracting long-term investment and reducing perceived risks in a developing market. Additionally, by incorporating principles of sustainability, local development, and environmental protection, the law aligns with international best practices and supports the strategic and responsible integration of offshore wind into Brazil’s energy landscape. Taken together, these factors—including economies of scale, increased local industrial participation, synergies with the oil and gas sector, and the establishment of a clear regulatory framework, have the potential to significantly improve the economic competitiveness of offshore wind in Brazil.
Furthermore, offshore wind power can contribute to the optimization of the Brazilian power system by allowing hydroelectric reservoirs to be preserved for peak load supply and voltage control, providing essential ancillary services within the National Interconnected System (SIN). By reducing the reliance on hydro generation during off-peak periods, offshore wind enables more strategic and flexible use of reservoir storage [45]. In contrast, for isolated systems or offshore oil platforms, which may also benefit from offshore wind energy, the integration of battery energy storage systems (BESS) may be particularly advantageous to ensure stability, reliability, and localized energy management.
On the other hand, beyond the challenges associated with aging hydro infrastructure, it is also essential to consider the need to modernize the existing grid. As the share of renewables in the energy mix increases, this expansion may require reinforcements in the interconnections between subsystems, as well as the construction of new substations to ensure grid reliability and operational flexibility. In parallel, the incorporation of advanced technologies—such as smart grids and microgrids—can improve system efficiency, enable bidirectional energy flows, and facilitate the large-scale integration of variable renewable energy sources. Although Law No. 14.300/2022 establishes the legal framework for distributed micro and mini generation in Brazil [46], the country still lacks a clear regulatory structure specifically for microgrids, which remains a barrier to their widespread deployment, especially in remote or isolated regions.
Considering these factors, a robust regulatory framework becomes equally important to enable the large-scale deployment of offshore wind energy in Brazil [9]. that ensures legal certainty and reduces investment risks. Brazil’s favorable climatic and geotechnical conditions further support this potential [39]. Synergies with energy transition technologies, such as green hydrogen production, could also drive offshore wind energy development, as growing electricity demand for green hydrogen production would significantly increase the need for renewable energy.

5. Conclusions

Brazil, with its extensive 8000 km coastline, shallow continental shelf, and favorable climatic conditions across much of its waters, has significant untapped potential for electricity generation through offshore wind technology. Despite having excellent wind resources within its exclusive economic zone (EEZ), with capacity factors reaching more than 60%, the economic viability of offshore wind energy remains uncertain in the short term when considering the regulated electricity market and applying CAPEX and OPEX prices based on international references. Achieving viability in 2031, without subsidies would require a 40% reduction in CAPEX and OPEX relative to current reference values.
A major barrier to the development of offshore wind energy in Brazil is the absence of a robust national supply chain and the sector’s heavy reliance on imported components, which makes it vulnerable to exchange rate fluctuations. In addition, the lack of a clear and consistent regulatory framework delays investment decisions, even for projects already in development. Unlike more established energy sources, such as hydroelectric, biomass, and onshore wind, which benefit from well-developed supply chains in Brazil, offshore wind faces challenges despite the availability of port infrastructure that could support its growth.
The demand for offshore wind energy is expected to rise in the medium term, driven by sectors, such as green hydrogen production via electrolysis. This makes the medium-term horizon a strategic opportunity for offshore wind investments. Moreover, offshore and onshore wind technologies are not mutually exclusive and can collectively enhance the diversification and resilience of Brazil’s energy mix. Although the upfront costs of offshore wind are significant, technology can serve as a strategic enabler, fostering industrialization in areas such as the naval industry and heavy equipment manufacturing while contributing to energy diversification.
Initial government incentives can play an essential role to accelerate the adoption of offshore wind technology at competitive prices. This could involve specific energy auctions or marine spatial planning initiatives, such as leasing sessions for offshore areas. These measures will provide a foundation for the development of this sector and support its integration into Brazil’s energy landscape.
Given the growing challenges of building new hydroelectric plants, offshore wind energy represents a viable alternative to ensure the renewability of Brazil’s energy matrix. It can significantly contribute to meeting Brazil’s COP15 emission reduction targets, maintaining affordable energy tariffs, and ensuring a sustainable supply of renewable energy. Furthermore, as the demand for green hydrogen increases, offshore wind can play a crucial role in providing the necessary electricity, even as its cost remains slightly higher in the short term.
Summing up the key findings, offshore wind energy offers a strategic and promising opportunity for Brazil’s energy future—not only as an energy source but also as a catalyst for industrial growth, particularly in supply chain development. To realize its full potential, clear and objective regulations are essential to provide the predictability and stability needed for ongoing projects. This would enable offshore wind energy to establish competitive pricing and ensure its efficient and sustainable integration into Brazil’s national energy matrix.

Author Contributions

Conceptualization, R.V.G.; methodology, R.V.G. and M.S.; software, R.V.G. and S.R.S.; validation, S.R.S.; formal analysis M.S., S.F.E., M.T.T. and A.O.P.J.; investigation, R.V.G. and M.S.; resources, R.V.G.; data curation, R.V.G. and M.S.; writing—original draft preparation, R.V.G.; writing—review and editing, R.V.G., M.S. and A.O.P.J.; visualization, R.V.G.; supervision, R.V.G. and M.S.; project administration, R.V.G. and M.S. All authors have read and agreed to the published version of the manuscript.

Funding

This research received no external funding.

Data Availability Statement

The original contributions presented in the study are included in the article and available at https://www.epe.gov.br/sites-pt/publicacoes-dados-abertos/publicacoes/PublicacoesArquivos/publicacao-423/topico-482/MDI-PDE-2029.zip (accessed on 11 August 2024).

Acknowledgments

The authors gratefully acknowledge the support of the Energy Research Company for providing the data on candidate expansion technologies and the optimization model to conduct these simulations at an academic level. The authors acknowledge the assistance of OpenAI’s ChatGPT (version GPT-4o, released in May 2024) in providing language translation support and refining the English text of this manuscript.

Conflicts of Interest

The authors declare no conflicts of interest.

Abbreviations

AEPAnnual Energy Production
CAPEXCapital Expenditure
CFCapacity Factor
CEPELElectric Power Research Center
DTUTechnical University of Denmark
EEZExclusive Economic Zone
EPEEnergy Research Company
ERA5ECMWF Reanalysis 5th Generation
ECMWFEuropean Centre for Medium-Range Weather Forecasts
GISGeographic Information System
HPHydropower
IBAMABrazilian Institute of Environment and Renewable Natural Resources
IBMInternational Business Machines Corporation
IEAInternational Wind Agency
IDMInvestment Decision Model
LWLeanwind Reference Turbine
NISNational Interconnected System
OPEXOperational Expenditure—Annual Operating Costs
PDE2031Energy Expansion Plan 2031
PVPresent Value
RPRenewable Projects
SEBBrazilian Electric System
SUISHISimulator of Individual Plants in Interconnected Hydrothermal Systems
TPThermoelectric Projects
ZPInterconnection Projects of Transmission

Appendix A

Table A1. Cost of candidate technologies.
Projects
TypeLifetime (Years)Investment (BRL/kW)Charges (BRL/kW·Year)Investment Cost (BRL/kW·Month)Annual O&M (BRL/kW·Year)O&M + Charges (BRL/kW·Month)Total Monthly Cost (BRL/kW·Month)Unit Variable Cost (BRL/MWh)Inflexibility (% of Available Capacity)Inflexibility (% of Installed Capacity)Emissions (tCO₂-eq/MWh)Earliest Start Date (Year)Interest During ConstructionTEIFIP
Hidro30
PV20714.2936.736.0410.204.0810.120.00 20233.9%
PV Discount 202420489.8028.574.148.163.197.330.00 20343.9%
Wind Onshore20979.5938.788.4818.374.9613.450.00 20236.4%
Wind Offshore202500.8277.5518.5461.2212.0530.590.00 202711.6%
Biomass (Sugarcane)20816.3338.787.0718.374.9612.030.000%0%0.0020236.4%2.384.60
NLG Flexible20775.5148.987.0428.576.7413.7868.570%0%0.34202311.6%2.063.26
NLG 50%20775.5148.987.0428.576.7413.7862.6550%47%0.34202311.6%2.063.26
NLG 80%20775.5148.987.0428.576.7413.7858.5780%76%0.34202311.6%2.063.26
NLG Inflexível20775.5148.987.0428.576.7413.7855.51100%95%0.34202311.6%2.063.26
Open-Cycle Natural Gas (OCGT)20551.0242.864.8148.987.9812.7889.590%0%0.3420237.2%2.063.26
Pre-Salt Natural Gas201020.4157.149.2732.657.8017.0739.3950%47%0.34202611.6%2.063.26
Domestic Coal251632.65128.5713.9222.4513.1227.0424.4950%45%1.10202613.9%5.005.00
Small Hydropower Plant—Low CAPEX301020.4136.737.7718.374.7912.560.00 20237.3%
Small Hydropower Plant—Medium CAPEX301530.6146.9411.6618.375.6717.330.00 20237.3%
Small Hydropower Plant—High CAPEX302040.8261.2215.5418.376.9122.460.00 20237.3%
Nuclear303877.55122.4532.8965.3116.3149.207.14 100%0.00203119.5%1.507.50
Pumped Storage Hydropower301224.4910.209.7012.245.5015.200.00 202611.6%
Wood Chips (Biomass)201224.4951.0211.0324.496.5617.5940.82 30% 202410.7%5.005.00
Battery—Lithium-Ion (3 h)201224.4951.0210.3612.245.5015.850.00 20243.9%
Biogas201530.6161.2213.26102.0414.1827.440.000%0%0.3420236.4%1.402.50
Fim de Contrato GN20310.2042.862.7148.987.9810.6861.220%0%0.3420207.2%10.686.50
Fim de Contrato Carvão20653.0681.635.7048.9811.3417.0461.220%0%0.3420207.2%10.686.50

References

  1. Empresa de Pesquisa Energética. Plano Decenal de Expansão de Energia 2031; Empresa de Pesquisa Energética: Rio de Janeiro, Brazil, 2023. [Google Scholar]
  2. IBAMA. Maps of Projects Under Licensing—Offshore Wind Complexes. Available online: https://www.gov.br/ibama/pt-br/assuntos/laf/consultas/mapas-de-projetos-em-licenciamento-complexos-eolicos-offshore (accessed on 18 August 2024).
  3. Brazil. Law No. 15,097, of January 10, 2025. Regulates the Utilization of Energy Resources Within the Union’s Maritime Space. Official Gazette of the Union, Brasília. 2025. Available online: https://www.planalto.gov.br/ccivil_03/_Ato2023-2026/2025/Lei/L15097.htm (accessed on 29 January 2025).
  4. Empresa de Pesquisa Energética. Offshore Wind Power Generation: Considerations on the Limitation of the Area to be Granted. EPE-DEE-036-2023-RO; Empresa de Pesquisa Energética: Rio de Janeiro, Brazil, 2023. [Google Scholar]
  5. Brasil. Decreto no. 10.946, de 25 de Janeiro de 2022. Dispõe Sobre a Cessão de Uso de Espaços Físicos e o Aproveitamento de Recursos Naturais para Geração de Energia Elétrica a Partir de Empreendimentos Offshore. Diário Oficial da União. 2022. Available online: https://www.in.gov.br/en/web/dou/-/decreto-n-10.946-de-25-de-janeiro-de-2022377912884 (accessed on 2 November 2024).
  6. Empresa de Pesquisa Energética. Geração Eólica Offshore Considerações Sobre o Valor Devido à União Pela Cessão de Área-EPE-DEE-035-2023-RO; Empresa de Pesquisa Energética: Rio de Janeiro, Brazil, 2023. [Google Scholar]
  7. Brasil. Portaria Interministerial nº 3/GM/MME-MMA, de 14 de Setembro de 2022. Estabelece Procedimentos e Critérios para o Licenciamento Ambiental de Empreendimentos de Energia Eólica Offshore. Diário Oficial da União. 2022. Available online: https://www.gov.br/mme/pt-br/acesso-a-informacao/legislacao/portarias-interministeriais/portaria-interministerial-mme-mma-n-3-2022.pdf (accessed on 11 August 2024).
  8. Brasil. Portaria Interministerial nº 52/GM/MME-MMA, de 14 de outubro de 2022. Dispõe sobre diretrizes e critérios para a seleção e acompanhamento de projetos de energia eólica offshore. Diário Oficial da União. 2022. Available online: https://www.gov.br/mme/pt-br/acesso-a-informacao/legislacao/portarias/2022/portaria-normativa-n-52-gm-mme-2022.pdf (accessed on 11 August 2024).
  9. Aguirre González, M.O.; Santiso, A.M.; de Melo, D.C.; de Vasconcelos, R.M. Regulation for offshore wind power development in Brazil. Energy Policy 2020, 145, 111756. [Google Scholar] [CrossRef]
  10. Borba, P.C.S.; Sousa, W.C.; Shadman, M.; Pfenninger, S. Enhancing drought resilience and energy security through complementing hydro by offshore wind power—The case of Brazil. Energy Convers. Manag. 2023, 277, 116616. [Google Scholar] [CrossRef]
  11. Operador Nacional do Sistema Elétrico (ONS). Nota Técnica EPE-DEA-SEE-007/2024: Previsão de Carga para o Planejamento Anual da Operação Energética do Sistema Interligado Nacional (2024-2028)—2ª Revisão Quadrimestral; Operador Nacional do Sistema Elétrico (ONS): Rio de Janeiro, Brazil, 2024; Available online: https://tinyurl.com/3rr8xduh (accessed on 3 November 2024).
  12. Sun, Y.; Li, Y.; Wang, R.; Ma, R. Assessing the national synergy potential of onshore and offshore renewable energy from the perspective of resources dynamic and complementarity. Energy 2023, 279, 128106. [Google Scholar] [CrossRef]
  13. Bekirsky, N.; Hoicka, C.E.; Brisbois, M.C.; Ramirez Camargo, L. Many actors amongst multiple renewables: A systematic review of actor involvement in complementarity of renewable energy sources. Renew. Sustain. Energy Rev. 2022, 161, 112368. [Google Scholar] [CrossRef]
  14. Huang, K.; Luo, P.; Liu, P.; Kim, J.S.; Wang, Y.; Xu, W.; Li, H.; Gong, Y. Improving complementarity of a hybrid renewable energy system to meet load demand by using hydropower regulation ability. Energy 2022, 248, 123535. [Google Scholar] [CrossRef]
  15. Gandelman, D.A. Uma Metodologia para o Planejamento da Expansão do Sistema Elétrico Brasileiro Considerando Incertezas [Tese de Doutorado]; UFRJ/COPPE: Rio de Janeiro, Brazil, 2015. [Google Scholar]
  16. Centro de Pesquisas de Energia Elétrica (CEPEL). Modelo SUISHI: Simulação de Usinas Hidrelétricas em Sistemas Interligados. Available online: https://www.cepel.br (accessed on 1 February 2020).
  17. Empresa de Pesquisa Energética. Nota Técnica EPE-DEE-RE-055/2018-r1; Empresa de Pesquisa Energética: Rio de Janeiro, Brazil, 2018. [Google Scholar]
  18. Olauson, J. ERA5: The new champion of wind power modelling? Renew. Energy 2018, 126, 322–331. [Google Scholar] [CrossRef]
  19. European Centre for Medium-Range Weather Forecasts. ERA5: Fifth Generation of ECMWF Atmospheric Reanalyzes of the Global Climate; ECMWF: Reading, UK, 2017; Available online: https://www.ecmwf.int/en/forecasts/datasets/reanalysis-datasets/era5 (accessed on 2 November 2024).
  20. Tavares, L.F.A.; Shadman, M.; de Freitas Assad, L.P.; Silva, C.; Landau, L.; Estefen, S.F. Assessment of the offshore wind technical potential for the Brazilian Southeast and South regions. Energy 2020, 196, 117097. [Google Scholar] [CrossRef]
  21. Tavares, L.F.A.; Shadman, M.; de Freitas Assad, L.P.; Estefen, S.F. Influence of the WRF model and atmospheric reanalysis on the offshore wind resource potential and cost estimation: A case study for Rio de Janeiro State. Energy 2022, 240, 122767. [Google Scholar] [CrossRef]
  22. Santos, F.S.; do Nascimento, K.K.F.; Jale, J.S.; Xavier, S.F.A.; Ferreira, T.A.E. Brazilian wind energy generation potential using mixtures of Weibull distributions. Renew. Sustain. Energy Rev. 2024, 189, 113990. [Google Scholar] [CrossRef]
  23. Yadav, A.K.; Malik, H.; Yadav, V.; Alotaibi, M.A.; García Márquez, F.P.; Afthanorhana, A. Comparative analysis of Weibull parameters estimation for wind power potential assessments. Results Eng. 2024, 23, 102300. [Google Scholar] [CrossRef]
  24. Majid, A.A. Accurate and efficient forecasted wind energy using selected temporal metrological variables and wind direction. Energy Convers. Manag. X 2022, 16, 100286. [Google Scholar] [CrossRef]
  25. Tuchtenhagen, P.; de Carvalho, G.G.; Martins, G.; da Silva, P.E.; de Oliveira, C.P.; Andrade, L.M.B.; de Araújo, J.M.; Mutti, P.R.; Lucio, P.S.; Santos e Silva, C.M. WRF model assessment for wind intensity and power density simulation in the southern coast of Brazil. Energy 2020, 190, 116341. [Google Scholar] [CrossRef]
  26. National Renewable Energy Laboratory. Leanwind 8MW 164 RWT. NREL Turbine Models. 2021. Available online: https://nrel.github.io/turbine-models/LEANWIND_8MW_164_RWT.html (accessed on 2 November 2024).
  27. Technical University of Denmark. DTU 10-MW Reference Wind Turbine. DTU Wind Energy. 2021. Available online: https://gitlab.windenergy.dtu.dk/rwts/dtu-10mw-rwt (accessed on 2 November 2024).
  28. International Energy Agency. IEA 15-MW Offshore Reference Wind Turbine. IEA Wind. 2021. Available online: https://www.nrel.gov/docs/fy20osti/75698.pdf (accessed on 2 November 2024).
  29. GWEC. Global Offshore Wind Report 2024; Global Wind Energy Council: Lisbon, Portugal, 2024. [Google Scholar]
  30. IEA. IEA Wind TCP Task 26—Offshore Wind International Comparative Analysis; International Energy Agency: Paris, France, 2018. [Google Scholar]
  31. Shadman, M.; Silva, C.; Faller, D.; Wu, Z.; de Freitas Assad, L.P.; Landau, L.; Levi, C.; Estefen, S.F. Ocean Renewable Energy Potential, Technology, and Deployments: A Case Study of Brazil. Energies 2019, 12, 3658. [Google Scholar] [CrossRef]
  32. Vinhoza, A.; Lucena, A.F.P.; Rochedo, P.R.R.; Schaeffer, R. Brazil’s offshore wind cost potential and supply curve. Sustain. Energy Technol. Assess. 2023, 57, 103151. [Google Scholar] [CrossRef]
  33. ESMAP. Scenarios for Offshore Wind Development in Brazil. Offshore Wind Development Program; World Bank: Washington, DC, USA, 2024; Available online: https://documents.worldbank.org (accessed on 18 August 2024).
  34. Li, Z.; Tian, G.; El-Shafay, A.S. Statistical-analytical study on world development trend in offshore wind energy production capacity focusing on Great Britain with the aim of MCDA based offshore wind farm siting. J. Clean. Prod. 2022, 363, 132326. [Google Scholar] [CrossRef]
  35. Malleret, S.; Jansen, M.; Laido, A.S.; Kitzing, L. Profitability dynamics of offshore wind from auction to investment decision. Renew. Sustain. Energy Rev. 2024, 199, 114450. [Google Scholar] [CrossRef]
  36. Jansen, M.; Beiter, P.; Riepin, I.; Müsgens, F.; Guajardo-Fajardo, V.J.; Staffell, I.; Bulder, B.; Kitzing, L. Policy choices and outcomes for offshore wind auctions globally. Energy Policy 2022, 167, 113000. [Google Scholar] [CrossRef]
  37. Kell, N.P.; van der Weijde, A.H.; Li, L.; Santibanez-Borda, E.; Pillai, A.C. Simulating offshore wind contract for difference auctions to prepare bid strategies. Appl. Energy 2023, 334, 120645. [Google Scholar] [CrossRef]
  38. Pereira, A.O., Jr.; da Costa, R.C.; do Vale Costa, C.; de Moraes Marreco, J.; La Rovere, E.L. Perspectives for the expansion of new renewable energy sources in Brazil. Renew. Sustain. Energy Rev. 2013, 23, 49–59. [Google Scholar] [CrossRef]
  39. de Almeida, D.; Viana, D.; Simas, M.; dos Santos, S. Sinergia dos setores de petróleo e eólico offshore para desenvolvimento e descarbonização da economia azul no Brasil. Rev. Esc. Guerra Naval 2021, 27, 753–782. [Google Scholar] [CrossRef]
  40. Pashakolaie, V.G.; Cotton, M.; Jansen, M. The co-benefits of offshore wind under the UK Renewable Obligation scheme: Integrating sustainability in energy policy evaluation. Energy Policy 2024, 192, 114259. [Google Scholar] [CrossRef]
  41. Nolan, T. Is pivoting offshore the right policy for achieving decarbonization in the state of Victoria, Australia’s electricity sector? Energy Policy 2024, 190, 114136. [Google Scholar] [CrossRef]
  42. Shadman, M.; Amiri, M.M.; Silva, C.; Estefen, S.F.; La Rovere, E. Environmental impacts of offshore wind installation, operation and maintenance, and decommissioning activities: A case study of Brazil. Renew. Sustain. Energy Rev. 2021, 144, 110994. [Google Scholar]
  43. Dutra, R.M.; Szklo, A.S. Incentive policies for promoting wind power production in Brazil: Scenarios for the Alternative Energy Sources Incentive Program (PROINFA) under the New Brazilian electric power sector regulation. Renew. Energy 2008, 33, 65–76. [Google Scholar] [CrossRef]
  44. Nunes, A.M.M.; Santos Júnior, E.P.; de Araújo, J.M.; Melo, A.K.A.; Rolim, M.J.C.P.; Simioni, F.J.; Carvalho, M.; Coelho Junior, L.M. Impact assessment of public policies in the municipalities covered by the Brazilian Incentive program for alternative electricity sources (PROINFA). Renew. Energy 2024, 235, 121342. [Google Scholar] [CrossRef]
  45. Nogueira, E.C.; Morais, R.C.; Pereira, A.O., Jr. Offshore Wind Power Potential in Brazil: Complementarity and Synergies. Energies 2023, 16, 5912. [Google Scholar] [CrossRef]
  46. Brazil. Law No. 14.300 of January 6, 2022. Establishes the Legal Framework for Distributed Micro- and Mini-Generation. Available online: https://www.planalto.gov.br/ccivil_03/_ato2019-2022/2022/lei/L14300.htm (accessed on 6 April 2025).
Figure 1. Existing and planned national interconnected system (SIN).
Energies 18 02198 g001
Figure 2. Representation of hydropower generation at four load levels.
Energies 18 02198 g002
Figure 3. Study area.
Energies 18 02198 g003
Figure 4. Workflow of this study.
Energies 18 02198 g004
Figure 5. Power curve of each turbine.
Energies 18 02198 g005
Figure 6. Flowchart of the expansion model.
Energies 18 02198 g006
Figure 7. Average annual speed, interpolated from ERA5 with the selected points.
Energies 18 02198 g007
Figure 8. Monthly average CF by regions: (a) North; (b) Northeast, (c) Southeast; (d) South.
Energies 18 02198 g008
Figure 9. Accumulated reference expansion.
Energies 18 02198 g009
Figure 10. Accumulated reference expansion.
Energies 18 02198 g010
Figure 11. Accumulated reference expansion.
Energies 18 02198 g011
Figure 12. Accumulated reference expansion.
Energies 18 02198 g012
Table 1. Technical restrictions.
ParametersConsiderations
Annual average wind velocity > 7 m / s
Water depth < 50 m
Distance to the port < 50 k m
Onshore substation terminal accessibility<50 km
Marine protected areasExcluded
Distance to the shore > 18 k m
Table 2. Depth and distance from ports of selected points.
RegionMARNRJRS
Water depth (m)20202020
Distance to shore (km)48292818
Table 3. AEP (average energy produced) and annual average CF (capacity factor) of the turbines for the selected locals.
Wind TurbineRegionCF [%]AEP [GWh/yr]
LW 8-MWMA3726
RN4330
RJ3524.5
RS39.527.7
DTU 10-MWMA4741
RN5447.7
RJ4236.7
RS46.440.7
IEA 15-MWMA5571.7
RN6382.3
RJ4862.8
RS5268.4
Table 4. System expansion summary—reference.
System Expansion Summary—Installed Generation Capacity (MW)
Technology2025202620272028202920302031Total
Biomass13,335929292929292552
Hydro97,630547854121413812779075179
Offshore wind00000000
Onshore wind14,96823752375237523752375300014,875
Photovoltaic207273173173173173120005657
Small hydro63093003003003003003001200
Thermoelectric22,32752826134511946004700479330,628
Table 5. System expansion summary—mandatory.
System Expansion Summary—Installed Generation Capacity (MW)
Technology2025202620272028202920302031Total
Biomass 13,335929292929292552
Hydro97,630547854121413812779075179
Offshore wind 05005005005005005003000
Onshore Wind14,9680399278628153000297611,976
Photovoltaic207283783783783783720246208
Small Hydro63093003003003003003001800
Thermoelectric22,32752826975485046004700415030,557
Table 6. System expansion summary—breakeven point.
System Expansion Summary—Installed Generation Capacity (MW)
Technology2025202620272028202920302031Total
Biomass13,335929292929292552
Hydro97,630547854121413812779075179
Offshore wind0000005757
Onshore wind14,96802540300030003000300014,540
Photovoltaic207294894894894894820006738
Small Hydro63090077300300300977
Thermoelectric22,32760206045485046004700415030,365
Table 7. Comparison between scenarios.
Capacity (MW)—Electric Matrix at End of Period—2031
TechnologyReferenceMandatoryBreakeven
Biomass13,88713,88713,887
Hydro102,809102,809102,809
Offshore wind0300057
Onshore wind29,84326,94429,508
Photovoltaic772982808810
Small Hydro810981097286
Thermoelectric52,95552,88452,692
Total215,332215,914215,049
Table 8. Costs of the cases.
ScenarioTotal cost USD (MM)
Reference scenario84.174
Mandatory89.102
Breakeven point84.204
Disclaimer/Publisher’s Note: The statements, opinions and data contained in all publications are solely those of the individual author(s) and contributor(s) and not of MDPI and/or the editor(s). MDPI and/or the editor(s) disclaim responsibility for any injury to people or property resulting from any ideas, methods, instructions or products referred to in the content.

