1. Introduction
The energy sector is of pivotal significance in the global climate crisis, as it is one of the chief contributors to global GHG emissions [
1,
2] (
Table 1). The International Energy Agency (IEA) reports that approximately three-quarters of global GHG emissions stem from energy production and use, thereby positioning the energy transition as a pivotal mechanism for mitigating the most severe consequences of climate change [
3,
4].
Consequently, international mitigation strategies have placed significant emphasis on the establishment of ambitious targets, including a reduction in emissions of approximately −43% by the year 2030 in comparison to 2019 levels, and the achievement of climate neutrality by the middle of the century [
5]. In this context, the decarbonization of the energy sector is no longer merely a desirable goal but an essential requirement. The Paris Agreement and the assessments of the Intergovernmental Panel on Climate Change (IPCC) both explicitly emphasize the need to phase out fossil fuels in favour of renewable energy sources in the coming decades [
6].
At the same time, the integration of Environmental, Social, and Governance (ESG) criteria into corporate strategies and public decision-making processes has become increasingly important. ESG criteria represent sustainability standards that go beyond traditional financial indicators, offering a more holistic view of corporate performance. Their influence on corporate behaviour, investment decisions, and public policy has grown rapidly in recent years [
7]. For example, the volume of sustainable investments globally exceeded
$35 trillion in 2024, representing approximately 36% of total assets under management and more than doubling since 2016 [
8]. This trend reflects investors’ growing interest in companies with strong ESG performance, partly because existing studies suggest a positive association between ESG performance, risk mitigation, and long-term financial results [
8]. Financial markets have responded accordingly: around 80% of the world’s largest companies now publish sustainability or ESG reports [
9], indicating that non-financial reporting has become an established practice. Regulators have also strengthened their role in this process. In particular, the European Union (EU) has adopted Regulation (EU) 2020/852 on the taxonomy of sustainable activities and Directive (EU) 2022/2464, the Corporate Sustainability Reporting Directive (CSRD), introducing more stringent ESG disclosure requirements for companies and investors [
10]. These regulatory initiatives aim to channel capital flows and corporate strategies toward sustainability objectives, illustrating how ESG considerations are increasingly embedded in policy frameworks guiding the ecological transition of the economy [
11].
In this evolving context, a comparison of companies with different levels of ESG maturity can provide valuable insights into how sustainability criteria influence energy transition strategies [
11]. Analyses based on case studies of energy companies adopting different ESG approaches allow for the identification of best practices, persistent challenges, and differentiated decarbonization pathways. Ørsted and Enel are two notable illustrations of this heterogeneity. Ørsted, a Danish multinational energy company historically focused on fossil fuels, has undergone a radical transformation towards renewable energy in just over a decade [
1]. Ørsted is currently recognized as a global leader in ESG. In 2020, it was ranked as the world’s most sustainable company by the Corporate Knights Global 100 Index, reflecting the growing share of revenue from renewables and a dramatic reduction (over 80%) in CO
2 emissions compared to 2006 levels [
6,
7,
8,
9,
10,
11,
12]. This transformation is indicative of a corporate strategy in which decarbonization goals and economic performance have progressed in parallel, suggesting that a green energy-focused business model can be compatible with both shareholder value creation and climate mitigation goals. Conversely, Enel, one of the main Italian leaders in the energy sector, exemplifies the profile of a substantial incumbent utility entity that is currently undergoing a transition towards sustainability. Historically based on a conventional energy mix, Enel has pursued a structured energy transition strategy in recent years, committing significant investments in renewable capacity, exceeding 3 GW of new green capacity in 2019 alone, and implementing programmes aimed at decarbonizing its activities [
13]. These efforts have contributed to a marked enhancement in ESG performance, as evidenced by the company’s integration into prominent sustainability ratings and indices. Specifically, Enel has attained the highest “AAA” rating from MSCI ESG and is consistently included in the Dow Jones Sustainability Index and the FTSE4Good Index [
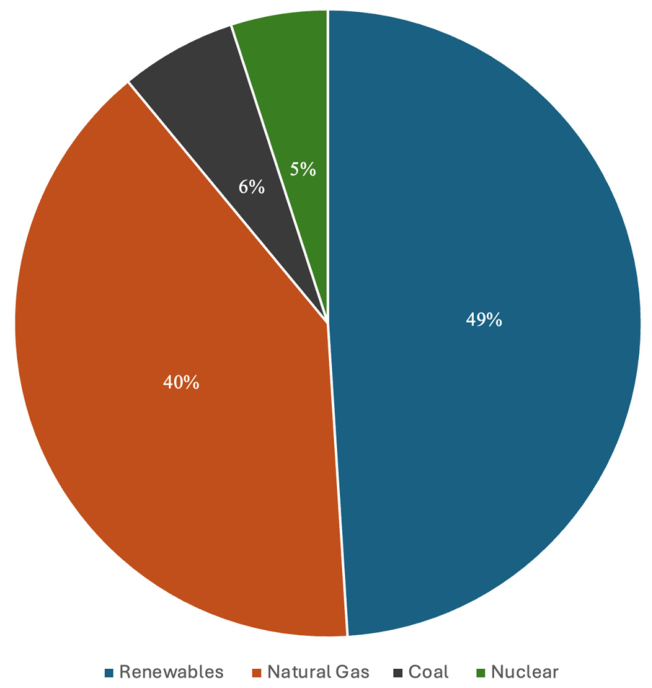
13]. Nevertheless, the company continues to operate a residual share of thermoelectric generation, thereby highlighting the structural challenges faced by large diversified utilities in converting established infrastructure and inherited business models. As demonstrated in
Figure 1, the current composition of Enel’s energy portfolio is illustrated.
Recent strategic commitments, such as the complete elimination of coal-fired power plants by 2027 and the electricity generation entirely powered by renewable sources [
13], have served to further clarify the direction of Enel’s transition. These targets have been validated by the Science Based Targets initiative, thus aligning Enel’s trajectory with the 1.5 °C global warming mitigation scenario. This underscores the growing influence of ESG standards in shaping the long-term strategic orientation of utilities in transition.
The integration of ESG criteria into energy transition strategies has the potential to redefine the priorities and operating models of the entire energy sector. The climate emergency necessitates an expeditious transition to low-emission energy systems. ESG standards offer a structured framework to facilitate this transformation, encompassing not only environmental impacts but also social and governance dimensions. A comparison between companies such as Ørsted, a leader in sustainability, and Enel, which is undergoing a complex restructuring process, highlights how high ESG maturity can facilitate and potentially accelerate the energy transition, while transition paths continue to require innovation, investment, and regulatory adjustments.
The comparative analysis introduced in this section provides a foundation for examining the influence of ESG criteria on strategic decision-making processes, regulatory alignment, and investment choices that shape the future of the energy transition.
In this context, the present paper makes three principal contributions to the extant literature on ESG and energy transition. Firstly, a comparative, intensity-based ESG assessment framework is developed, based on internationally recognized reporting standards. This ensures transparency and replicability. Secondly, it operationalizes ESG performance through the use of normalized and comparable indicators, thereby enabling structured comparisons between companies at varying stages of the transition. Thirdly, it extends conventional static ESG benchmarking by incorporating scenario-based analysis, which allows for a dynamic interpretation of ESG convergence trajectories in the energy sector. In a broader sense, the study advances existing ESG assessment approaches by systematically integrating intensity-based indicators, multiple ESG reporting frameworks (GRI, SASB, and CSRD), and a forward-looking, scenario-oriented perspective. Whilst earlier studies have predominantly concentrated on static ESG scores, individual reporting standards, or cross-sectional comparisons, this study explicitly links ESG performance to dynamic decarbonization trajectories, thereby enabling the assessment of convergence paths over time. The study proposes a scale-neutral and replicable framework, applicable across sectors, which functions as an operational analytical tool for examining the association between ESG maturity and differentiated energy transition pathways. This, in turn, serves to expand the analytical scope of research on ESG and energy transition.
2. ESG Frameworks and Reference Standards
The energy transition is increasingly requiring the systematic integration of ESG criteria into corporate strategies, decision-making processes, and reporting practices [
14]. It is therefore necessary to have a shared and consistent analytical language to measure, compare, and verify companies’ commitments and results in relation to climate performance, human capital, and governance structures. In this context, four main frameworks have emerged, which, when used in a complementary manner, provide a solid theoretical and operational basis. Firstly, the Global Reporting Initiative (GRI) was conceived as a multi-stakeholder disclosure architecture based on the principle of double materiality [
15,
16]. Secondly, the Sustainability Accounting Standards Board and the International Sustainability Standards Board (SASB/ISSB), which define sector-specific metrics geared towards financial materiality and comparability for investors [
17]. Thirdly, the Corporate Sustainability Reporting Directive and the European Sustainability Reporting Standards (CSRD/ESRS), which represent the European regulatory framework aimed at making sustainability reporting mandatory, standardized, and subject to review [
18,
19]. And finally, the EU Taxonomy, which operates as a legal system for classifying economically sustainable activities from an environmental point of view, explicitly linking disclosure requirements to capital allocation decisions [
19,
20]. In the ensuing subsections, each framework is addressed in a consistent and explanatory manner, thus avoiding excessive fragmentation with a view to preserving both readability and narrative continuity.
2.1. Global Reporting Initiative (GRI)
The GRI was developed as a voluntary international standard to support organizations in fully communicating their economic, environmental, and social impacts, explicitly adopting the principle of double materiality: relevance for the creation of business value and relevance in terms of impacts on the environment and society [
21]. The program’s modular structure, comprising universal, thematic, and sector-specific standards, facilitates comprehensive coverage of both cross-cutting issues and the particularities of individual sectors. This is of particular pertinence to high-impact sectors such as energy and oil and gas, for which detailed indicators on GHG emissions, biodiversity, occupational health and safety, and transition planning are provided [
22].
The primary strength of the GRI framework is its comprehensive scope and international legitimacy. It facilitates comprehensive reporting with the aim of satisfying multiple stakeholders, including investors, employees, local communities, non-governmental organizations, and regulators. This approach fosters a culture of transparency that extends beyond conventional financial performance indicators [
23]. Concurrently, the voluntary nature of the initiative, coupled with its considerable flexibility, has the potential to engender disparate reporting scopes, metrics, and levels of detail, thereby impeding the comparability of results across companies [
23]. However, from the perspective of utilities and energy operators, the GRI remains particularly well-suited to capturing the overall transformation of the business model. This includes not only changes in the generation mix and emission trajectories, but also the evolution of stakeholder relations, worker and supplier safety, governance structures, and remuneration policies linked to ESG objectives [
24].
2.2. Sustainability Accounting Standards Board (SASB)/International Sustainability Standards Board (ISSB)
The SASB standards, now incorporated into the ISSB framework [
25], translate sustainability issues into financially relevant, sector-specific metrics [
25]. The underlying logic of this approach is to identify, for each industry sector, the ESG factors most likely to affect financial performance, risk exposure, and enterprise value. In order to facilitate consistent peer comparison, standardized indicators are defined [
26]. In the energy sector, this approach focuses on metrics such as carbon intensity per kilowatt hour, grid reliability and resilience, asset-level water and emissions management, accidents and spills, workforce safety, and climate risk governance [
27].
The primary strength of the SASB/ISSB framework is its emphasis on investor interests and its focus on intra-sector comparability, facilitating its integration with financial reporting and enabling analysts and capital market operators to directly utilize ESG information. Convergence towards ISSB standards further strengthens its relevance and international legitimacy [
17]. However, an exclusive focus on financial materiality may result in the underrepresentation of impacts of broader social relevance, unless these translate into material financial risks in the short or medium term [
17,
25,
28]. For publicly traded energy companies, the SASB/ISSB is therefore a pivotal instrument for demonstrating preparedness for transition in quantifiable and comparable terms, integrating the more extensive, stakeholder-oriented perspective offered by the GRI.
2.3. Corporate Sustainability Reporting Directive (CSRD)
The CSRD signifies a paradigm shift from voluntary to mandatory sustainability reporting within the EU. The inclusion of sustainability information in the management report is imperative, and this information must be subject to external audit and published in a digital and machine-readable format to enable automated analysis [
29,
30]. The directive delineates both general and thematic disclosure requirements, with these requirements being subject to progressive supplementation by sectoral standards. The primary strength of the approach is rooted in the integration of mandatory application, standardised metrics, and formalised assessment of double materiality. Collectively, these elements enhance comparability, data reliability, and regulatory consistency across diverse corporate and sectoral contexts. For companies, the implementation of CSRD translates into more rigorous reporting of transition plans, targets, year-on-year progress, board oversight mechanisms, and risk management practices across the value chain, including Scope 3 emissions [
31]. However, challenges persist regarding the complexity of implementation, information system requirements, and interoperability with ISSB standards for multinational groups. These challenges can generate transitional burdens and interpretative uncertainties [
32]. For utilities and oil and gas operators, the CSRD is increasingly operating as a kind of “license to operate”: it renders visible the generation mix, alignment with climate pathways, network resilience measures, and the social implications of the transition, thus embedding sustainability considerations at the heart of corporate governance and strategic planning.
2.4. EU Taxonomy for Sustainable Activities
The EU Taxonomy is a regulatory classification system that establishes, through detailed technical screening criteria, when an economic activity can be considered environmentally sustainable. This is in contrast to reporting standards. To be considered, an activity must demonstrate a substantial contribution to one or more environmental objectives, whilst simultaneously ensuring that no significant harm is inflicted upon others. Furthermore, adherence to minimum social safeguards is mandatory [
33]. In the energy sector, this involves an objective distinction between generation from renewable sources and other low-emission technologies, the definition of conditions for transitional activities, and the obligation to report revenue shares, capital expenditure (CAPEX), and operating expenditure (OPEX) aligned with the taxonomy [
20,
34].
The primary contribution of the EU Taxonomy is the clarity it provides to investors and financial institutions, thereby reducing the risk of greenwashing and directing capital flows towards activities that are consistent with the European Green Deal. Simultaneously, the present limitations of the system are evident in two respects. Firstly, the present focus is exclusively on environmental dimensions. Secondly, the technical complexity of the criteria is such that further development is required. Thirdly, the ongoing political debate on certain classifications, such as the inclusion of gas and nuclear energy as transitional activities, requires periodic updates and interpretative guidelines [
20,
35]. However, for energy companies, the Taxonomy has already emerged as a strategic driver, exerting a direct influence on investment and divestment decisions, determining access to sustainable finance, and necessitating quantitative evidence of portfolio alignment with transition objectives [
10,
36].
In summary, the four frameworks respond to complementary analytical and regulatory needs. The GRI offers a holistic, stakeholder-oriented perspective on corporate impacts, the SASB/ISSB introduces financial rigour and sector comparability, the CSRD makes ESG disclosure mandatory, standardised, and subject to review in the European context, and the EU Taxonomy directly links sustainability reporting to the classification of sustainable investments. When employed in combination, these frameworks constitute the theoretical and methodological foundations of this study. The selection of materially relevant indicators is supported, ensuring comparability between the cases analysed and framing the empirical results within current regulatory requirements and market expectations. This, in turn, serves to strengthen the robustness and replicability of comparative ESG analysis in the energy sector.
Increasingly important, however, is the translation of these frameworks into observable business results and strategic differentiation. It is suggested by contributions such as those of Kotsantonis and Serafeim (2019) [
37] and Capelle-Blancard and Petit (2019) [
38] that the quality of ESG disclosure and its integration into governance structures are positively associated with long-term value creation and risk mitigation. In a similar vein, Yang et al. [
39] have demonstrated that the integration of GRI- and SASB-based metrics can enhance the comparability between heterogeneous companies, while concurrently facilitating dynamic analyses of decarbonization and inclusion trajectories. It is evident that, in consideration of the contributions aforementioned, the present study adopts a comparative ESG assessment approach. This approach operationalizes the principles incorporated in GRI, SASB/ISSB, CSRD, and EU Taxonomy in the specific context of the energy transition. The principal ESG reporting frameworks under consideration are summarized in
Table 2.
3. Methodology
3.1. Comparative Approach and Case Study Selection
Although the two selected firms, Ørsted and Enel, operate within similar domains of power generation and energy services, they differ substantially in terms of organizational structure, geographic scope, and stage of transition. Ørsted represents a highly specialized business model centered on renewable energy, whereas Enel reflects the profile of a large, diversified incumbent undergoing a progressive decarbonization process [
11,
12,
40,
41,
42]. To ensure comparability despite these structural differences, the analysis relies on relative and intensity-based indicators rather than absolute values. This methodological choice mitigates scale effects and captures directional progress, allowing ESG performance to be interpreted independently of firm size [
43,
44].
Beyond national or geographic specificities, the rationale for selecting these cases lies in their representation of two archetypal transition pathways within the energy industry. Ørsted exemplifies a “post-transition” model, characterized by early strategic repositioning, a concentrated renewable asset base, and high ESG maturity [
45,
46,
47]. Enel, by contrast, represents an “incumbent-in-transition,” illustrating how large, diversified utilities navigate legacy constraints while accelerating toward sustainability objectives. This contrast operationalizes a theoretical spectrum of corporate transition archetypes, from pioneers to incumbents, commonly discussed in the sustainability and innovation literature [
48,
49]. The selection of these two cases was guided by four explicit criteria: (i) large asset base and operational scale, ensuring that the companies are sufficiently representative of major utility archetypes rather than niche or regional operators [
50]; (ii) publicly listed status and availability of complete, audited ESG disclosures for at least three consecutive years (2021–2023), guaranteeing data reliability and comparability [
51]; (iii) contrasting ESG maturity profiles, so that the comparison captures both a best-practice benchmark and a credible transitional trajectory [
52]; and (iv) strategic relevance to the European energy transition context, given the regulatory salience of the EU Taxonomy and CSRD frameworks [
53]. Alternative candidates such as Iberdrola (Spain), EDP (Portugal), and NextEra Energy (United States) were considered during the scoping phase. Iberdrola and EDP, whilst comparable in ESG maturity and European context, present transition profiles that are broadly similar to Ørsted’s, thereby reducing the analytical contrast that motivates the comparative design. NextEra, although a global renewable leader, operates within a markedly different regulatory and institutional environment (US market), which would have introduced confounding factors related to jurisdictional context rather than organizational transition strategy. The Ørsted–Enel pairing was therefore retained as the combination that best satisfies all four selection criteria while maximizing analytical contrast.
This framing situates the comparative logic within a broader academic context. The cases are not intended to represent national energy systems, but rather organizational models of decarbonization. By emphasizing strategic intent, governance configuration, and operational scope, the comparative design enhances the explanatory power of the analysis, linking firm-level dynamics to ESG convergence trajectories observed during the low-carbon transition.
From a research design perspective, this comparative multi-case approach builds upon and extends existing empirical studies that have examined ESG convergence across firms with different maturity levels [
40,
41,
42]. Whereas prior research has often relied on cross-sectional or econometric techniques, the present study operationalizes comparison through a longitudinal, mechanism-oriented lens, focusing on organizational processes that enable the transition from conventional to low-carbon business models. By integrating intensity-based ESG metrics with qualitative organizational insights, the framework provides a replicable analytical template that can be applied to other sectors or clusters of firms undergoing sustainability transitions.
3.2. Data Collection and Validation of Empirical Evidence
The analysis is based exclusively on publicly available data to ensure replicability and transparency. The data set for the study comprised sustainability reports and annual financial statements for the last three financial years (2021–2023) [
12,
13], which were collected and supplemented with data from external ESG databases, including Refinitiv, Sustainalytics, and MSCI, as well as global sustainability indices such as FTSE4Good and the Dow Jones Sustainability Index [
47]. These sources provide quantitative data, including Scope 1–2–3 GHG emissions, the share of renewable energy, safety indicators, and board composition, as well as qualitative disclosures about corporate strategies, governance policies, and transition plans.
In order to further strengthen the historical validity and sector relevance of the analysis, institutional sources such as the Carbon Disclosure Project (CDP) and reports published by the IEA were consulted. One of the companies analysed has been included in the FTSE4Good for 19 consecutive years and has been awarded “Prime” status by ISS ESG [
12], while the other is currently classified as “medium ESG risk” by Sustainalytics, despite showing documented progress towards alignment with the decarbonisation pathway compatible with the 1.5 °C scenario [
13]. This heterogeneity serves to further reinforce the suitability of the selected cases for a comparative ESG analysis.
The present study utilized a comprehensive dataset, encompassing over 250 quantitative data points extracted from official company disclosures, to provide a comprehensive analysis spanning the period from 2021 to 2024. The harmonised dataset encompasses environmental variables (Scope 1–2–3 greenhouse gas emissions, energy generation mix, emissions intensity, share of renewables), social indicators (total recordable incident rate, employee engagement, gender diversity), and governance metrics (board composition, ESG-linked executive remuneration, transparency and disclosure policies). Each variable has been verified by cross-referencing it with the latest sustainability reports from Ørsted and Enel to ensure internal consistency.
Within the environmental dimension, the analysis explicitly distinguishes between the three emission scopes defined by the GHG Protocol: The three scopes are as follows: (i) Scope 1, which includes direct emissions from sources owned or controlled by the company; (ii) Scope 2, relating to indirect emissions from purchased electricity, steam and heat; and (iii) Scope 3, which includes other indirect emissions along the value chain, such as purchased goods and services, waste management, business travel, investments and use of products sold. This classification ensures full alignment with GRI 305 and CSRD requirements and allows for a consistent and transparent assessment of the emission profiles of the two companies.
The triangulation of data between company reports, independent ESG databases, and institutional sources has been demonstrated to enhance the reliability of the analysis and mitigate the risk of self-reporting bias. Any discrepancies between sources were addressed using harmonisation criteria based on standardised GRI and CSRD definitions, ensuring the highest possible degree of comparability between indicators [
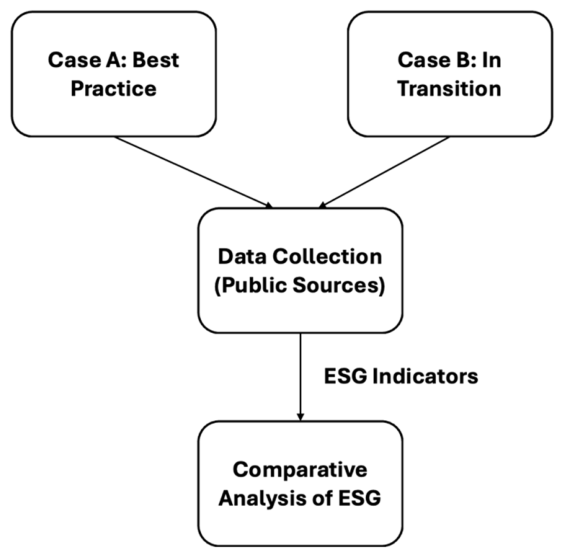
48]. As illustrated in
Figure 2, the analytical process adopted in the comparative ESG assessment comprises several stages, including case selection, data collection, indicator identification, and tabular comparison.
3.3. Environmental, Social, and Governance Metrics for Comparison
The definition of sustainability indicators constitutes a pivotal step in the methodology adopted, as it determines the validity and robustness of the comparison between the selected case studies. The extant literature emphasizes that ESG metrics should meet three fundamental requirements: materiality, availability, and comparability [
17,
50,
51]. Consequently, the indicators selected for this study are directly relevant to the energy sector, consistently reported by both companies and derived from reliable public sources.
The selection of indicators was guided by internationally recognized ESG reporting and disclosure frameworks, including the GRI [
21], the SASB [
26], and the CSRD [
29]. These standards provide a harmonized reference set for ESG assessment and are widely adopted by rating agencies and financial databases, supporting their operational validity and comparability [
52]. The set of indicators covers the three ESG dimensions as follows.
- (i)
Environmental dimension (E).
The environmental performance of the system was assessed using intensity-based indicators. The emission intensity (gCO
2/kWh) was selected as a metric to evaluate the carbon efficiency of electricity generation, while also controlling for scale effects and facilitating meaningful comparisons between companies of varying sizes and geographical scope [
54,
55,
56,
57,
58]. The company’s emissions are categorized in accordance with the Scope 1–2–3 framework, ensuring compliance with the GHG Protocol, the GRI 305 standard [
21], and the CSRD requirements. Furthermore, total GHG emissions (E3) are reported in order to ensure transparency, completeness of coverage, and consistency with CSRD disclosure requirements. However, this indicator is not included in the composite ESG score, as the comparative assessment is intentionally based on intensity metrics. The purpose of this is to neutralize scale effects and avoid distortions related to company size. The share of renewable energy in total generation has been included as a second environmental indicator. This serves as a proxy for structural progress towards a low-carbon energy mix and the alignment of investments with decarbonization pathways [
59].
- (ii)
Social dimension (S).
Social performance was operationalized using indicators reflecting worker safety and inclusion. The Total Recordable Incident Rate (TRIR), expressed as the number of recordable injuries per million hours worked, was selected as a standardized and widely used metric of occupational health and safety (GRI 403) [
60,
61,
62,
63,
64]. In addition, the percentage of women in leadership positions (%) was adopted as a proxy for diversity and inclusion (GRI 405), reflecting evidence linking leadership diversity to organizational performance and governance quality [
63].
- (iii)
Governance dimension (G).
The governance performance of the organization was assessed using indicators that reflect strategic responsibility and oversight mechanisms. The percentage of women on the board of directors was selected as a widely recognized governance indicator associated with board diversity and the quality of decision-making processes [
60]. Furthermore, the integration of ESG objectives into executive remuneration systems was incorporated, evaluated qualitatively based on the presence or absence of ESG-related incentives, with the objective of capturing the extent to which sustainability objectives are embedded within corporate governance structures and managerial incentive systems [
65]. For each indicator, the units of measurement, data sources, and interpretation criteria were explicitly defined to ensure consistency and replicability [
66]. The resulting set of indicators constitutes an essential yet robust comparative framework, capable of capturing the main sustainability drivers in the energy sector while maintaining transparency and methodological clarity.
Ultimately, all indicators were assigned equal weight in the composite ESG assessment to preserve neutrality and replicability. Despite the body of literature indicating the potential of diversified weighting methodologies, contingent on sector materiality, to enhance analytical precision [
67,
68], uniform weighting was implemented with the objective of circumventing subjective bias and ensuring the comparability of the data. It is recommended that future research explore alternative weighting structures as an extension of the proposed framework. To verify the robustness of the results, a sensitivity analysis was conducted by systematically varying both the normalization bounds and the weighting structure. Specifically, three alternative weighting configurations were tested: (i) equal weighting across all indicators (baseline), (ii) increased weight assigned to environmental indicators (E1 and E2), reflecting their greater materiality for energy sector ESG assessment according to SASB standards, and (iii) a balanced pillar-level weighting scheme assigning one third of the composite score to each ESG dimension regardless of the number of indicators per pillar. In all three configurations, the relative ranking of the two companies remained stable, with Ørsted outperforming Enel on environmental indicators and both companies exhibiting broadly comparable scores on the social and governance dimensions. These results confirm that the conclusions of the study are not sensitive to the specific weighting assumptions adopted and that the equal-weighting baseline constitutes a robust and conservative methodological choice. Full details of the sensitivity analysis, including normalized scores under each configuration, are provided in the
Supplementary Materials.
3.4. Multi-Dimensional Comparison
The comparative analysis was designed to systematically evaluate the ESG performance of the two selected companies, ensuring methodological rigour and consistency with the literature on comparative case study analysis [
44,
45,
46]. The approach combines a quantitative component, based on a structured comparison of key ESG indicators, with an integrative perspective that synthesises performance across environmental, social and governance dimensions.
In a preliminary phase, publicly available data from corporate sustainability reports and ESG databases were organised into a structured comparative matrix, allowing for a side-by-side assessment of the values observed for the two case studies. This paired comparison approach is a widely utilised technique in the field of ESG research, as it facilitates the identification of relative disparities and commonalities between companies operating within the same sector [
64]. In light of the heterogeneity of the indicators with regard to scale and unit of measurement, it was necessary to implement a normalisation procedure in order to ensure the comparability of the dimensions [
69]. The indicators were thus transformed to a common 0–1 scale, with the orientation of the scale defined according to the nature of each variable. That is to say, higher values indicate better performance for positive indicators and lower values indicate better performance for negative indicators, in line with the practices adopted by leading ESG databases such as Refinitiv and MSCI [
68].
The normalised indicators were then aggregated at the ESG pillar level (E, S, and G) using a simple arithmetic mean, assigning equal weight to each indicator. This choice reflects the intention to preserve transparency and neutrality in the aggregation process, avoiding arbitrary weighting schemes and maintaining methodological balance between the three dimensions. In the construction of composite ESG indices, aggregation strategies analogous to those previously mentioned are commonly applied when replicability and interpretability are considered priorities [
70,
71].
In order to assess the robustness of the proposed framework, sensitivity and consistency tests were conducted by varying the normalisation parameters and aggregation assumptions. These evaluations substantiated the stability of the relative rankings and composite scores, thereby corroborating the methodological design’s reliability. Comprehensive details pertaining to the standardisation procedures, robustness assessments and internal consistency metrics can be found in the
Supplementary Materials.
In addition to the quantitative comparison, a supplementary qualitative analysis was conducted to contextualise the observed ESG performance patterns [
67]. This interpretative component employs company disclosures and independent sources to examine organisational and governance practices, including the adoption of science-based climate targets or just transition strategies, which help explain the quantitative results [
72,
73]. The integration of quantitative indicators with qualitative interpretation facilitates a more comprehensive understanding of ESG performance, thereby linking measured outcomes to underlying strategic and organisational drivers.
The proposed multidimensional framework integrates quantitative rigour and interpretative depth, facilitating not only the identification of performance disparities but also the exploration of convergence dynamics between companies at varying stages of the energy transition. The utilisation of publicly accessible data, standardised normalisation procedures, and intensity-based indicators ensures the analysis is fully replicable and supports its application to longitudinal and comparative studies between different companies, sectors, or geographical contexts [
74,
75,
76,
77].
4. Results
Consistent with the adopted methodology, ESG data were collected from official and publicly available sources, then harmonized by scope and normalized to enable direct comparison between the two case studies [
40,
41,
42].
Table 3 reports both the absolute and normalized values of the selected ESG indicators and includes greenhouse gas scope coverage to enhance transparency and comparability [
12,
13]. While
Table 3 presents both intensity-based indicators and absolute GHG emissions (E3), the composite ESG comparison relies exclusively on intensity-based metrics; total GHG emissions are reported solely to ensure transparency of scope coverage and consistency with CSRD disclosure requirements.
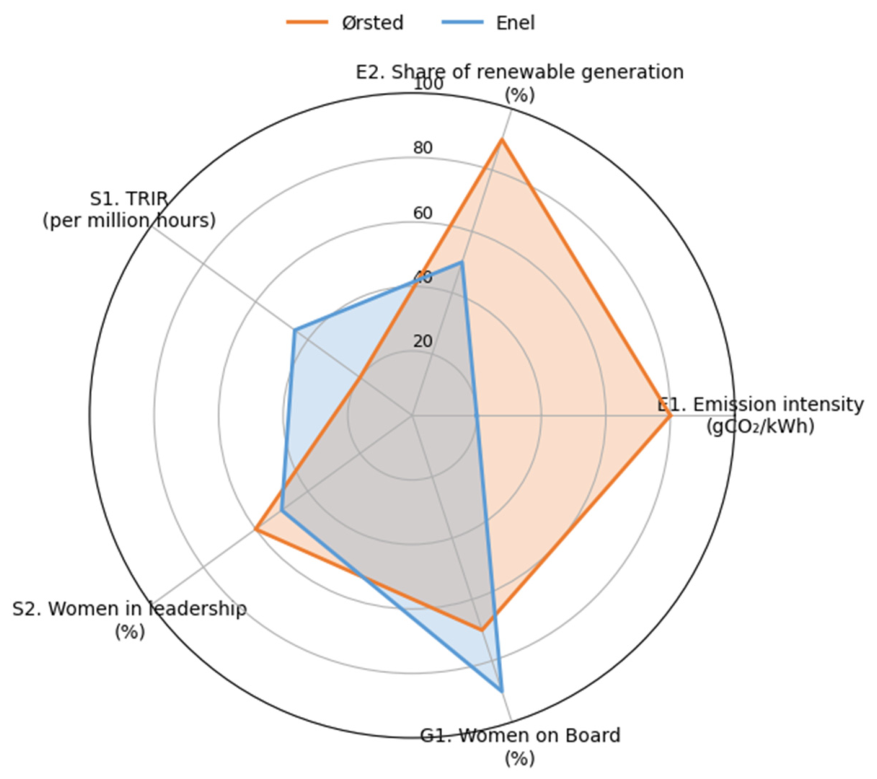
Figure 3 provides a visual synthesis of normalized performance across the environmental, social, and governance pillars.
4.1. Environmental Performance
In the environmental dimension, marked differences emerge between the two companies. Emission intensity of electricity generation is 60.0 gCO
2/kWh for Ørsted [
12] and 237.0 gCO
2/kWh for Enel [
13]. The share of renewable energy in total generation reaches 91.0% for Ørsted and 49.4% for Enel. These differences are reflected in the normalized environmental indicators reported in
Table 3.
Greenhouse gas accounting explicitly includes the three reporting scopes defined by the GHG Protocol: Scope 1, covering direct emissions from company-owned and controlled operations [
70]; Scope 2, referring to indirect emissions from purchased electricity and heat [
71]; and Scope 3, encompassing other indirect emissions along the value chain [
72]. Ørsted reports approximately 0.2 MtCO
2e of combined Scope 1 and 2 emissions, with Scope 3 accounting for less than 10% of its total footprint [
12]. Enel reports 68 MtCO
2e in total, of which approximately 52 MtCO
2e correspond to Scope 1, 2 MtCO
2e to Scope 2, and 14 MtCO
2e to Scope 3 emissions [
13].
4.2. Social and Governance Performance
In the social dimension, the TRIR is 3.10 for Ørsted and 2.25 for Enel, calculated on the basis of employees and contractors [
12,
13]. Women in management positions account for 31.0% at Ørsted and 24.9% at Enel, indicating different levels of gender representation at the leadership level.
In the governance dimension, the share of women on the Board of Directors is 37.5% for Ørsted and 44.4% for Enel [
12,
13]. Both companies report governance structures and incentive mechanisms linking executive remuneration to ESG-related objectives, as reflected in the governance indicators summarized in
Table 3 [
64,
65]. Normalized governance scores indicate limited dispersion between the two cases relative to the environmental pillar.
4.3. Energy Mix Comparison
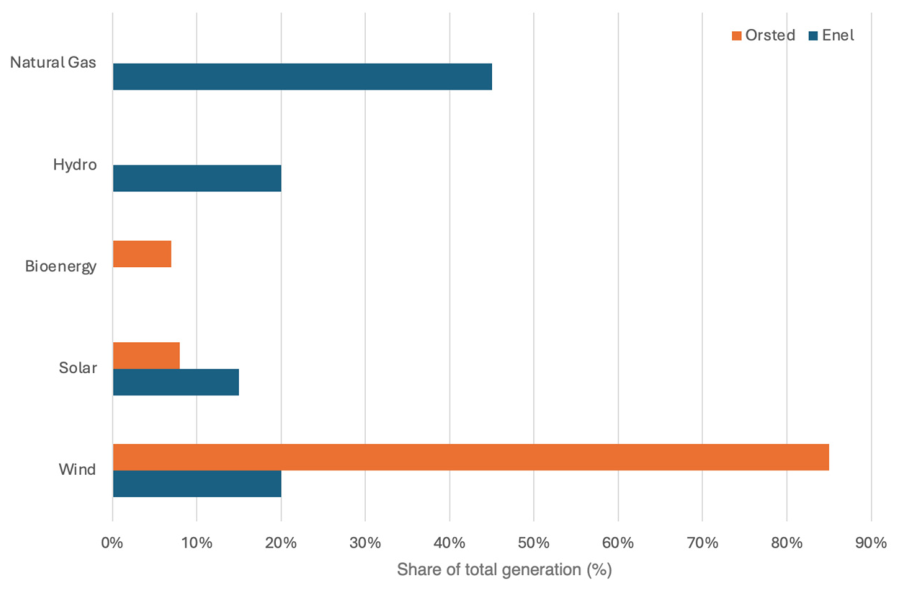
An examination of the energy generation portfolios provides further factual context for the observed environmental indicators. Ørsted’s generation mix consists of approximately 86% offshore and onshore wind, 6% solar, and 8% bioenergy and thermal backup, resulting in renewable output exceeding 95% [
12]. It should be noted that this figure (exceeding 95%) refers to the combined renewable share derived from the energy mix breakdown reported in
Figure 4, where wind, solar, and bioenergy together account for over 95% of the generation portfolio. This differs from the 91% figure cited in
Table 3 (indicator E2), which represents the officially reported share of renewable energy in total electricity generation as disclosed in Ørsted’s sustainability report [
12]. The two figures are therefore based on different reporting boundaries: the 91% is the audited ESG disclosure metric used for comparative purposes, while the 95%+ figure reflects the approximate technology-mix composition shown in
Figure 4. For consistency, the 91% value is used as the reference metric in all quantitative analyses and comparisons. Enel’s portfolio, by contrast, comprises roughly 50% renewable generation—mainly hydro, solar, and wind—and 50% thermal generation, predominantly based on natural gas [
13]. This structural difference is illustrated in
Figure 4 and corresponds to the gap in emission intensity reported in
Table 3.
Overall, the results indicate pronounced differentiation in the environmental pillar, more balanced outcomes in social indicators, and convergence in governance performance. The combined presentation of absolute values, normalized indicators, and scope-specific emissions accounting provides a consistent empirical basis for the comparative assessment and constitutes the input for the scenario analysis developed in the following section.
5. Discussion
While the findings of this study are not statistically generalizable, they are analytically generalizable, as the two case studies represent archetypal transition pathways within the energy sector. This allows inference on organizational and strategic mechanisms underpinning the energy transition, rather than on population-level effects. It should be acknowledged, however, that the comparative case design adopted here can identify associations between ESG maturity and energy transition pathways, but cannot establish causal relationships in a strict empirical sense. Confounding variables, including firm-level resource endowments, differential policy support, home-market regulatory conditions, and broader macroeconomic environments, may independently influence both ESG performance and transition trajectories, and cannot be fully controlled within a two-case design. To partially compensate for this inherent limitation, the analysis adopts a mechanism-oriented perspective, examining the organizational and governance processes through which ESG integration appears to facilitate decarbonization, rather than relying on co-variation alone. Nonetheless, causal inference requires longitudinal panel designs or quasi-experimental approaches, which are identified as priorities for future research.
5.1. Comparative Interpretation
The comparative analysis of Ørsted and Enel highlights two organizational archetypes that represent alternative, yet potentially effective, configurations of the energy transition. Ørsted reflects a best-practice configuration, characterized by an almost fully decarbonized generation portfolio, very low emission intensity, and governance structures explicitly oriented toward sustainability. These features are associated with strong alignment with climate objectives and comparatively lower exposure to transition-related risks [
74]. Enel, by contrast, exemplifies the profile of an incumbent in transformation: its operational scale, geographic diversification, and conventional asset base help contextualize the observed gap in environmental performance, while the rapid expansion of renewable generation and the decline in emission intensity indicate an accelerated trajectory toward decarbonization [
49,
75]. Within this comparative framework, the social and governance dimensions emerge as relative “equalizers.” Despite pronounced differences in the environmental pillar, both companies exhibit broadly comparable performance in occupational safety, inclusion policies, and governance arrangements. This pattern suggests that the ESG transition is not solely a technological process, but also an organizational and cultural one, in which governance mechanisms and the integration of ESG-related KPIs may facilitate progress even under persistent structural constraints [
46,
76]. A deeper examination of the social pillar reveals distinct organizational approaches that go beyond the headline metrics reported. Ørsted’s workforce strategy has prioritized reskilling and internal mobility in anticipation of the shift from fossil-fuel operations to offshore wind maintenance and digital asset management, thereby treating human capital transition as a strategic enabler rather than a residual cost. Enel’s Just Transition framework, by contrast, operates at a larger scale and across multiple national labor markets, combining site-level reskilling programmes with community engagement mechanisms aimed at managing the social implications of coal phase-out and plant closures. Both approaches reflect an understanding that workforce transition is a necessary condition for environmental progress, suggesting a positive synergy between social investment and long-term decarbonization credibility [
77]. In the governance dimension, the analysis identifies board-level oversight of sustainability as a critical mechanism linking ESG commitments to operational outcomes. Both companies have established dedicated sustainability committees and integrated ESG-linked metrics into executive remuneration, yet the governance architectures differ in scope and formalization. Ørsted’s more concentrated structure facilitates faster strategic realignment, while Enel’s multi-layered governance reflects the complexity of managing a geographically dispersed, multi-jurisdictional portfolio. These governance differences are consequential: they condition the speed at which strategic ESG commitments can be translated into measurable operational changes, and partly explain the observed gap in environmental outcomes despite comparable governance scores. Taken together, these observations point to an inter-pillar synergy in which governance quality and social inclusion mechanisms act as enabling conditions for environmental performance, rather than operating independently.
From a model-based perspective, the comparison reveals complementary strengths and limitations. Ørsted benefits from strong alignment with decarbonization strategies, a consolidated ESG reputation, and transparent governance, factors that tend to enhance credibility among regulators, investors, and other stakeholders [
78]. At the same time, proximity to an environmental performance “plateau” may constrain further relative improvements and increase exposure to supply-chain bottlenecks and permitting risks, particularly in capital-intensive offshore wind projects [
78,
79]. Enel, conversely, demonstrates scale-driven investment capacity, rapid renewable deployment, and robust governance structures, but continues to face challenges related to fossil legacy assets, the complexity of multi-country operations, and leadership diversity still under consolidation [
80]. Positioning these findings within the broader ESG benchmarking literature reinforces their analytical relevance. Zrnic et al. [
28] assessed sustainability reporting transparency among European energy companies and found substantial heterogeneity in disclosure quality and scope, with larger utilities tending to report more comprehensively but not necessarily more accurately, a pattern consistent with the self-reporting risk acknowledged in the present study. Bartoszewicz and Szczepankiewicz [
70] analysed the evolution of non-financial disclosures in the energy sector and identified a structural shift from compliance-oriented to strategy-embedded reporting, which aligns with the governance integration patterns observed in both Ørsted and Enel. Hao and Dragomir [
4] conducted a comparative analysis of corporate sustainability reports of EU energy companies and found that decarbonization commitments vary substantially in specificity and alignment with international pathways, further supporting the value of an intensity-based, normalized comparison as proposed in the present framework. Relative to these studies, the present contribution advances the literature in two respects: first, by explicitly combining multiple ESG pillars in a single normalized composite score rather than treating them in isolation; and second, by introducing a forward-looking scenario dimension that translates static ESG snapshots into dynamic convergence trajectories, enabling a richer interpretation of transition progress over time.
From a policy and capital allocation perspective, this comparison suggests that stable regulatory frameworks, stringent disclosure requirements, and targeted incentives for green CAPEX are conducive to both early movers and incumbents credibly pursuing decarbonization pathways [
10]. For investors, ESG evaluation should therefore integrate current performance levels with expected transition trajectories: within the limits of the cases analyzed, Ørsted can be interpreted as a relatively low-risk ESG “safe harbor,” while Enel may offer upside potential if environmental and social targets are achieved as planned [
81,
82]. A further limitation of the present study concerns the representativeness of the selected sample. Both Ørsted and Enel are large, listed European utilities operating within a relatively mature regulatory environment, and their institutional and market contexts differ substantially from those of utilities in emerging economies, smaller independent power producers, or companies operating in non-European regulatory frameworks. Consequently, the external validity of the findings is bounded: while the two cases illuminate contrasting but complementary transition archetypes, the patterns observed may not transfer directly to regions characterized by different levels of institutional development, energy mix legacies, or access to green finance.
5.2. Scenario-Based Trajectory Alignment and Implications
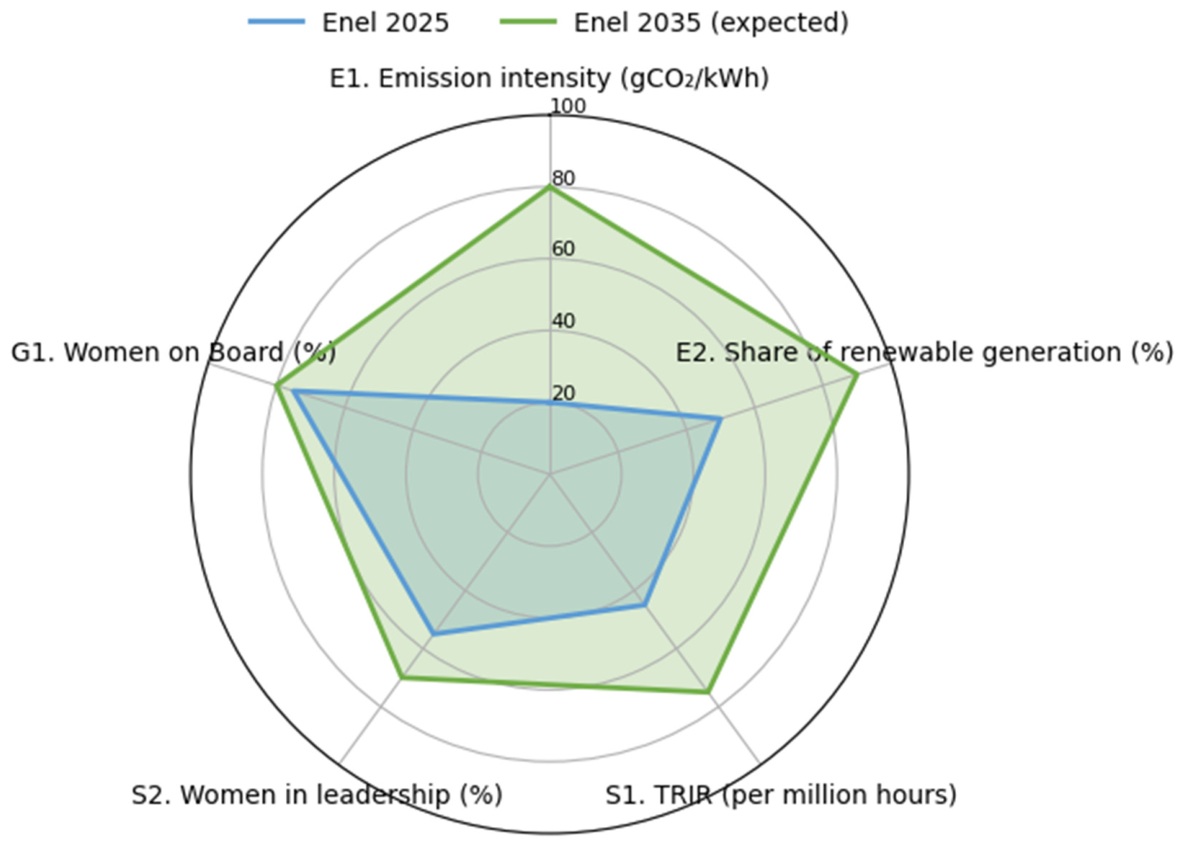
Building on the comparative evidence, a non-predictive, scenario-based trajectory analysis over a ten-year horizon (2025–2035) was developed for a transitioning company such as Enel, using Ørsted as a technological and organizational benchmark (
Figure 5).
The scenario is not constructed as a linear extrapolation of past trends nor as a best-case projection, but rather as a trajectory-alignment exercise aimed at assessing consistency between observed ESG performance, publicly stated corporate targets, and internationally recognized decarbonization pathways. The trajectory for each indicator was constructed using a compound annual convergence rate (CACR) approach, calibrated on the gap between the 2025 baseline value and the 2035 target, as follows:
where V
0 is the 2025 baseline value, V
e is the 2035 target, t
0 = 2025, and t
e = 2035. This formulation assumes a proportional, non-linear rate of change that reflects the empirically observed pattern in energy transition trajectories, where initial improvements tend to be rapid as low-hanging-fruit abatement options are exploited, and later-stage reductions become progressively more costly and technically demanding (learning curve dynamics) [
83,
84]. For the emission intensity indicator (E1), the target value of 60 gCO
2/kWh corresponds to Ørsted’s current benchmark and is consistent with the IEA Net Zero 2050 pathway for the power sector. For the renewable share (E2), the 90% target aligns with Enel’s publicly stated Science Based Targets initiative (SBTi) commitment. Social and governance trajectories were derived from analogous convergence assumptions, anchored to European regulatory benchmarks (EU Gender Equality Strategy 2025–2030) and Enel’s internal health, safety, and environment (HSE) roadmap. Full numerical details of the convergence path for each indicator are provided in
Table S6 of the Supplementary Materials.
In the environmental dimension, emission intensity is projected to decline from approximately 237 gCO
2/kWh in 2025 to around 60 gCO
2/kWh by 2035, reaching a level comparable to Ørsted’s current performance. Over the same period, the share of renewable generation is expected to increase from 49.4% to about 90%, in line with the 1.5 °C decarbonization pathway defined by the IPCC and the IEA Net Zero 2050 scenario. It is important to clarify, however, that a high annual share of renewable generation does not necessarily imply that renewable energy can fully cover electricity demand at all times. Recent research demonstrates that even when distributed generation exceeds local load on an annual basis and flexibility resources such as battery storage, hydrogen storage, and soft open points are deployed, power systems may still require support from the upstream grid due to temporal mismatches between generation and demand, spatial power-flow constraints, storage conversion losses, curtailment events, and voltage limitations [
83]. Therefore, the 90% renewable generation scenario projected for Enel by 2035 should be interpreted as a conditional decarbonization pathway rather than a guarantee of full renewable coverage. Its realization depends critically on the coordinated development of grid-scale and distributed storage infrastructure, distribution-network flexibility mechanisms, advanced dispatch and demand-response systems, and sustained investment in transmission and grid modernization. These system-level enablers are prerequisites for translating a high renewable generation share into actual low-emission load coverage, and their deployment must be considered an integral component of Enel’s transition strategy.
In the social dimension, the trajectory indicates a reduction in the TRIR from 2.25 to approximately 1.0 per million hours, alongside an increase in women in leadership positions from 24.9% to around 35%, consistent with European diversity and inclusion objectives. In the governance dimension, female representation on the board is expected to stabilize at approximately 47%, accompanied by qualitative improvements in transparency, stakeholder engagement, and the integration of ESG-linked performance metrics into executive remuneration systems.
It is important to emphasize that the 2035 scenario does not represent a deterministic econometric forecast, a quantitative prediction, or a business-as-usual projection. Rather, it constitutes a trajectory-building exercise grounded in publicly stated corporate commitments, international benchmarks, and sectoral literature [
84,
85]. Extending the analytical horizon to a full decade provides a clearer view of convergence dynamics, suggesting that the ESG gap between Enel and Ørsted, particularly in the environmental dimension, could be narrowed if current strategies are consistently implemented, as illustrated in
Figure 5.
At the same time, the trajectory remains subject to relevant sources of uncertainty, including regulatory developments, technological progress, market conditions, and geopolitical factors, which may accelerate or slow convergence and therefore require continuous monitoring and periodic reassessment.
Table 4 summarizes the 2025 baseline and the expected 2035 values, illustrating the projected alignment of Enel with Ørsted’s benchmark and with the global 1.5 °C transition pathway. Accordingly, the scenario should be interpreted as a coherence check across ESG dimensions rather than as a forecasted outcome, pointing to a dual pathway to resilience: consolidating the advantages of early environmental leaders while guiding large incumbents along measurable and credible decarbonization, safety, and inclusion trajectories [
86].
5.3. Decision-Making Implications
Beyond descriptive comparison, the results suggest that the proposed framework has potential as a decision-support tool. For investors, the convergence scenario provides an indicative structure for assessing transition-related risks and opportunities, linking emission trajectories, governance maturity, and social progress to capital allocation and portfolio resilience [
87]. By translating qualitative ESG strategies into quantitative performance pathways, the framework may support the distinction between sustainability leaders and credible transformers, potentially improving alignment with sustainable finance taxonomies and green bond eligibility criteria [
88].
For policymakers, the comparative evidence is consistent with the view that incentive schemes, disclosure standards, and regulatory stability play an important role in fostering convergence between incumbents and frontrunners [
89]. Within the limits of the cases analyzed, the framework may therefore serve as a monitoring instrument to evaluate the effectiveness of national or regional decarbonization policies over time.
At the corporate level, the findings indicate that embedding ESG targets into governance and operational decision-making can be associated with tangible business value [
90]. Ørsted’s experience illustrates how early ESG integration may translate into reputational and financial advantages, while Enel’s trajectory suggests that legacy utilities can potentially convert decarbonization constraints into innovation opportunities through adaptive governance and social inclusion mechanisms.
Overall, the framework operationalizes ESG decision-making in an indicative manner by linking scenario-based trajectories with actionable levers related to investment prioritization, workforce transition, and governance incentives, allowing firms and stakeholders to monitor progress dynamically and adjust strategies in response to evolving sustainability pressures.
5.4. Managerial Reflections
From a managerial perspective, the findings point to distinct strategic implications for the two companies. For Ørsted, sustaining leadership may require moving beyond renewable deployment toward deeper value-chain integration, including offshore repowering strategies, increased circularity in turbine materials, and expansion into green hydrogen.
These initiatives are expected to strengthen supply-chain control and may help mitigate resource bottlenecks, thereby reinforcing operational efficiency and investor confidence [
90].
For Enel, the transition appears to hinge on leveraging scale and geographic diversification through its Just Transition strategy, which combines workforce reskilling, network digitalization, and progressive divestment from gas-fired assets. This approach has the potential to transform legacy infrastructure into a platform for renewable expansion and grid flexibility, contributing to long-term profitability and social acceptance [
91].
More broadly, the comparative evidence suggests that advanced ESG integration may generate not only environmental and reputational benefits but also tangible business advantages. Companies with mature ESG practices tend to exhibit lower cost of capital, stronger stakeholder trust, and greater resilience to regulatory change. Within this comparative setting, Ørsted can be interpreted as a mature environmental leader, while Enel illustrates the case of a large incumbent undergoing credible and relatively rapid convergence toward sustainability, together offering two complementary reference models for the operationalization of the energy transition [
92,
93].
6. Conclusions and Future Perspectives
The comparative analysis has highlighted key sustainability dynamics within the energy sector. The results indicate that, in the environmental dimension, substantial gaps persist: Ørsted has achieved an almost fully decarbonized configuration, whereas Enel remains in a catch-up phase, characterized by ongoing efforts to reduce emission intensity and progressively expand renewable capacity and generation. At the same time, the analysis reveals areas of convergence in the social and governance pillars. In particular, Enel has shown notable progress in occupational safety outcomes, gender inclusion at managerial levels, and the development of transparent and diversified governance structures, approaching internationally recognized standards in these domains. Overall, the evidence points to a differentiated landscape in which established best practices coexist with clearly identifiable pathways for further improvement.
Methodological contributions. From a methodological perspective, this study has developed an applicable and replicable framework, entirely based on publicly available data, for measuring and comparing ESG performance across firms at different stages of the energy transition. The integration of comparable indicators, visual tools, and a forward-looking scenario-based analysis enables a dynamic, rather than purely static, assessment of ESG performance. In contrast to much of the existing ESG literature, which often relies on static scores or single reporting frameworks, the proposed approach systematically combines intensity-based indicators with multiple international ESG reporting standards (GRI, SASB, and CSRD) and embeds them within a scenario-based convergence perspective. This configuration enhances transparency, supports cross-company comparability, and allows medium-term ESG trajectories to be examined in a structured manner.
Policy and managerial implications. Compared with prior studies, the added value of the framework lies in its capacity to interpret ESG evolution dynamically, capturing convergence dynamics and residual gaps over the medium term. By explicitly linking ESG performance to decarbonization pathways over time, the analysis improves analytical precision while maintaining scale neutrality and cross-sector replicability. In this sense, the framework provides a robust comparative tool for assessing ESG trajectories and can be readily applied to other sectors or institutional contexts.
Research limitations. The study presents several limitations that should be acknowledged. First, the two-case design limits causal inference: the observed associations between ESG maturity and transition trajectories cannot be attributed to ESG integration alone, as confounding factors such as firm size, home-market regulatory conditions, and resource endowments cannot be fully controlled. Second, the sample is restricted to large, listed European utilities, which limits the external validity of the findings with respect to smaller firms, non-European contexts, and emerging economies. Third, the governance dimension is operationalized through a single quantitative indicator (board gender diversity), which may not fully capture the complexity of governance architectures and sustainability oversight mechanisms. These limitations are addressed in the future research directions outlined below. Two further methodological limitations deserve explicit discussion. First, the present analysis is inherently cross-sectional in its comparative design: while a three-year data window (2021–2023) is used to validate trend stability, the normalization bounds are fixed at the observed values within this period, which means that the composite scores capture a snapshot of relative performance rather than a longitudinal trajectory. A static normalization approach of this kind may underestimate the pace of improvement for a company that is rapidly converging, and may fail to detect reversals or plateaux in performance over time. Second, the analysis relies exclusively on self-reported sustainability disclosures, which are subject to the risk of selective or optimistic reporting, sometimes referred to as green-cleaning in the ESG literature. As CSRD-aligned disclosures become progressively available from 2025 onwards, future studies will benefit from a more robust and audit-verified data foundation, reducing the contextual subjectivity inherent in current ESG reporting practices.
Future research directions. Looking ahead, the findings suggest several avenues for future research. First, extending the analysis to a broader sample of energy companies, including both European and non-European firms, would allow a more comprehensive assessment of sectoral convergence toward decarbonization and provide insights into how institutional settings, market structures, and governance traditions shape ESG outcomes. An expanded comparative framework could also incorporate a more geographically diverse sample, including Asian, Latin American, and African utilities, to determine whether similar ESG convergence dynamics emerge across distinct institutional and market contexts. Future studies could adopt mixed methods designs that integrate quantitative ESG indicators with qualitative evidence to better capture organizational learning and adaptation processes across different strategic archetypes.
Second, the development of longitudinal analyses based on extended historical time series, ideally covering a full business cycle (15–20 years), would enable a clearer distinction between structural and conjunctural ESG improvements. Such an approach could support the application of advanced econometric techniques to explore causal relationships between corporate strategies, policy interventions, and performance evolution, as well as to identify time lags between strategic commitments and observable outcomes. This would provide policymakers and investors with more robust tools to assess the credibility of transition pathways. Greater attention should also be devoted to cross-pillar ESG interactions, particularly by examining whether firms with stronger governance and social performance achieve faster decarbonization trajectories over time.
Further research could also integrate scenario-based ESG analysis with climate-aligned financial modeling, examining the economic implications of achieving alignment with the 1.5 °C pathway. This extension would strengthen the framework’s ability to link ESG dynamics with financial performance and risk exposure, thereby bridging sustainability assessment and strategic management.
Overall, the findings reinforce the view that the energy transition is not solely a technological challenge, but a multifaceted process requiring the integrated consideration of environmental, social, and governance dimensions. Best-practice cases illustrate that deep transformation can be feasible, credible, and potentially competitive, while transitional cases demonstrate that even large incumbents, despite inherited complexity and constraints, can pursue tangible pathways toward decarbonization, social innovation, and governance strengthening.