Abstract
Based on the application of the power batteries, this paper uses a statistical method to estimate the internal resistance and open-circuit voltage of Ni-MH battery. Battery status is monitored and simulated by battery pack test bench. Through using ideal battery model and fitting the data of measured voltage and current, the battery internal resistance and open-circuit voltage are estimated. The average relative error between battery statistic internal resistance and pulse internal resistance is less than 15% in different state of charge. Relative error is influenced by dispersion and symmetry of charge or discharge current. Average of absolute error in open-circuit voltage is about 5% respectively. The results show that it is feasible and accurate to estimate the parameters of Ni-MH battery by using statistical method.
1. Instruction
As a power source, the battery is the key to the development of Hybrid Electric Vehicle (HEV). With the characteristics of the high energy density, environmental protection, fast charging and discharging, the Ni-MH battery is known as the green battery. Also, it is the power battery that is favored by most new energy vehicles.
Because of the performances of strong non-linear and time-variability, some characteristics of the power battery will be changed, such as the equivalent internal resistance and available capacity, under the influence of extrinsic environment and other outside elements. There are still some problems of the power battery in group application [1], such as the poor consistency of cell, short lifetime in group, and unbalanced in charge or discharge. As an important specification, internal resistance of power battery can provide the useful information for the above problems [2,3,4] in measuring its performance and healthy level. The State of Charge of a battery is its available capacity expressed as a percentage of its rated capacity. Reflecting the state of battery, the state of charge (SOC) can identify the differences among batteries and extend the life of battery [5]. For an HEV, the crux in getting a good estimate of the battery SOC is mainly due to lack of effective means to predict the dynamic nonlinear battery discharge characteristics. Those may vary with the discharge rate, depth of discharge, recharging times, temperature, aging, etc. In addition, the open-circuit voltage (OCV) is also an important parameter.
This paper makes a battery module which is connected in series by 120 1.2V/6Ah cylindrical Ni-MH dynamic batteries as research object. The simulation operating mode is provided for the battery module by using measurement instrumentation of high-accuracy in research. Then it is needed to make a comparison test between statistical resistance and pulse resistance and analysis the validity of a statistical method, which is used to estimate the OCV of battery. Meanwhile, SOC of the battery can be estimated according to the relationship between OCV and SOC and the open-circuit voltage. With comparison of the average absolute errors between the target value and the estimated value, this paper illustrates the feasibility of statistical method.
2. Battery Model Description
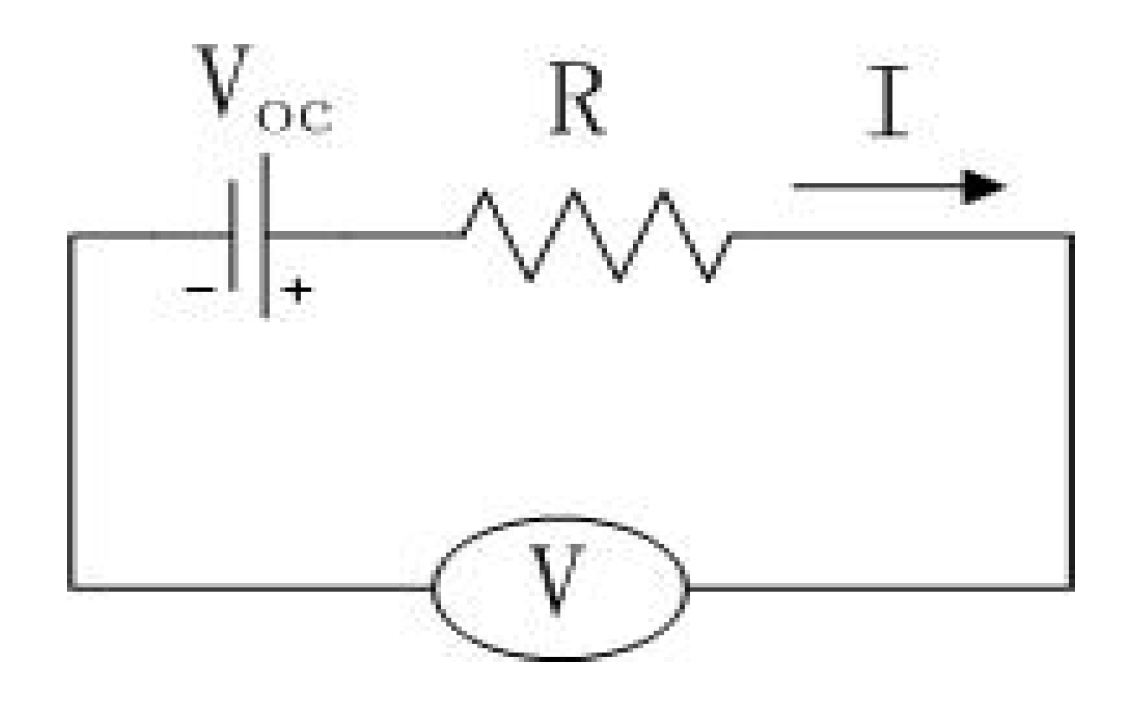
In this paper, the thevenin battery model is used [6,7]. It is considered that the battery is a combination which includes the ideal voltage source and resistance in series. The model is shown in Figure 1.
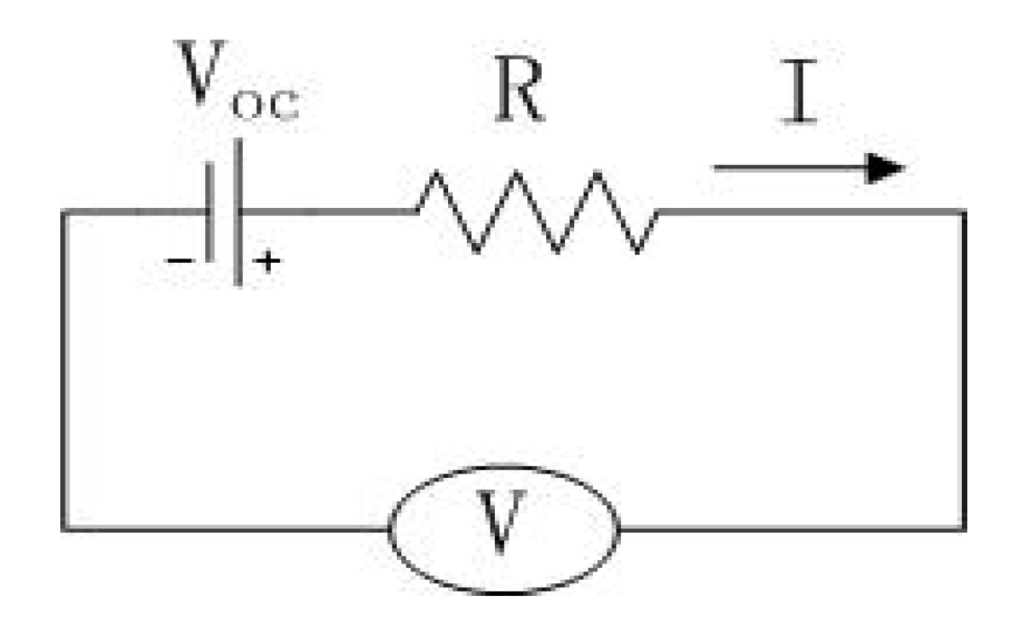
Figure 1.
Equivalent circuit for the battery system.
Figure 1.
Equivalent circuit for the battery system.
The mathematical relationship of this equivalent model is shown in (1):
where V is the terminal voltage, I is the terminal current.
With the change of ambient temperature, SOC, current, various parameters of the battery model will also change. By different test, this paper obtains the variation of Ni-MH batteries’ parameters.
3. Online Resistance
3.1. Resistance calculation
At present, there are some methods of testing internal resistance as follow [8]: direct current method, alternating current method and pulse method. The direct current method is the method which makes the battery in the static or offline state. After adding a discharge current on terminal, the battery resistance can be provided by the ratio between the battery voltage drop and the discharging current. Advantage of direct current method is easy to handle. The drawback is that can’t conduct monitoring real-time and is harmful to the battery.
Alternating current method is the method which adds alternating low-frequency low current signal into the battery, then samples its voltage, commutates and filters and so on. Through transmittal circuit, it can get the impedance of the battery and the real value is resistance. Its advantage is more accurate on testing the monomer battery. The disadvantage is that its ability of anti-jamming is poor and does not apply to the on-line (real time) monitor of the power battery.
The pulse method is the method which holds the battery in shelved state, then gives the battery a series of charge or discharge current pulse. At last it calculates the resistance through the ratio of pulse’s voltage and current. The resistance value is expressed as:
where I is the value of pulse current, Vbefore is the shelved voltage. When Vd takes the average value of peak voltage of pulse, R represents the pulse’s resistance. The advantage of this method is that it is precise in testing the battery resistance in the level of mΩ.
Because the current of dynamic battery is complicated and diversified in the practical work and its voltage has hysteresis [8]. So the above methods are invalid in calculating resistance online. But in theoretically, the statistical method can make use of this characteristic and compute the online resistance effectively.
The principle of statistical method to measure online resistance is: in a short time, the change of battery’s OCV and resistance is tiny, so its value is considered invariable. According to the value of the terminal voltage and current, resistance and the OCV can be fitted out by Equations (3–7).
The resistance R is found by using this statistical method, applied to data corresponding to a specified time interval. The following definitions and formula are applied [8]:
where n represents the number of recorded current-potential data points to be included in the extraction of the open-circuit voltage Voc and the resistance R. For all analyses presented in this work, the time step is 1 s and n = 100. These equations will fail when the variance S2 − S1 × S1 = 0, or when this quantity is neatly zero [9]. In addition, the equations will fail to provide a reasonable result when the many recorded currents used in the statistical analysis are similar. Thus in practical engineering application, it is important to allow for a correction to the extraction of the resistance R. This paper uses the previous value to replace the failure resistance. This statistical method can recognize the online resistance examination but don’t need extra testing mode and expensive testing equipment.
3.2. Experimental preparation
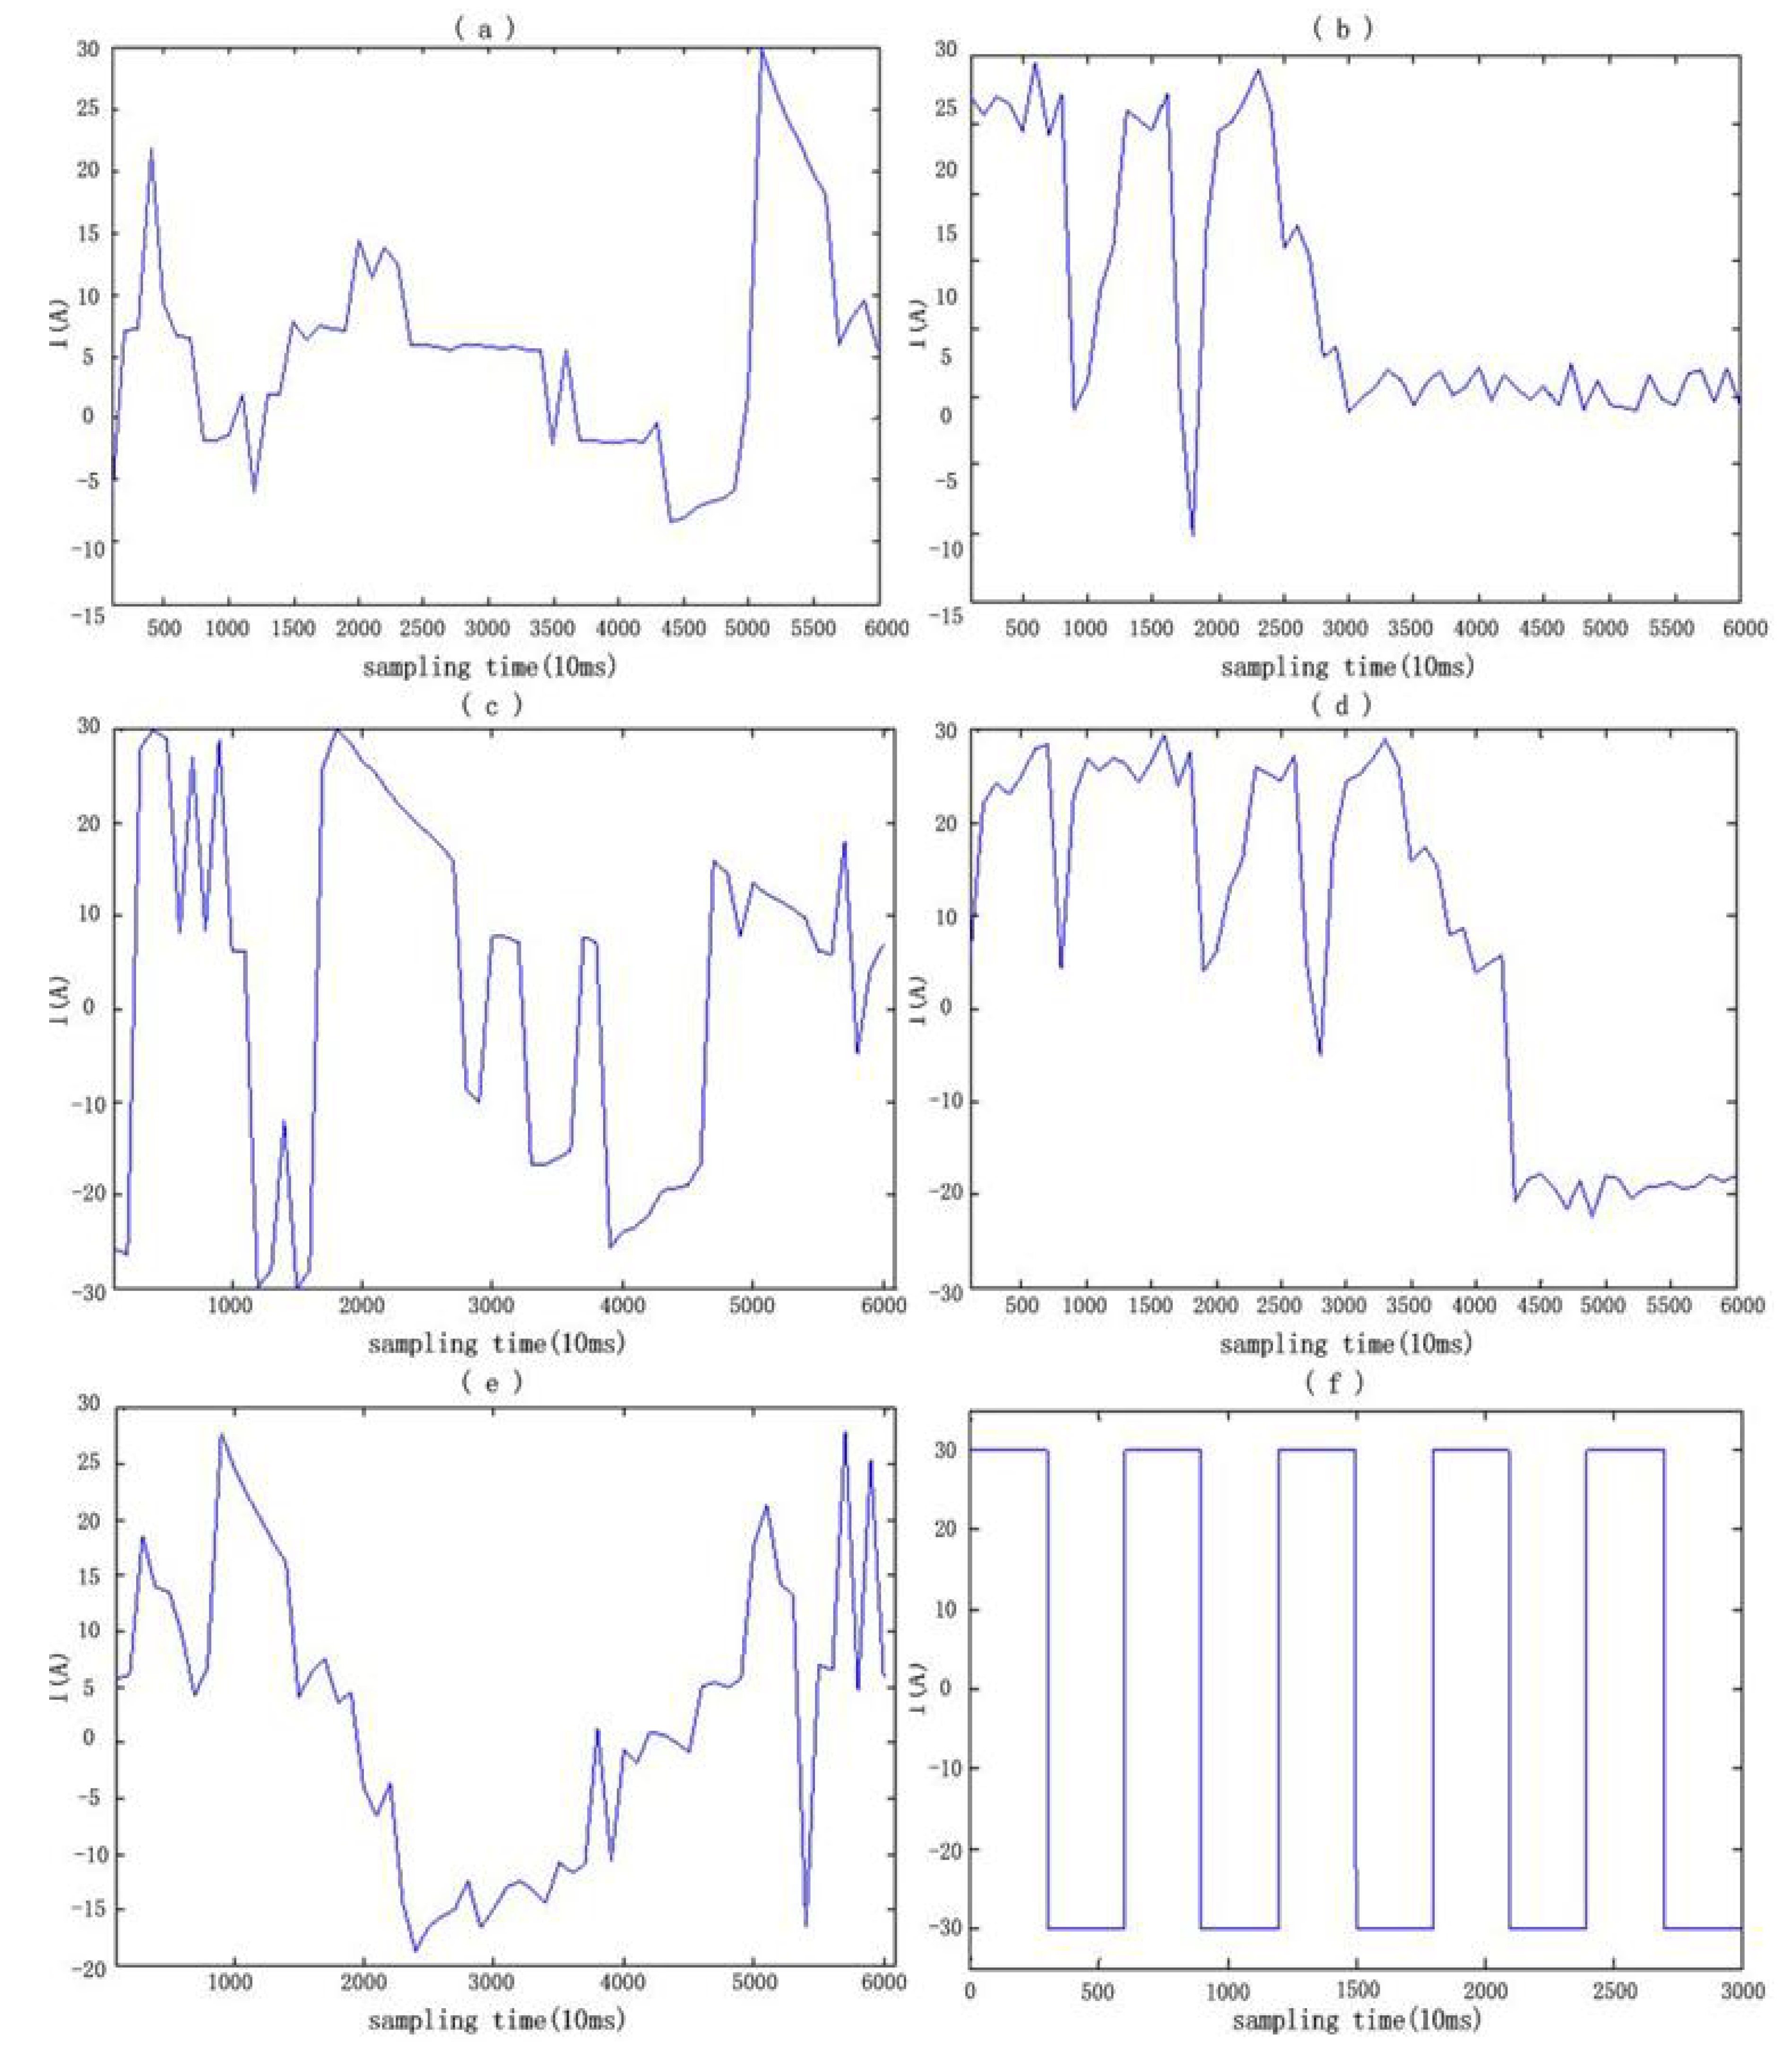
This paper uses high-precision battery performance testing system, of which includes: A high precision battery performance test equipment, a PC, one battery pack (120 1.2V/6Ah cylindrical Ni-MH batteries), Figure 2. Through the PC-control software, we set up a few steps to simulate the different testing conditions which are shown in Figure 3(a-f). The data of terminal voltage & current are recorded. Then, we use these data to verify statistical method of real time resistance calculation.

Figure 2.
Frame of the experimentation.
Figure 2.
Frame of the experimentation.

3.3. The result and analysis of resistance calculation
The experiment is carried out in different SOC (20 ± 5 °C ventilation condition). The battery is fully charged according to the standard of QC/T744-2006 [10], after that battery is discharged to the designated SOC stage of 100%, 87.5%, 75%, 62.5%, 50%, 37.5%, 25%, 12.5%. The simulation data (from real HEV vehicle driving pattern) of terminal current are shown in Figure 3(a–e). In Figure 3, the abscissa stands for the time, unit: ms. The positive number means the battery is charging. The pulse condition is originated in the bibliography [4]. After 1 hour (waiting battery pack becomes static mode), we use the pulse as shown in Figure 3(f) to test battery resistant by using pulse method. The resistance can be calculated in accordance with Equation (2).
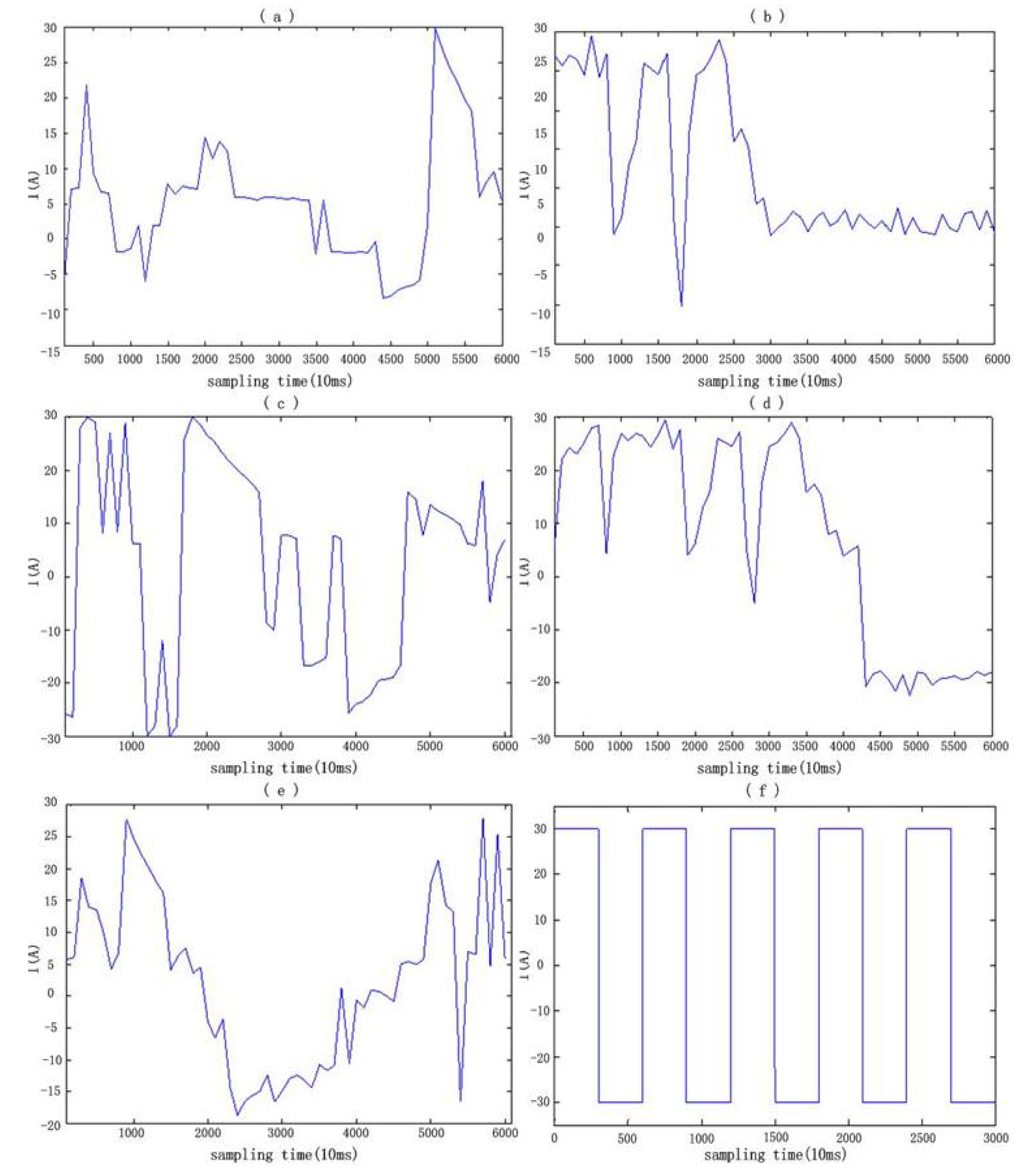
Figure 3.
Current instance for testing the internal battery resistance.
Figure 3.
Current instance for testing the internal battery resistance.
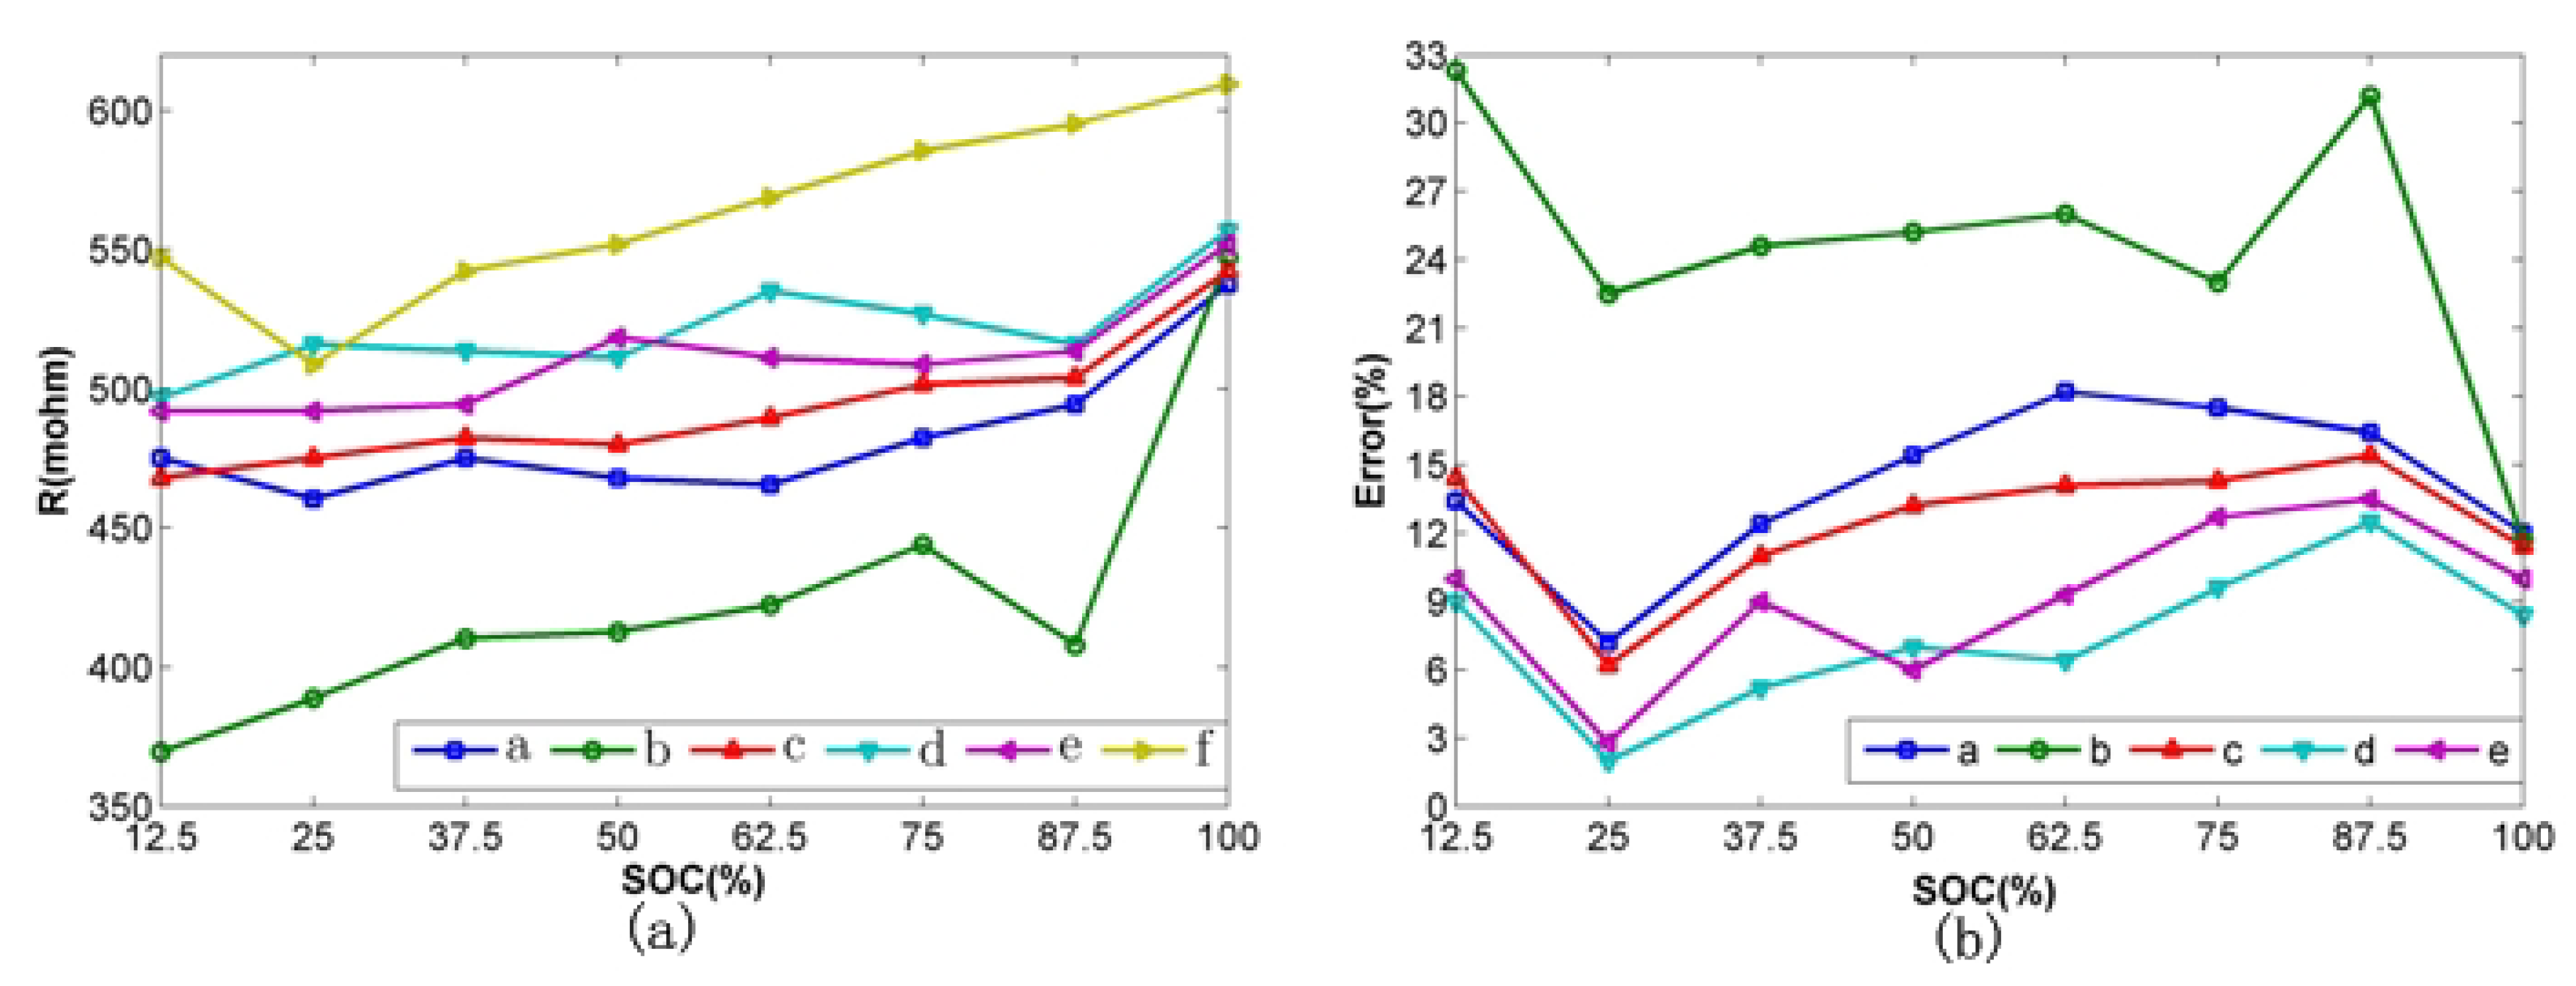
The results of statistical resistance and pulse resistance are shown in Figure 4(a). We can see that statistical resistance change irregularly. It is consistent with the knowledgeable we have recognized. Except the Condition b, the results of other conditions are relatively close in different SOC, especially SOC is larger and smaller, such as 12.5%, 87.5%, 100%. Those results indicate that this statistical method has a good stability. In addition, the statistical resistances are smaller than the pulse resistance. The cause is the different size of charge or discharge current [11].
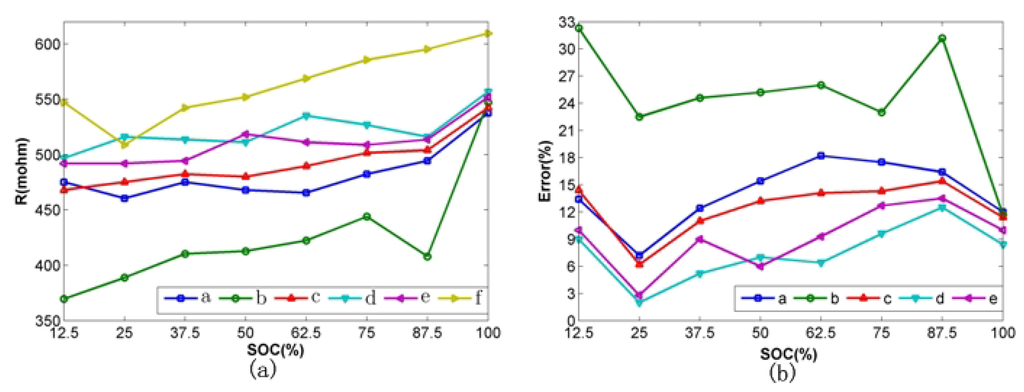
Figure 4.
(a) Comparing of internal resistance. (b) Error of internal resistance by statistics.
Figure 4.
(a) Comparing of internal resistance. (b) Error of internal resistance by statistics.
The relative error between statistical result and target value is defined in the following formula:
where n is respectively the statistical result, m is target value.
The simulation relative errors are shown in Figure 4(b). The average values are as follows: 14.1%, 24.6%, 12.5%, 7.6%, 9.2%. We arrange them from small to large: Condition d, Condition e, Condition c, Condition a, Condition b. Because Condition b fails in practice, it will be replaced by the previous statistical resistance.
In order to find the impact factor of relative error, the paper analyzes the dispersion and symmetry of the current distribution [12]. As shown in Table 1, the positive integers (in the brackets) represent the times of charge or discharge during the 100 sampling points.

Table 1.
Current distribution in each simulation condition.
| simulative mode serial number | charge mean value (A) | discharge mean value (A) | current dispersion |
|---|---|---|---|
| a | 8.6 (62) | –5.7 (31) | 1.2 |
| b | 12.6 (98) | –5.1 (2) | 1.5 |
| c | 15.8 (63) | –20.7 (37) | 6.4 |
| d | 19.4 (68) | –18.4 (32) | 6.1 |
| e | 10.9 (62) | –11.0 (38) | 2.8 |
According to the principle of linear fitting, the larger distribution the sampling points have, the better the linear fitting result gets. However, there is a phenomenon that the errors are large when the dispersions of the Conditions a and c are high. It can be seen that the symmetry of charge or discharge current also affects the relative error. The better the symmetry of charge or discharge current is, the smaller the relative error will be.
4. Open-Circuit Voltage
At present, there are some methods for testing OCV as follow: direct measurement method and compensation method. The direct measurement method is the method that OCV is measured by the voltmeter when the equivalent resistance Ri can be ignored. Advantage of direct measurement method is simple. The drawback is that has big error and can’t monitor in real-time.
In this paper, the terminal current and voltage was used to calculate the OCV by statistical method at specified time interval. The detail computing formulas of voltage are shown in Equations (3–6) and (9):
This paper does the following experiment with battery test system. At first, it sets different initial conditions in different driving cycle, such as different charge or discharge current. Through sampling data every 10ms, we calculate SOC by Ah algorithm. The change of current and voltage is shown in Figure 5. Figure 5 (a,b) expresses the current and voltage curve of test sample 1. Figure 5 (c,d) expresses the current and voltage curve of test sample 2.
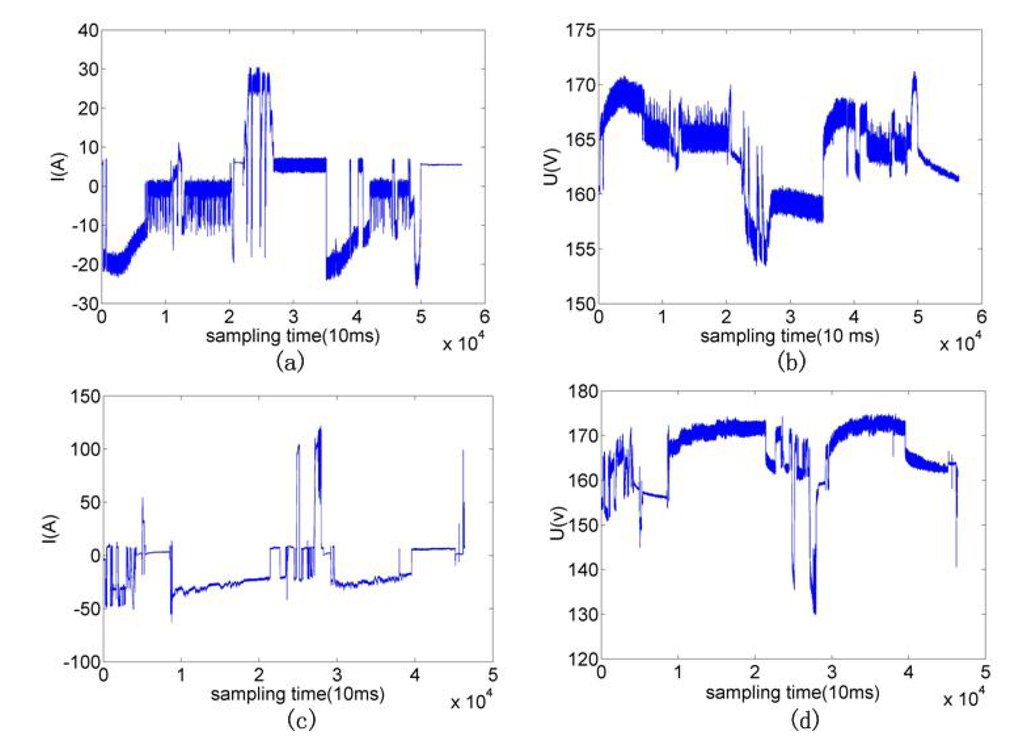
Figure 5.
Curve graph for changes in current and voltage.
Figure 5.
Curve graph for changes in current and voltage.
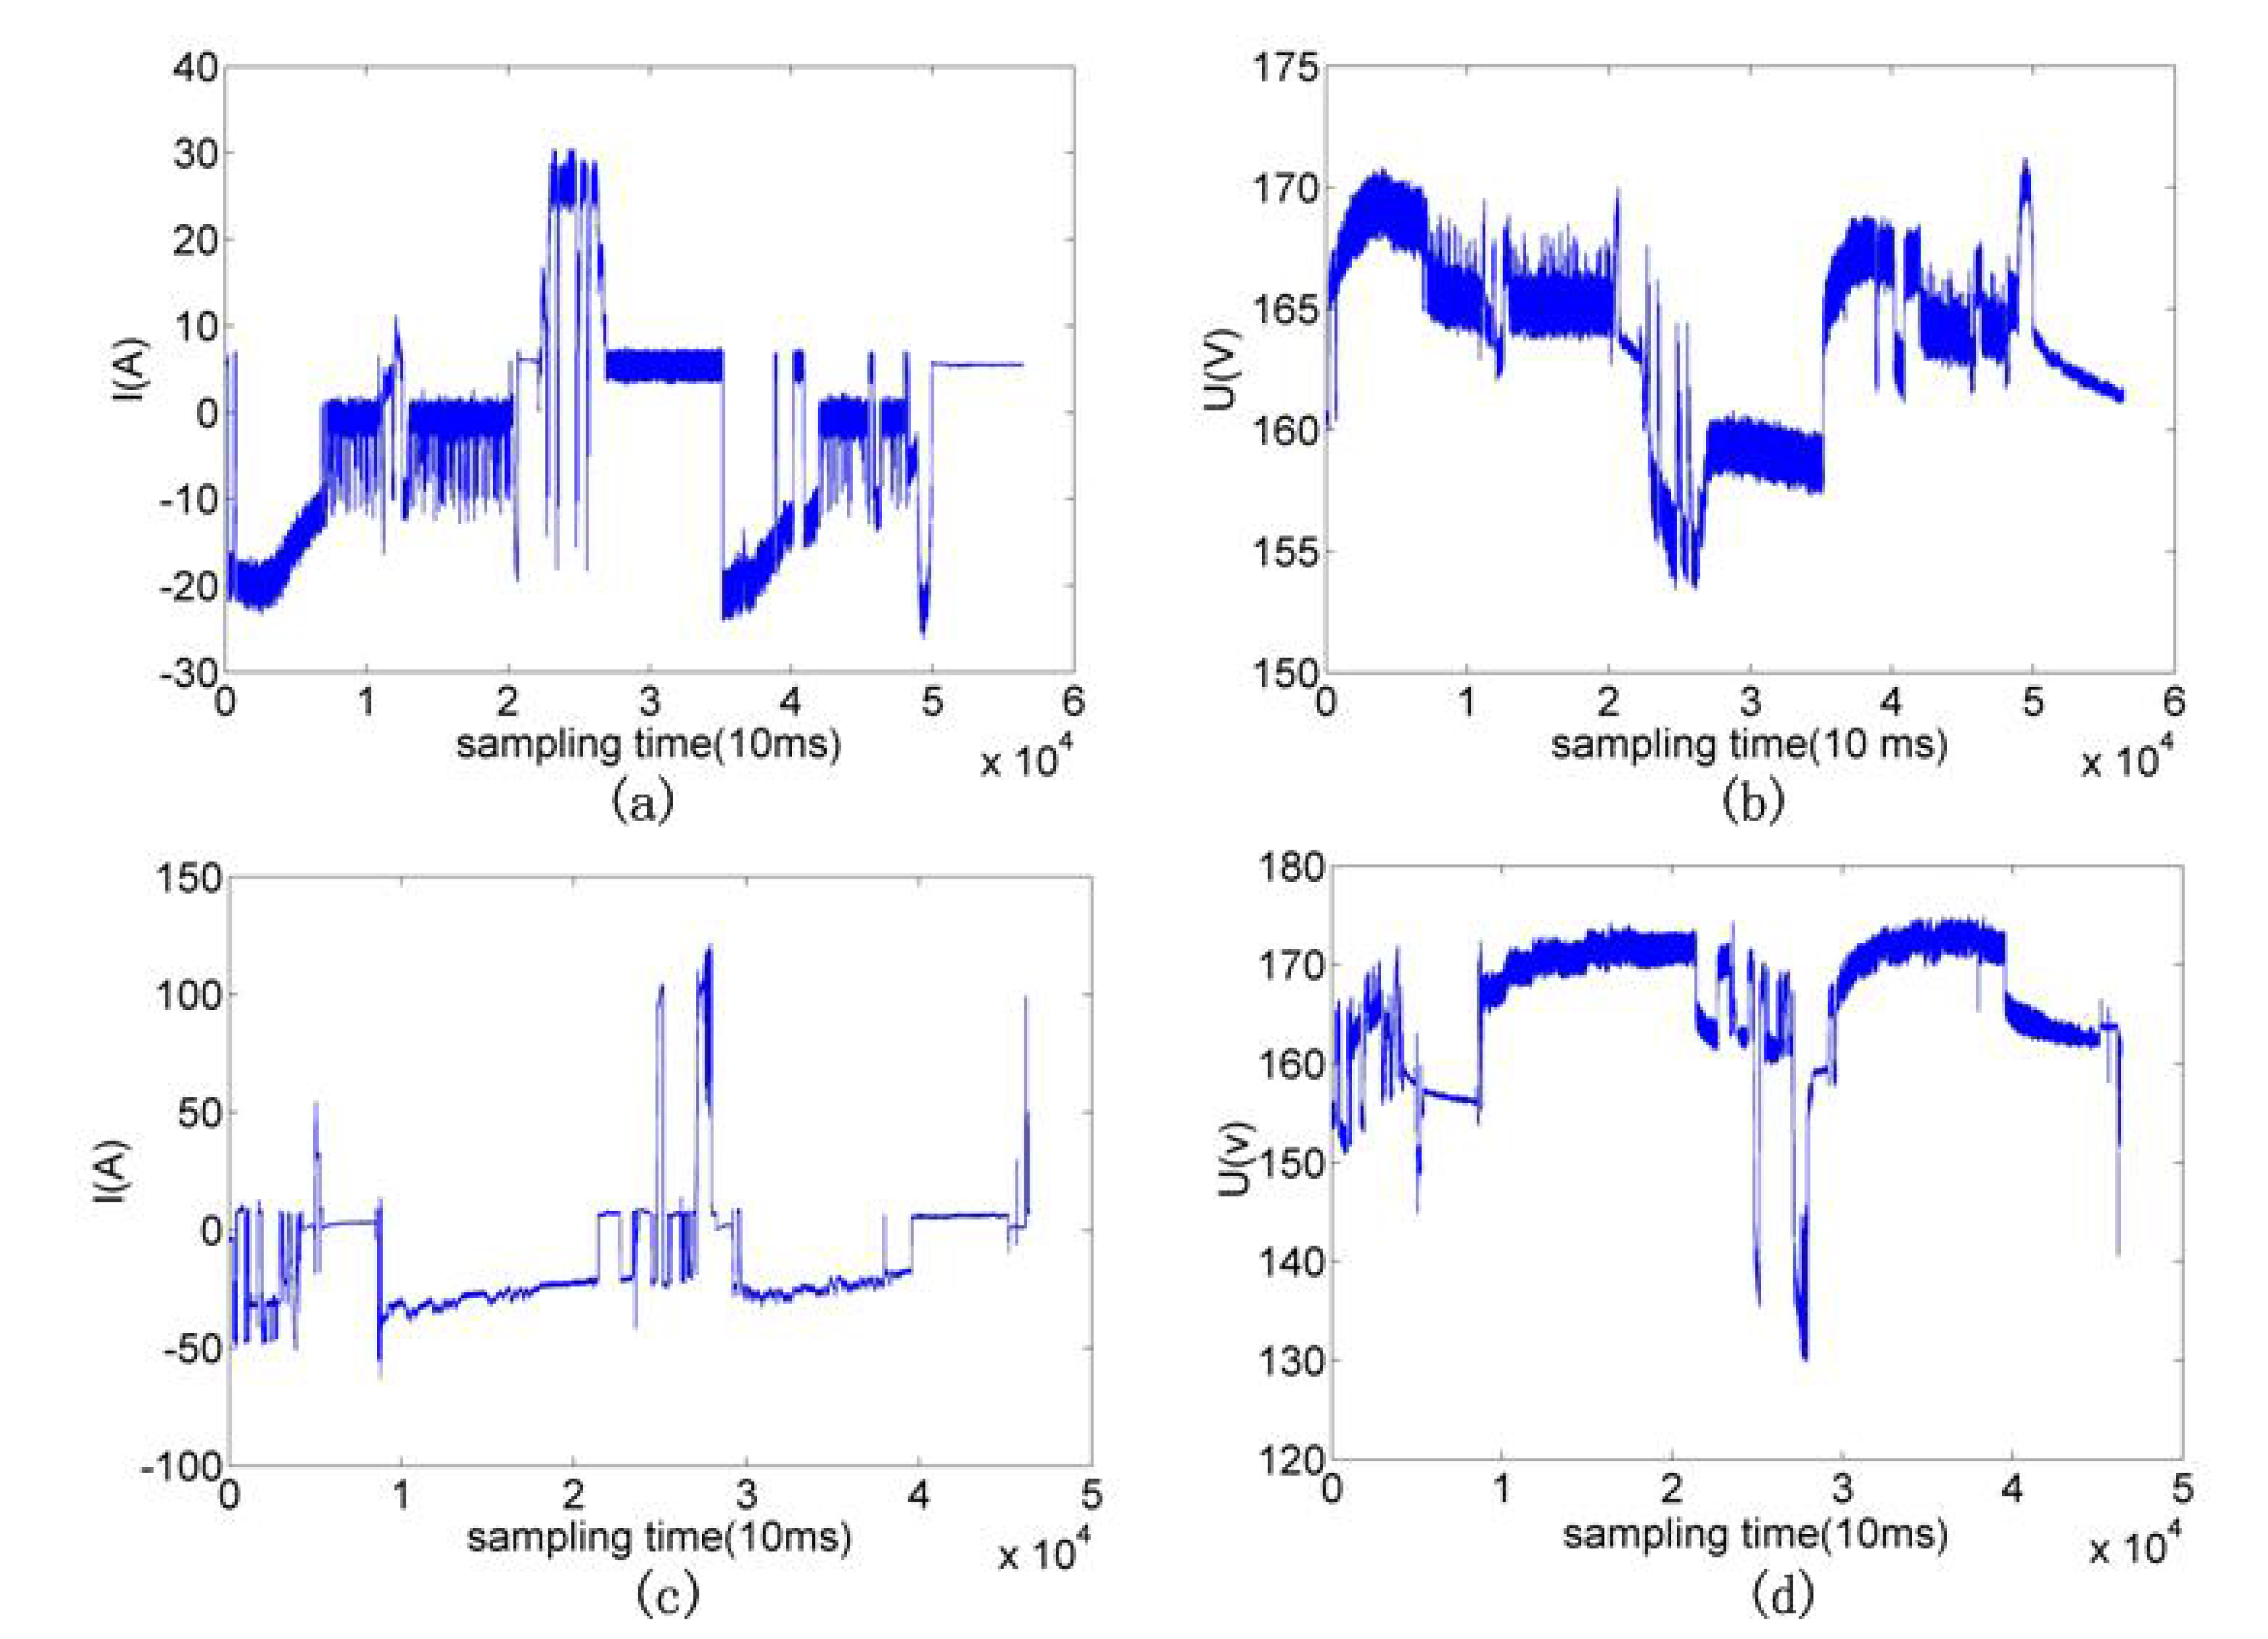
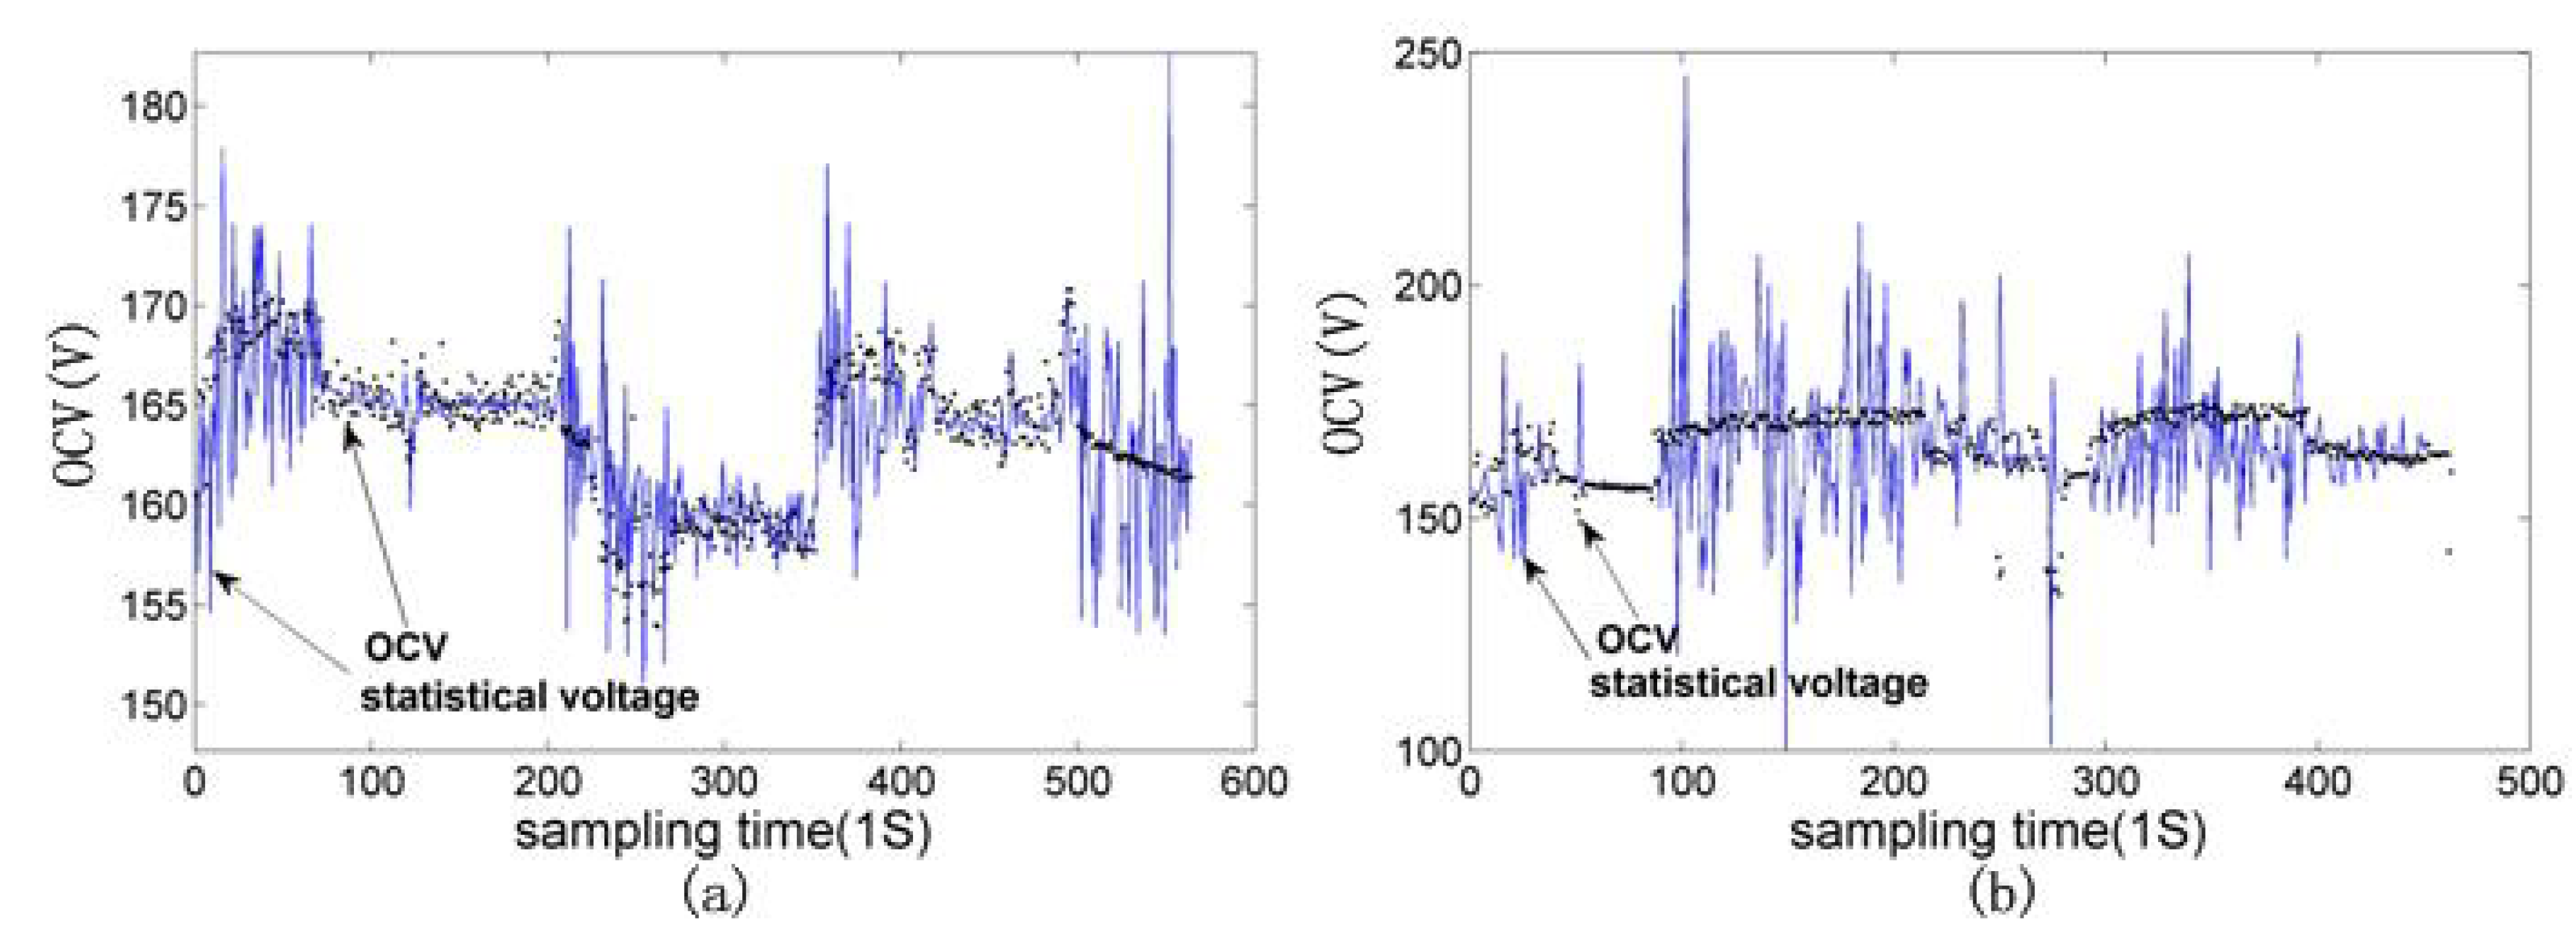
According to the data in Figure 5, this paper uses statistical method to calculate OCV. Because the change of voltage or current is too small in 10ms, the error of statistical method will be large. We take data at every 100 interval and then calculate OCV by these values. Table 2 shows their average error. The comparison chart is shown in Figure 6. Figure 6 (a) expresses the result of test sample 1, and Figure 6 (b) expresses the result of test sample 2. The statistical results and real-time voltage’s curve show that OCV can reflect the trend of terminal voltage in real-time accurately.

Table 2.
The average error between the OCV and statistical voltage.
| driving patten | error |
|---|---|
| driving patten 1 | 1.03% |
| driving patten 2 | 3.4% |
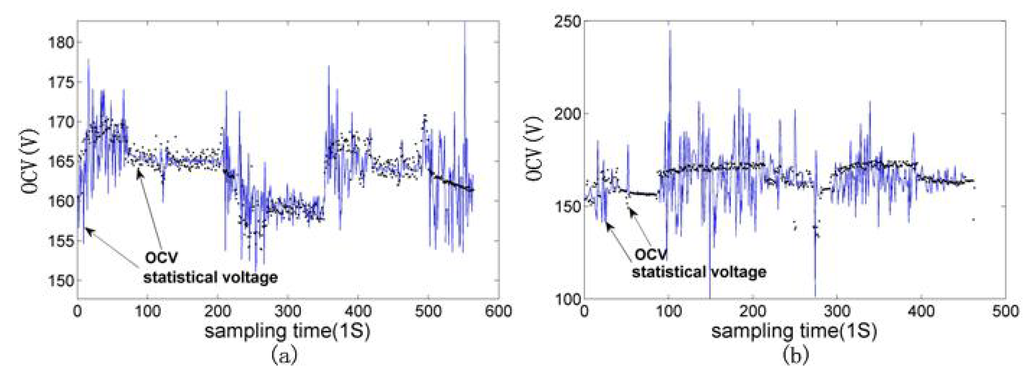
Figure 6.
The comparison chart between OCV and statistical voltage.
Figure 6.
The comparison chart between OCV and statistical voltage.
5. SOC
The paper defines the relationship between OCV and SOC based on experience in Table 3. We estimate SOC by this relationship and OCV. The contrast effect of SOC between the estimated value and the actual value which is calculated by Ah algorithm is shown in Figure 7. Figure 7 (a) shows SOC of the test sample 1; Figure 7 (b) shows SOC of test sample 2.

Table 3.
The relationship between the experience open-circuit voltage and SOC.
| U(v) | 96 | 120 | 140 | 198 |
| SOC(%) | 0 | 10 | 30 | 100 |
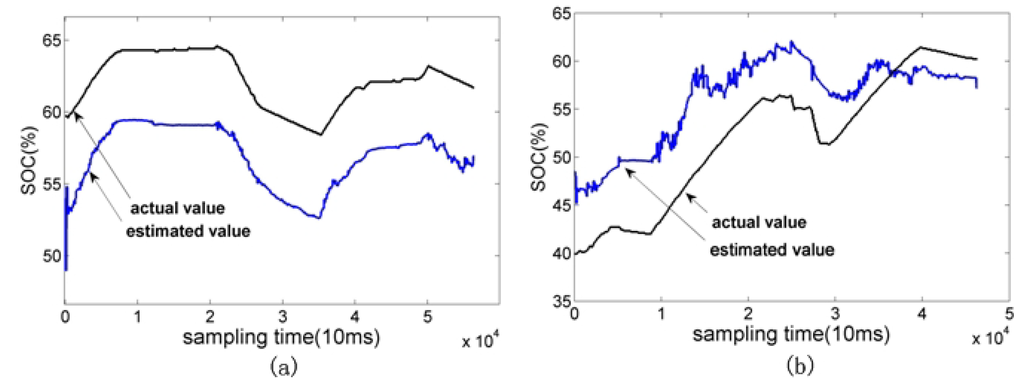
Figure 7.
The comparison between estimation value and actual value.
Figure 7.
The comparison between estimation value and actual value.
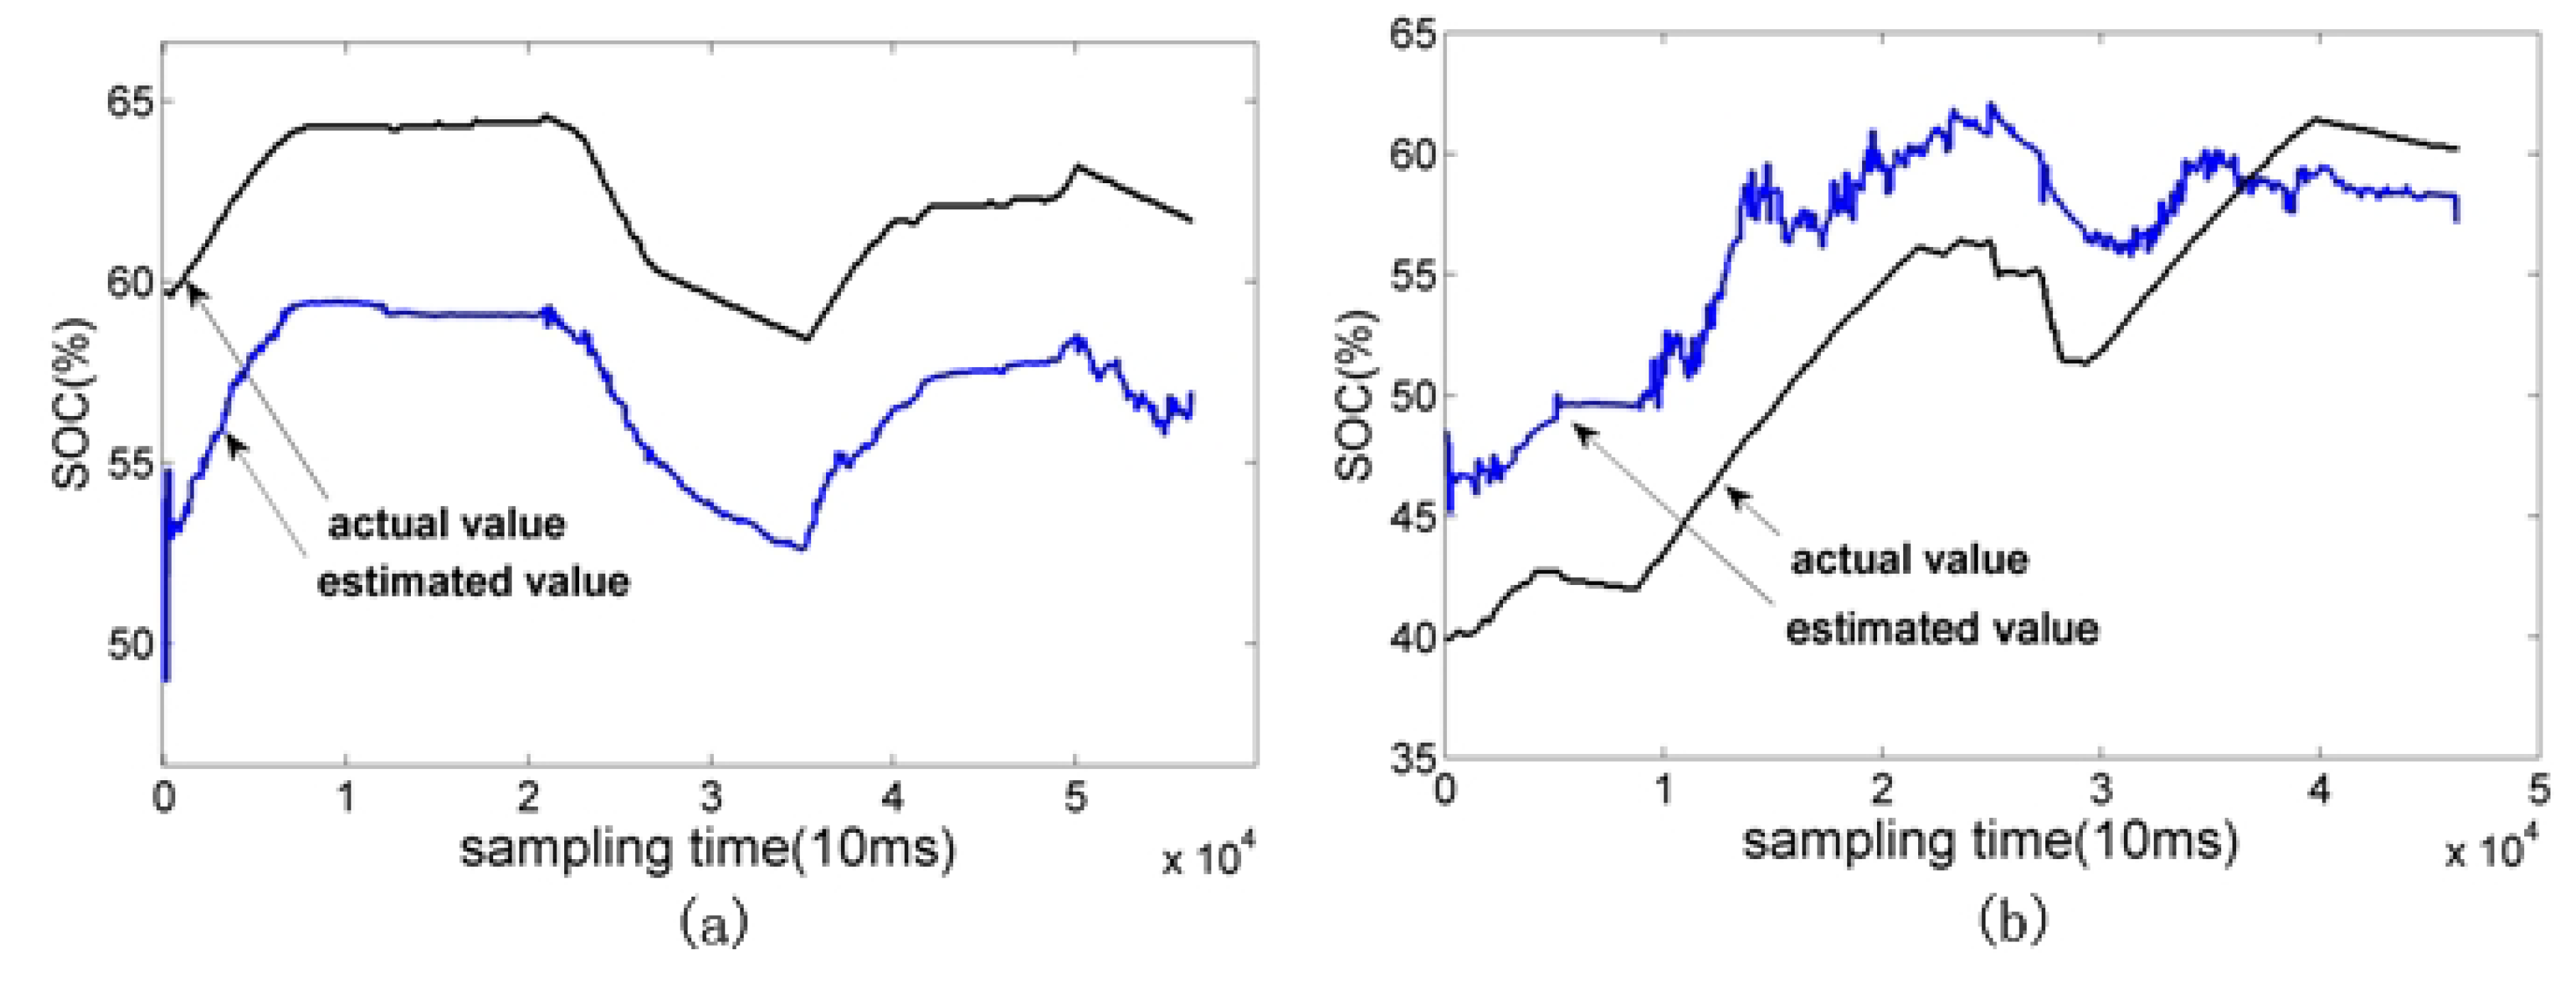
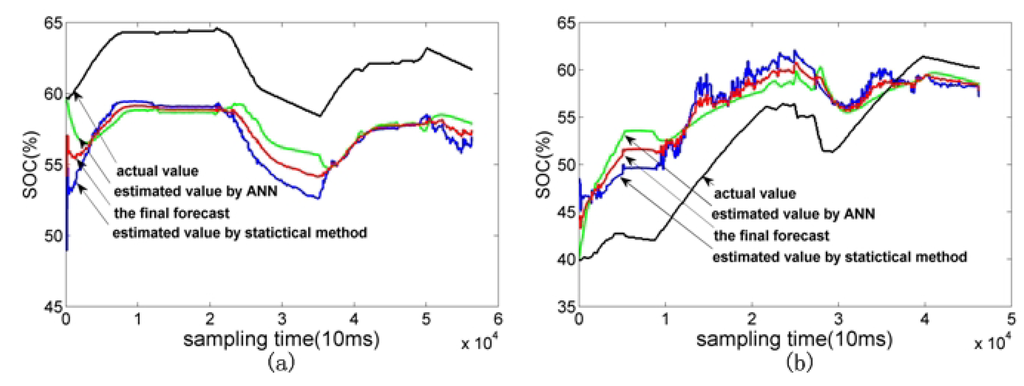
Figure 8.
The control diagram with SOC estimative values and actual values.
Figure 8.
The control diagram with SOC estimative values and actual values.
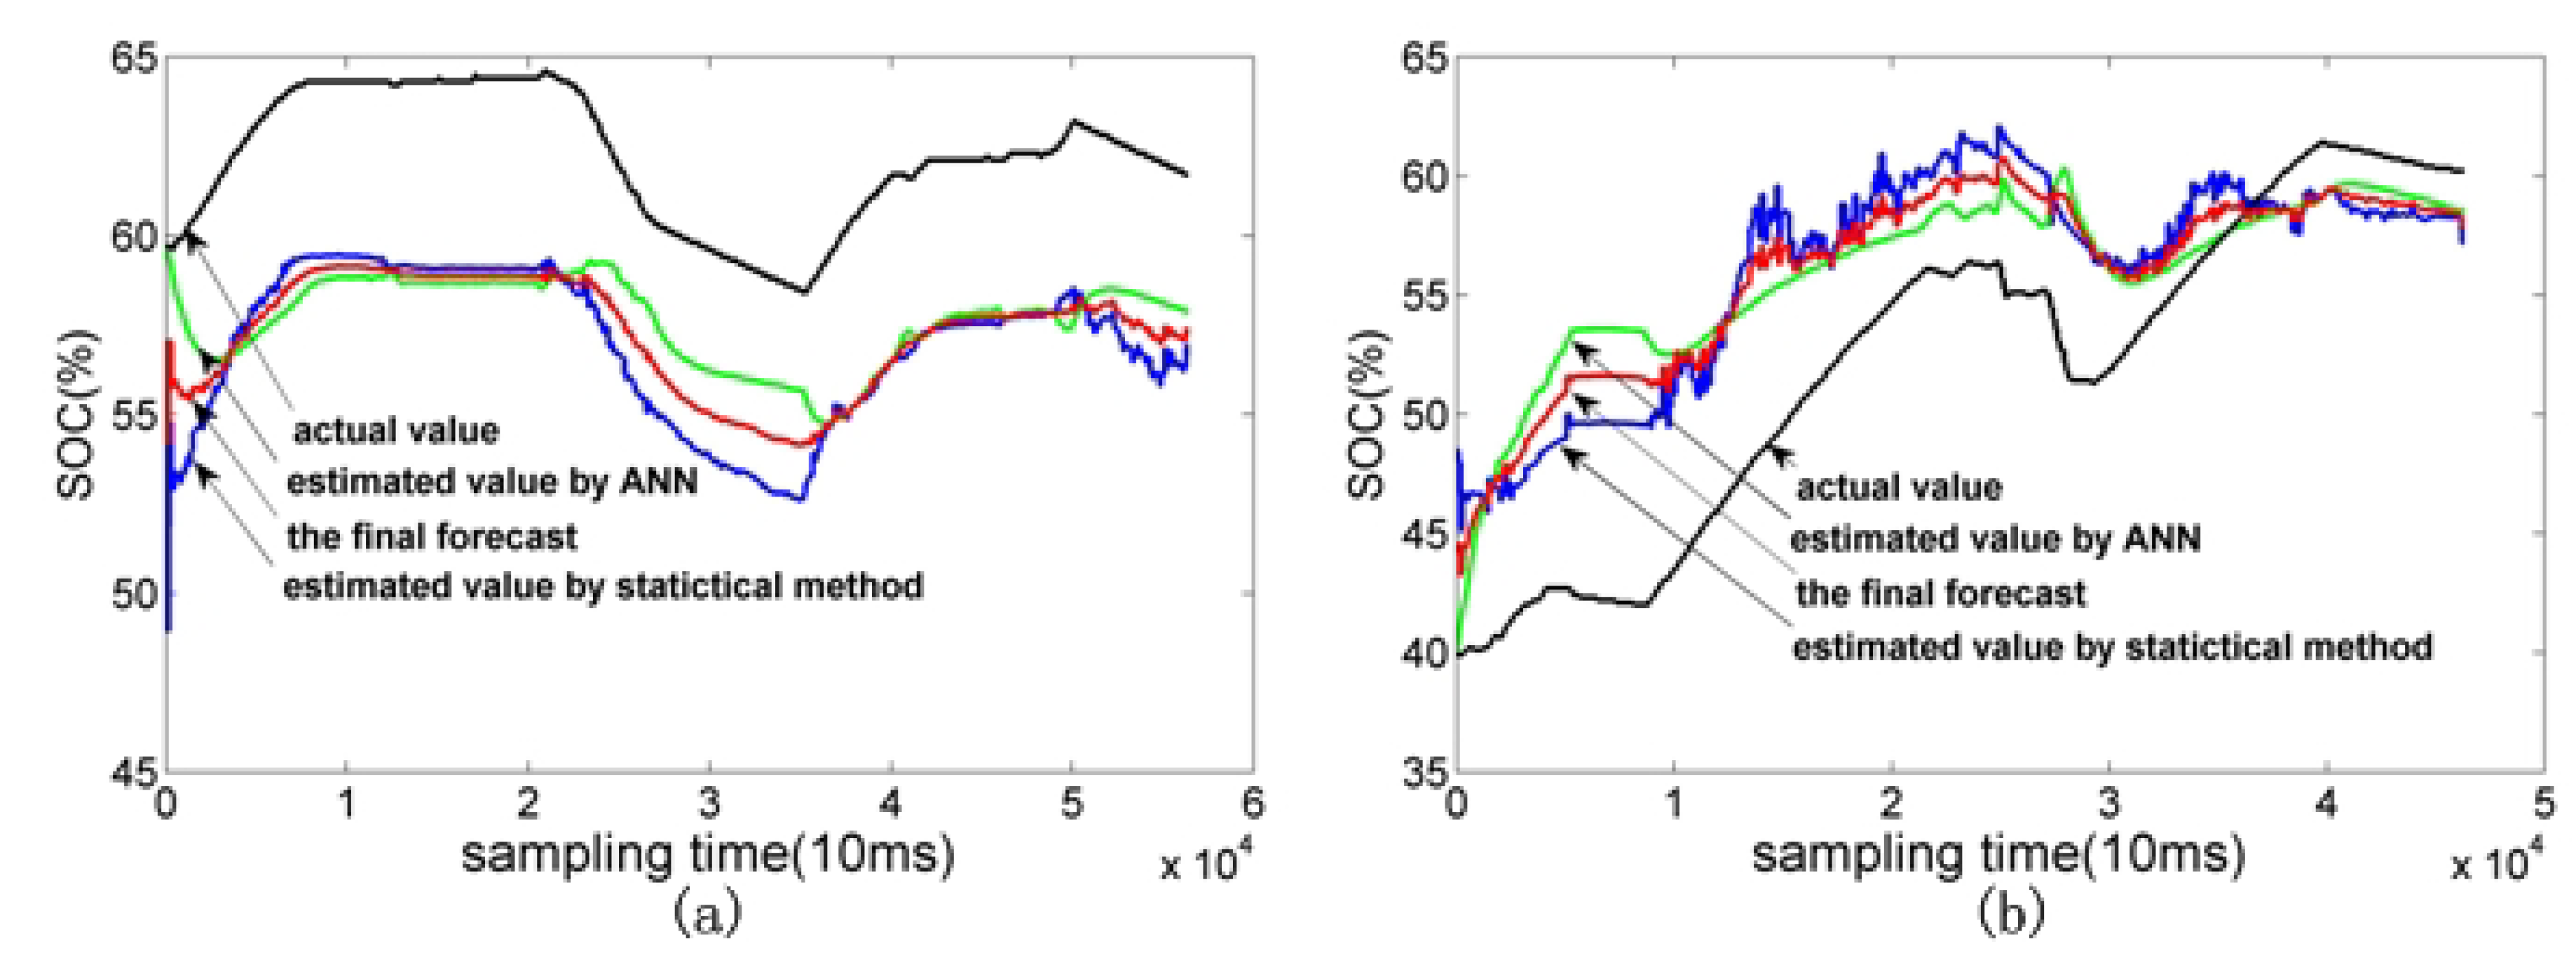
In order to avoid impacting results for the instability voltage and current, this paper uses the artificial neural network (ANN) which had been trained well to revise the result by weighted [13]. Firstly, we compare the ANN forecast average errors with statistical method. If the error is less than 1, the final forecast value is the average of the two estimated value, otherwise we increase the weight of estimated value that error is smaller. The final forecast value of SOC is shown in Figure 8. Forecast errors are shown in Table 4.

Table 4.
The average error of forecast value.
| the error before amendment | the error after amendment | |
|---|---|---|
| test sample 1 | 5.2% | 4.9% |
| test sample 2 | 4.8% | 4.6% |
The estimated value can trace target value very well in Figure 8. The average relative error of test sample 1 is 4.9%, and the average relative error of test sample 2 is 4.6%. So the correlation shown in Table 2 is relatively correct. We can obtain OCV by the statistical method and finally estimate the real-time SOC. This method is feasible.
6. Conclusions
This paper estimates some important parameters of Ni-MH battery such as on-line resistance, OCV and SOC. As a power, Ni-MH battery’s charge and discharge current have a large dispersion. Based on this feature, the statistical method can calculate the Ni-MH battery’s real-time resistance effectively in different conditions. The relative error is influenced by the dispersion and the symmetry of charging and discharging current. The better the symmetry of charging and discharging current is, the smaller the relative error will be. The overall results of this experiment show that the errors are small and the method is feasible and accurate.
Acknowledgements
This work is supported by the Natural Science Foundation Project of CQ CSTC 2008BB6084 and 2008AA6025.
References and Notes
- Hou, X.; Xue, J.; Nan, J. The cycle life performance of MH-Ni batteries for high power applications. Acta Sci. Natur. Univ. Sunyats. 2005, 44, 77–80. [Google Scholar]
- Verbrugge, M. Adaptive multi-parameter battery state estimator with optimized time-weighting factors. J. Appl. Electrochem. 2007, 37, 605–616. [Google Scholar] [CrossRef]
- Wei, X.; Xu, W.; Shen, D. Internal resistance identification of Li-ion battery and its application in battery life estimation. Chin. J. Power Sources 2009, 33, 217–220. [Google Scholar]
- Buchmann, I. Batteries in a Portable World, 2nd ed.; Cadex Electronics Inc Press: Richmond, BC, Canada, 2001; pp. 81–84. [Google Scholar]
- Piller, S.; Perrin, M.; Jossen, A. Methods for state-of-charge determination and their applications. J. Power Sources 2001, 96, 113–120. [Google Scholar] [CrossRef]
- Johnson, V.H. Battery performance models in advisor. J. Power Sources 2002, 110, 321–329. [Google Scholar] [CrossRef]
- Lin, C.; Qiu, B.; Chen, Q. A comparative study on power input equivalent circuit model for electric vehicle battery. Automot. Eng. 2006, 28, 229–234. [Google Scholar]
- Verbrugge, M.; Tate, E. Adaptive state of charge algorithm for nickel metal hydride batteries including hysteresis phenomena. J. Power Sources 2004, 126, 236–249. [Google Scholar] [CrossRef]
- Felder, R.M.; Rousseau, R.W. Elementary Principles of Chemical Processes, 3rd ed.; John Wiley & Sons press: New York, NY, USA, 1978; pp. 501–503. [Google Scholar]
- QC/T 744-2006, Nickel Metal Hydride Power Battery of EV; Development & Reform Commision of China press: Beijing, China, 2006.
- Hu, J.; Shui, J.; Guo, C. MH/Ni battery discharge performance test research of hybrid electric vehicle. J. Chongqing Univ. 2007, 30, 1–6. [Google Scholar]
- Bian, Z. Pattern Recognition, 2nd Ed. ed; Tsinghua University Press: Beijing, China, 2002; pp. 88–89. [Google Scholar]
- Cai, C.; Du, D.; Liu, Z.; Ge, J. State of charge estimation of high power NI-MH rechargeable battery with artificial neural network. In Proceedings of the 9th International Conference on Neural Information, Singapore, November 2002; pp. 824–828.
© 2010 by the authors; licensee Molecular Diversity Preservation International, Basel, Switzerland. This article is an open access article distributed under the terms and conditions of the Creative Commons Attribution license (http://creativecommons.org/licenses/by/3.0/).
