1. Introduction
China has been considered as the largest carbon dioxide emitter in the World since 2007 [
1]. Certainly, along with the consumption structure upgrade and urbanization in the future, the amount of GHG emissions in China is expected to increase further [
2]. All these facts reflect the unprecedented emergency of GHG emission control and mitigation in the Chinese economy. Before any effective mitigation measures can be undertaken, a clear understanding of the current emission status and situation must be obtained first. In addition to the direct GHG emission mitigation for prominent industries, there is also a need to make policies by identifying the consumption-side mitigation polices that the emissions induced by the final demand [
3,
4].
To quantify and evaluate GHG emission patterns and structure for a society, only a small number of economic sectors considered are limited to reflect more detailed and complex network structure. As a commonly available economic model to describe the complicated network relationship and structure of economic sectors, input-output model originally introduced by Leontief to analyze the interdependence of economic sectors has been rigorously extended and widely used in the sectoral embodiment analysis of GHG emissions in general (e.g., [
4,
5,
6]). The concept of embodied emissions facilitates a deeper appreciation of the sectoral total emission requirements in terms of both the direct, visible and indirect, hidden emission cost, which appreciates the industry-specific features as well as the holistic societal structure. Extensive studies have been made to perform input-output analysis of GHG emissions in China, mainly focusing on CO
2 emission embodiment (e.g., [
7,
8,
9,
10,
11,
12,
13,
14,
15,
16]). The unique official GHG emission inventory of China pointed out that CH
4 emissions accounted for 19.4% of the total national-wide GHG emissions in terms of CO
2, CH
4 and N
2O in 1994 [
17]. Zhang and Chen [
18] reported that the total CH
4 emission of 26 industrial sectors by Chinese economy in 2007 is 39,592.7 Gg or 989.8 Mt CO
2-eq by the lower referred IPCC global warming potential (GWP), in magnitude of about one sixth of China’s CO
2 emission from fuel combustion and greater than CO
2 emissions from fuel combustion of many economically developed countries such as UK, Canada, and Germany. Only considering the CO
2 emissions cannot reflect the real situation and full-scale picture of China’s GHG emissions, especially in terms of sectoral structure and embodiment in final consumption and international trade [
3]. Prominent studies about the embodiment of China’s GHG emissions were systematically conducted by Chen and co-workers in their multi-scale ecological input-output analysis (IOA) of environmental emissions. In his doctoral dissertation Zhou [
19] presented two sets of databases for embodiment intensity of GHG emissions, one for the Chinese economy in 1992 under the Material Product System (MPS) for planning economies of the Soviet socialist style and another for the Chinese economy in 2002 under the System of National Accounts (SNA) for marketing economies; Chen
et al. [
20] and Chen and Chen [
21] afterwards accounted for the GHG emission embodiment in the Chinese economy in 2005 and 2007, respectively; Chen and Chen [
22] simulated the GHG emission embodiment in the global economy 2000, referring to Chinese economy; in particular, Chen and Zhang [
3] provided a concrete GHG emission inventory of Chinese economy 2007 to cover all the main anthropogenic sources of CO
2, CH
4 and N
2O, and presented a detailed input-output analysis for the GHG emission embodiment in final consumption and international trade. These studies have contributed to direct and indirect GHG emission estimation and related assessment for mitigation potential in China.
It is worth noting that in order to account for the equivalent CO
2 (CO
2-eq.) emissions, one typical scheme has been applied extensively in most previous studies, which is based on the commonly referred IPCC Global Warming Potentials (GWPs) over a time horizon of 100 years. In fact, the indicator of GWP based on simplified radiation models has various GWP values over different time horizons even for the same greenhouse gas [
23]. Furthermore, the GWP indicator is merely one kind of evaluation method for GHG emissions. There are several other typical equivalent indicators based on different evaluation models to assess GHG emissions. The Global Thermodynamic Potential (GTP) indicator derived from chemical exergy model is one option, which has been gradually accepted as a unified measure for GHG emissions in recent years.
Defined as the maximum amount of work which can be produced by a system as it comes to equilibrium with a reference environment [
24,
25,
26] to represent the physical deviation between the system and the reference environment, the concept of exergy based on the first two laws of thermodynamics provides us with an ideal unified measure for various environmental emissions as a consistent and objective assessment [
27,
28,
29,
30,
31,
32]. All emissions have definable, calculable and additive exergy contents with respect to the defined reference environment. Wall [
24,
33] further suggested exergy as a suitable measure of environmental impact of waste emissions and asserted that all utilization of resources and disposal of waste products affect nature and the effect is strongly related to the amount of exergy in the utilized resource or the disposed waste [
34]. Ayres [
35] stated that non-zero exergy can be regarded as the potential for doing harm by driving uncontrolled reaction in the environment. Rosen and his colleagues [
25,
27,
36,
37,
38,
39] have illustrated the meaning of exergy to environmental emissions. The total exergy of an emission is the physicochemical work absorbed by the environment in order to equilibrate the substances of the emission with the standard environment [
31]. In other words, the exergy emitted represents a driving potential, hence causing environmental damage, particularly when released on a large scale into the environment [
27,
33,
40]. With the global reference environment model initiated by Szargut [
28], exergy has been taken as a physical indicator for the potential environmental effect on the biophysical earth in general and geochemical sphere in particular [
28,
29]. Exergy-based unifying assessment for the environmental emissions of typical social sectors [
30,
34,
41] and social systems [
42,
43,
44] has been extensively performed in recent years. Furthermore, the indicator of Global Thermodynamic Potentials based on the chemical exergy model has been used to compare the thermodynamic departure between the GHG emission and its surrounding relative to carbon dioxide in terms of carbon dioxide equivalents [
18,
21,
22,
44].
Rational and significant evaluation for environmental emissions from different angles of view can be carried out based on single or multi-disciplinary evaluation methods [
45]. Besides the emission embodiment based on the GWPs, further research coupled with other emission equivalent evaluation will provide a more sound theoretical basis for making and analyzing GHG emission embodiment for the Chinese economy. The target of this paper is to consider the Global Thermodynamic Potential indicator to perform a unified GTP-based emission assessment of the three most commonly considered GHGs,
i.e., CO
2, CH
4 and N
2O, and to systematically reveal the emission embodiment in production, consumption, and international trade of the Chinese economy in 2007 as the most recent year with available input-output tables and updated inventory data.
The main context of this paper is organized as follows. In
Section 2, we describe the GTP calculation methodology, input-output analysis, and data sources.
Section 3 and
Section 4 present the direct GHG emission and embodied GHG emission analysis, respectively, and corresponding analysis results are discussed. Finally, main conclusions will be drawn in
Section 5.
3. Direct GHG Emissions
Based on the Global Thermodynamic Potentials (CO
2:CH
4:N
2O=1:115.51:5.33), direct GHG emissions by emission type and sector category are calculated and shown in
Table 3. The estimated total direct GHG emissions by the Chinese economy in 2007 amount to 10,657.5 Mt CO
2-eq, of which the CO
2 emission contributes 6324.4 Mt, CH
4 4328.8 Mt, and N
2O 4.25 Mt. As to the emission structure, CO
2 emissions from fuel combustion comprise 44.34%, CO
2 emissions from industrial process 15.00%, CH
4 emissions 40.62% and N
2O emissions 0.04%. The CH
4 emissions are in magnitude of the same importance as the CO
2 emissions.
Table 3.
GTP-based GHG emissions by Chinese economy 2007 by sector (Mt CO2-eq).
Table 3.
GTP-based GHG emissions by Chinese economy 2007 by sector (Mt CO2-eq).
| Sector | CO2 (Fuel Combustion) | CO2 (Industrial Processes) | CH4 | N2O | GHGs |
|---|
| 1 | 107.6 | | 1832.6 | 3.50 | 1943.7 |
| 2 | 90.7 | | 2035.5 | 0.01 | 2126.2 |
| 3 | 47.0 | | 76.6 | 0.00 | 123.6 |
| 4 | 9.1 | | 0.7 | 0.00 | 9.8 |
| 5 | 9.3 | | 0.2 | 0.00 | 9.5 |
| 6 | 46.9 | | 65.4 | 0.00 | 112.3 |
| 7 | 31.9 | | 28.3 | 0.00 | 60.2 |
| 8 | 7.1 | | 5.8 | 0.00 | 12.9 |
| 9 | 7.2 | | 0.3 | 0.00 | 7.5 |
| 10 | 31.7 | | 40.9 | 0.00 | 72.6 |
| 11 | 144.6 | | 4.2 | 0.01 | 148.8 |
| 12 | 237.0 | 105.8 | 19.1 | 0.41 | 362.3 |
| 13 | 342.9 | 683.9 | 1.1 | 0.03 | 1028.0 |
| 14 | 223.6 | 808.4 | 3.5 | 0.02 | 1035.5 |
| 15 | 10.7 | | 0.4 | 0.00 | 11.1 |
| 16 | 39.0 | | 0.5 | 0.00 | 39.5 |
| 17 | 18.2 | | 0.4 | 0.00 | 18.6 |
| 18 | 6.5 | | 0.2 | 0.00 | 6.7 |
| 19 | 6.0 | | 0.6 | 0.00 | 6.6 |
| 20 | 0.9 | | 0.1 | 0.00 | 1.0 |
| 21 | 6.3 | | 0.6 | 0.00 | 6.9 |
| 22 | 2736.9 | | 4.5 | 0.23 | 2741.7 |
| 23 | 50.0 | | 50.6 | 0.00 | 100.6 |
| 24 | 388.1 | | 35.9 | 0.02 | 424.1 |
| 25 | 53.9 | | 35.2 | 0.00 | 89.1 |
| 26 | 73.1 | | 85.7 | 0.00 | 158.8 |
| Total | 4726.3 | 1598.1 | 4328.8 | 4.25 | 10,657.5 |
As to the CO2 emissions, direct emission of Sector 22 (Electric Power/Steam and Hot Water Production and Supply) amounts to 2736.9 Mt, up to 43.3% of the total, followed by those of Sector 14 (Smelting and Pressing of Ferrous and Nonferrous Metals) and Sector 13 (Nonmetal Mineral Products), accounting for 16.3% and 16.2%, respectively. Sector 2 (Coal Mining and Dressing) accounts for 47.0% of the total CH4 emissions, followed by Sector 1 (Agriculture) for 42.3%. Sector 1 (Agriculture) is also the leading N2O emission sector, accounting for 82.4% of the total N2O emissions, followed by Sector 12 (Chemical Products Related Industry) for 9.6%, and Sector 22 for 5.4%.
In total the five sectors numbered 1, 2, 13, 14 and 22 are responsible for 83.3% of the total GHG emissions. Among these five sectors, Sector 22 is the largest emitter, with 25.7% of the total GHG emissions, mainly due to massive CO2 emissions from coal combustion to produce electricity. Owing to their massive CH4 emissions and the higher GTP 115.51 in comparison with 1 to CO2, Sectors 1 and 2 contribute 18.2% and 20.0% of the total GHG emissions, respectively. Owing to massive CO2 emissions from industrial processes, Sector 14 and Sector 13 contribute 9.7% and 9.6% of the total GHG emissions, respectively.
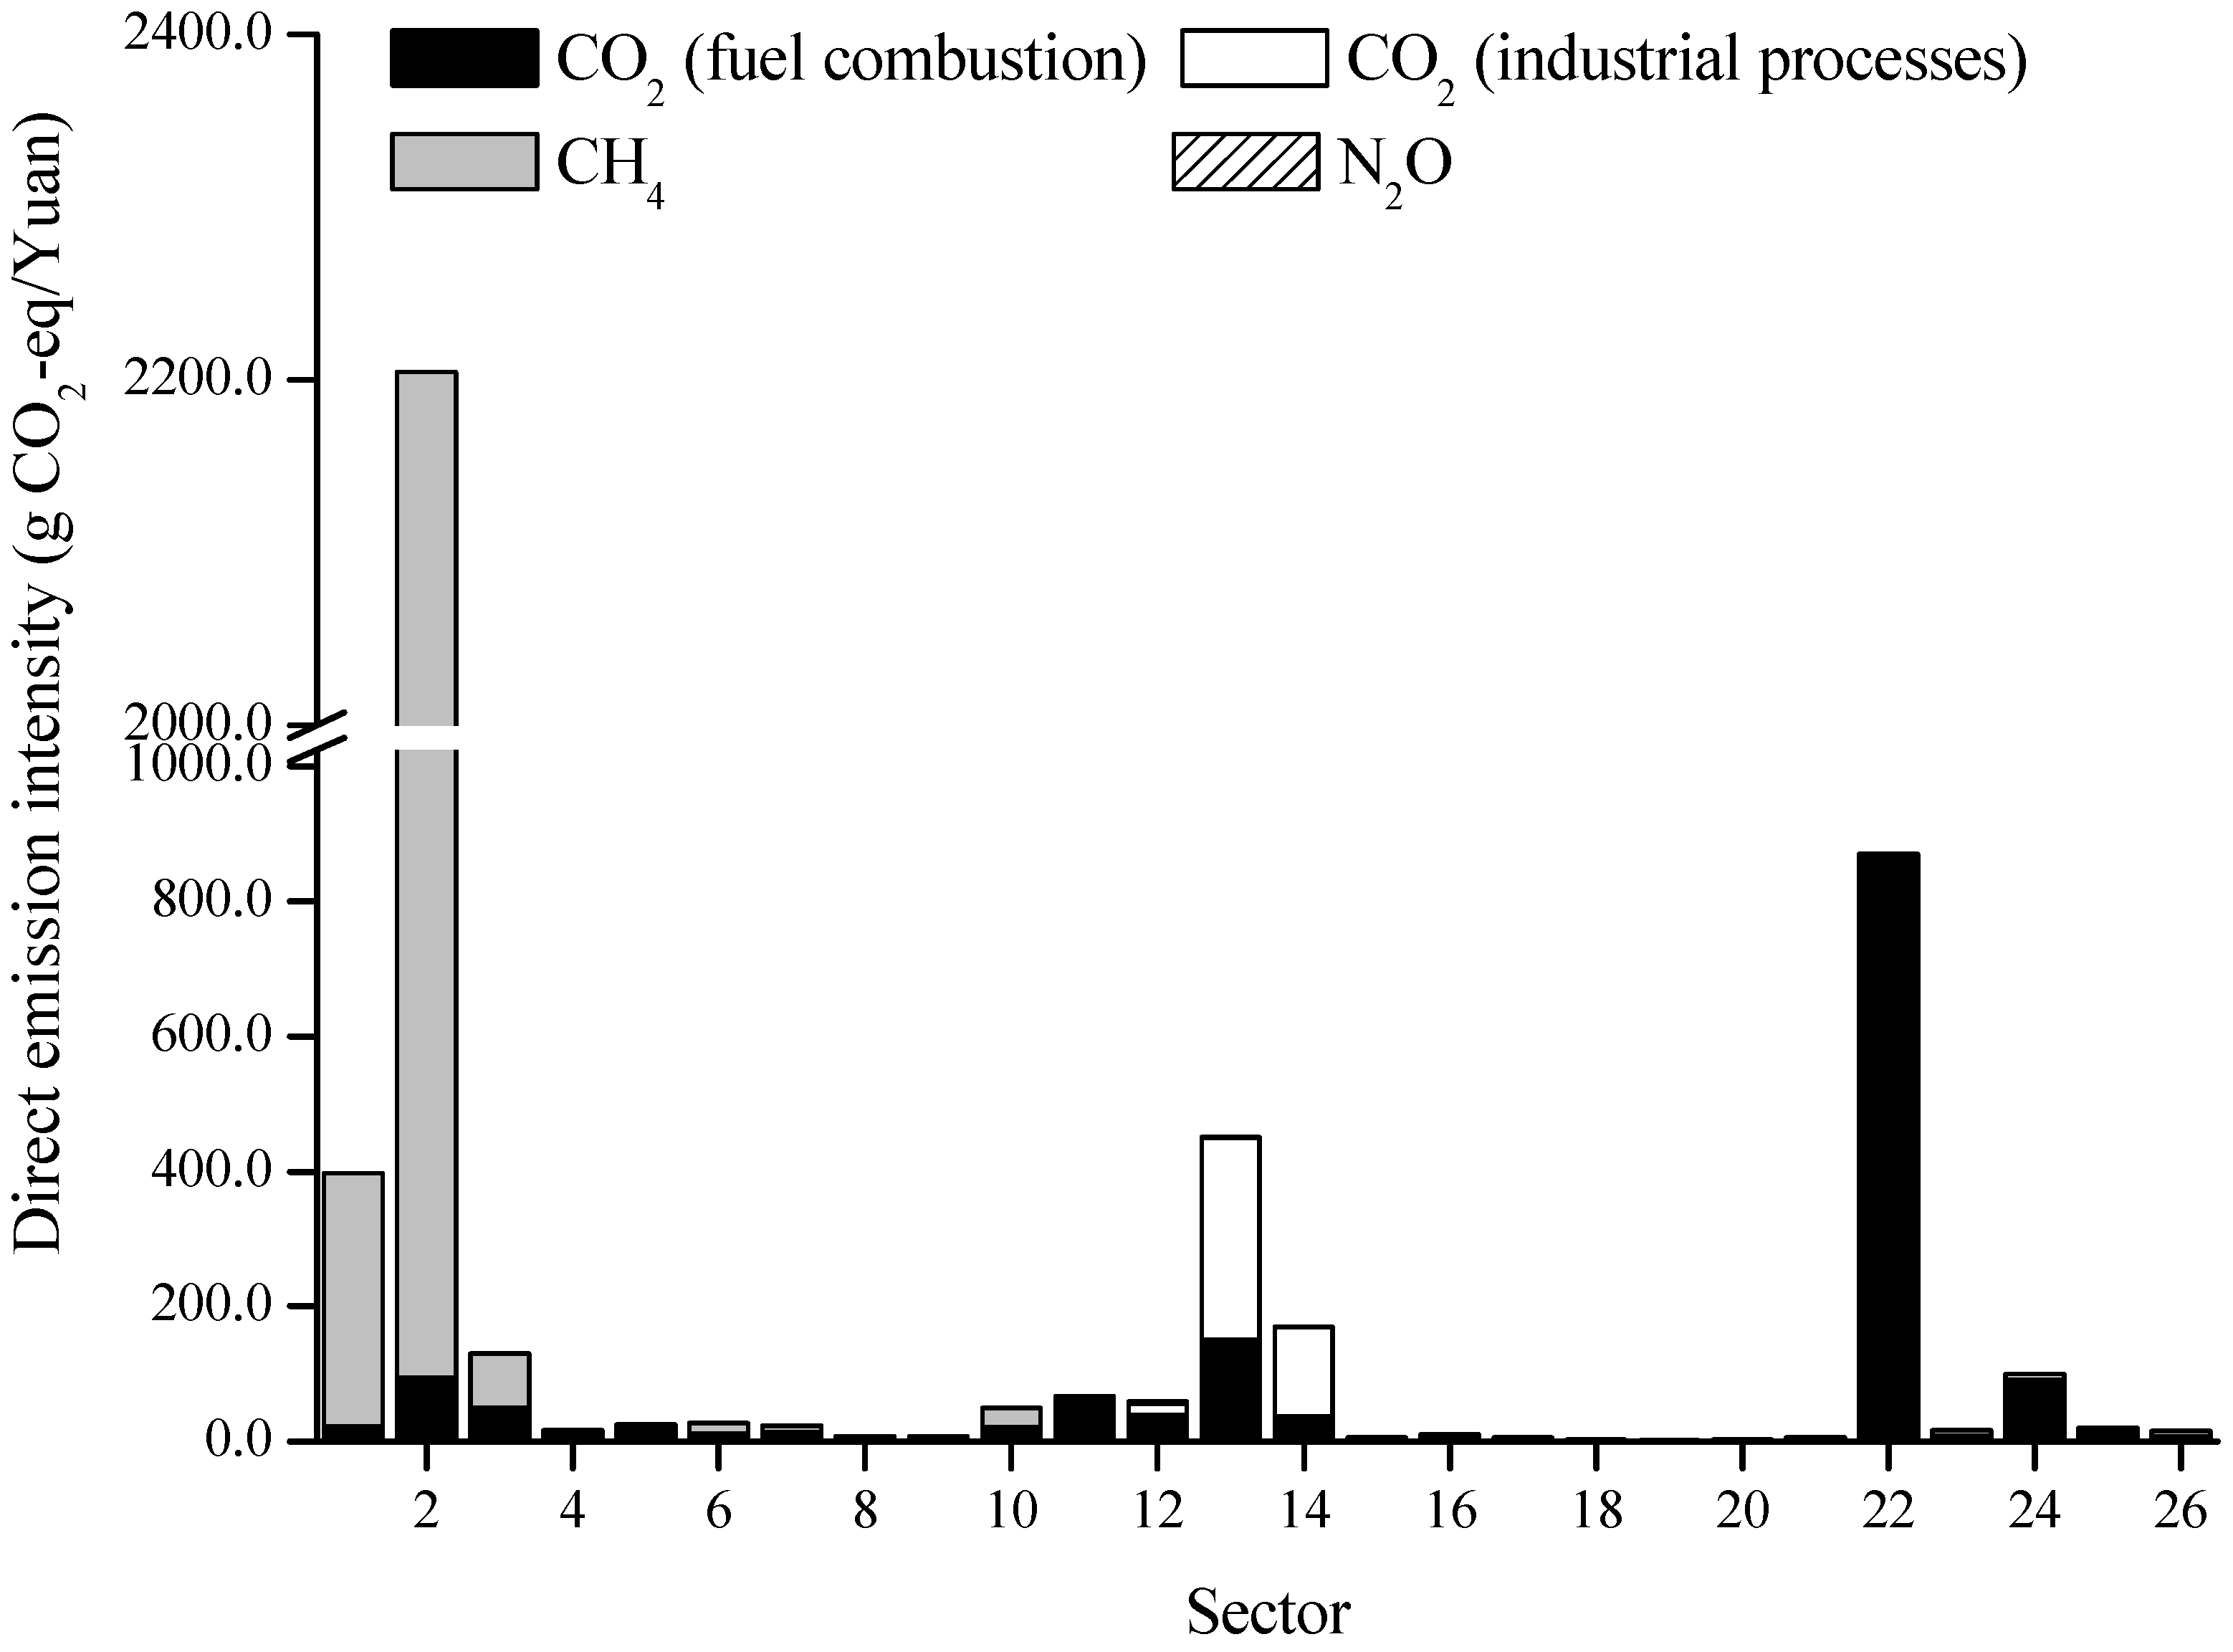
Direct emission intensity indicates the direct emission per RMB Yuan of industrial output. As shown in
Figure 1, the direct GHG emission intensity of Sector 2 (2204.5 g CO
2-eq/Yuan) is much larger than those of the other sectors, owing to its high CH
4 emission intensity. Prominently, CO
2 emissions from fuel combustion dominate the direct GHG emission intensity of Sector 22, which has a direct emission intensity of 870.8 g CO
2-eq/Yuan, only less than that of Sector 2. Sector 13 represents another pattern for high direct GHG emission intensity due to its massive CO
2 emissions from industrial processes, with a direct GHG emission intensity of 450.8 g CO
2-eq/Yuan. CH
4 emissions are the main emission type in Sector 1, which has a direct GHG emission intensity of 397.5 g CO
2-eq/Yuan.
Figure 1.
Direct GHG emission intensities by emission type.
Figure 1.
Direct GHG emission intensities by emission type.


