The Health Impacts of Ethanol Blend Petrol

Abstract
:
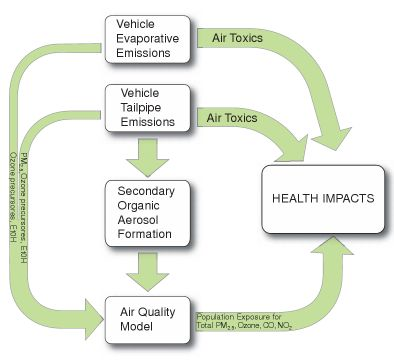
1. Background
- (1)
- Measuring Exhaust Emissions
- (2)
- Measuring Evaporative Emissions
- (3)
- Quantifying Secondary Particle Formation
- (4)
- Impacts of E5 and E10 on Photochemical Smog
- (5)
- Health Impacts of E5 and E10
2. Method
3. Summary of Testing Results
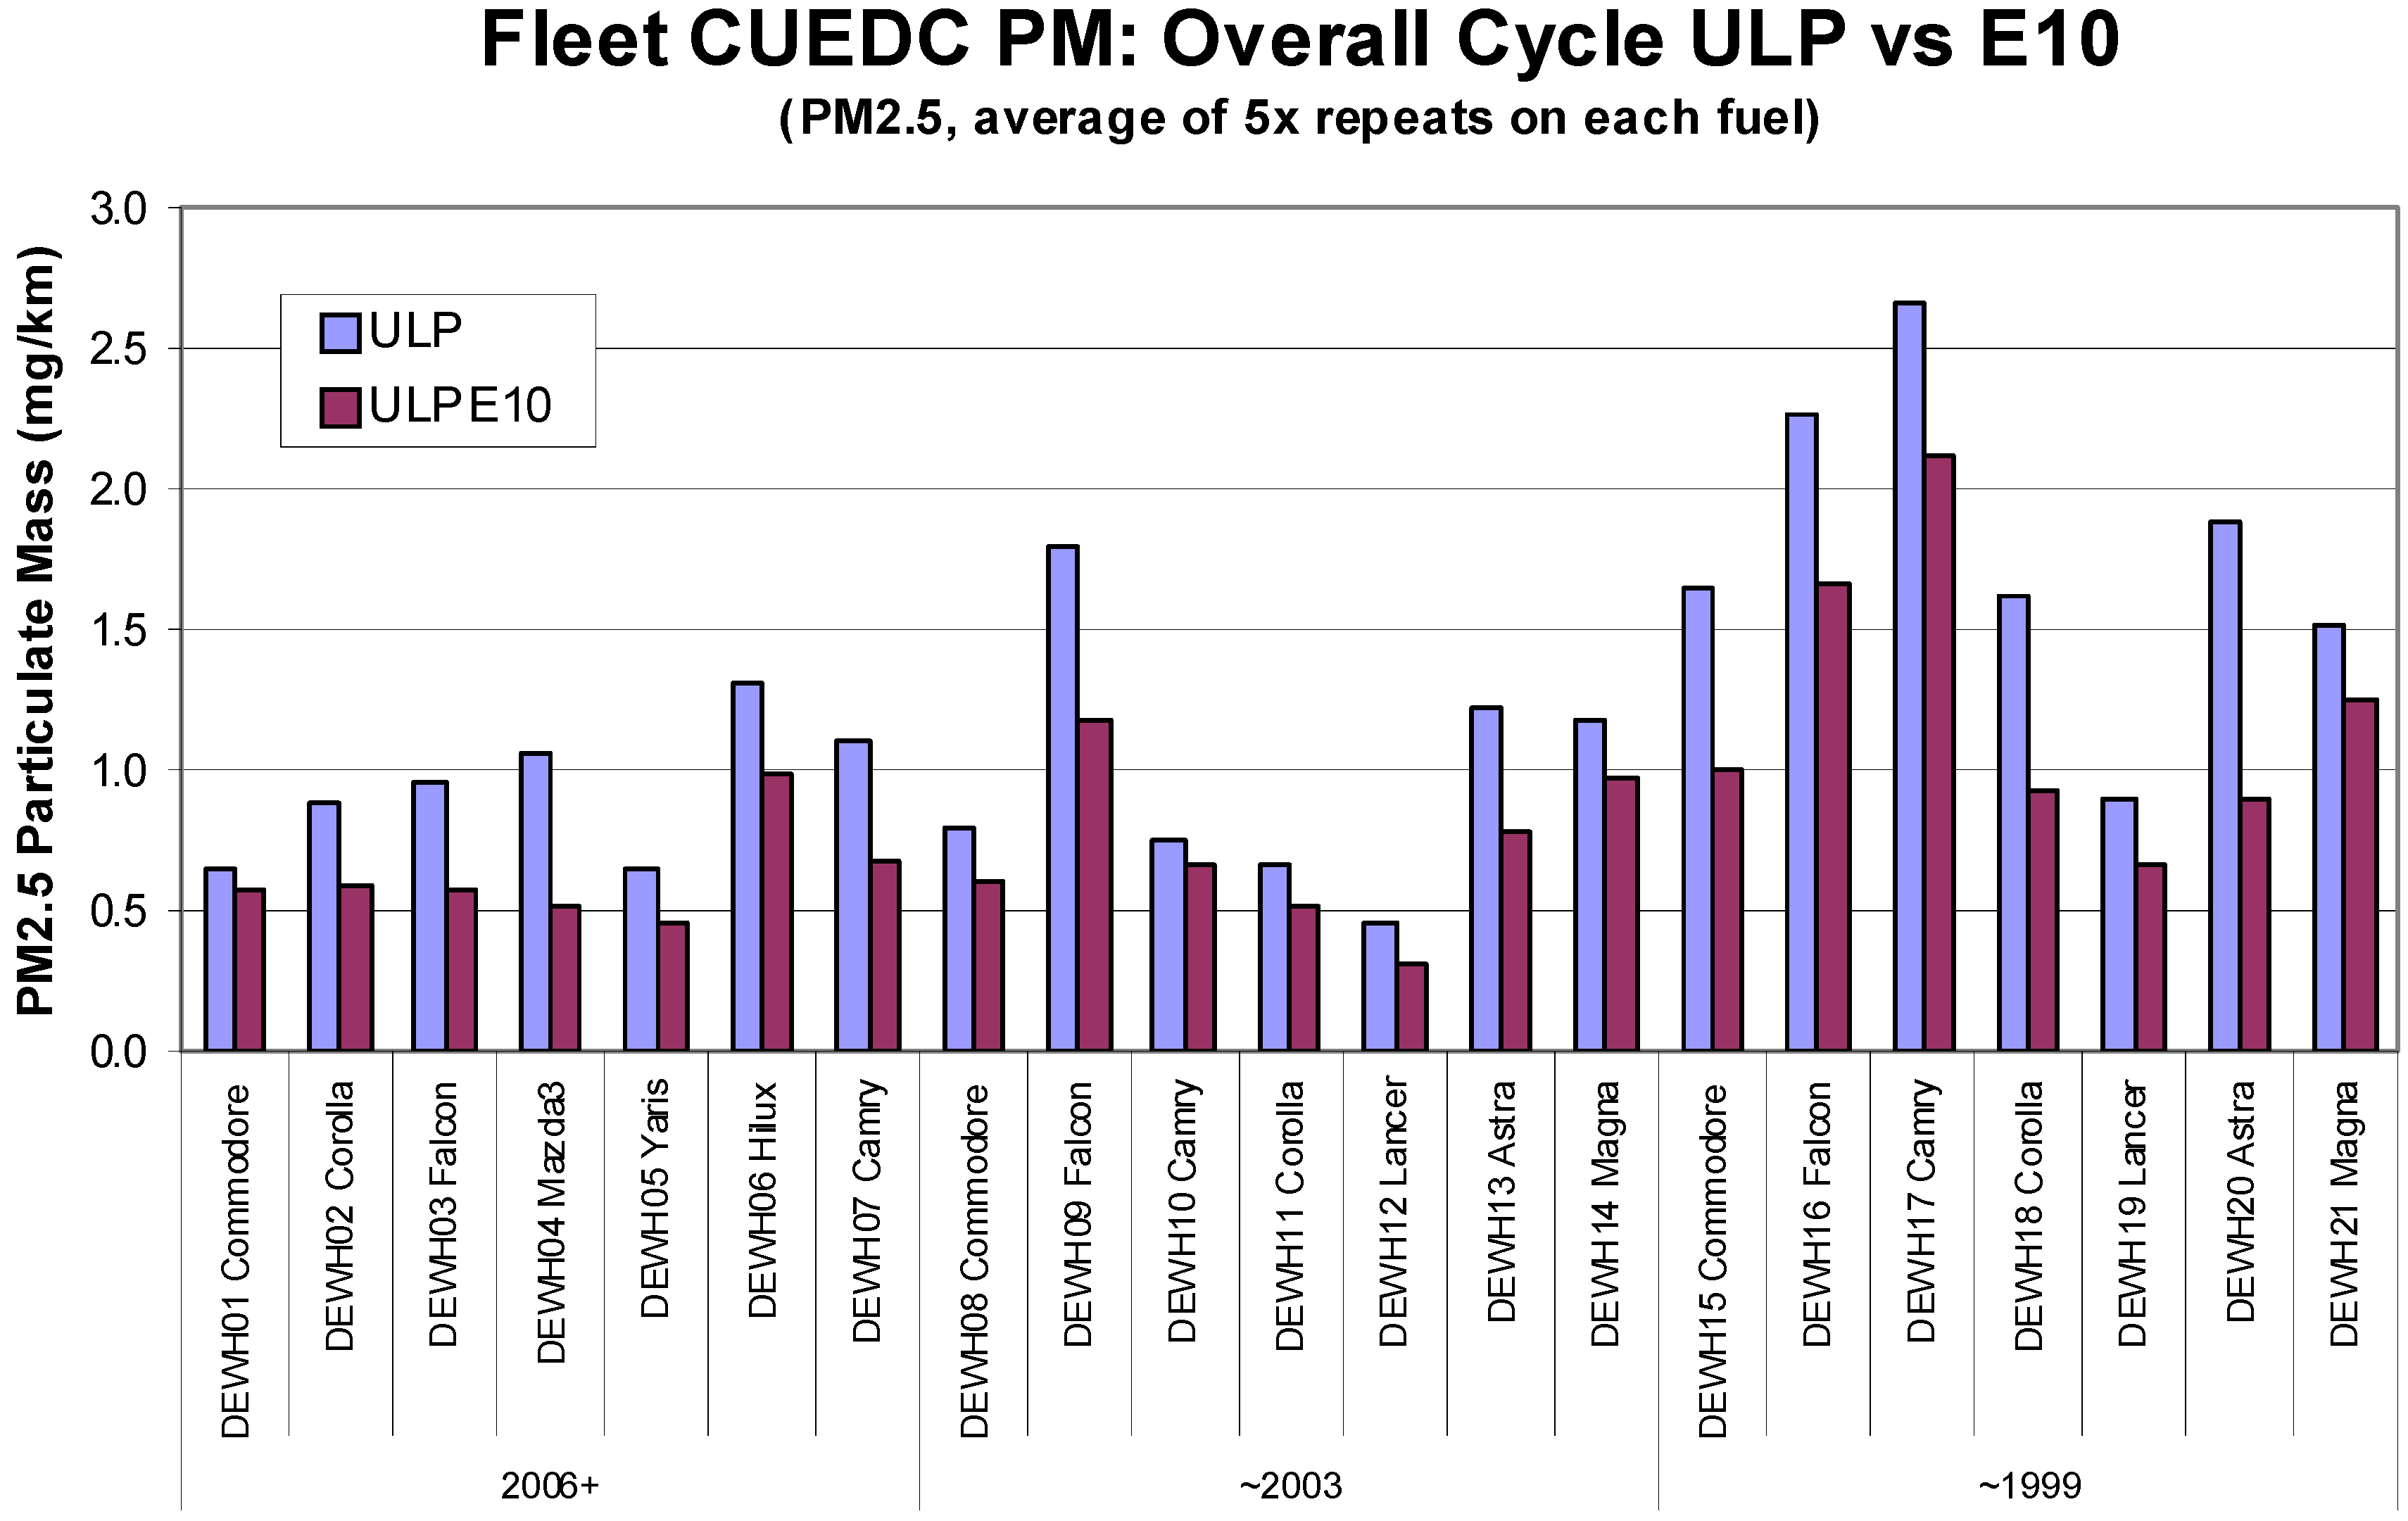
3.1. Measurement of Exhaust Emissions

3.2. Measurement of Evaporative Emissions
3.3. Secondary Organic Aerosol
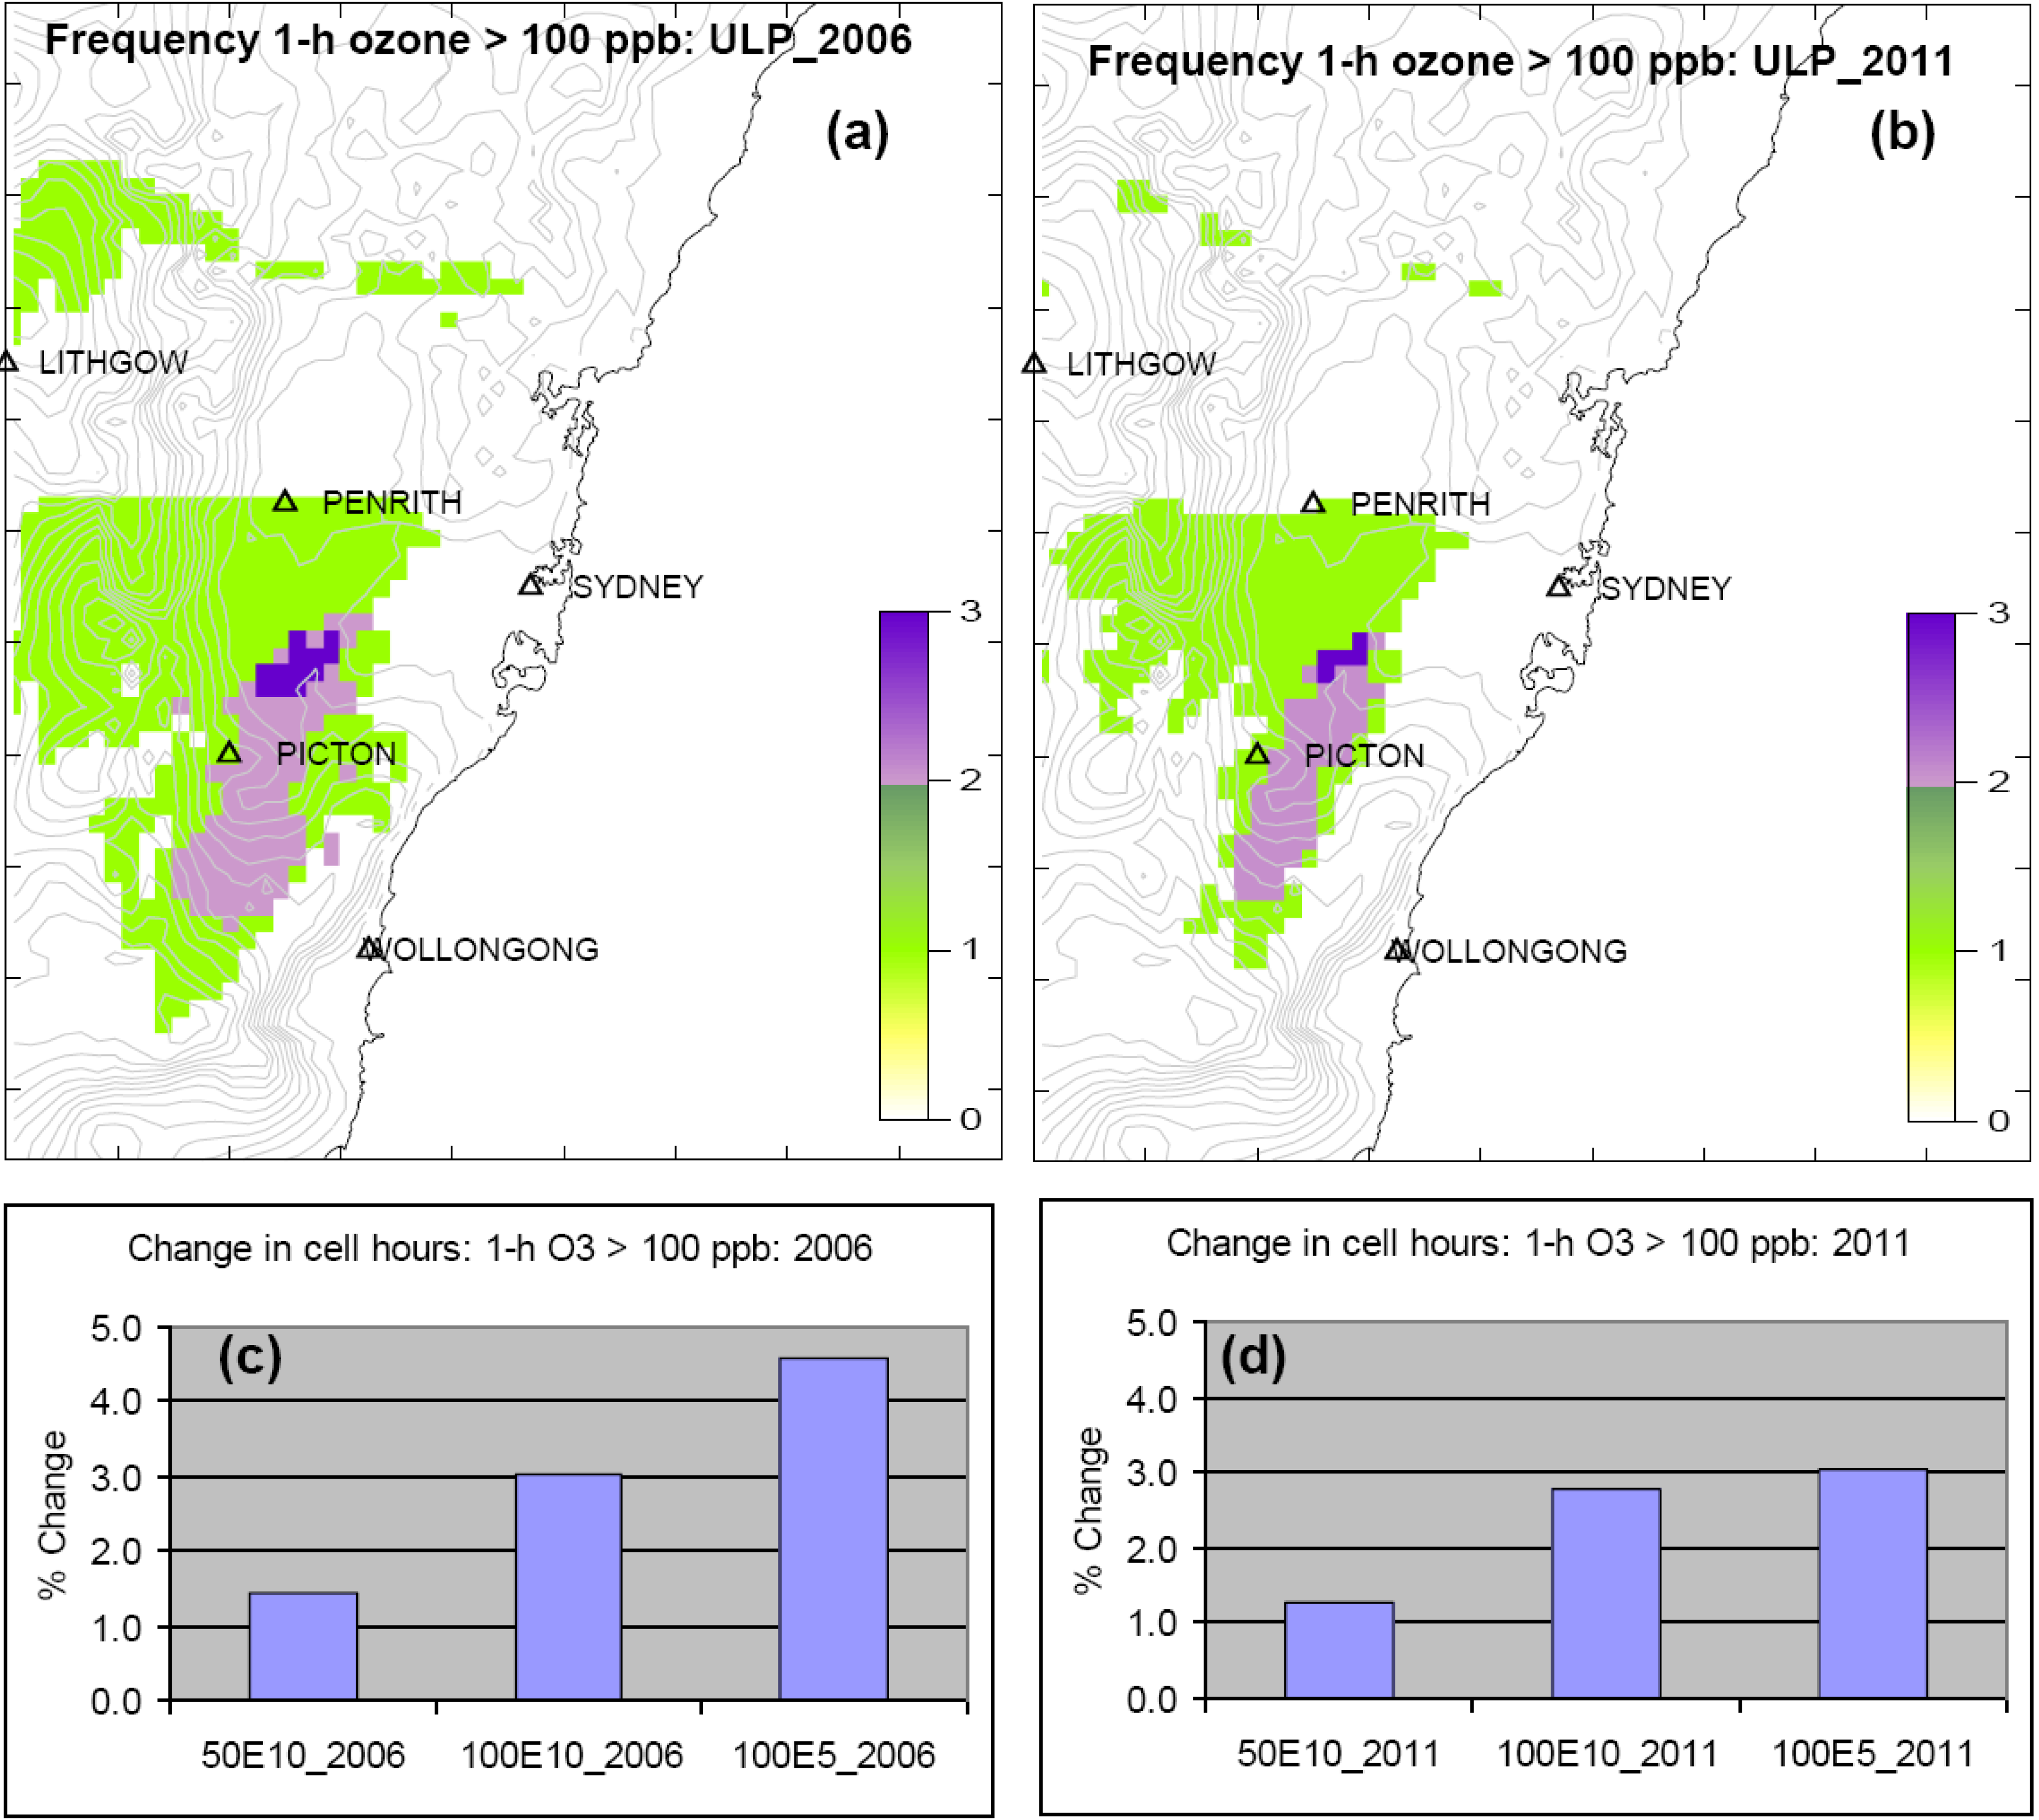
3.4. Impacts on Photochemical Smog
- Calculate 1-hour average (the native averaging time of TAPM-CTM) pollutant concentration fields for O3, NO2, CO and PM2.5 for an E5/E10 scenario and for the corresponding ULP baseline scenario.
- Generate multi-hour average concentration fields as appropriate for the health assessment.
- Using the prescribed concentration thresholds and a population data base for Sydney, calculate the relative health impact metrics.
- Use the metrics generated in step 3 to scale an existing peer-reviewed health impact assessment for Sydney for each of the criteria pollutants.


4. Health-Impact Basis
- Determine the baseline health impact associated with the particular pollutant being examined. If these are available from a recent official Australian Government Publication then those baselines will be used. If not then the baselines need to be calculated.
- (a) In the case of air toxics, determine the increment or decrement to the baseline emissions as a result of the use of E5, and as a result of the use of E10 on the basis of the experimental results obtained from this study; (b) In the case of particulate matter and criteria pollutants, determine the increment or decrement to the baseline exposure (which is calculated as the population-weighted airshed concentration) as a result of the use of E5, and as a result of the use of E10 on the basis of the modelling results obtained from this study.
- Having determined the increment or decrement to the baseline emissions or to the baseline exposure, this increment (or decrement) is applied to the baseline health impact to determine the change in health impact arising from the use of E5 and/or E10.
5. Value of a Statistical Life
6. Health Impact Results
6.1. Particulate Matter (PM)
6.1.1. Baseline

| Location | 2006 Results
(Based on February) | 2006 Annual Run | 2011 Results
(Based on February) | ||||
|---|---|---|---|---|---|---|---|
| 50% E10 | 100% E10 | 100% E5 | 100% E5 | 50% E10 | 100% E10 | 100% E5 | |
| Sydney | −15.7
(−5.5 to −32.5) | −31.0
(−10.8 to −64.1) | −25.2
(−8.7 to −52.1) | −22.7
(−5.4 to −50.6) | −7.85
(−2.7 to −16.2) | −16.8
(−5.8 to −34.7) | −15.3
(−5.3 to −31.6) |
| Urban Australia * | −38.5 (−13.3 to −78.8) | −75.8 (−25.9 to −155) | −61.6 (−21.4 to −127) | −55 (−13 to −122) | −19.5 (−6.7 to −40.0) | −41.6 (−14.3 to −85.5) | −37.9 (−13.1 to −77.8) |
| Area | Short Term Health Endpoint | Long Term Health Endpoint | |||||||
|---|---|---|---|---|---|---|---|---|---|
| Mortality | Hospital Admissions | Mortality | |||||||
| All cause | Respiratory | CV | Asthma | Cardio-vascular | COPD | All cause | Lung Cancer | COPD | |
| Sydney | 286 | 85 | 57 | 164 | 257 | 61 | 729 | 92 | 550 |
| 95% CI Low | 163 | 52 | 8 | 64 | 152 | 13 | 250 | 28 | 191 |
| 95% CI High | 406 | 119 | 105 | 262 | 361 | 113 | 1291 | 142 | 932 |
| Urban Australia * | 701 | 214 | 140 | 333 | 574 | 103 | 1770 | 214 | 1205 |
| 95% CI Low | 402 | 132 | 20 | 130 | 345 | 21 | 614 | 67 | 424 |
| 95% CI High | 1001 | 299 | 261 | 536 | 816 | 196 | 3178 | 337 | 2071 |
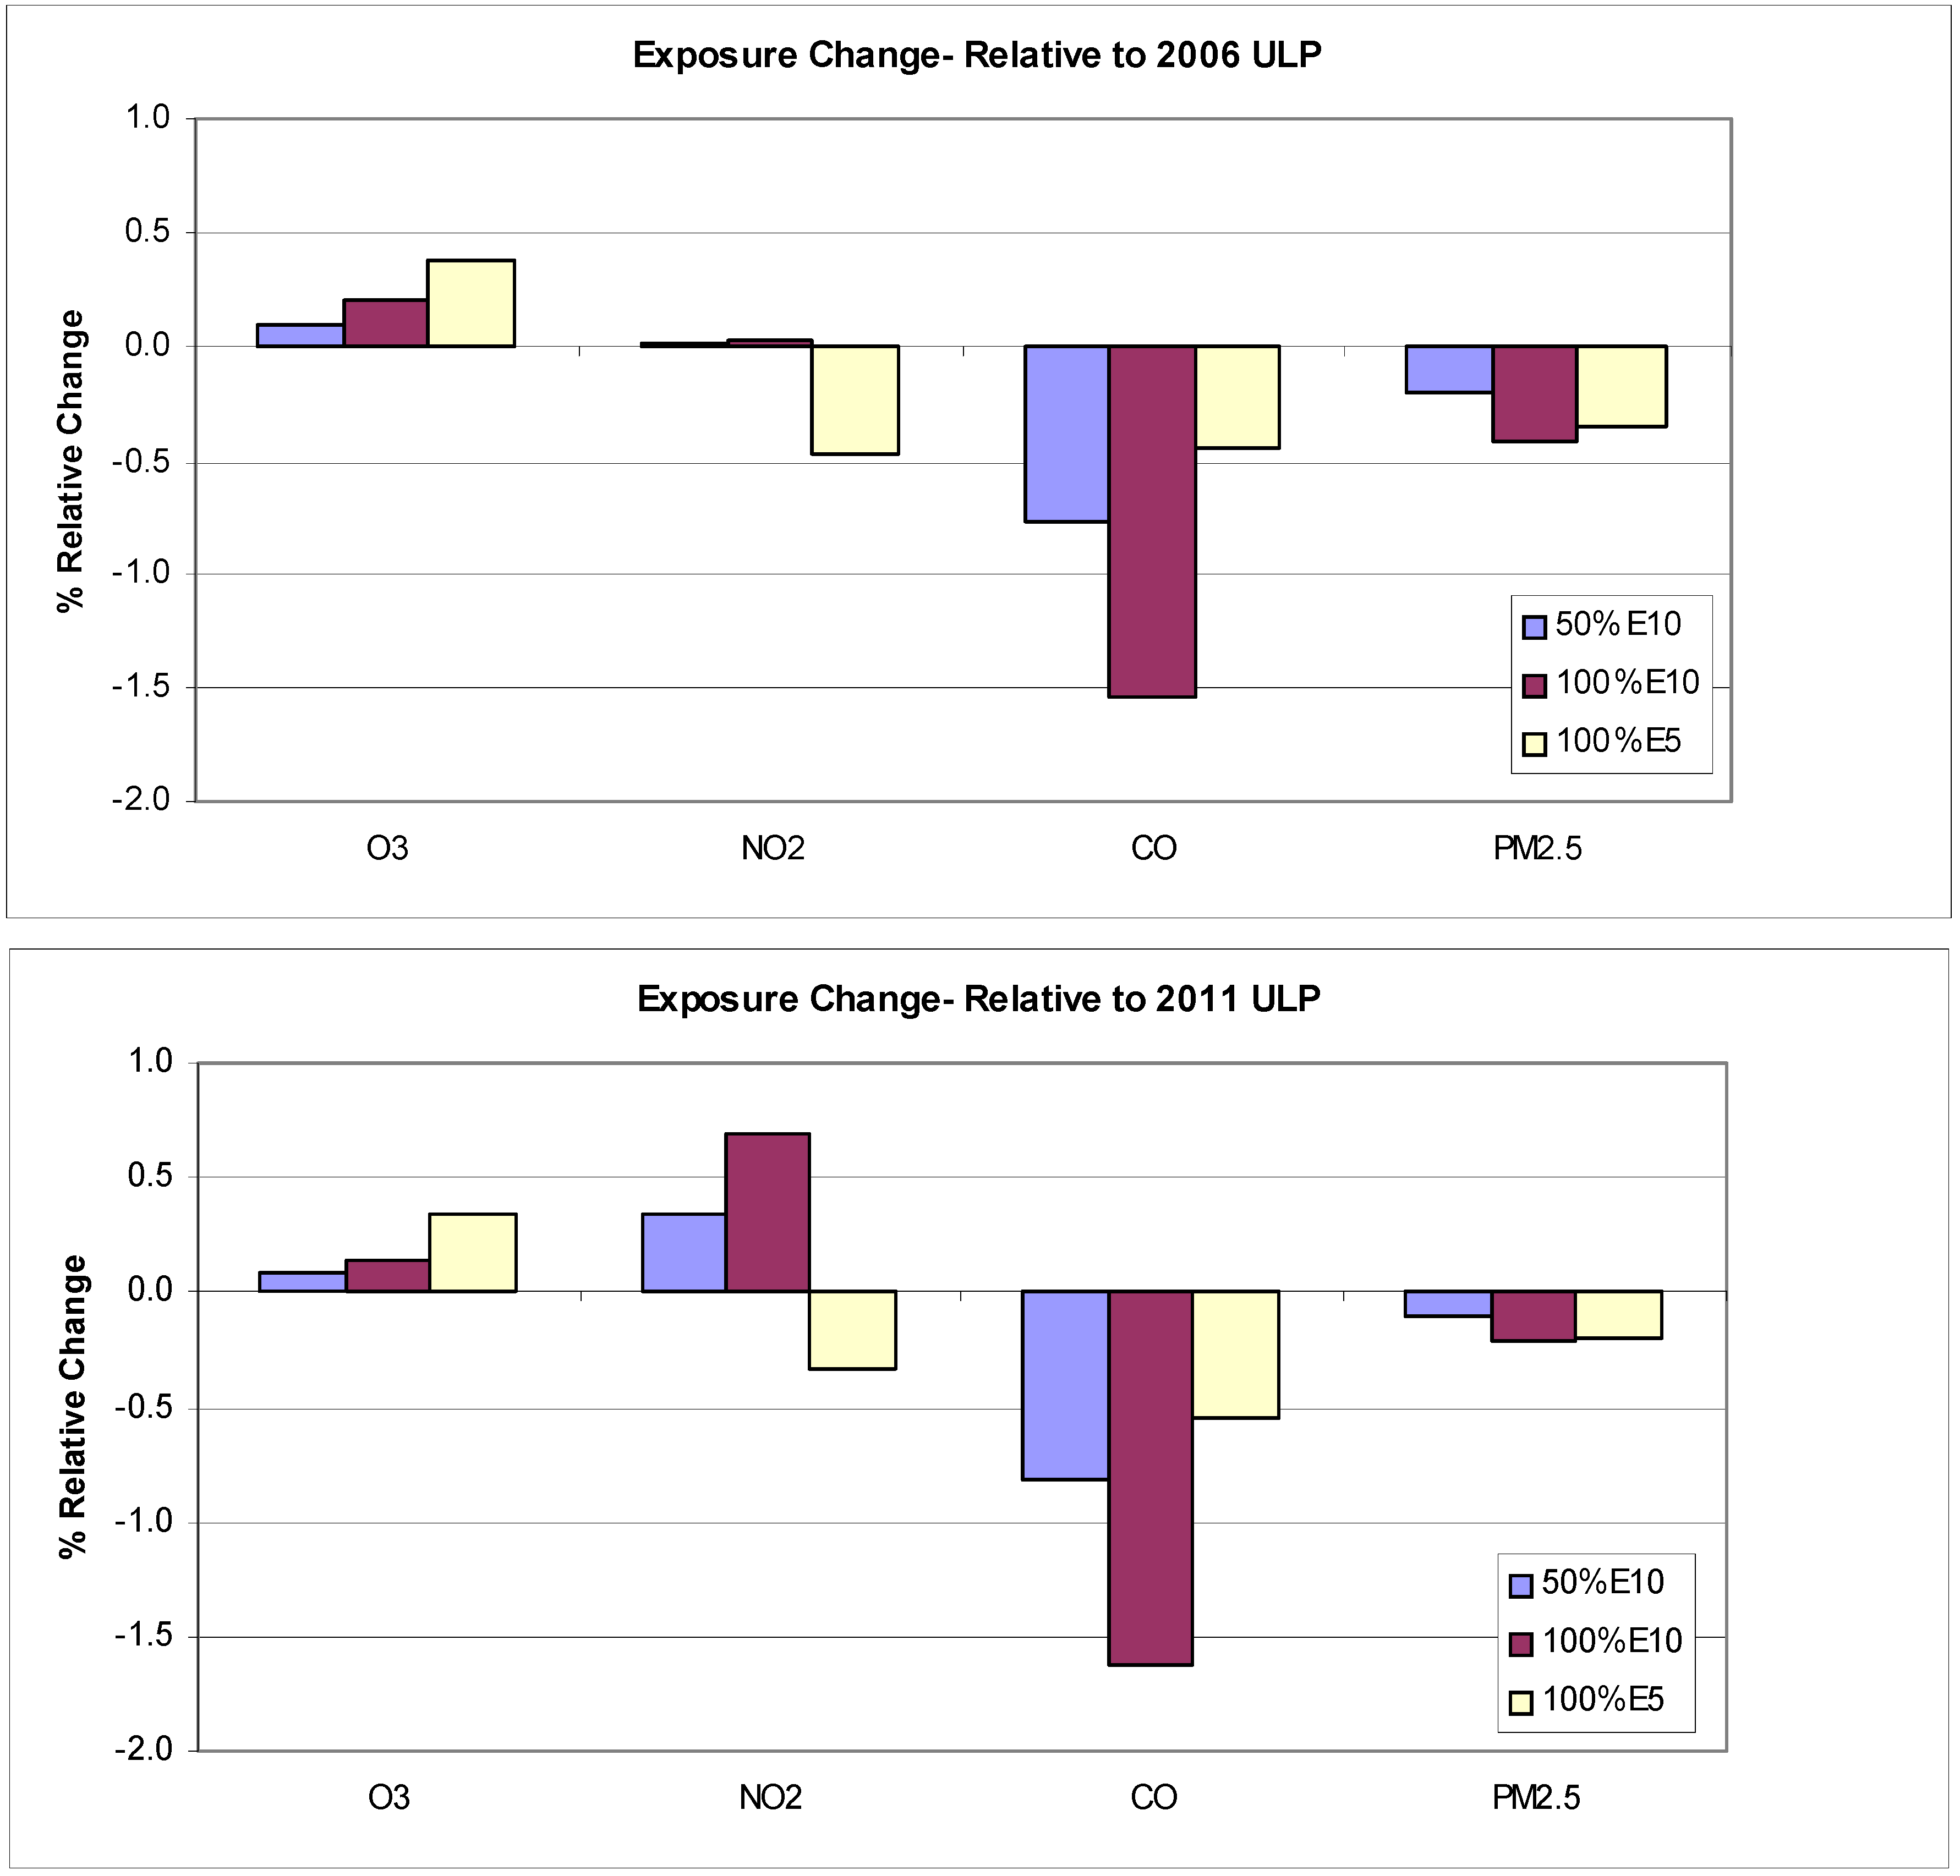
6.1.2. Increment
7. Discussion
| Urban Australia | 2006 Results
(Based on February) | 2006 Annual Run | 2011 Results
(Based on February) | ||||
|---|---|---|---|---|---|---|---|
| 50% E10 | 100% E10 | 100% E5 | 100% E5 | 50% E10 | 100% E10 | 100% E5 | |
| PM Mortality | −38.466 | −75.853 | −61.663 | −55.594 | −19.497 | −41.600 | −37.899 |
| PM Morbidity | −0.0305 | −0.0602 | −0.0490 | −0.0441 | −0.0155 | −0.0330 | −0.0301 |
| Ozone | 0.1412 | 0.2985 | 0.5798 | 0.3874 | 0.1309 | 0.2400 | 0.5623 |
| Nitrogen Dioxide | 0.0004 | 0.0008 | −0.0189 | −0.0182 | 0.0145 | 0.0289 | −0.0139 |
| Air Toxics | −0.6239 | −1.2176 | −0.2838 | −0.2838 | −0.5067 | −1.011 | 0.0320 |
| Total | −38.979 | −76.831 | −61.435 | −55.553 | −19.874 | −42.375 | −37.349 |
| 90% CI | −13 to −81 | −27 to −159 | −21 to −127 | −13 to −124 | −7 to −41 | −15 to −88 | −13 to −78 |
8. Conclusions
Acknowledgments
References
- CSIRO and Orbital Engine Corporation. Evaluating the Health Impacts of Ethanol Blend Petrol; Technical Report for the Department of the Environment, Water, Heritage and the Arts: Canberra, Australia, 2008. Available online: http://www.environment.gov.au/atmosphere/fuelquality/publications/ethanol-health-impacts.html (accessed on 18 February 2011).
- Azzi, M.; White, S.J.; Angove, D.E.; Jamie, I.M.; Kaduewela, A. 2010 Evaluation of the SAPRC-07 mechanism against CSIRO smog chamber data. Atmos. Environ. 2010, 44, 1707–1713. [Google Scholar] [CrossRef]
- White, S.J.; Azzi, M.; Angove, D.E.; Jamie, I.M. Modelling the photooxidation of ULP, E5 and E10 in the CSIRO smog chamber. Atmos. Environ. 2010, 44, 5375–5382. [Google Scholar] [CrossRef]
- Department of the Environment and Heritage. NISE 2—Contract 2 Drive Cycle and Short Test Development; Technical Report for Department of the Environment and Heritage: Orbital Australia, 2005. Available online: http://www.environment.gov.au/atmosphere/transport/nise2.html (accessed on 18 February 2011).
- Graham, L.A.; Belisle, S.L.; Baas, C.-L. Emissions from light duty gasoline vehicles operating on low blend ethanol gasoline and E85. Atmos. Environ. 2008, 42, 4498–4516. [Google Scholar] [CrossRef]
- Niven, R.K. Ethanol in gasoline: Environmental impacts and sustainability: Review article. Renew. Sustain. Energy Rev. 2005, 9, 535–555. [Google Scholar] [CrossRef]
- Pang, X.; Mu, Y.; Yuan, J.; He, H. Carbonyls emission from ethanol-blended gasoline and biodiesel-ethanol-diesel used in engines. Atmos. Environ. 2008, 42, 1349–1358. [Google Scholar] [CrossRef]
- Yarwood, G.; Rao, S.; Yocke, M.; Whitten, G. Updates to the Carbon Bond chemical mechanism: CB5; Technical Report for U.S. Environmental Protection Agency: Washington, DC, USA, 2005. [Google Scholar]
- Cope, M.E.; Hess, G.D.; Lee, S.H.; Tory, K.; Azzi, M.; Carras, J.N.; Lilley, W.; Manins, P.C.; Nelson, P.; Ng, Y.L.; Puri, K.; Wong, N.; Walsh, S.; Young, M. The Australian Air Quality Forecasting System. Part I: Project description and early outcomes. J. Appl. Meteorol. 2004, 43, 649–662. [Google Scholar] [CrossRef]
- Hurley, P.J. The Air Pollution Model (TAPM), version 3; Part 1. Technical description; CSIRO Atmospheric Research: Victoria, Australia, 2005.
- Amoako, J.; Ockwell, A.; Lodh, M. The economic consequences of the health effects of transport emissions in Australian capital cities. In Proceedings of the 26th Australasian Transport Research Forum, Wellington, New Zealand, 1–3 October 2003; Available online: http://www.patrec.org/web_docs/atrf/papers/2003/Amoako,%20Ockwell%20&%20Lodh%20(2003).pdf (accessed on 18 February 2011).
- Amoako, J.; Lodh, M.; Risbey, T. Health Impacts of Transport Emissions in Australia: Economic Costs; Bureau of Transport and Regional Economics: Canberra, Australia, 2005. Available online: http://www.btre.gov.au/publications/94/Files/wp63.pdf (accessed on 18 February 2011).
- NEPC. Impact Statement for PM2.5 Variation NEPM (National Environment Protection Measure); NEPC: Adelaide, Australia, 2002. [Google Scholar]
- Access Economics Pty Limited. The Health of Nations: The Value of a Statistical Life; Technical Report for Office of the Australian Safety and Compensation Council, Access Economics Pty. Ltd.: Canberra, Australia, 2008. Available online: http://www.accesseconomics.com.au/publicationsreports/showreport.php?id=156&searchfor=2008&searchby=year (accessed on 18 February 2011).
- Burgers, M.; Walsh, S. Exposure Assessment and Risk Characterisation for the Development of a PM2.5 Standard; Technical Report for the National Environmental Protection Council Service Corporation, Environment Protection Authority of Victoria: Melbourne, Australia, 2002. [Google Scholar]
- Jacobson, M.Z. Effects of ethanol (E85) versus gasoline vehicles on cancer and mortality in the United States. Environ. Sci. Technol. 2007, 41, 4150–4157. [Google Scholar] [CrossRef] [PubMed]
- Beer, T.; Grant, T. Life-cycle analysis of emissions from fuel ethanol and blends in Australian heavy and light vehicles. J. Cleaner Prod. 2007, 15, 833–837. [Google Scholar] [CrossRef]
- Centre for International Economics. Health Costs of Transport Emissions in Sydney—Consultancy 2: Economic Valuation Methodologies; Technical Report for NSW Environment Protection Authority: Sydney, Australia, 2001. [Google Scholar]
© 2011 by the authors; licensee MDPI, Basel, Switzerland. This article is an open access article distributed under the terms and conditions of the Creative Commons Attribution license (http://creativecommons.org/licenses/by/3.0/).
Share and Cite
Beer, T.; Carras, J.; Worth, D.; Coplin, N.; Campbell, P.K.; Jalaludin, B.; Angove, D.; Azzi, M.; Brown, S.; Campbell, I.; et al. The Health Impacts of Ethanol Blend Petrol. Energies 2011, 4, 352-367. https://doi.org/10.3390/en4020352
Beer T, Carras J, Worth D, Coplin N, Campbell PK, Jalaludin B, Angove D, Azzi M, Brown S, Campbell I, et al. The Health Impacts of Ethanol Blend Petrol. Energies. 2011; 4(2):352-367. https://doi.org/10.3390/en4020352
Chicago/Turabian StyleBeer, Tom, John Carras, David Worth, Nick Coplin, Peter K. Campbell, Bin Jalaludin, Dennys Angove, Merched Azzi, Steve Brown, Ian Campbell, and et al. 2011. "The Health Impacts of Ethanol Blend Petrol" Energies 4, no. 2: 352-367. https://doi.org/10.3390/en4020352
APA StyleBeer, T., Carras, J., Worth, D., Coplin, N., Campbell, P. K., Jalaludin, B., Angove, D., Azzi, M., Brown, S., Campbell, I., Cope, M., Farrell, O., Galbally, I., Haiser, S., Halliburton, B., Hynes, R., Jacyna, D., Keywood, M., Lavrencic, S., ... Wood, R. (2011). The Health Impacts of Ethanol Blend Petrol. Energies, 4(2), 352-367. https://doi.org/10.3390/en4020352