Design Specifications for the Hanstholm WEPTOS Wave Energy Converter


Abstract
:1. Introduction
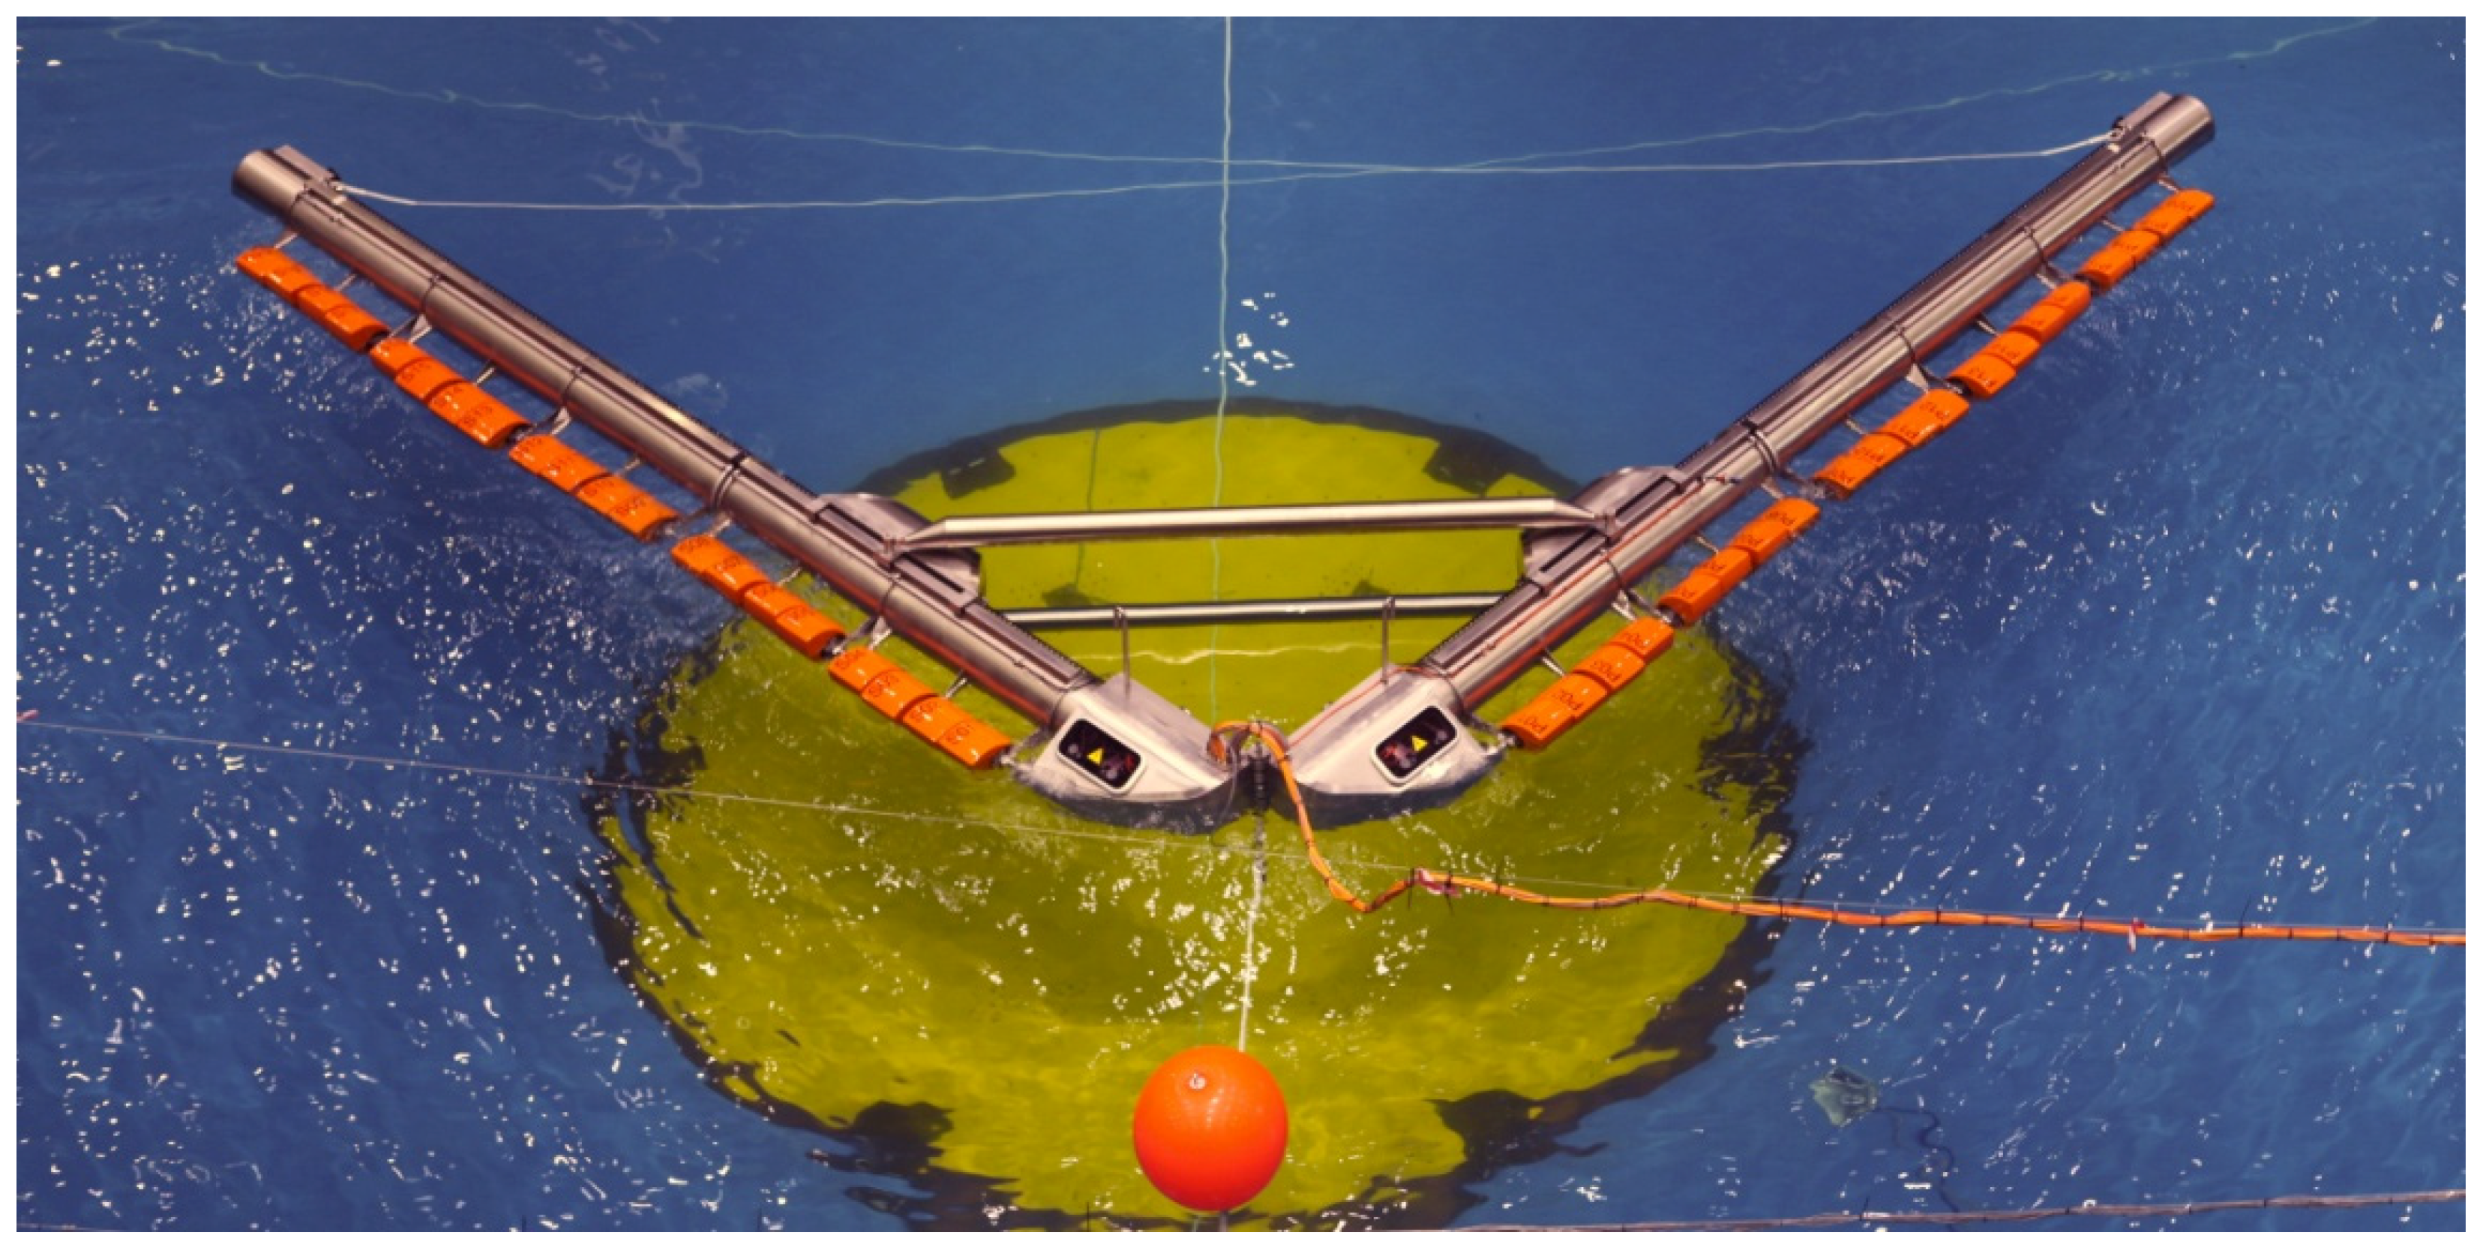
2. Experimental results from the WEPTOS prototype
1.1. Overview

| Target Waves | Constant Loading | Linear Loading | ||||||||
|---|---|---|---|---|---|---|---|---|---|---|
| WS | Hs | Tp | η | Hm0 | ω | τ | η | Hm0 | ω | τ |
| [m] | [s] | [-] | [m] | [rpm] | [Nm] | [-] | [m] | [rpm] | [Nm] | |
| 1 | 0.047 | 1.06 | 0.39 | 0.041 | 4.19 | 2.94 | 0.43 | 0.042 | 3.81 | 3.51 |
| 2 | 0.084 | 1.28 | 0.26 | 0.074 | 8.2 | 4.6 | 0.32 | 0.077 | 7.0 | 6.5 |
| 3 | 0.118 | 1.51 | 0.17 | 0.104 | 9.2 | 6.3 | 0.21 | 0.102 | 7.7 | 8.0 |
| 4 | 0.165 | 1.72 | 0.11 | 0.143 | 9.4 | 8.4 | 0.11 | 0.147 | 8.2 | 9.6 |
| 5 | 0.212 | 1.92 | 0.08 | 0.171 | 8.5 | 10.0 | 0.06 | 0.207 | 7.5 | 12.7 |
| 6 | 0.043 | 1.16 | 0.34 | 0.037 | 2.7 | 3.3 | ||||
| 7 | 0.085 | 1.45 | 0.19 | 0.078 | 5.8 | 5.8 | ||||
| 8 | 0.128 | 1.74 | 0.11 | 0.113 | 6.2 | 7.8 | ||||
| 9 | 0.171 | 2.03 | 0.06 | 0.143 | 6.2 | 8.8 | 0.06 | 0.162 | 6.2 | 9.2 |
| 10 | 0.214 | 2.32 | 0.03 | 0.171 | 5.2 | 9.5 | ||||
| 11 | 0.085 | 1.72 | 0.12 | 0.074 | 2.8 | 6.8 | 0.13 | 0.078 | 3.9 | 6.2 |
| 12 | 0.128 | 2.03 | 0.07 | 0.103 | 3.7 | 7.9 | ||||
| 0A | 0.04 | 0.97 | 0.48 | 0.035 | 3.5 | 2.6 | 0.37 | 0.033 | 2.9 | 2.3 |
| 0B | 0.035 | 0.9 | 0.57 | 0.027 | 2.4 | 2.2 | ||||
1.2. Performance of the WEPTOS Prototype

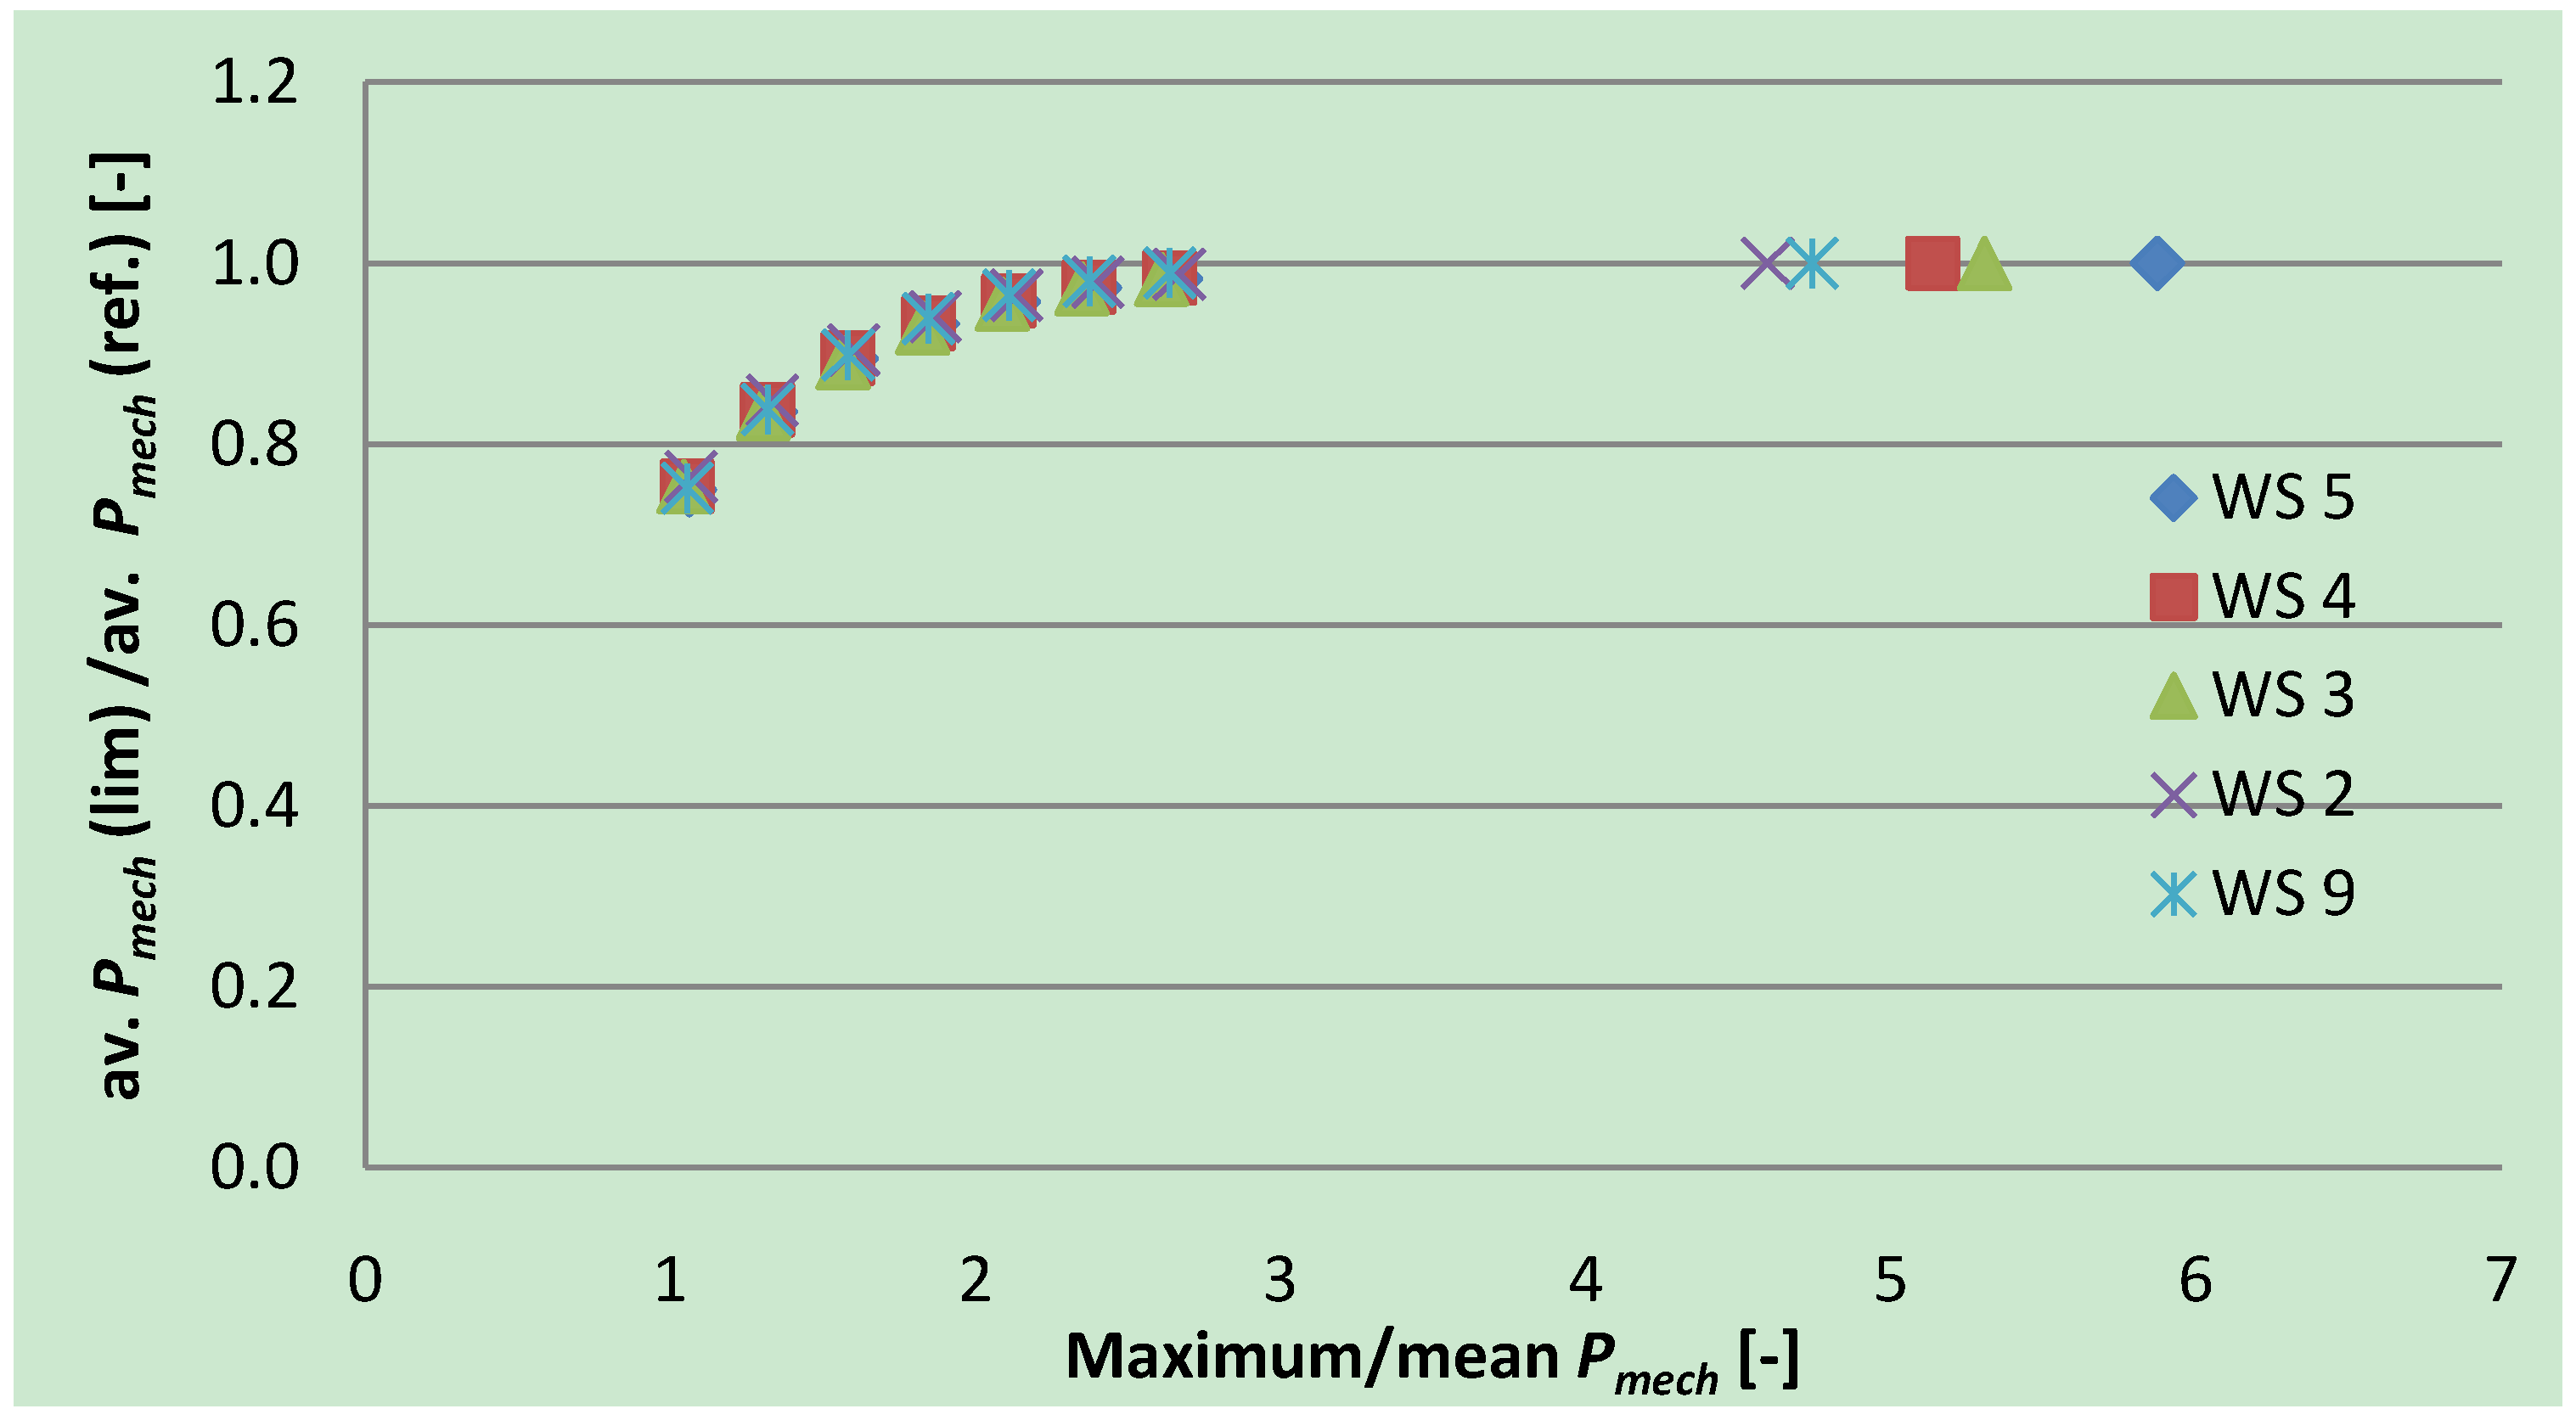
1.3. Maximum-to-Mean Ratio of the Mechanical Power
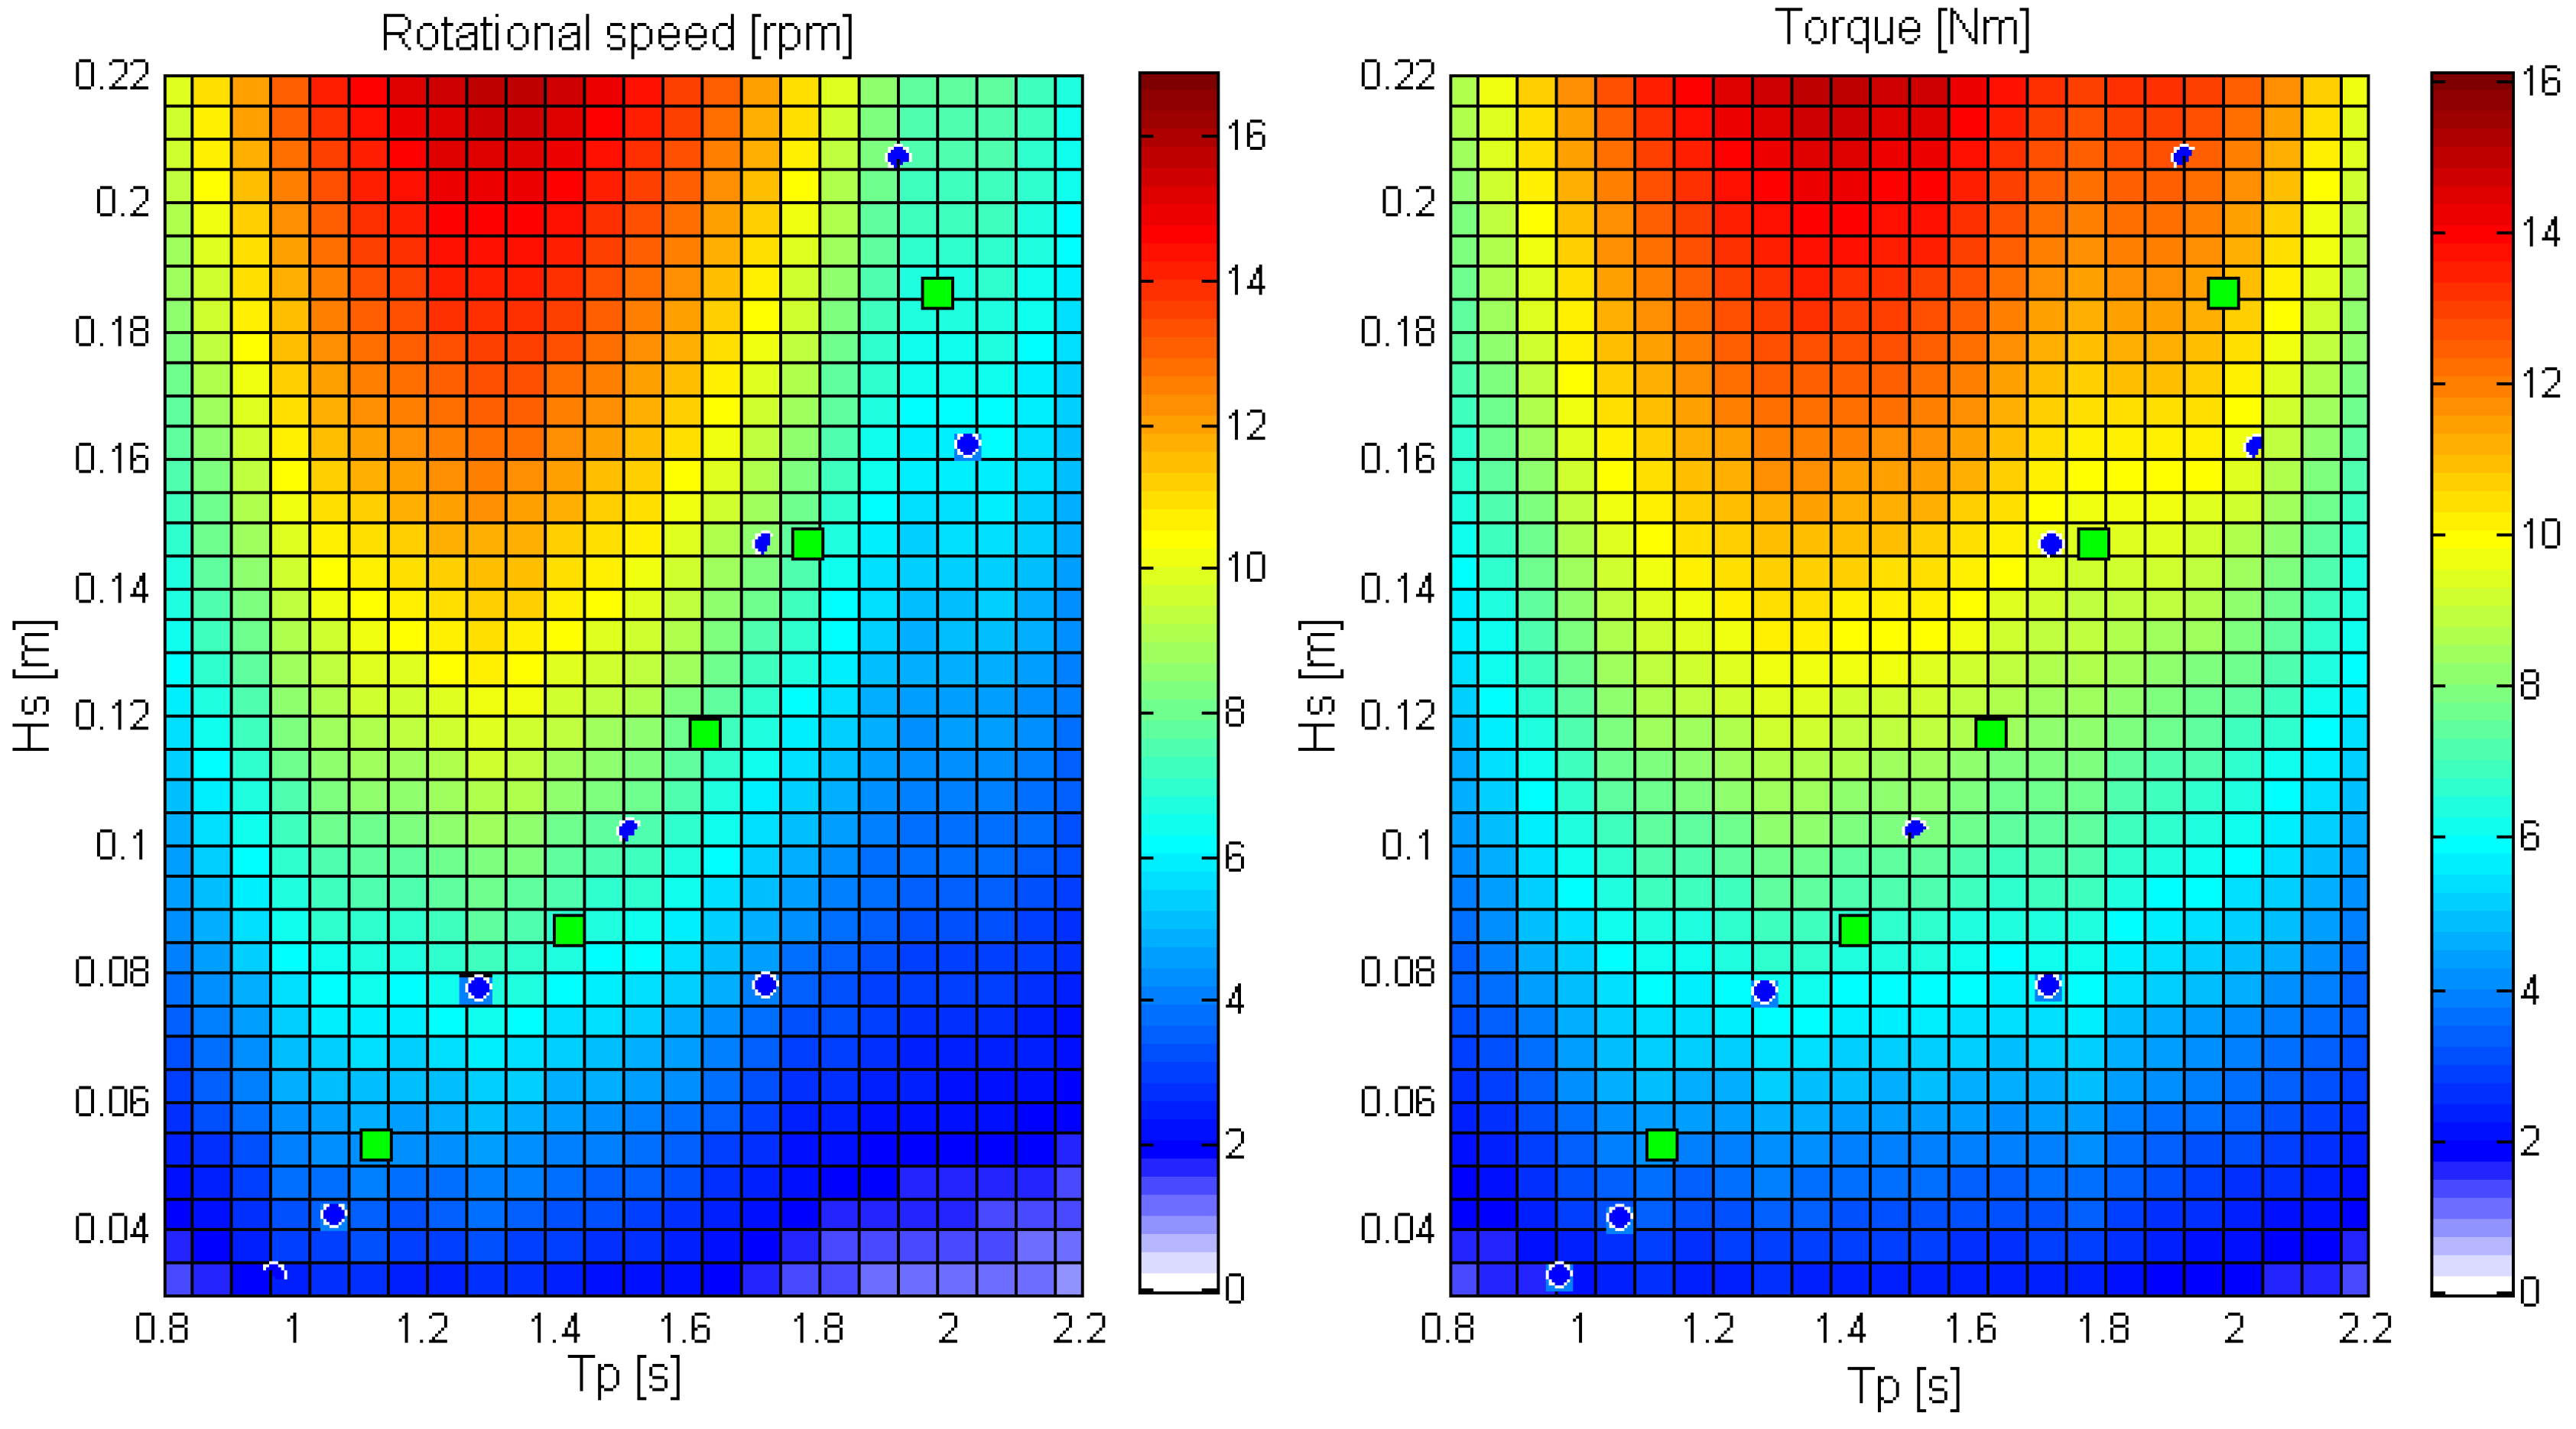
1.4. Rotational Speed and Torque on the Axle
| WS | Rotational Speed [rpm] | Torque [Nm] | ||||
|---|---|---|---|---|---|---|
| Maximum | Mean | Maximum/Mean | Maximum | Mean | Maximum/Mean | |
| 2 | 17.8 | 7.0 | 2.5 | 10.9 | 6.5 | 1.7 |
| 3 | 19.9 | 7.7 | 2.6 | 13.6 | 8.0 | 1.7 |
| 4 | 23.8 | 8.2 | 2.9 | 17.0 | 9.6 | 1.8 |
| 5 | 21.7 | 7.5 | 2.9 | 22.6 | 12.7 | 1.8 |
| 9 | 15.6 | 6.2 | 2.5 | 15.8 | 9.2 | 1.7 |
| Average | 2.7 | Average | 1.7 | |||
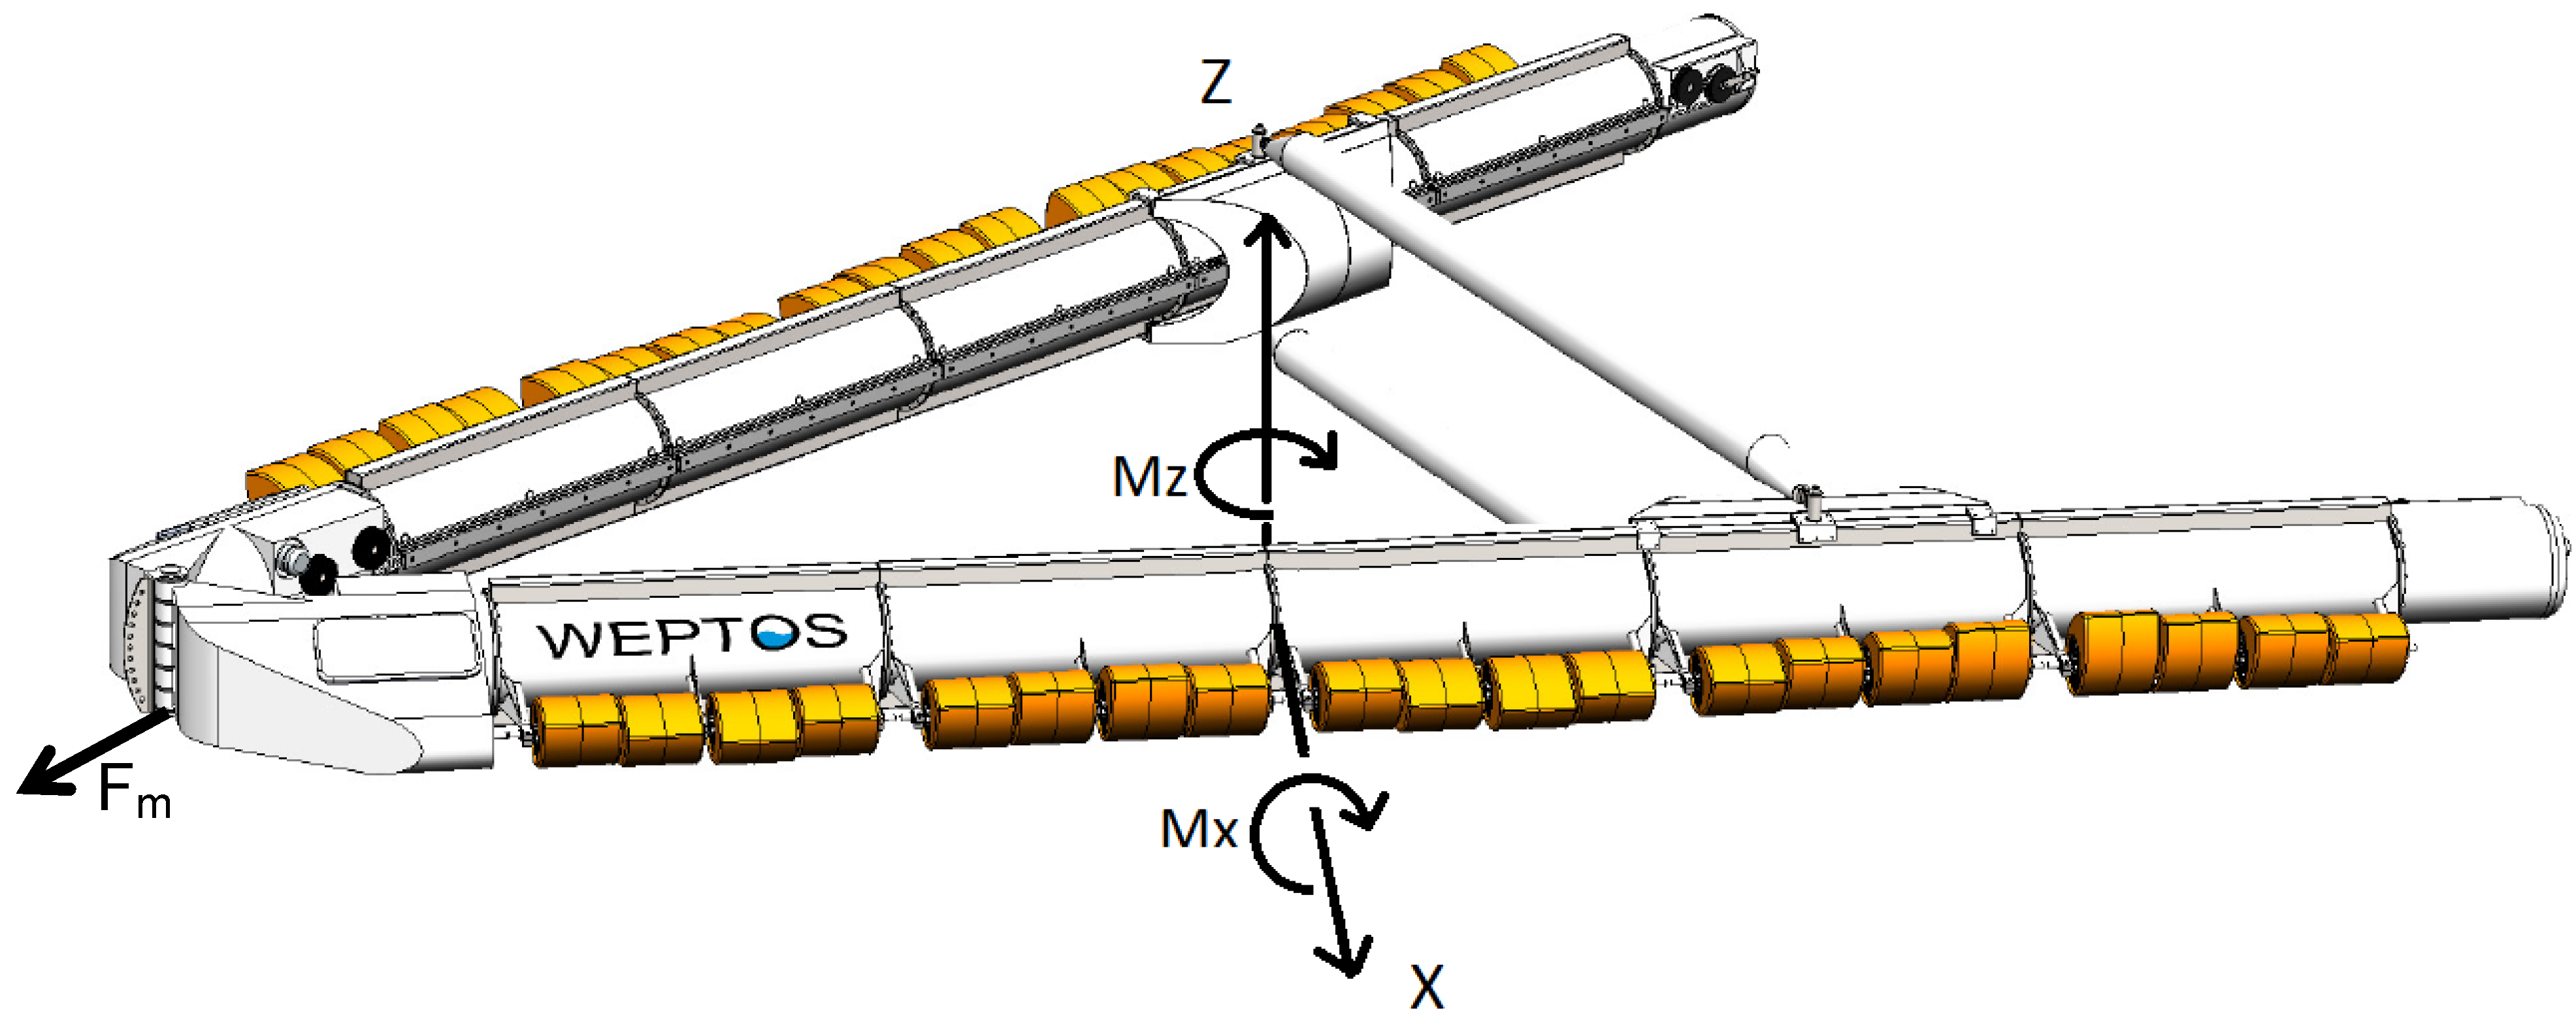
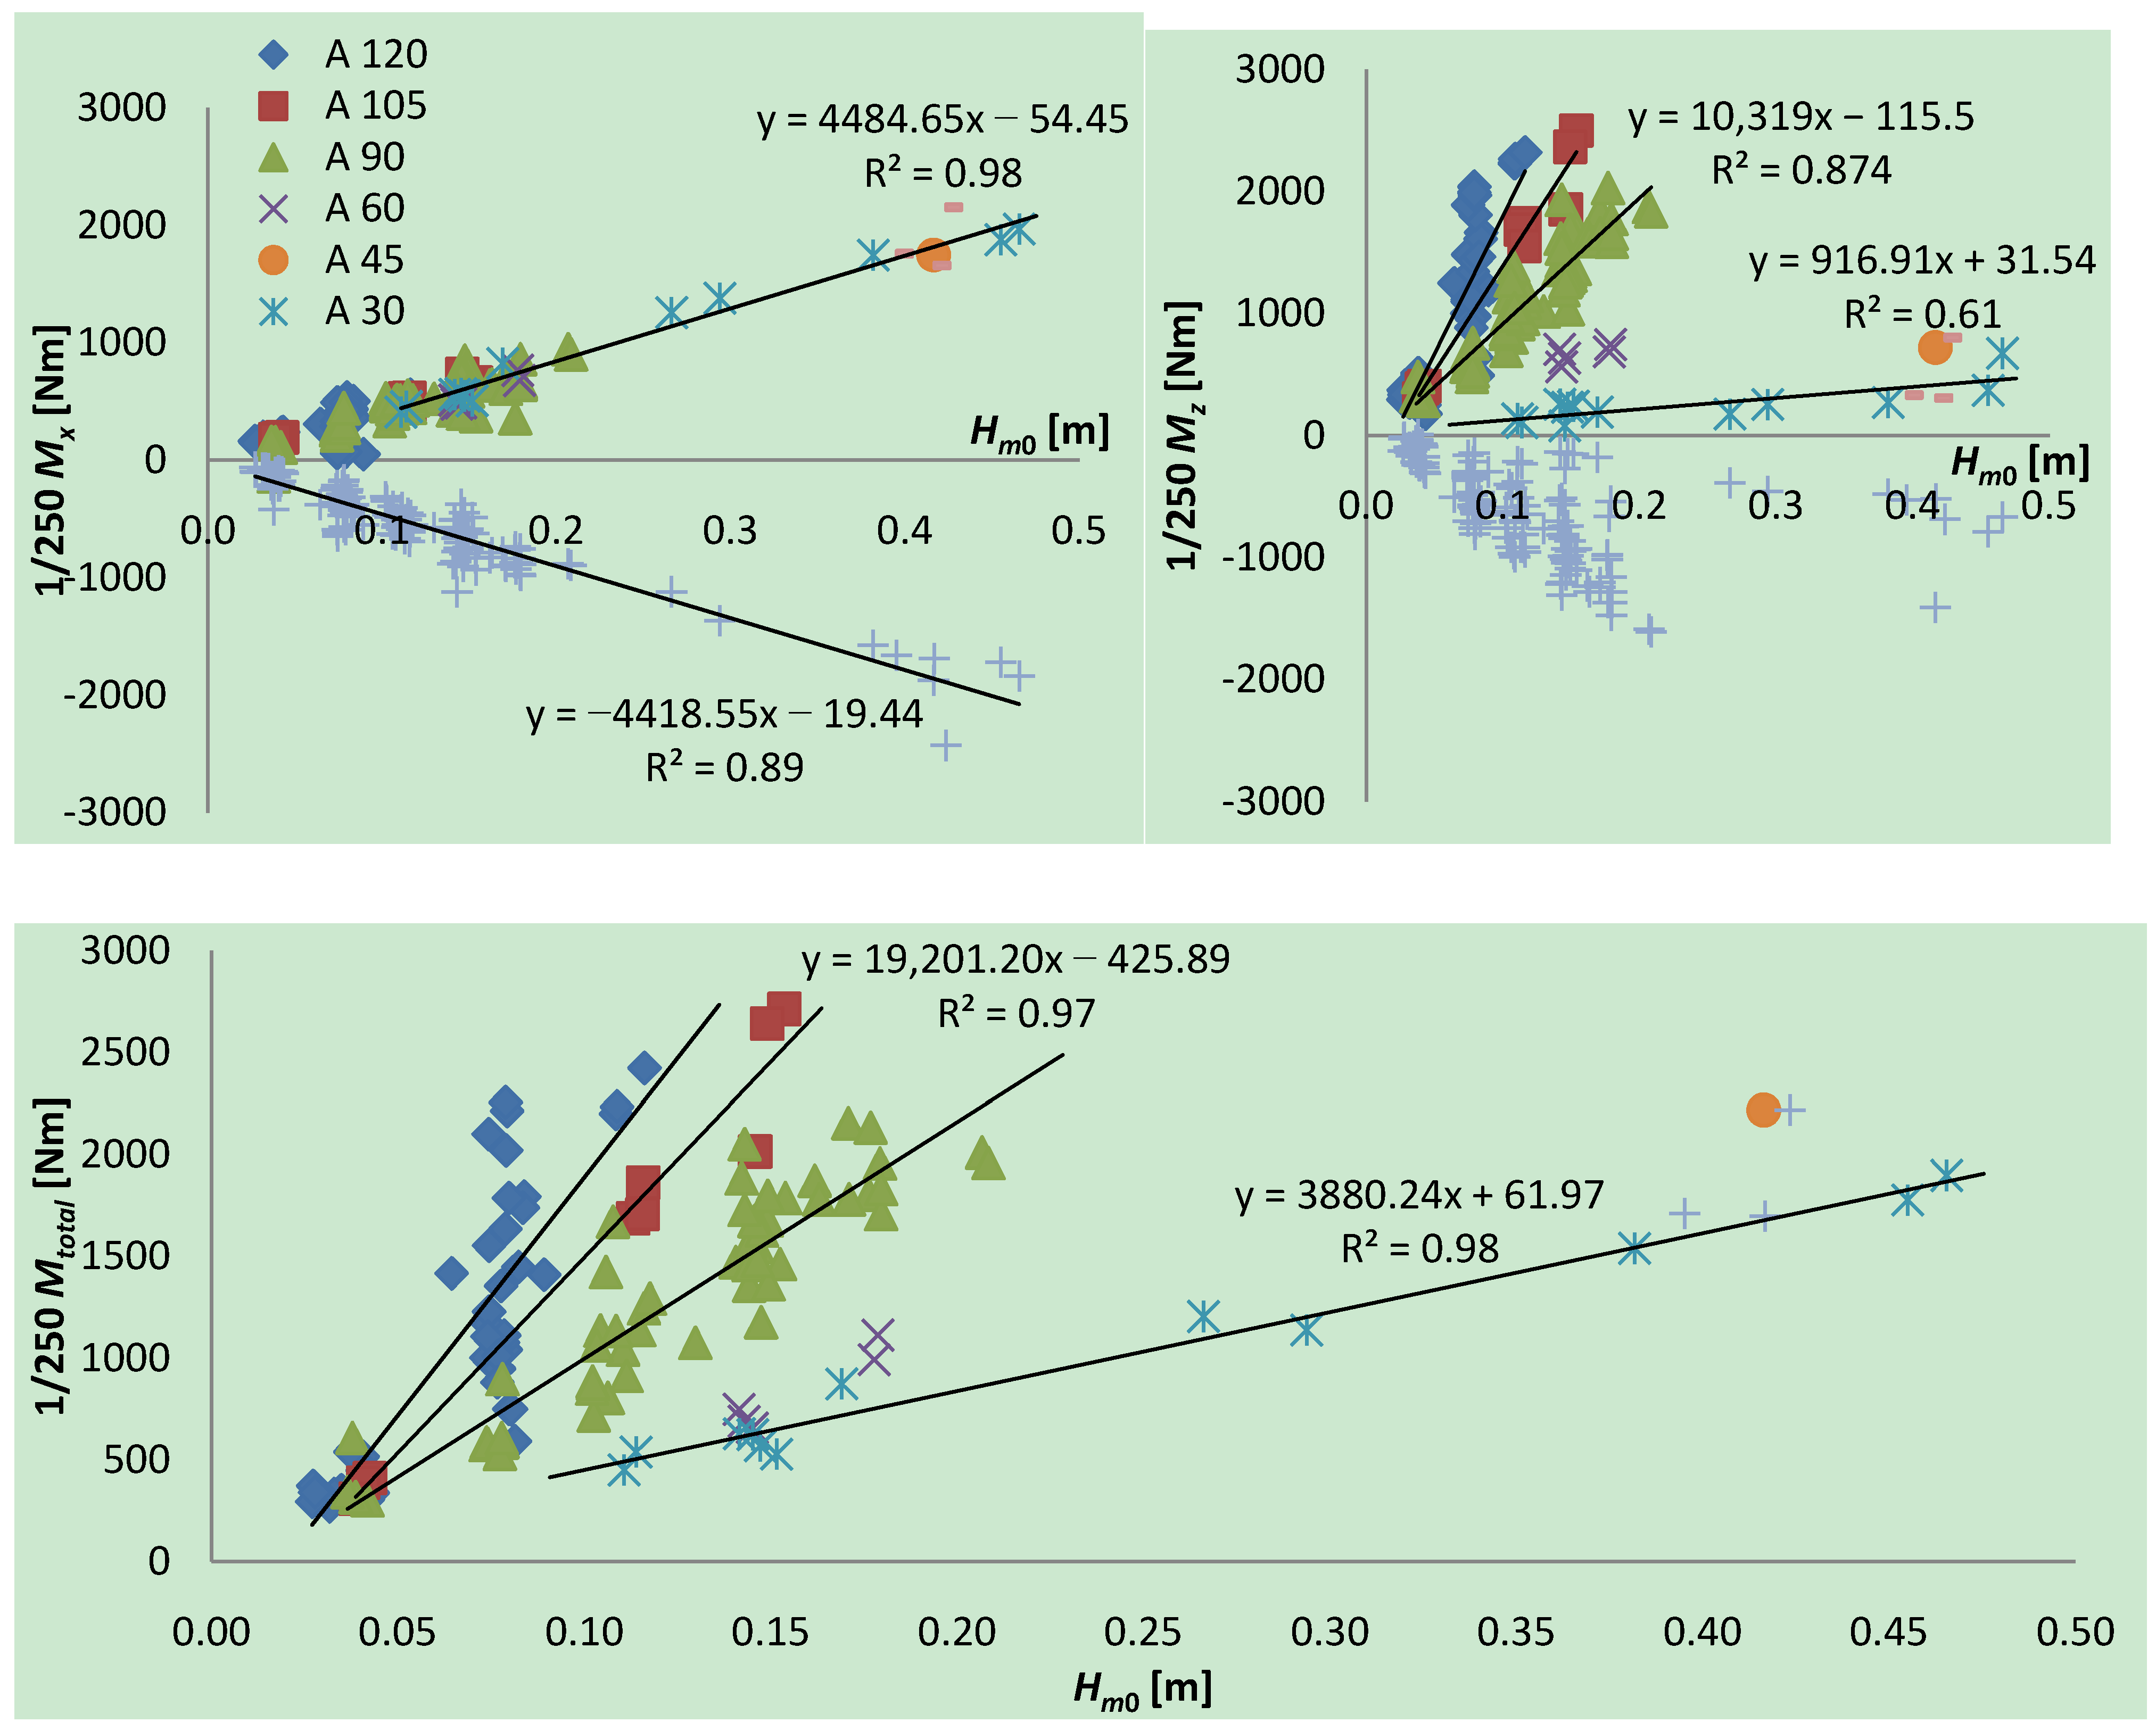
1.5. Mooring Forces and Structural Bending Moments

2. Hanstholm WEPTOS WEC Design Specifications
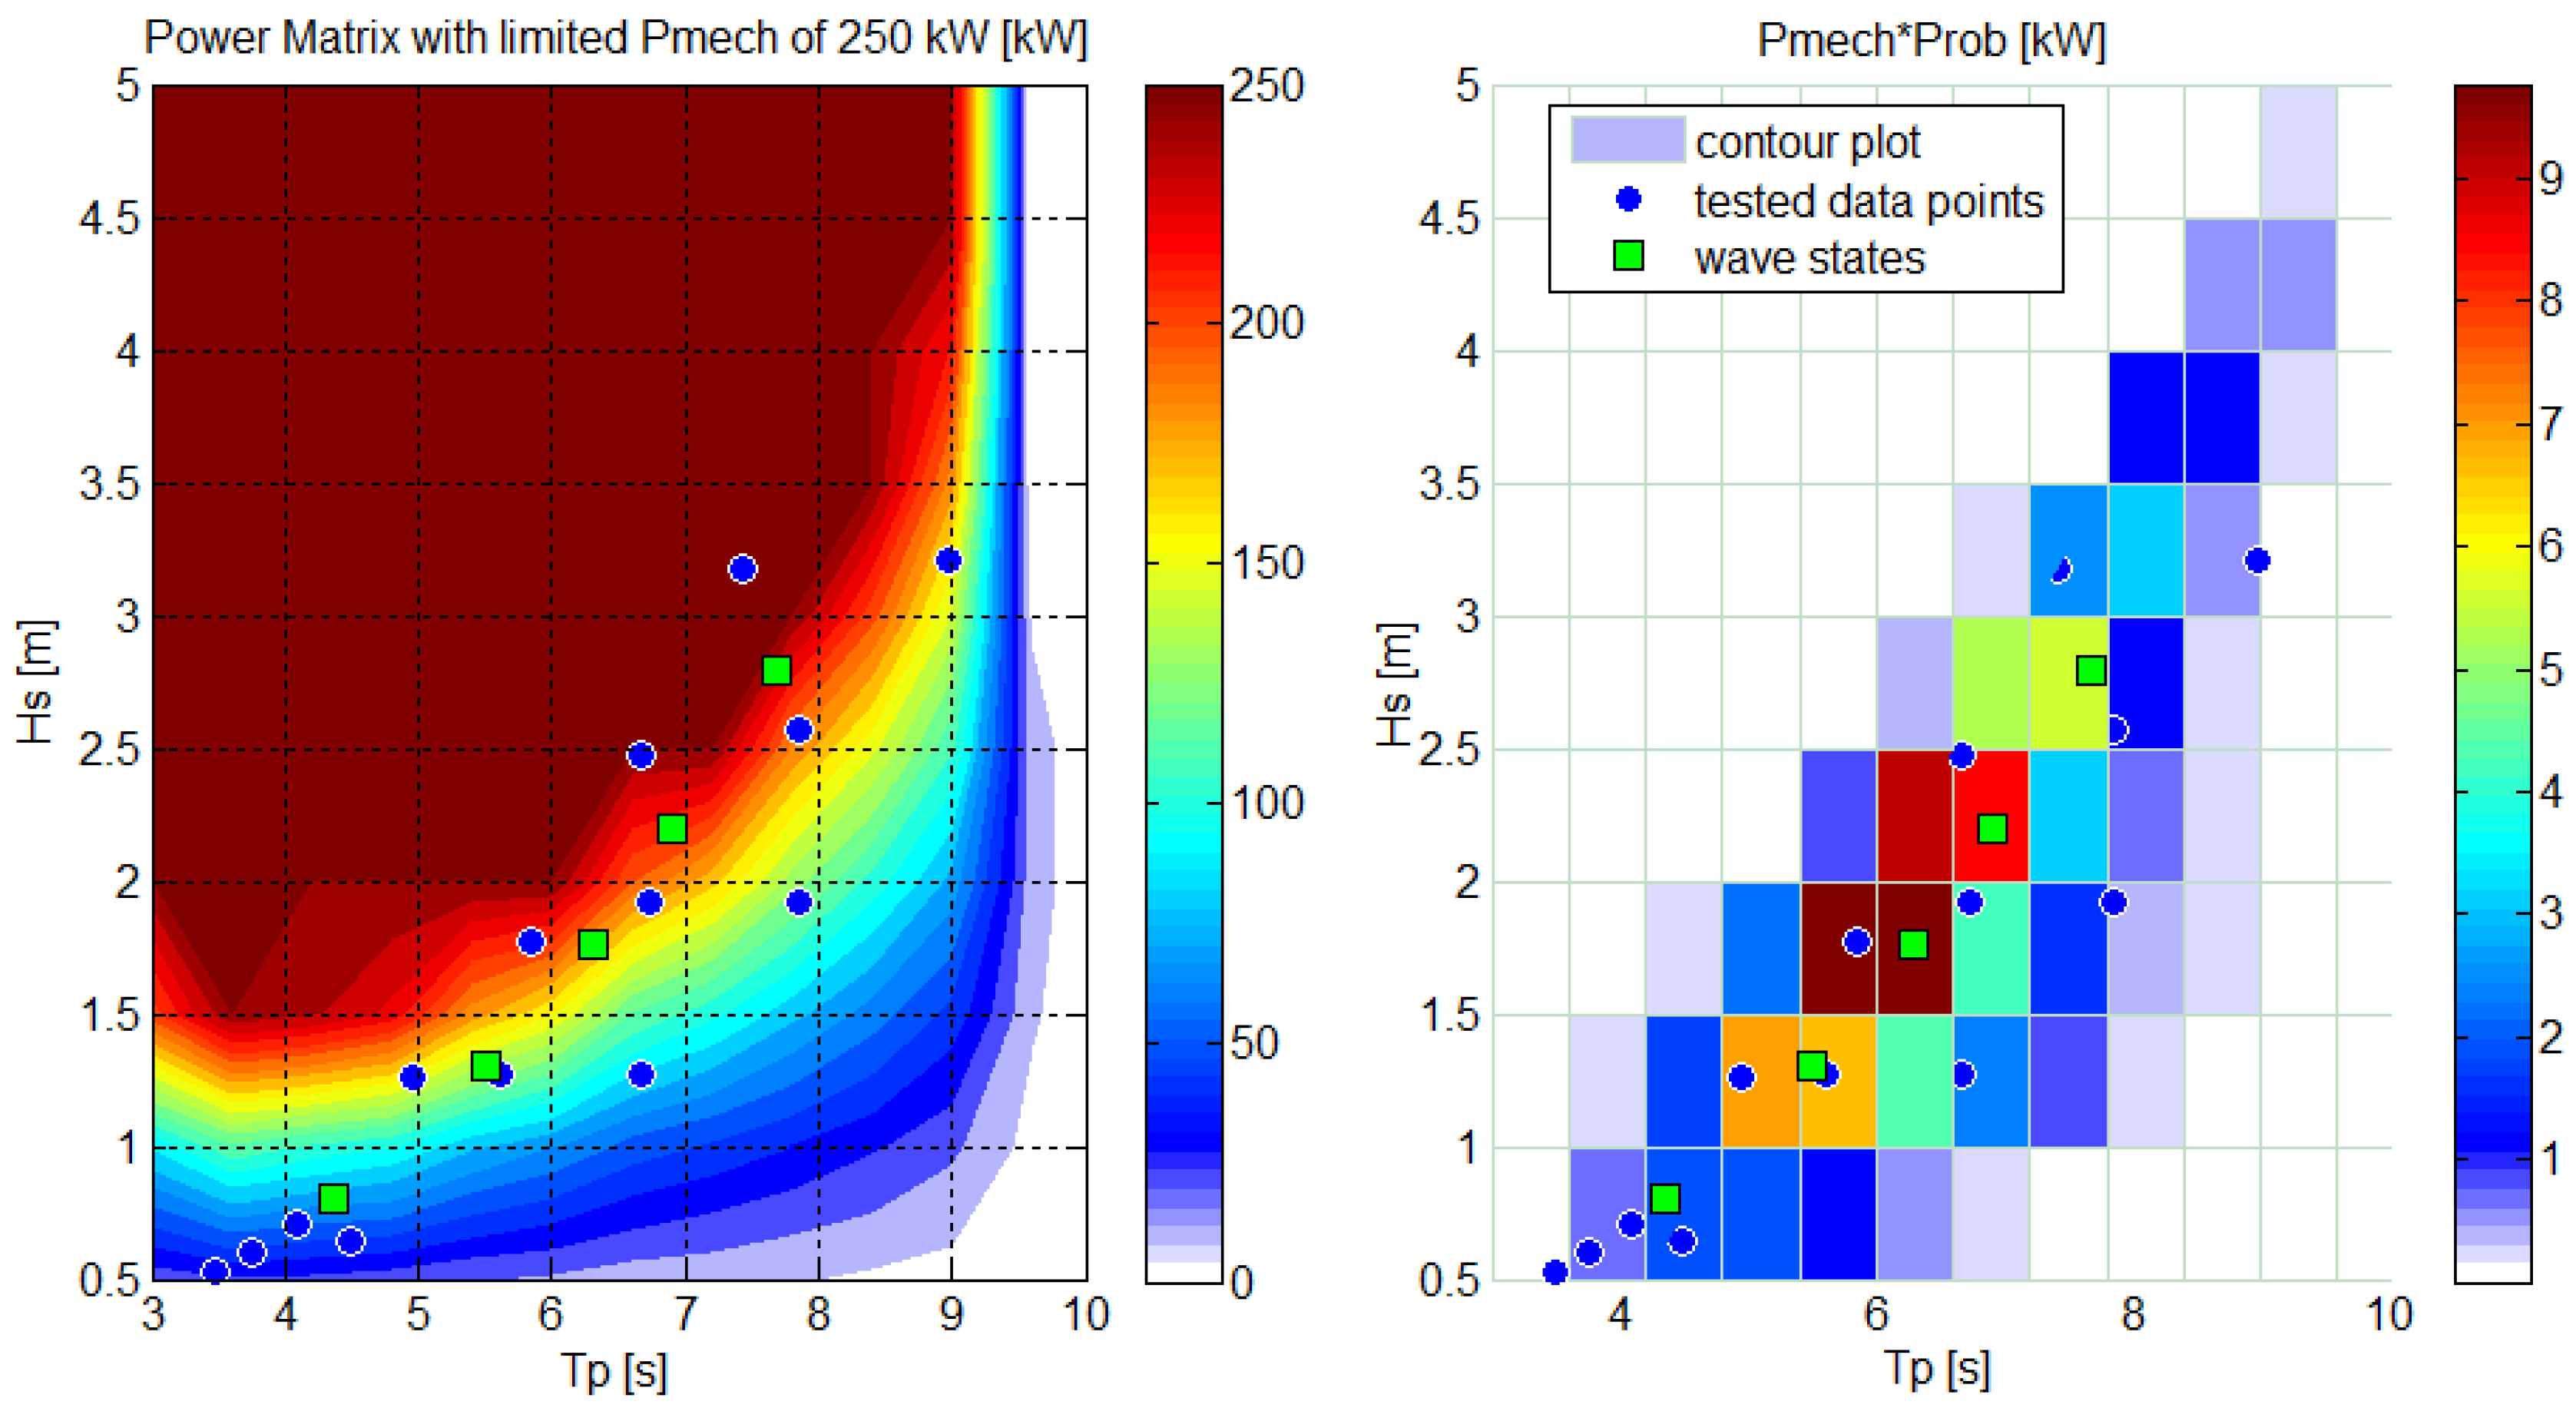
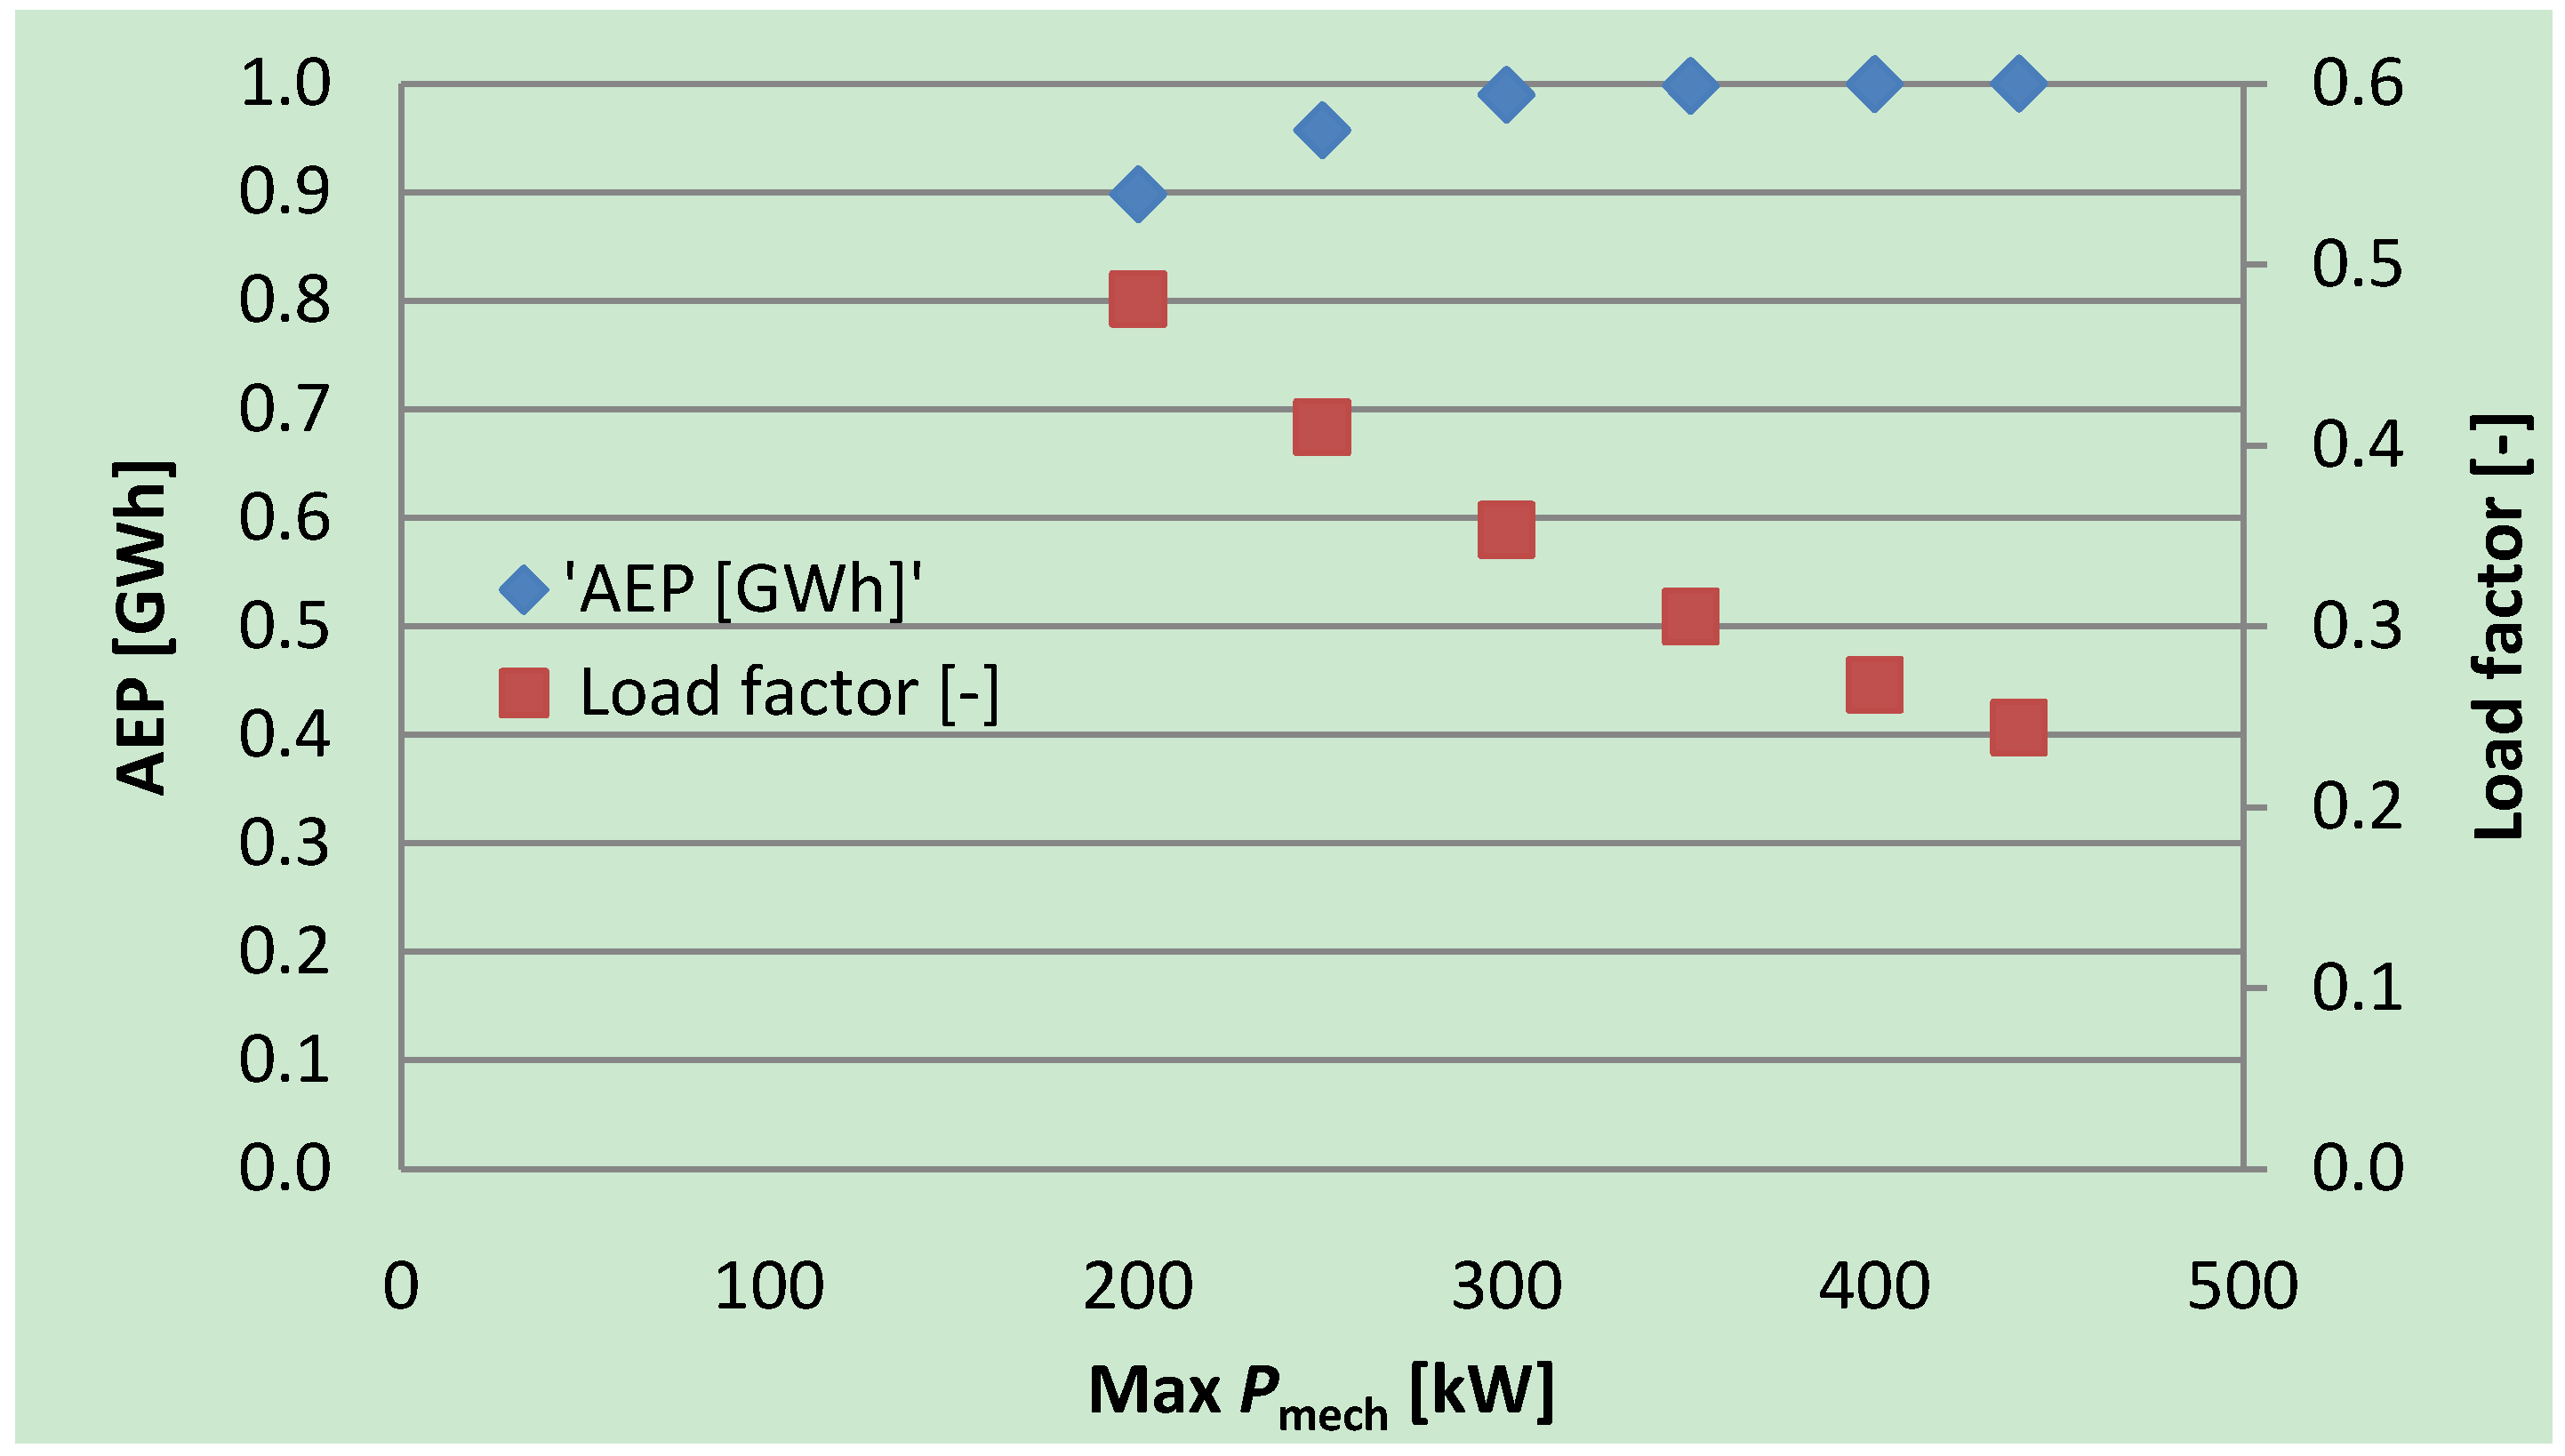
2.1. Generator Capacity

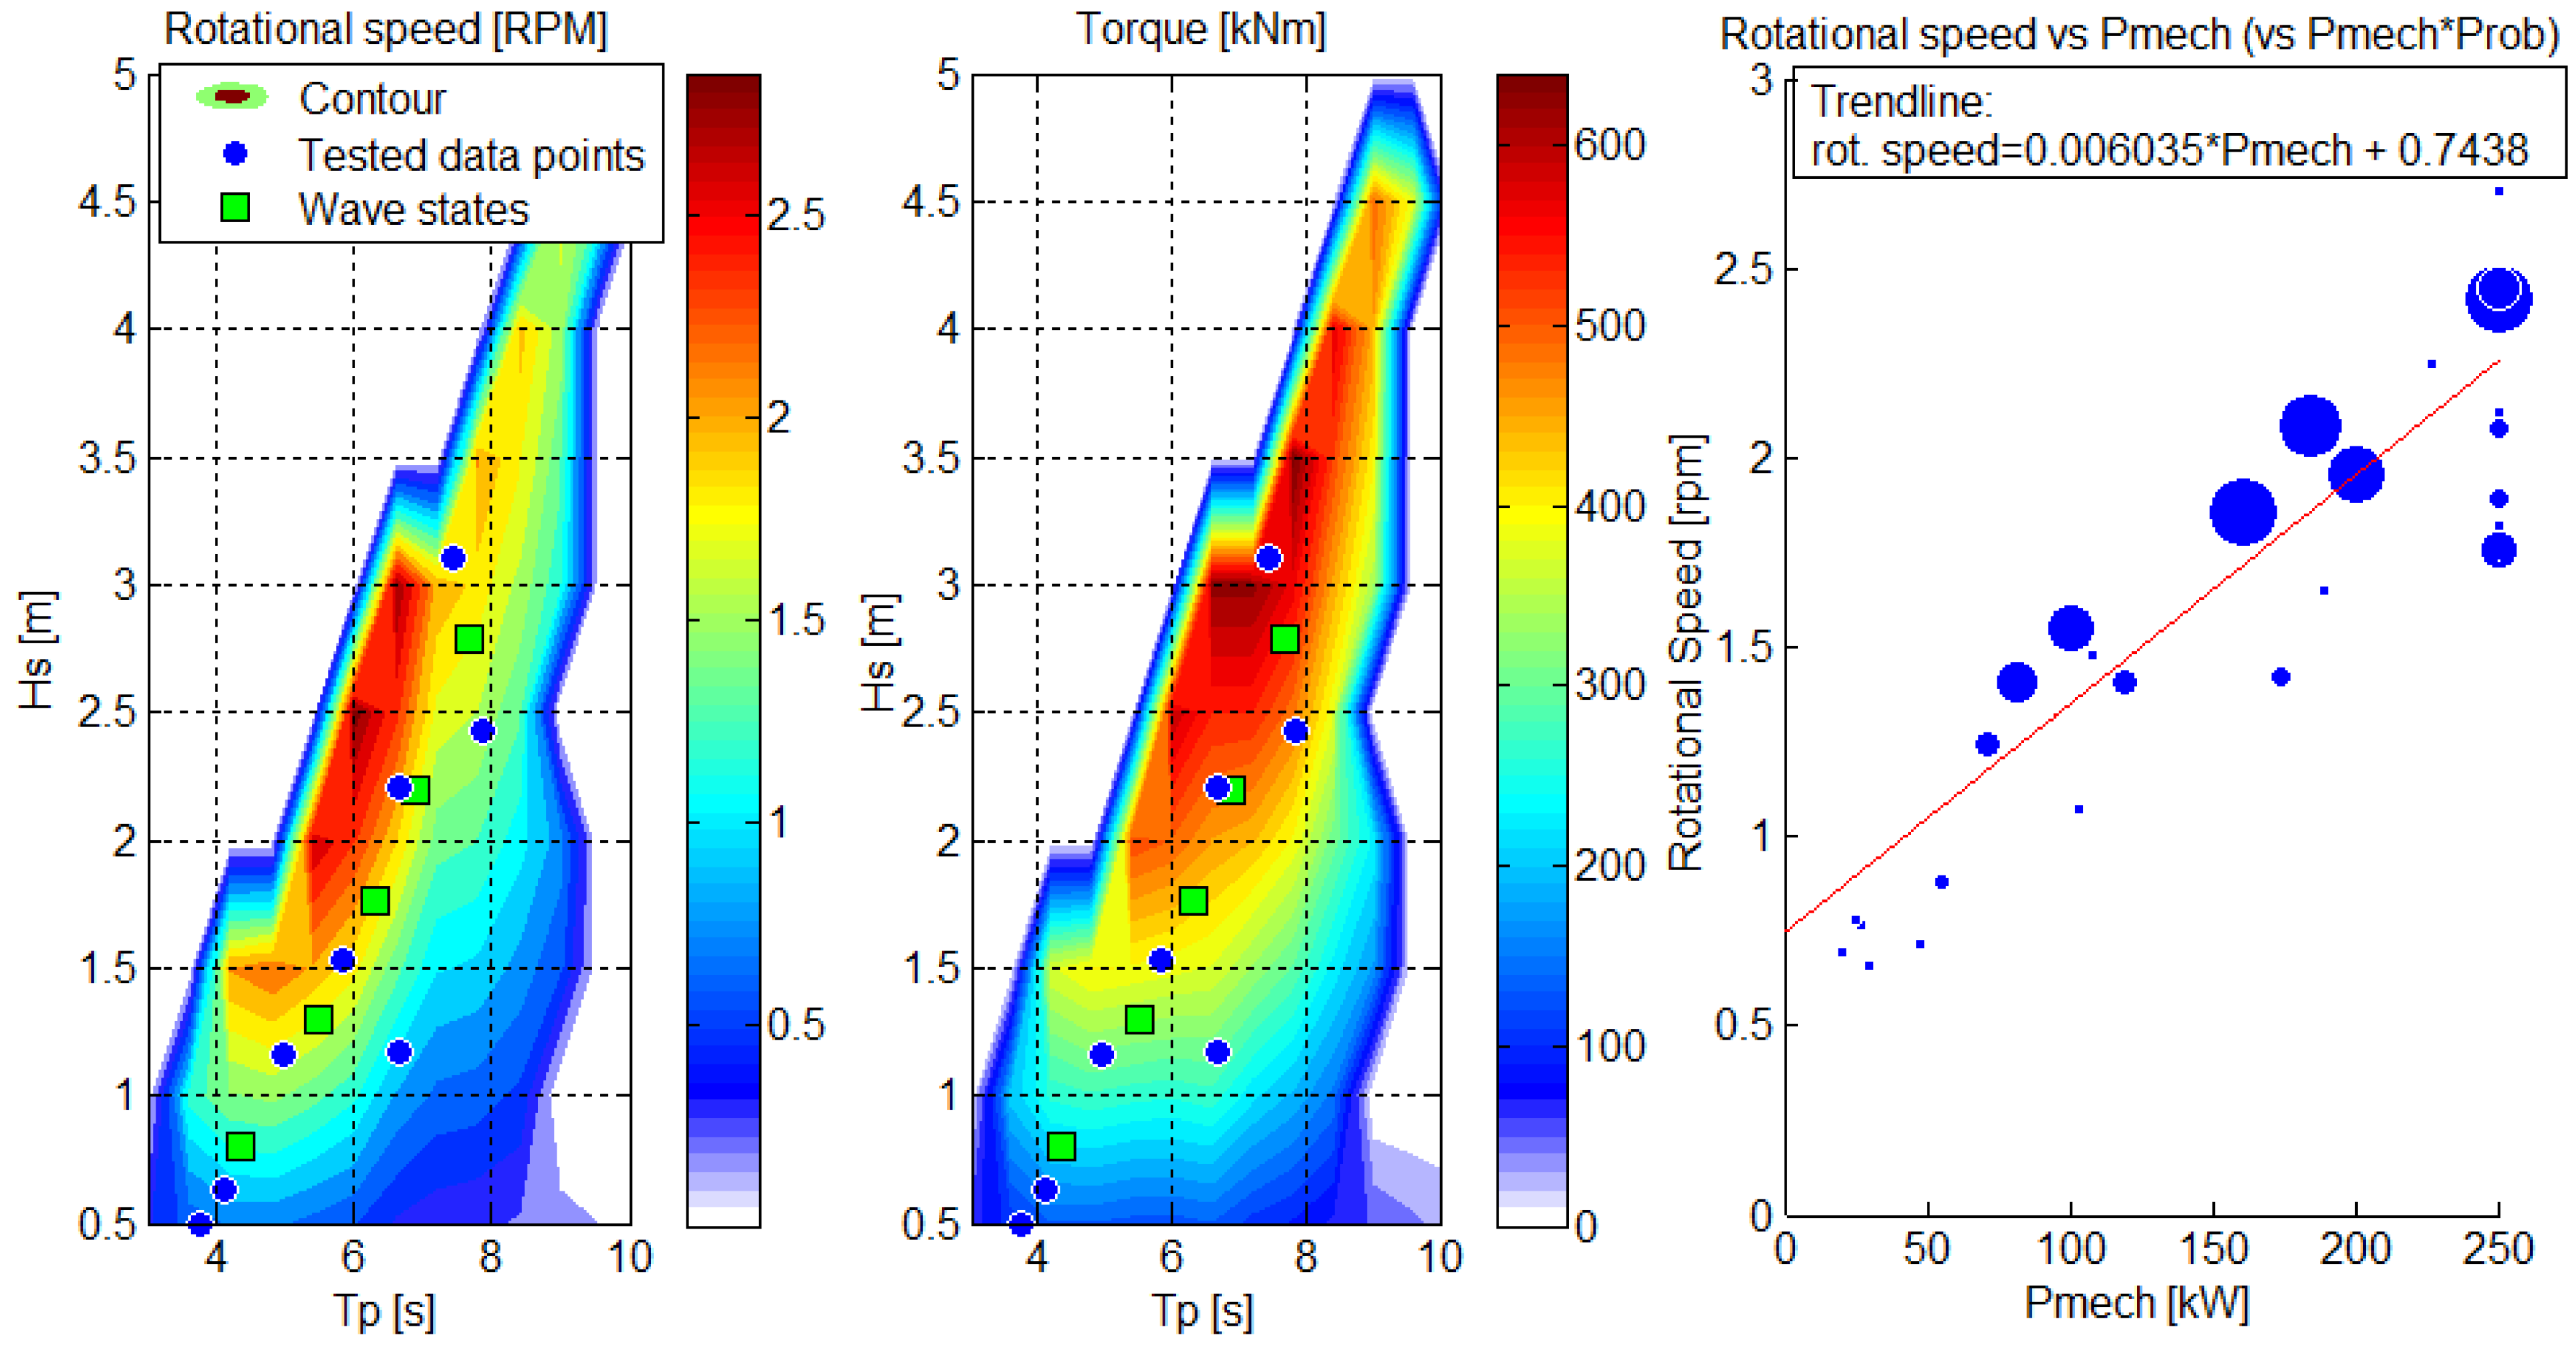
2.2. Rotational Speed and Torque
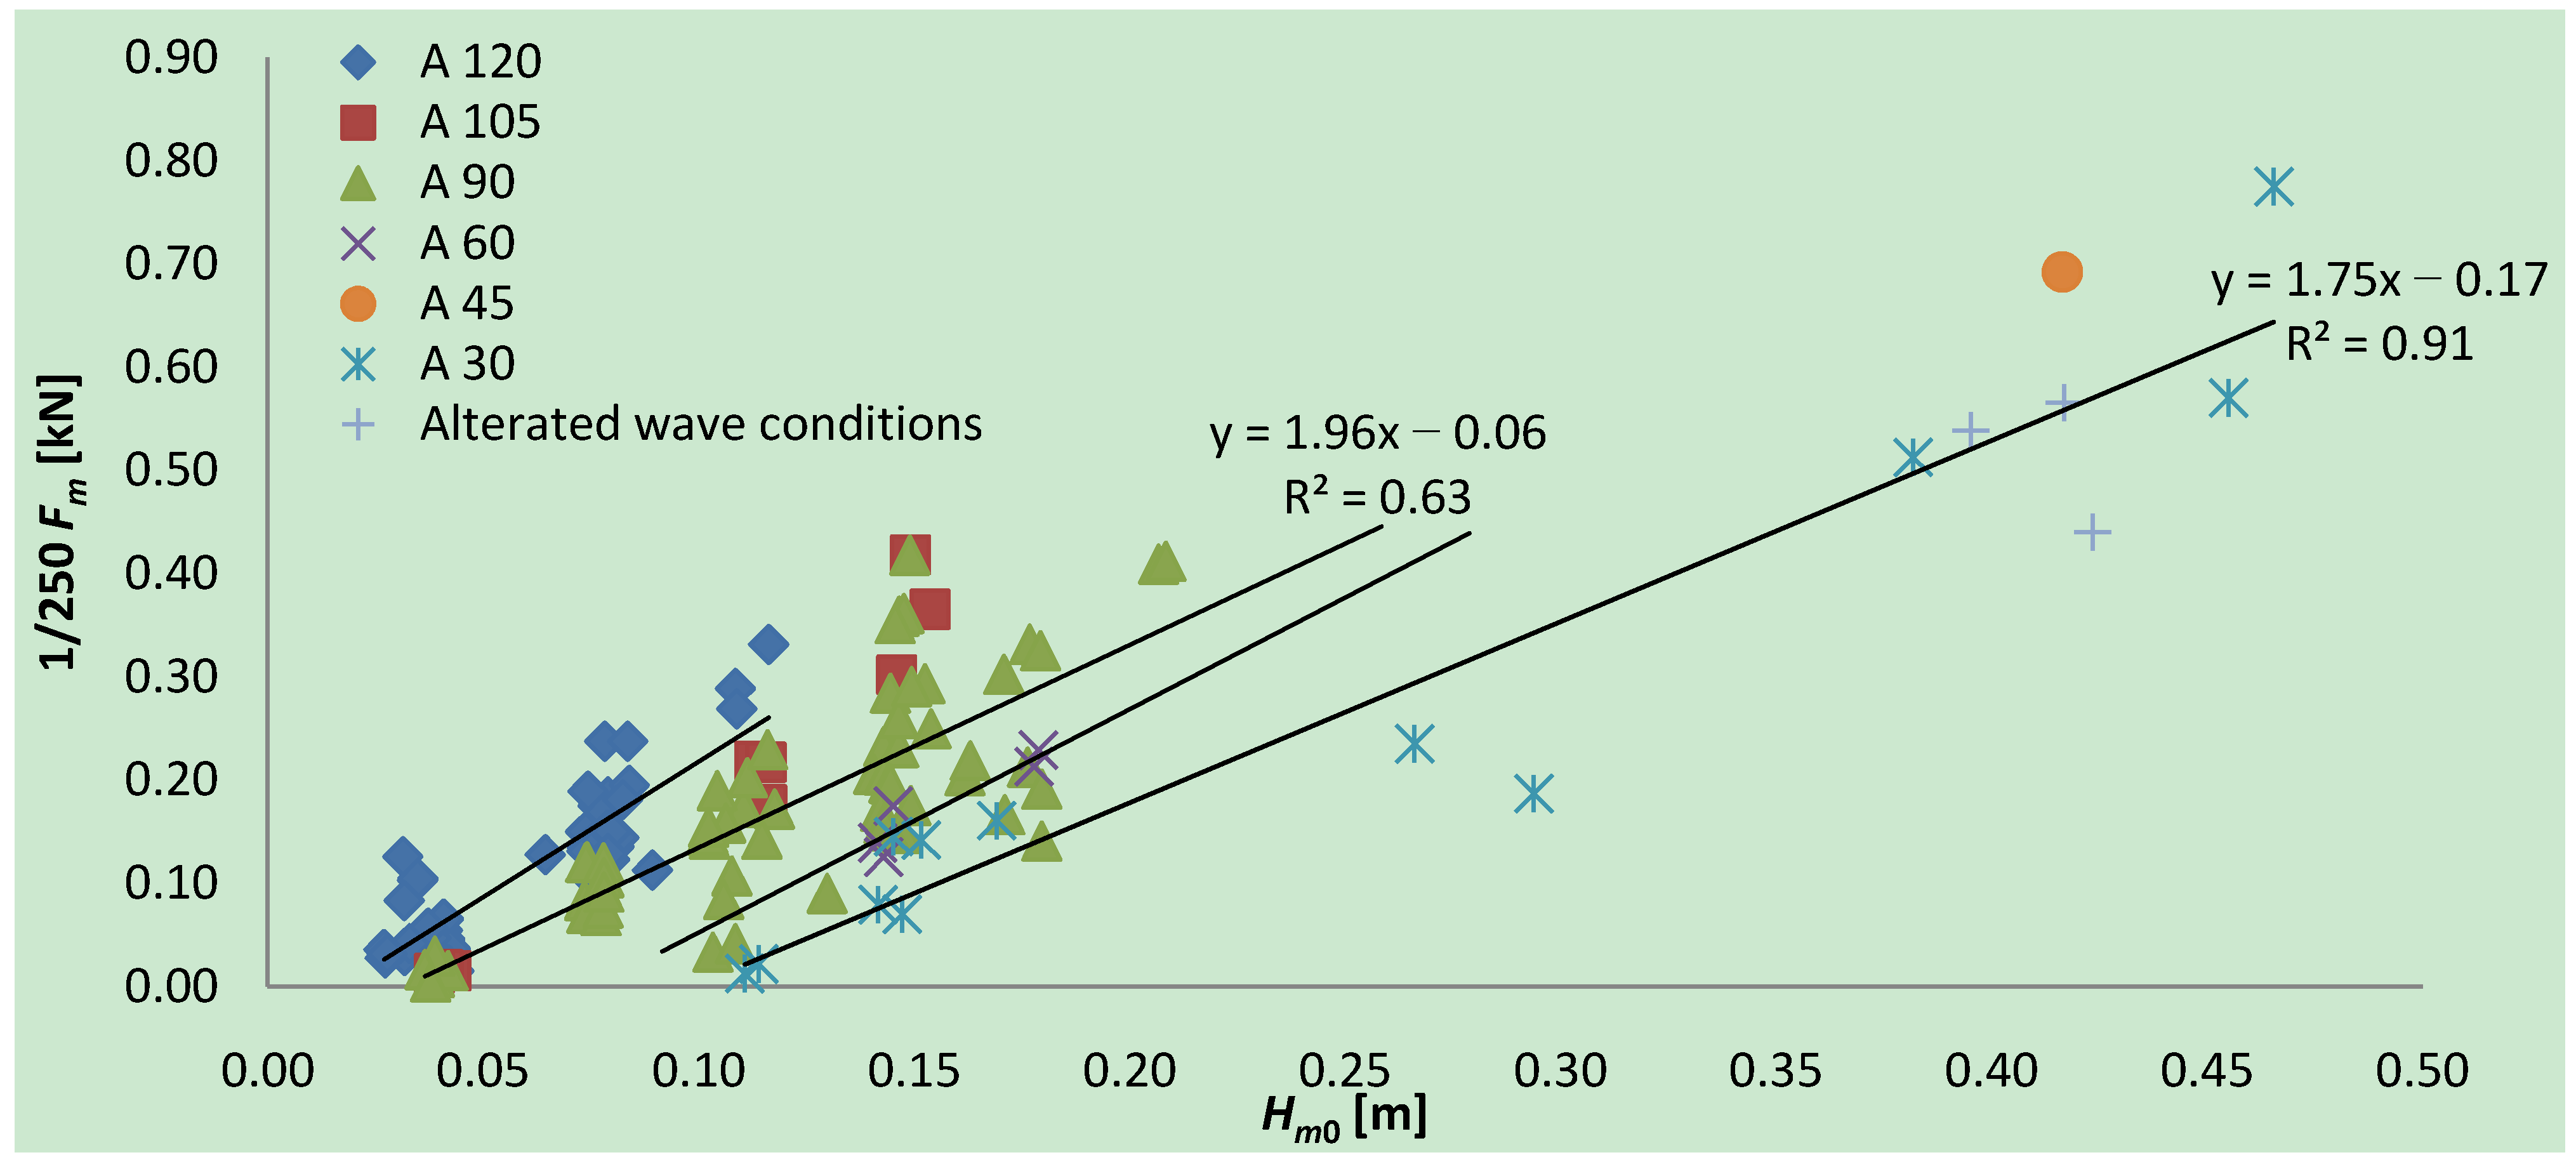
2.3. Mooring Forces and Structural Bending Moments
| Wave | Angle | Fm | Mx | Mz | Mtotal |
|---|---|---|---|---|---|
| State | [°] | [kN] | [kNm] | [kNm] | [kNm] |
| 1 | 90 | 146 | 9352 | 22014 | 30282 |
| 2 | 90 | 367 | 16919 | 39427 | 62684 |
| 3 | 90 | 570 | 23882 | 55447 | 92493 |
| 4 | 90 | 764 | 30541 | 70771 | 121007 |
| 5 | 90 | 1025 | 39471 | 91319 | 159241 |
| 10 years wave | 30 | 2022 | 97138 | 22021 | 89569 |
2.4. Individual Rotor Specifications
| Device | 1 Leg | 1 Rotor | Assumption/Comment | |
|---|---|---|---|---|
| Average Pmech [kW] | 108 | 54 | 2.7 | * every rotor contributes equally |
| Overall average ω [rpm] | 1.3 | 1.3 | 0.5 | * rotors are in rotation 40% of the time |
| → mean ω when engaged | 1.3 | |||
| Average ω in operation | 1.8 | 1.8 | 0.7 | * rotors are in rotation 40% of the time |
| → mean ω when engaged | 1.8 | |||
| Maximum (average) ω | 2.9 | 2.9 | 1.2 | * Highest average rpm in any wave conditions |
| → mean ω when engaged | 2.9 | |||
| Absolute Max ω (engaged) | 7.8 | 7.8 | 7.8 | * maximum-to-mean ratio of 2.7 (Table 2) |
| Rotations per year | 683310 | 273324 | * rotors are in rotation 40% of the time | |
| Overall Average τ [kNm] | 576 | 288 | 14.4 | * every rotor contributes equally |
| → mean τ when in rotation | 36.0 | * rotors are in rotation 40% of the time | ||
| Average τ in operation | 1012 | 506 | 25.3 | * every rotor contributes equally |
| → mean τ when engaged | 63.3 | * rotors are in rotation 40% of the time | ||
| Maximum (average) τ | 1294 | 647 | 32.4 | * Highest average torque in any conditions |
| → mean τ when engaged | 81 | |||
| Absolute Max τ (engaged) | 2200 | 1100 | 137 | * maximum-to-mean ratio of 1.7 (Table 2) |
3. Conclusion
| HanstolmWEPTOS WEC | |||||||||||
|---|---|---|---|---|---|---|---|---|---|---|---|
| Wave | Hs | Tp | Angle | η | Pmech | ω * | τ * | Fm | Mx * | Mz * | Mtotal * |
| State | [m] | [s] | [°] | [] | [kW] | [rpm] | [kNm] | [kN] | [kNm] | [kNm] | [kNm] |
| 1 | 1 | 5.4 | 90 | 0.40 | 68 | 1.2 | 210 | 146 | 9352 | 22014 | 30282 |
| 2 | 1.5 | 6 | 90 | 0.23 | 133 | 1.8 | 345 | 367 | 16919 | 39427 | 62684 |
| 3 | 2 | 6.6 | 90 | 0.16 | 187 | 1.9 | 428 | 570 | 23882 | 55447 | 92493 |
| 4 | 2.5 | 7.2 | 90 | 0.11 | 220 | 1.8 | 487 | 764 | 30541 | 70771 | 121007 |
| 5 | 3 | 7.8 | 90 | 0.07 | 248 | 1.8 | 558 | 1025 | 39471 | 91319 | 159241 |
| Overall | 0.12 | 103.5 | 1.3 | 288 | |||||||
| 10 years wave | 6.6 | 14 | 30 | 2022 | 97138 | 22021 | 89569 | ||||
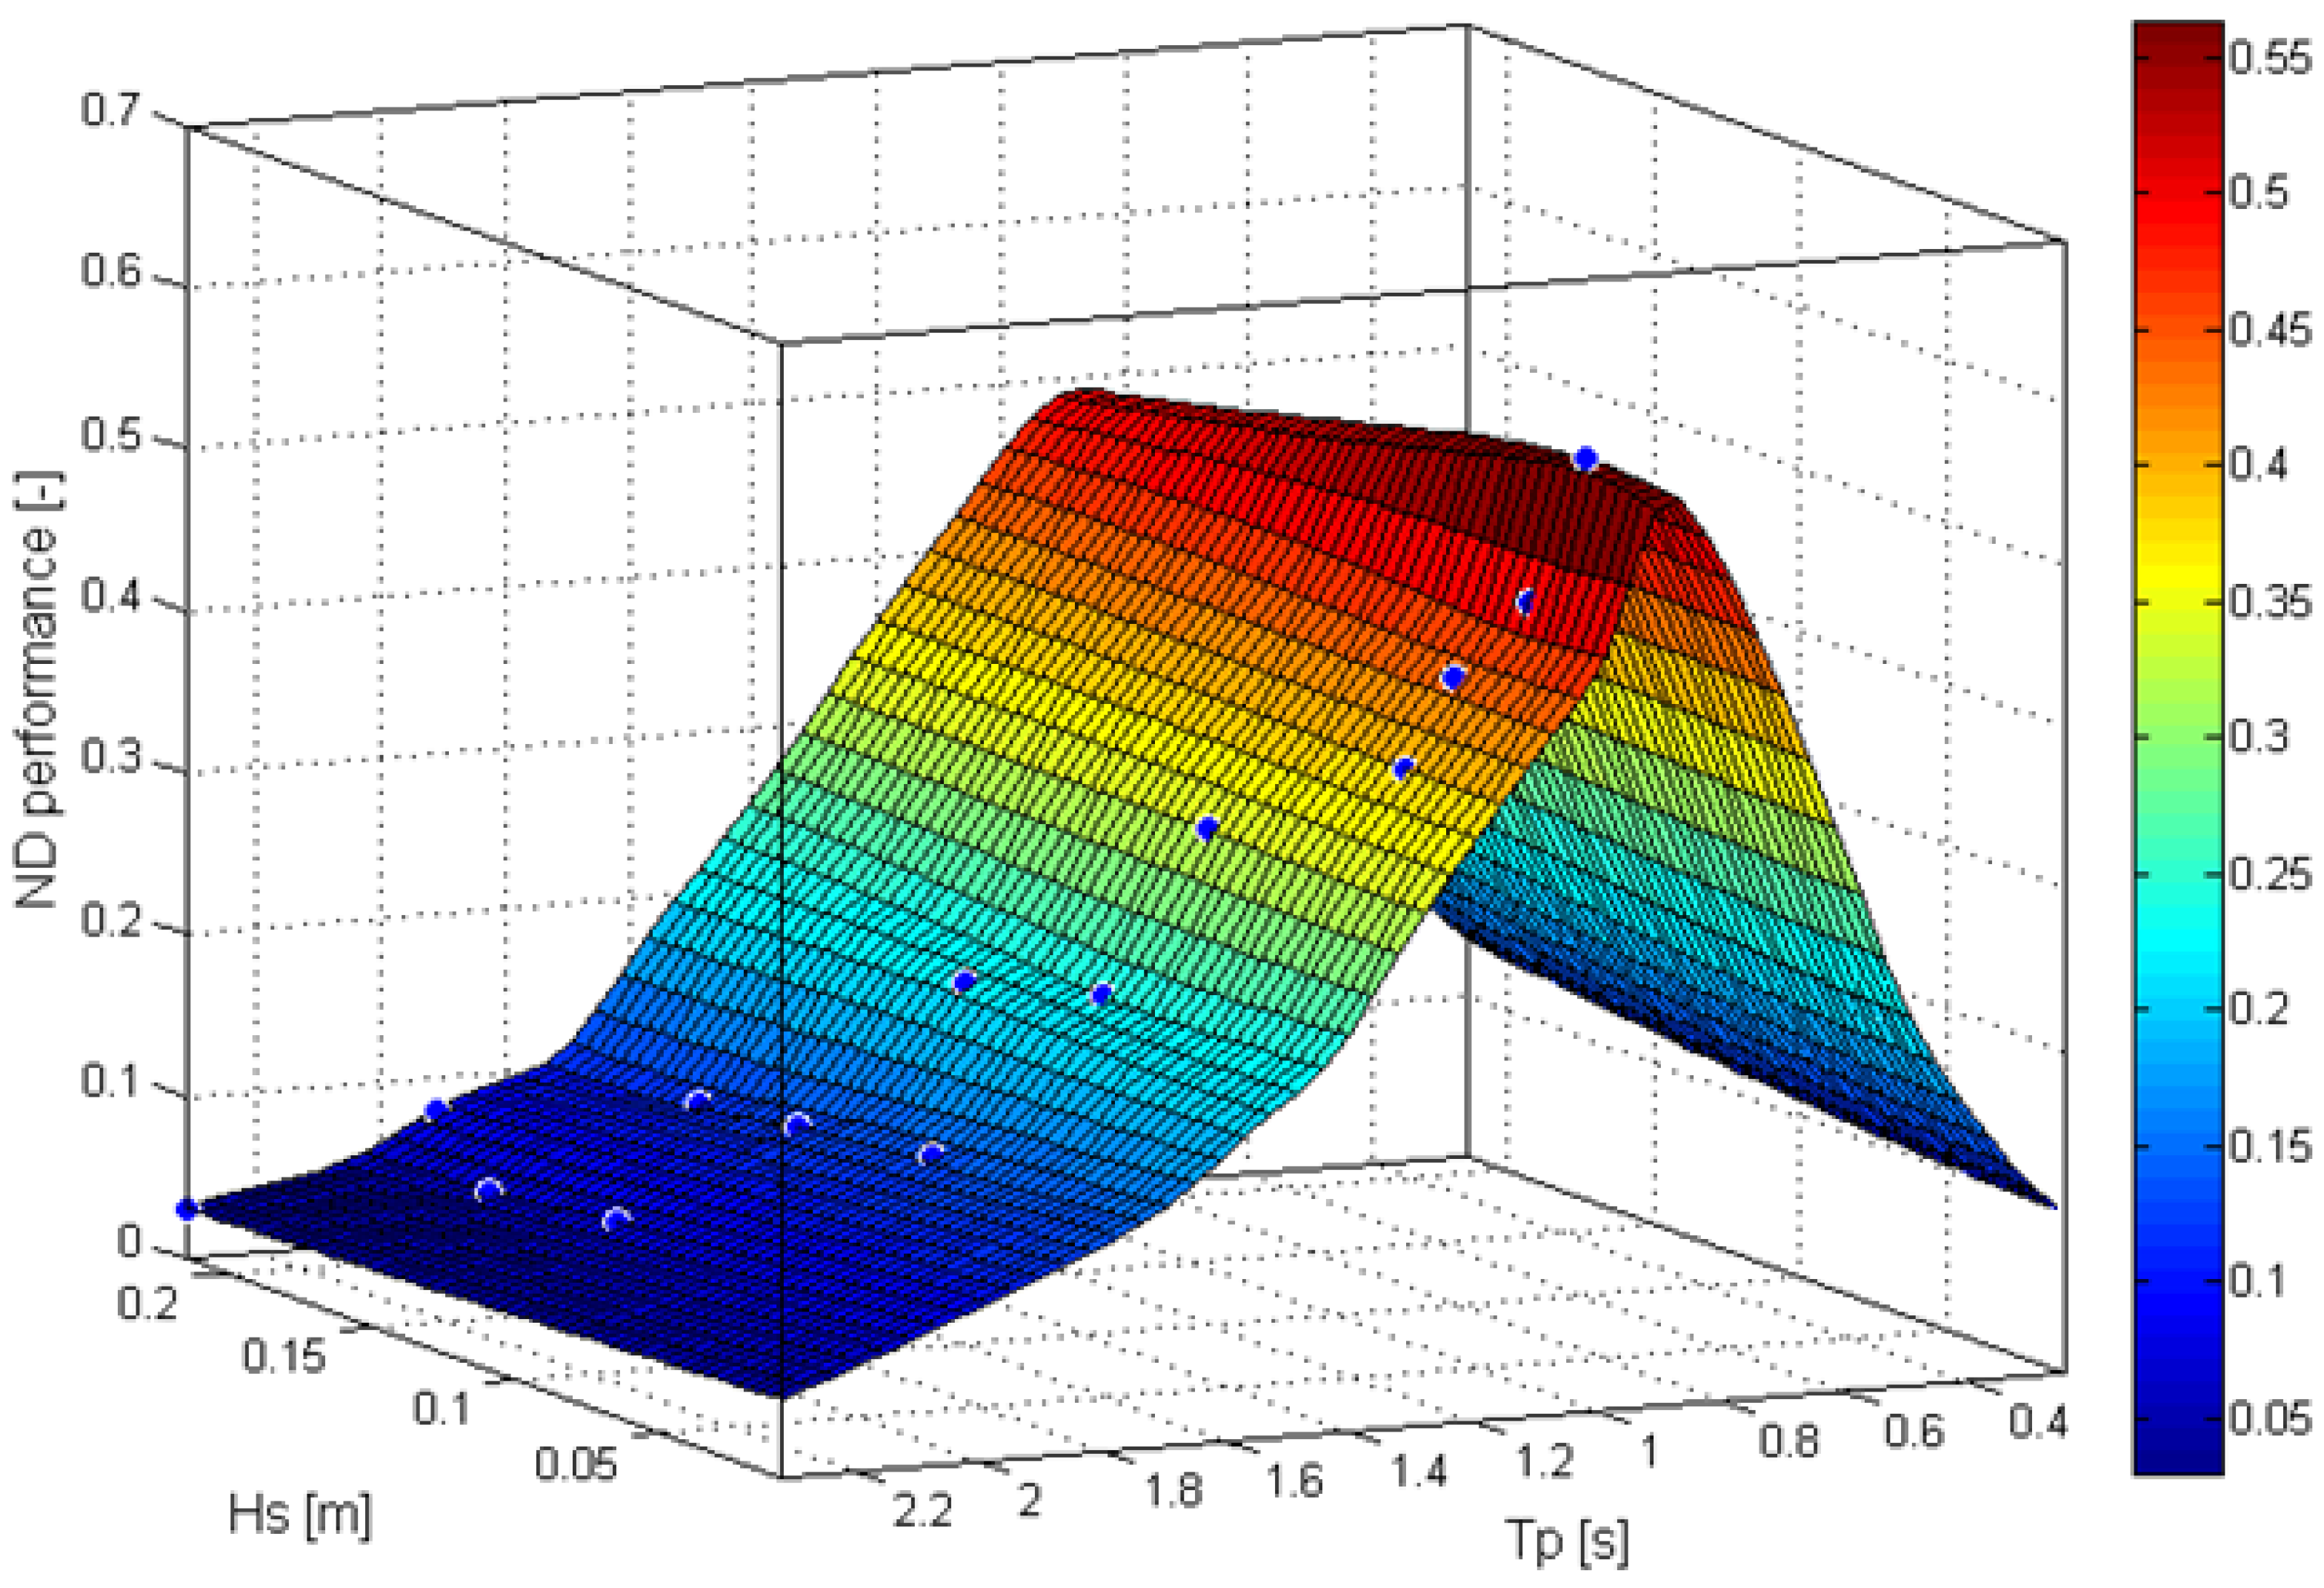
- The non-dimensional performance (η) is the ratio of the mechanical power (Pmech) available to the power take off (PTO) system, divided by the wave power over the effective width of all the rotors. This means that increasing the length of the legs will not have an impact on η but will increase Pmech for each axle in accordance.
- The maximum η that has been obtained during laboratory test is 0.57, which was in the smallest wave conditions, and the η tends to decrease with increase wave conditions (values of Hm0 and Tp). This indicates that the η could even be increased in smaller wave conditions and that a larger scaling ratio will result in a higher overall η.
- The maximum-to-mean fluctuations in Pmech can be reduced from around 5 to 2.8 without any significant loss in performance, while the fluctuations during operating conditions of ω and τ are around 2.7 and 1.7, independently of the wave conditions. These values are very low compared to most other WECs, which results from the combined power transmission axle for 20 rotors.
- The annual energy production (AEP) only decreases slightly (~4%) when the maximum Pmech is limited from its theoretical maximum of 439 kW to 250 kW (a drop of ~75% in installed PTO capacity). This results in a long term average Pmech of 103.5 kW, a load factor of 0.41 and an AEP of 0.9 GWh, for a WEPTOS WEC being installed in Hanstholm (6.1 kW/m).
- In the Hanstholm WEPTOS WEC a typical rotational speed of the main axles of around 2 rpm is expected. Gearing solutions for bringing the rotational speed to a suitable level for use of standard wind turbine generator equipment has been identified.
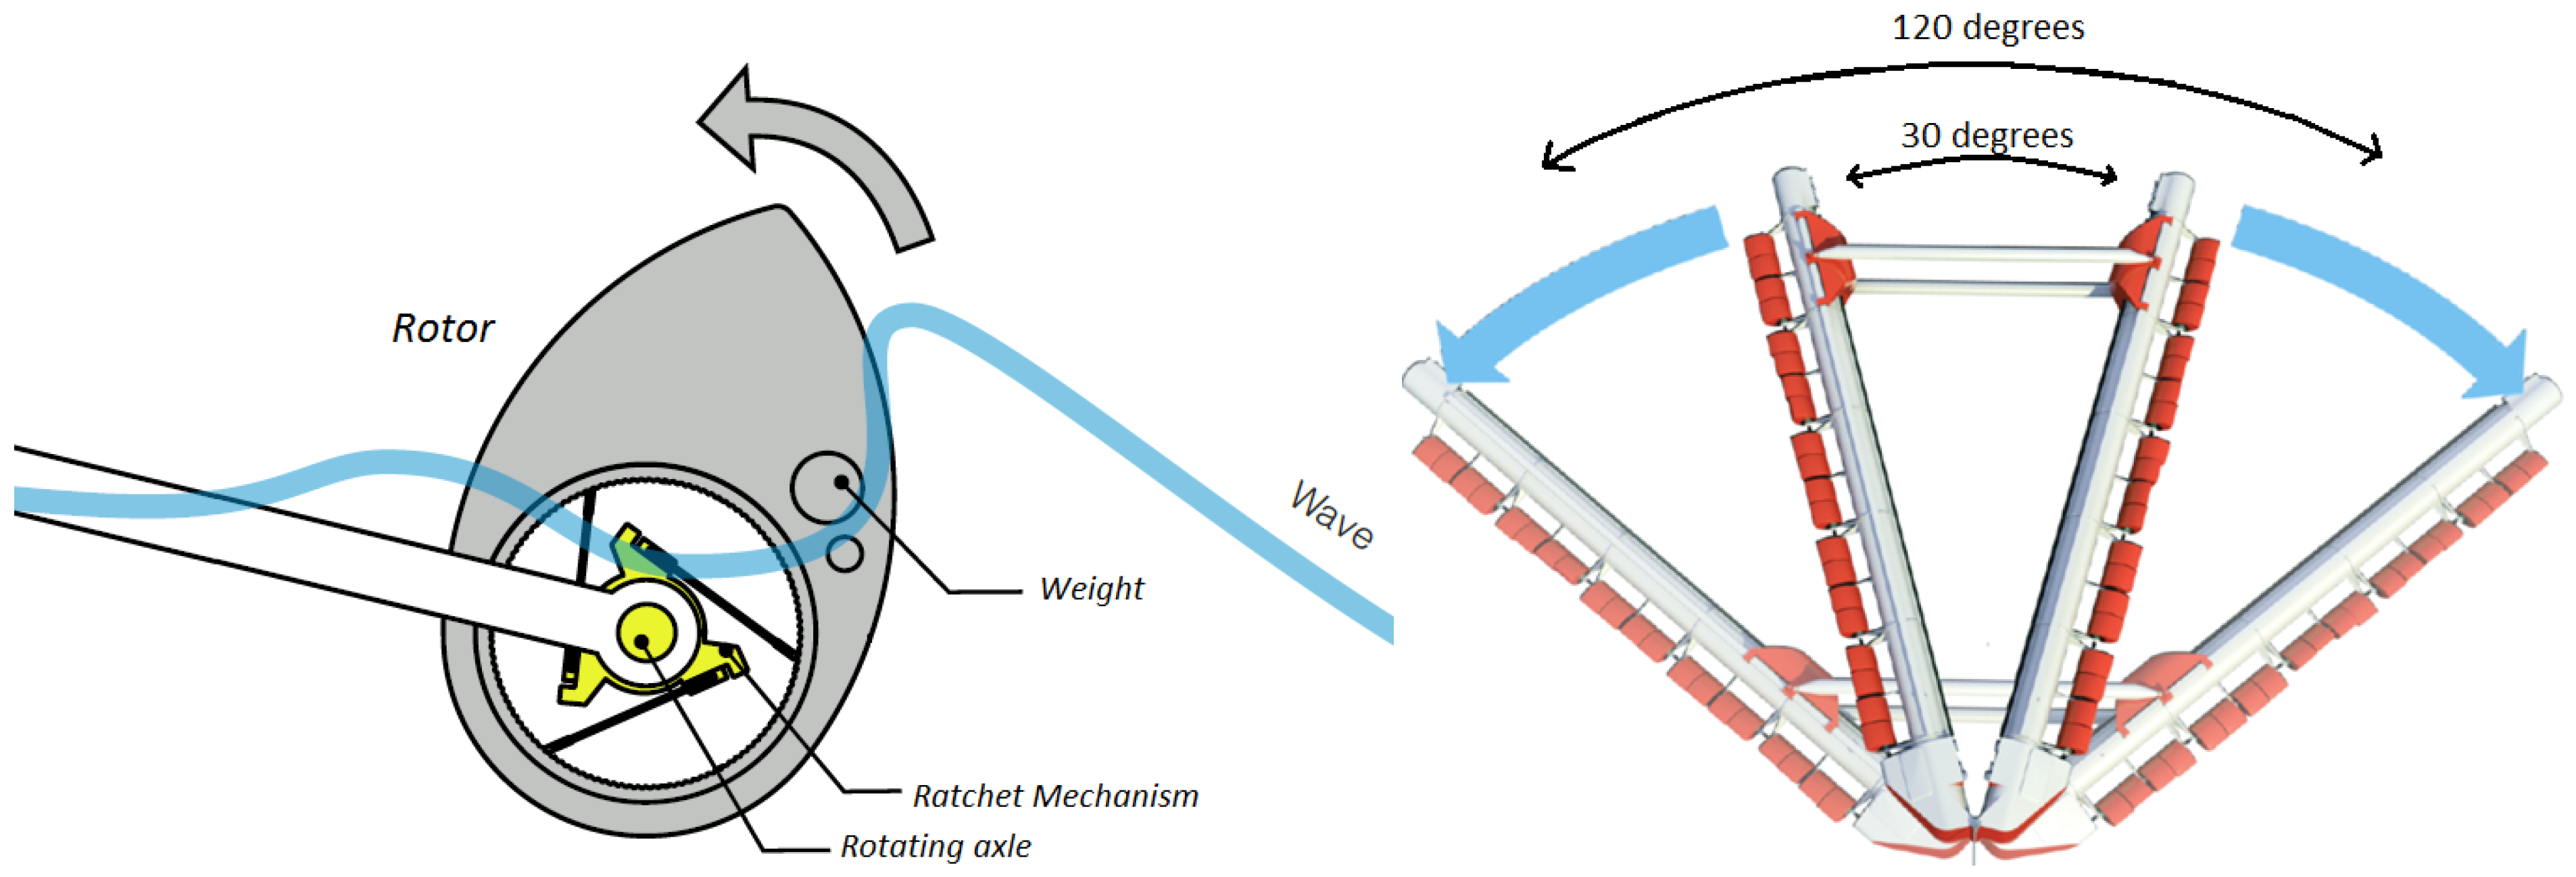
- The survival mechanism, which relies on reducing the angle between the two legs of the structure down to 30°, enables bringing the structural bending moments in extreme wave conditions below the level of the structural bending moments in normal power production wave conditions. Also the mooring forces are significantly reduced, however in extreme wave conditions they will be above normal operation levels. This illustrates that the mechanism is very effective and that the dimensions, and there by economics, of the structure is not determined by some rarely occurring extreme wave conditions, but by daily operating conditions which are also responsible for generating the revenue of the WEC [12].
Nomenclature
| AEP | Annual (mechanical) energy production | [GWh] |
| Contrib | Contribution to the available wave power | [-] |
| Hs | Significant wave height | [m] |
| Hm0 | Significant wave height estimated from the spectrum (m), 4√m0 | [m] |
| Mx | Structural bending moment around the horizontal axis | [Nm] |
| Mz | Structural bending moment around the vertical axis | [Nm] |
| Mtotal | Combined structural bending moment | [Nm] |
| PTO | Power take off | |
| Pmech | Mechanical power | [kW] |
| Prob | Probability of occurrence | [-] |
| Pwave | Wave power | [kW/m] |
| Tp | Peak wave period | [s] |
| WEC | Wave energy converter | |
| WS | Wave State | |
| η | Non-dimensional performance (or ND performance) | [-] |
| ω | Rotational speed of the axle | [rpm] |
| τ | Torque measured on the axle between the rotors and the PTO system | [Nm] |
Acknowledgments
References
- Pecher, A.; Kofoed, J.P.; Marchalot, T. Experimental Study of the WEPTOS Wave Energy Converter; DCE Contract Report, Aalborg University: Aalborg, Denmark, 2011. [Google Scholar]
- Pecher, A.; Kofoed, J.P.; Larsen, T.; Marchalot, T. Experimental Study on the WEPTOS Wave Energy Converter. In Proceedings of International Conference on Offshore Mechanics and Arctic Engineering (OMAE), Rio de Janeiro, Brazil, July 2012. accepted.
- Salter, S.H. Wave power. Nature 1974, 249, 720–724. [Google Scholar] [CrossRef]
- Nielsen, K.; Pontes, T. Generic and Site-Related Wave Energy Data; Final Technical Report; OES-IEA: Lisboa, Portugal, 2010. [Google Scholar]
- Holmes, B. Tank Testing of Wave Energy Conversion Systems; The European Marine Energy Centre: Orkney, UK, 2009. [Google Scholar]
- The Cantabria Coastal and Ocean Basin (CCOB). Available online: http://www.ihcantabria.com/WebIH/en/facilities/ccob.aspx (accessed on 12 February 2012).
- Pecher, A.; Kofoed, J.P.; Larsen, T.; Marchalot, T. Experimental Study on a Rotor for the WEPTOS Wave Energy Converter; DCE Contract Report; Aalborg University: Aalborg, Denmark, 2011. [Google Scholar]
- Ruellan, M.; BenAhmed, H.; Multon, B.; Josset, C.; Babarit, A.; Clement, A. Design methodology for a SEAREV wave energy converter. IEEE Trans. Energy Convers. 2010, 25, 760–767. [Google Scholar] [CrossRef]
- O’Sullivan, D.; Griffiths, J.; Egan, M.G.; Lewis, A.W. Development of an electrical power take off system for a sea-test scaled offshore wave energy device. Renew. Energy 2010, 36, 1236–1244. [Google Scholar] [CrossRef]
- O’Sullivan, D.; Lewis, A.W. Generator Selection and Comparative Performance in Offshore Oscillating Water Column Ocean Wave Energy Converters. IEEE Trans. Energy Convers. 2011, 26, 603–614. [Google Scholar] [CrossRef]
- Kofoed, J.P.; Frigaard, P. Development of Wave energy Converters: The Danish Case. Renew. Ocean Energy 2009, 4, 83–96. [Google Scholar]
- Bjerke, I.K.; Sjolte, J.; Hjetland, E.; Tjensvoll, G. Experiences from Field Testing with the BOLT Wave Energy Converter. In Proceedings of the European Wave and Tidal Energy Conference (EWTEC), Southampton, UK, September 2011.
© 2012 by the authors; licensee MDPI, Basel, Switzerland. This article is an open access article distributed under the terms and conditions of the Creative Commons Attribution license (http://creativecommons.org/licenses/by/3.0/).
Share and Cite
Pecher, A.; Kofoed, J.P.; Larsen, T. Design Specifications for the Hanstholm WEPTOS Wave Energy Converter. Energies 2012, 5, 1001-1017. https://doi.org/10.3390/en5041001
Pecher A, Kofoed JP, Larsen T. Design Specifications for the Hanstholm WEPTOS Wave Energy Converter. Energies. 2012; 5(4):1001-1017. https://doi.org/10.3390/en5041001
Chicago/Turabian StylePecher, Arthur, Jens Peter Kofoed, and Tommy Larsen. 2012. "Design Specifications for the Hanstholm WEPTOS Wave Energy Converter" Energies 5, no. 4: 1001-1017. https://doi.org/10.3390/en5041001
APA StylePecher, A., Kofoed, J. P., & Larsen, T. (2012). Design Specifications for the Hanstholm WEPTOS Wave Energy Converter. Energies, 5(4), 1001-1017. https://doi.org/10.3390/en5041001