1. Introduction
Secondary batteries are commonly utilized as energy storage solutions for modern technologies such as portable devices, renewable energy systems and electric vehicles. Among secondary batteries, the lithium ion (Li-ion) battery has become most popular because it offers many advantages such as high power and energy density, high open circuit voltage, low self-discharge rate, low maintenance requirement and no memory effect. Recent trends show that Li-ion batteries are not only widely used in portable consumer electronics, but are also gaining popularity for renewable energy, electric vehicle and military applications. According to the literature, charging methods have a significant influence on the performance and lifetime of Li-ion batteries. Therefore, designing a high-quality battery charger is essential. The objectives of a high-quality charger include high charging efficiency, short charging time and prolonged cycle life [
1,
2,
3,
4,
5].
The commonly adopted charging method for Li-ion batteries is the constant current-constant voltage (CC-CV) method. For the CC-CV method, a large constant current is applied at the beginning of the charging cycle when the battery state of charge (SOC) is low. When the battery voltage raises to some predefined limit, the charger switches to constant voltage charging mode and continues in that mode until the charging current decreases to a predetermined small value. Although the CC-CV is simple to implement, it is not suitable for rapid charging because CV charging seriously extends the overall charging time and also reduces the cycle life of the battery.
To deal with this problem, many advanced battery charging techniques are proposed in the literature [
6,
7,
8,
9,
10,
11,
12,
13,
14,
15,
16,
17,
18,
19,
20]. In [
6] and [
7], PLL-based battery chargers (PLBC) are proposed. Based on PLBC, optimal pulse frequency and optimal duty cycle can then be determined using sweeping method to improve the performance of the PLBC [
8,
9]. In addition, the effect of the internal resistance on the open circuit voltage is also taken into account in [
10] to improve the charging speed of PLBC. In [
11] and [
12], a sinusoidal-ripple current charging strategy is proposed; this approach can minimize the battery impedance and consequently maximize the energy transfer efficiency. The reason for using pulsed charging and sinusoidal current charging technique is that the internal pressures obtained by pulsed charging and sinusoidal current charging are smaller than that obtained by CC charging [
6,
7,
8,
9,
10,
11,
12]. However, these methods require dedicated hardware to generate pulsed or sinusoidal charging current. In addition, these methods are not truly “adaptive” because additional “search mode” should be utilized to determine the optimal pulse frequency/duty cycle value [
8,
9]. Another way which can be utilized to reduce the charging time is to adjust the charging current in accordance with the battery status using an intelligent controller. To achieve this goal, an fuzzy-based controller is employed in [
13] and a grey-predicted controller is applied in [
14]. In both [
13] and [
14], the proposed intelligent controllers only replace the CV mode in CC-CV charging method, thus the charging current in CC mode is kept constant. In [
15], a genetic algorithm trained generalized regression neural network is used to determine the charging current of an ultra-fast charger. The proposed charger can significantly reduce the charging time; however, it can only be applied to Ni-Cd battery. Global optimization techniques, including ant colony algorithm and Taguchi approach, are proposed to obtain the optimal multi-stage CC charging profile [
16,
17,
18]. These methods intend to find an optimal charging pattern covering the whole charging process and do not regulate charging current in real time. In [
19], a new digital-controlled technique for battery charger is presented to achieve CC-CV control without requiring current feedback. In [
20], a DSP-based probabilistic fuzzy neural network controller is proposed to replace the traditional proportional-integral controller. The transient of voltage regulation during load variation can be significantly improved.
From the descriptions above, it is obvious that an intelligent charging algorithm which can properly determine the charging current according to measured battery parameters is essential. In this study, a fuzzy-logic-control-based (FLC-based) five-stage Li-ion battery charger is proposed based on the concept presented in [
21]. The proposed charger takes the temperature rise and the gradient of temperature rise of battery into account, and adjusts the charging current accordingly. Recently, fuzzy logic controllers (FLCs) have been successfully applied to various fields of engineering. FLCs are robust and are relatively simple to design as they do not require the knowledge of the accurate mathematical model [
22,
23,
24,
25,
26]. The proposed FLC-based controller is then improved by using Taguchi method to optimize the output membership function (MF) of the fuzzy system. The Taguchi method provides a systematic and effective way for conducting experiments to determine optimal values [
17,
27]. By using orthogonal arrays (OAs), the Taguchi method can search in the parameter space with a reduced number of experiments [
18,
28]. Since the aim of this study is to develop an intelligent charger with short charging time, high charging efficiency and low temperature increment; therefore, the optimization can be regarded as a multiple performance characteristic index (MPCI) problem [
29,
30]. To solve this kind of problem, fuzzy logic is combined with Taguchi method to obtain the optimal output MF of the proposed FLC-based battery charger. The design procedures will be described in detail, and experiments will be carried out to validate the effectiveness of the proposed methods. According to the experimental results, the proposed FLC-based battery charger is capable of charging Li-ion batteries to 85% capacity in 43.6 min. Comparing to conventional CC-CV and multi-stage CC charging strategy, the charging time, charging efficiency, maximum temperature increment and the lifetime of the Li-ion battery can be improved.
2. System Configuration
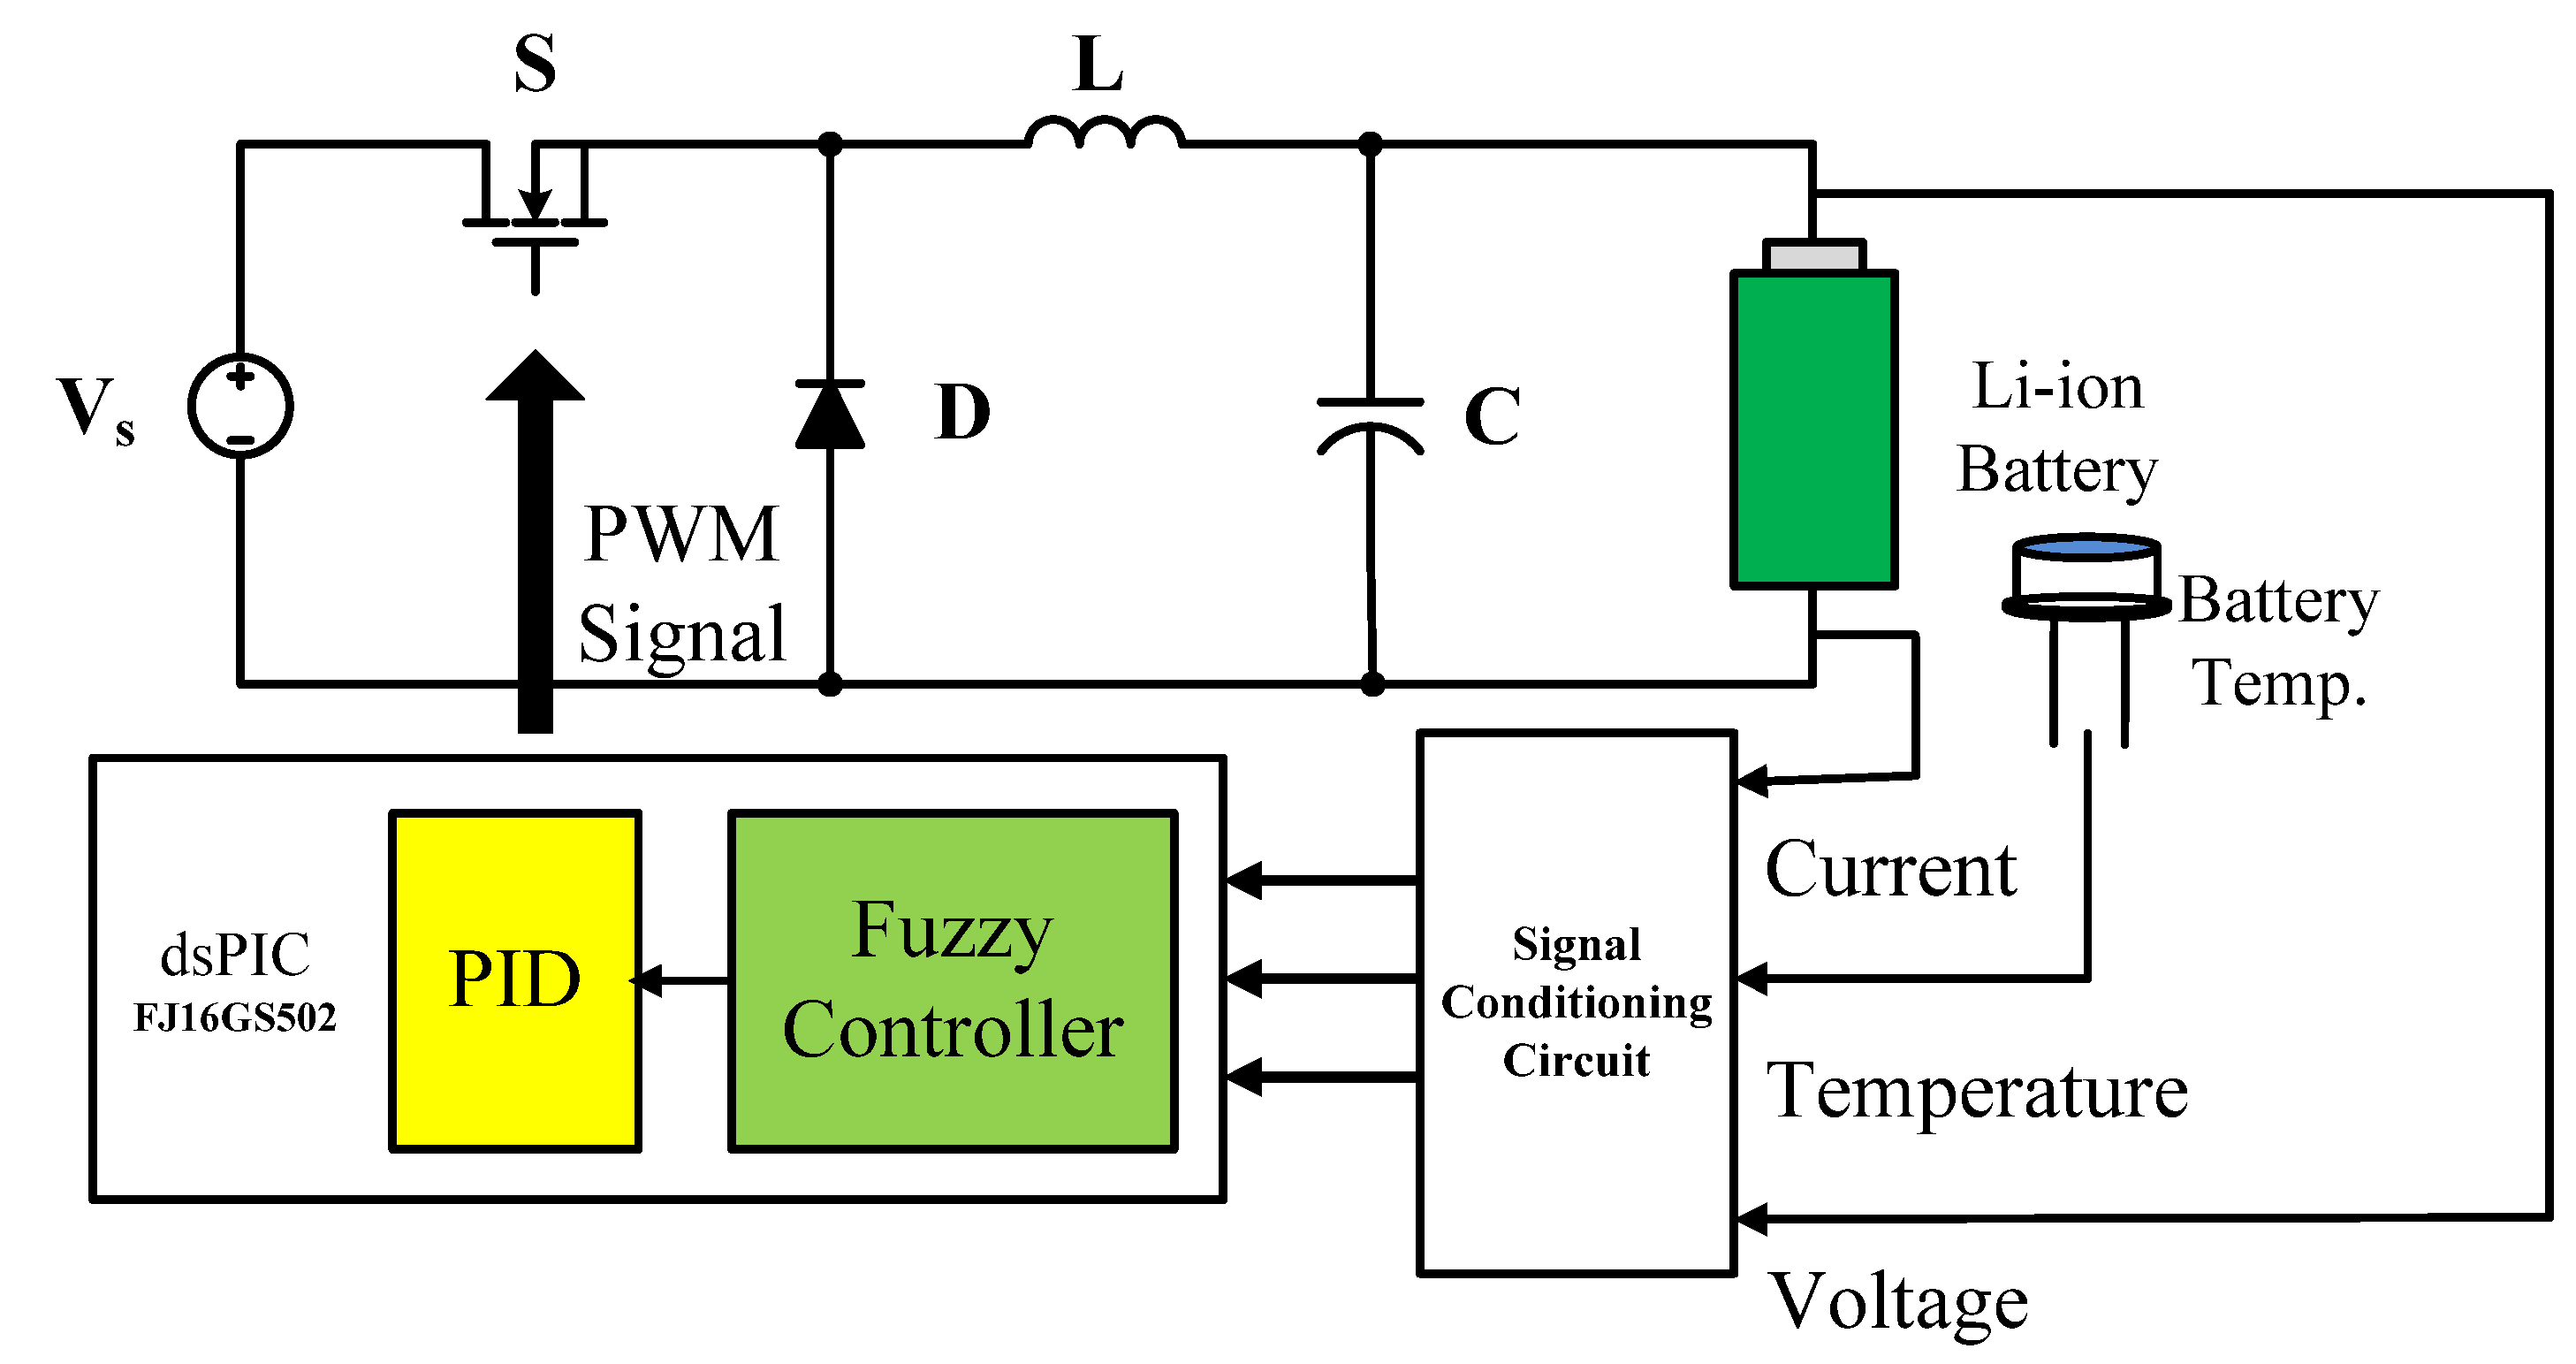
Figure 1 shows the block diagram of the proposed battery charger. In
Figure 1, the input power source of the proposed Li-ion battery charger is a commercially available adaptor, and the battery used is a 4.2 V, 2000 mAh 18650 Li-ion battery for notebook computers. From
Figure 1, the whole system can be divided into three major parts: (a) input/output interfacing unit; (b) digital control unit and (c) power conversion unit. Detailed descriptions about each unit will be given in the following subsections:
(a) Input/output interfacing unit: the I/O interfacing unit includes feedback circuits which are used to measure the voltage, current and temperature of the battery, and signal conditioning circuits which perform amplification and range adaptation on feedback signals. In this study, the battery voltage and current are sensed using differential amplifier circuits. The temperature is sensed using LM35 precision temperature sensor IC from Texas Instrument Corp. In order to record the long-term experimental data, a graphical user interface (GUI) based on LabVIEW from National Instruments Corp. is also developed to offer a user-friendly monitoring interface of the proposed charger.
(b) Digital control unit: the digital control unit regulates the charging current according to the battery status. In this study, the dsPIC33FJ16GS502 digital signal controller (DSC) from Microchip Corp. is used to implement the proposed charging algorithm. PWM modulation strategies and interfacing IC driving signals are also realized using the same DSC to achieve better performance. After the required battery status data (voltage, current and temperature) is acquired, proper charging current can then be determined through the proposed FLC-based battery charger. Detailed description of the software part will be provided in
Section 3.
(c) Power conversion unit: a power conversion unit is used to supply the electric power to the Li-ion battery. As shown in
Figure 1, a simple buck type DC-DC converter is used as the charging unit. By adequately controlling the PWM gating signal, the power conversion unit can transfer the required energy to the Li-ion battery. The design and implementation of this part of circuit is conventional; therefore, it will not be discussed further here.
Figure 1.
Hardware configuration of the proposed charger.
Figure 1.
Hardware configuration of the proposed charger.
3. FLC-Based Five-Stage Li-Ion Battery Charger
According to the literature, the multi-stage CC charging algorithm has certain advantages such as long cycle life, high charging efficiency and short charging time. However, due to the complex electrochemical characteristics of the Li-ion batteries, the optimal charging current for each stage is hard to obtain [
16,
17,
18]. The Taguchi method is utilized by the authors in [
17] to obtain an optimal multi-stage CC charging pattern. However, the obtained charging profile is fixed and cannot adapt to the operating condition in real time. In order to achieve higher charging efficiency, a FLC similar to that presented in [
21] is integrated into the obtained five-stage CC charging algorithm to fine-tune the charging current.
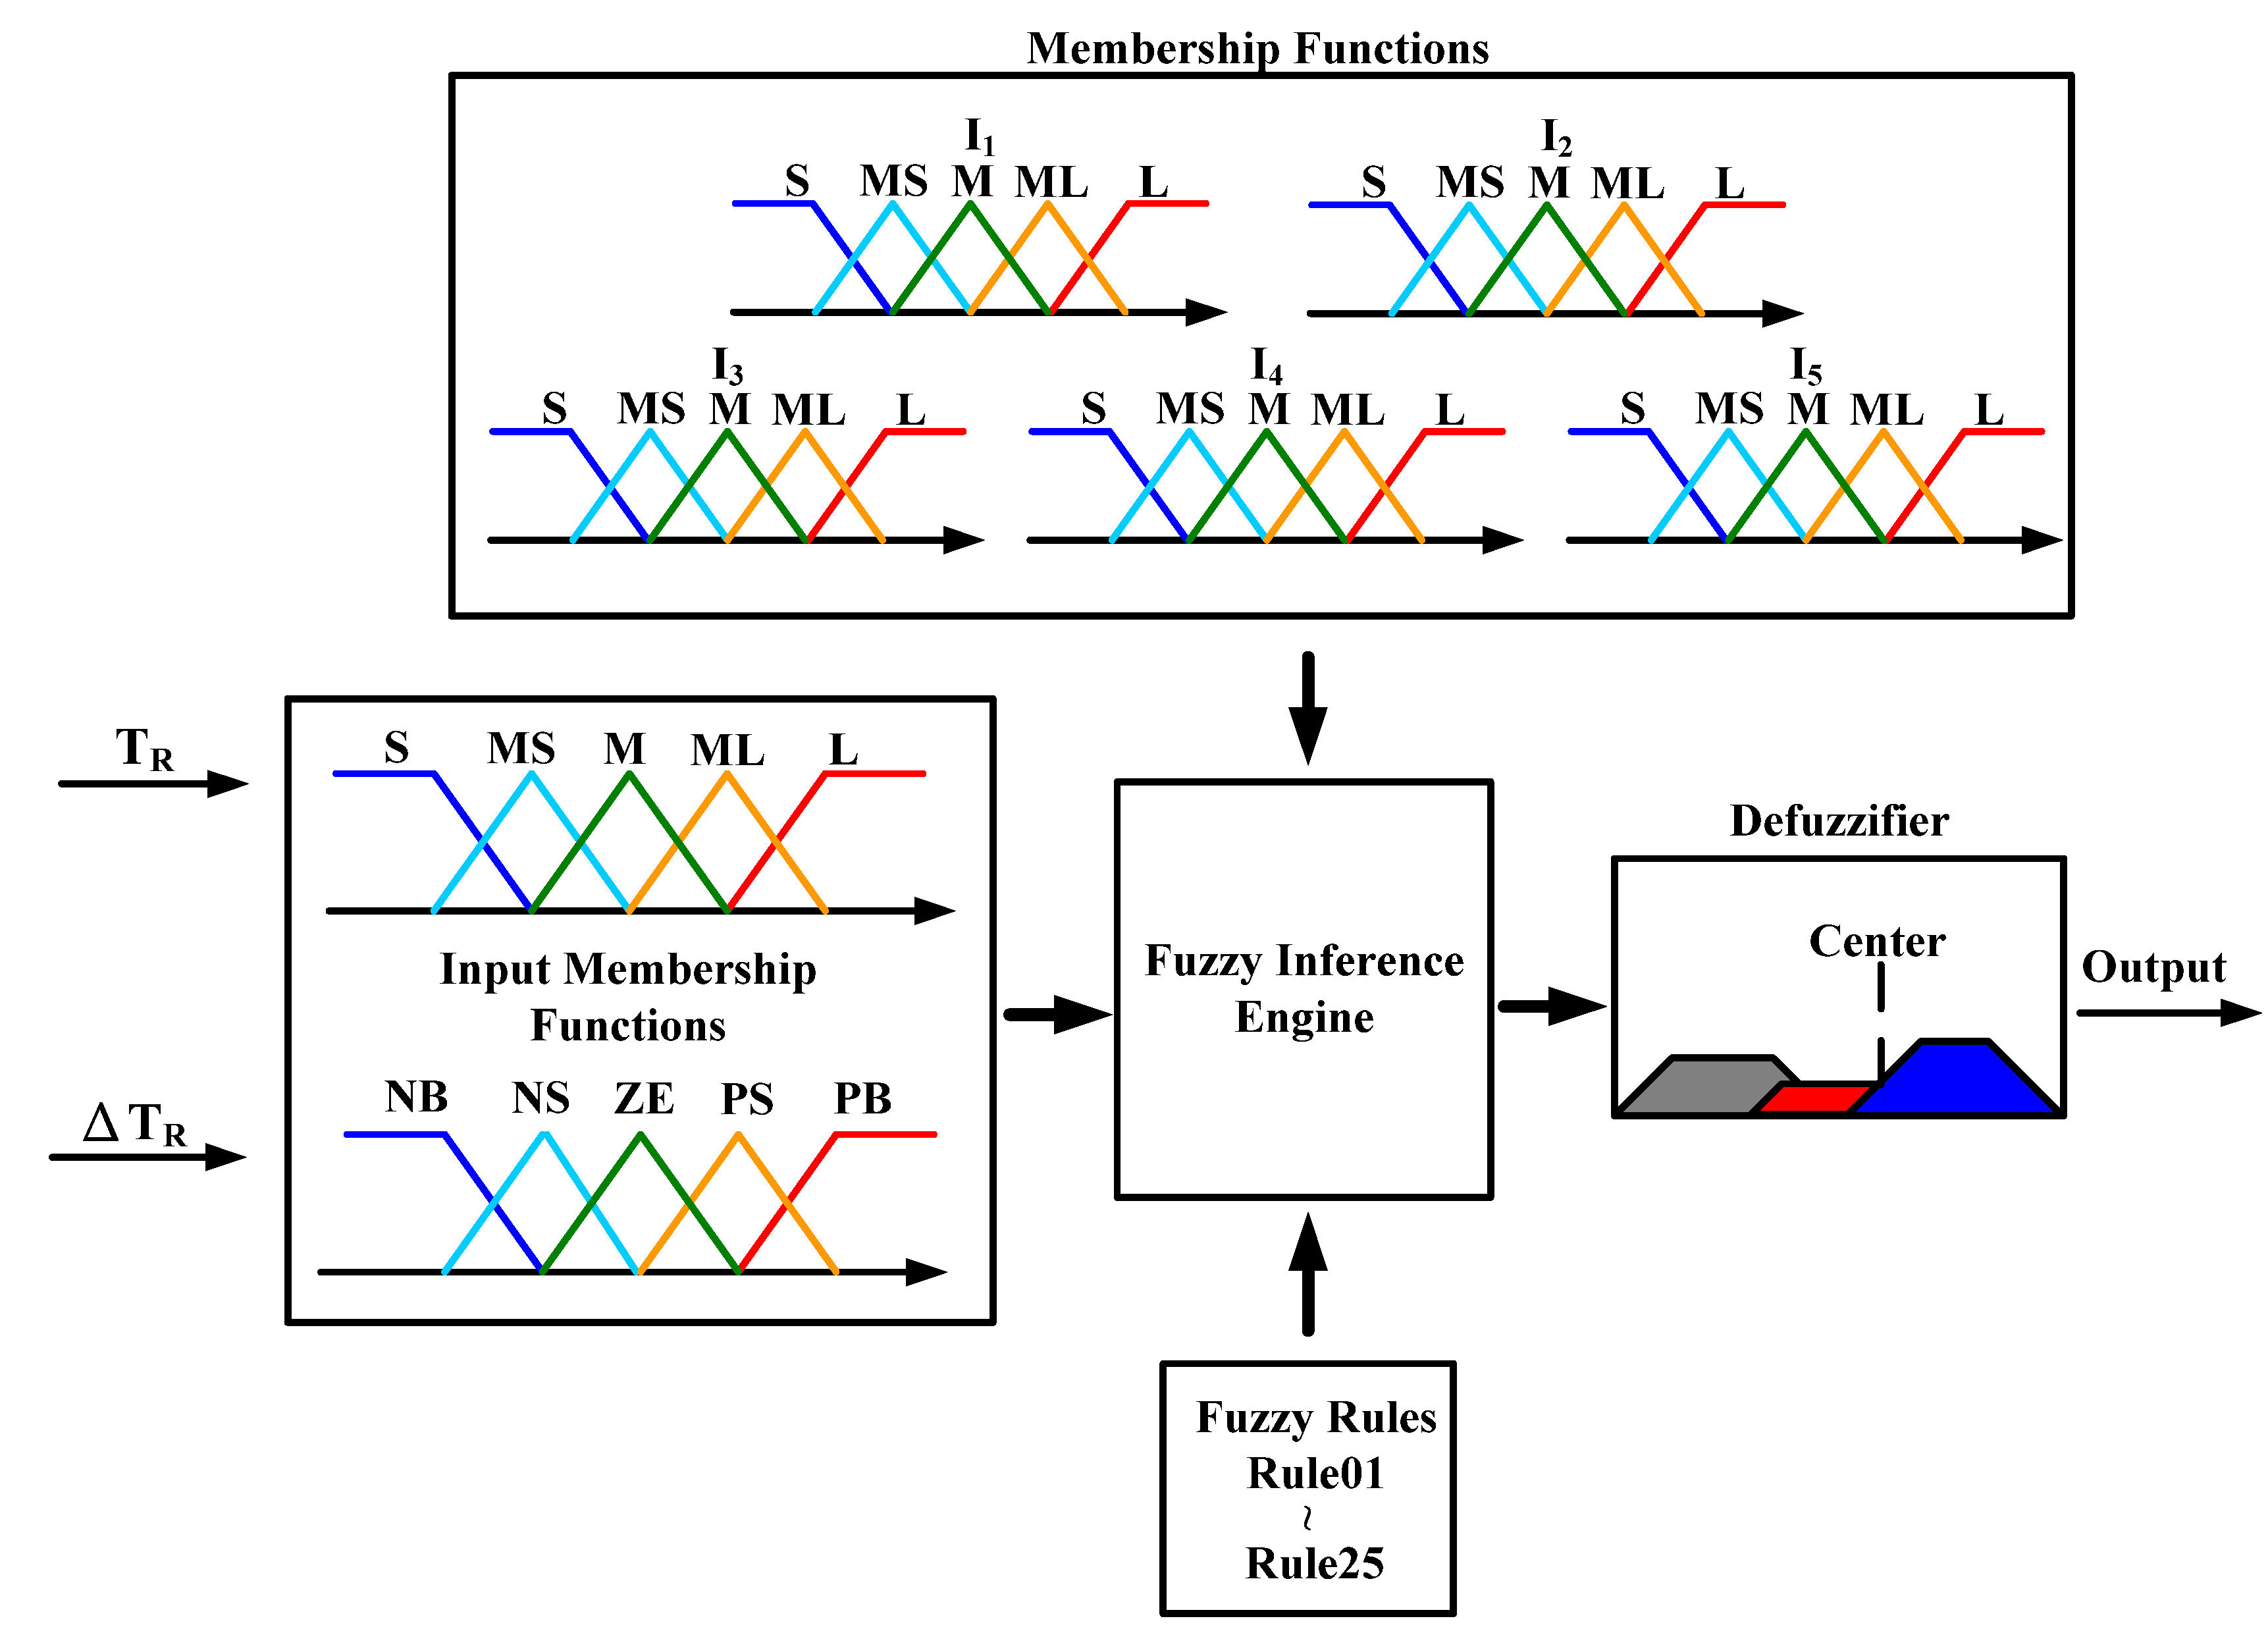
Figure 2 shows the block diagram of the proposed FLC. Because improper charging results in excessive temperature rise in the battery and temperature will also affect the effective charging resistance; therefore the temperature rise
TR and the gradient of temperature rise Δ
TR are chosen as the inputs of the proposed FLC in this study.
TR and Δ
TR can be defined as:
where
TB is the battery surface temperature and
TA is the ambient temperature.
Figure 2.
Block diagram of the proposed FLC.
Figure 2.
Block diagram of the proposed FLC.
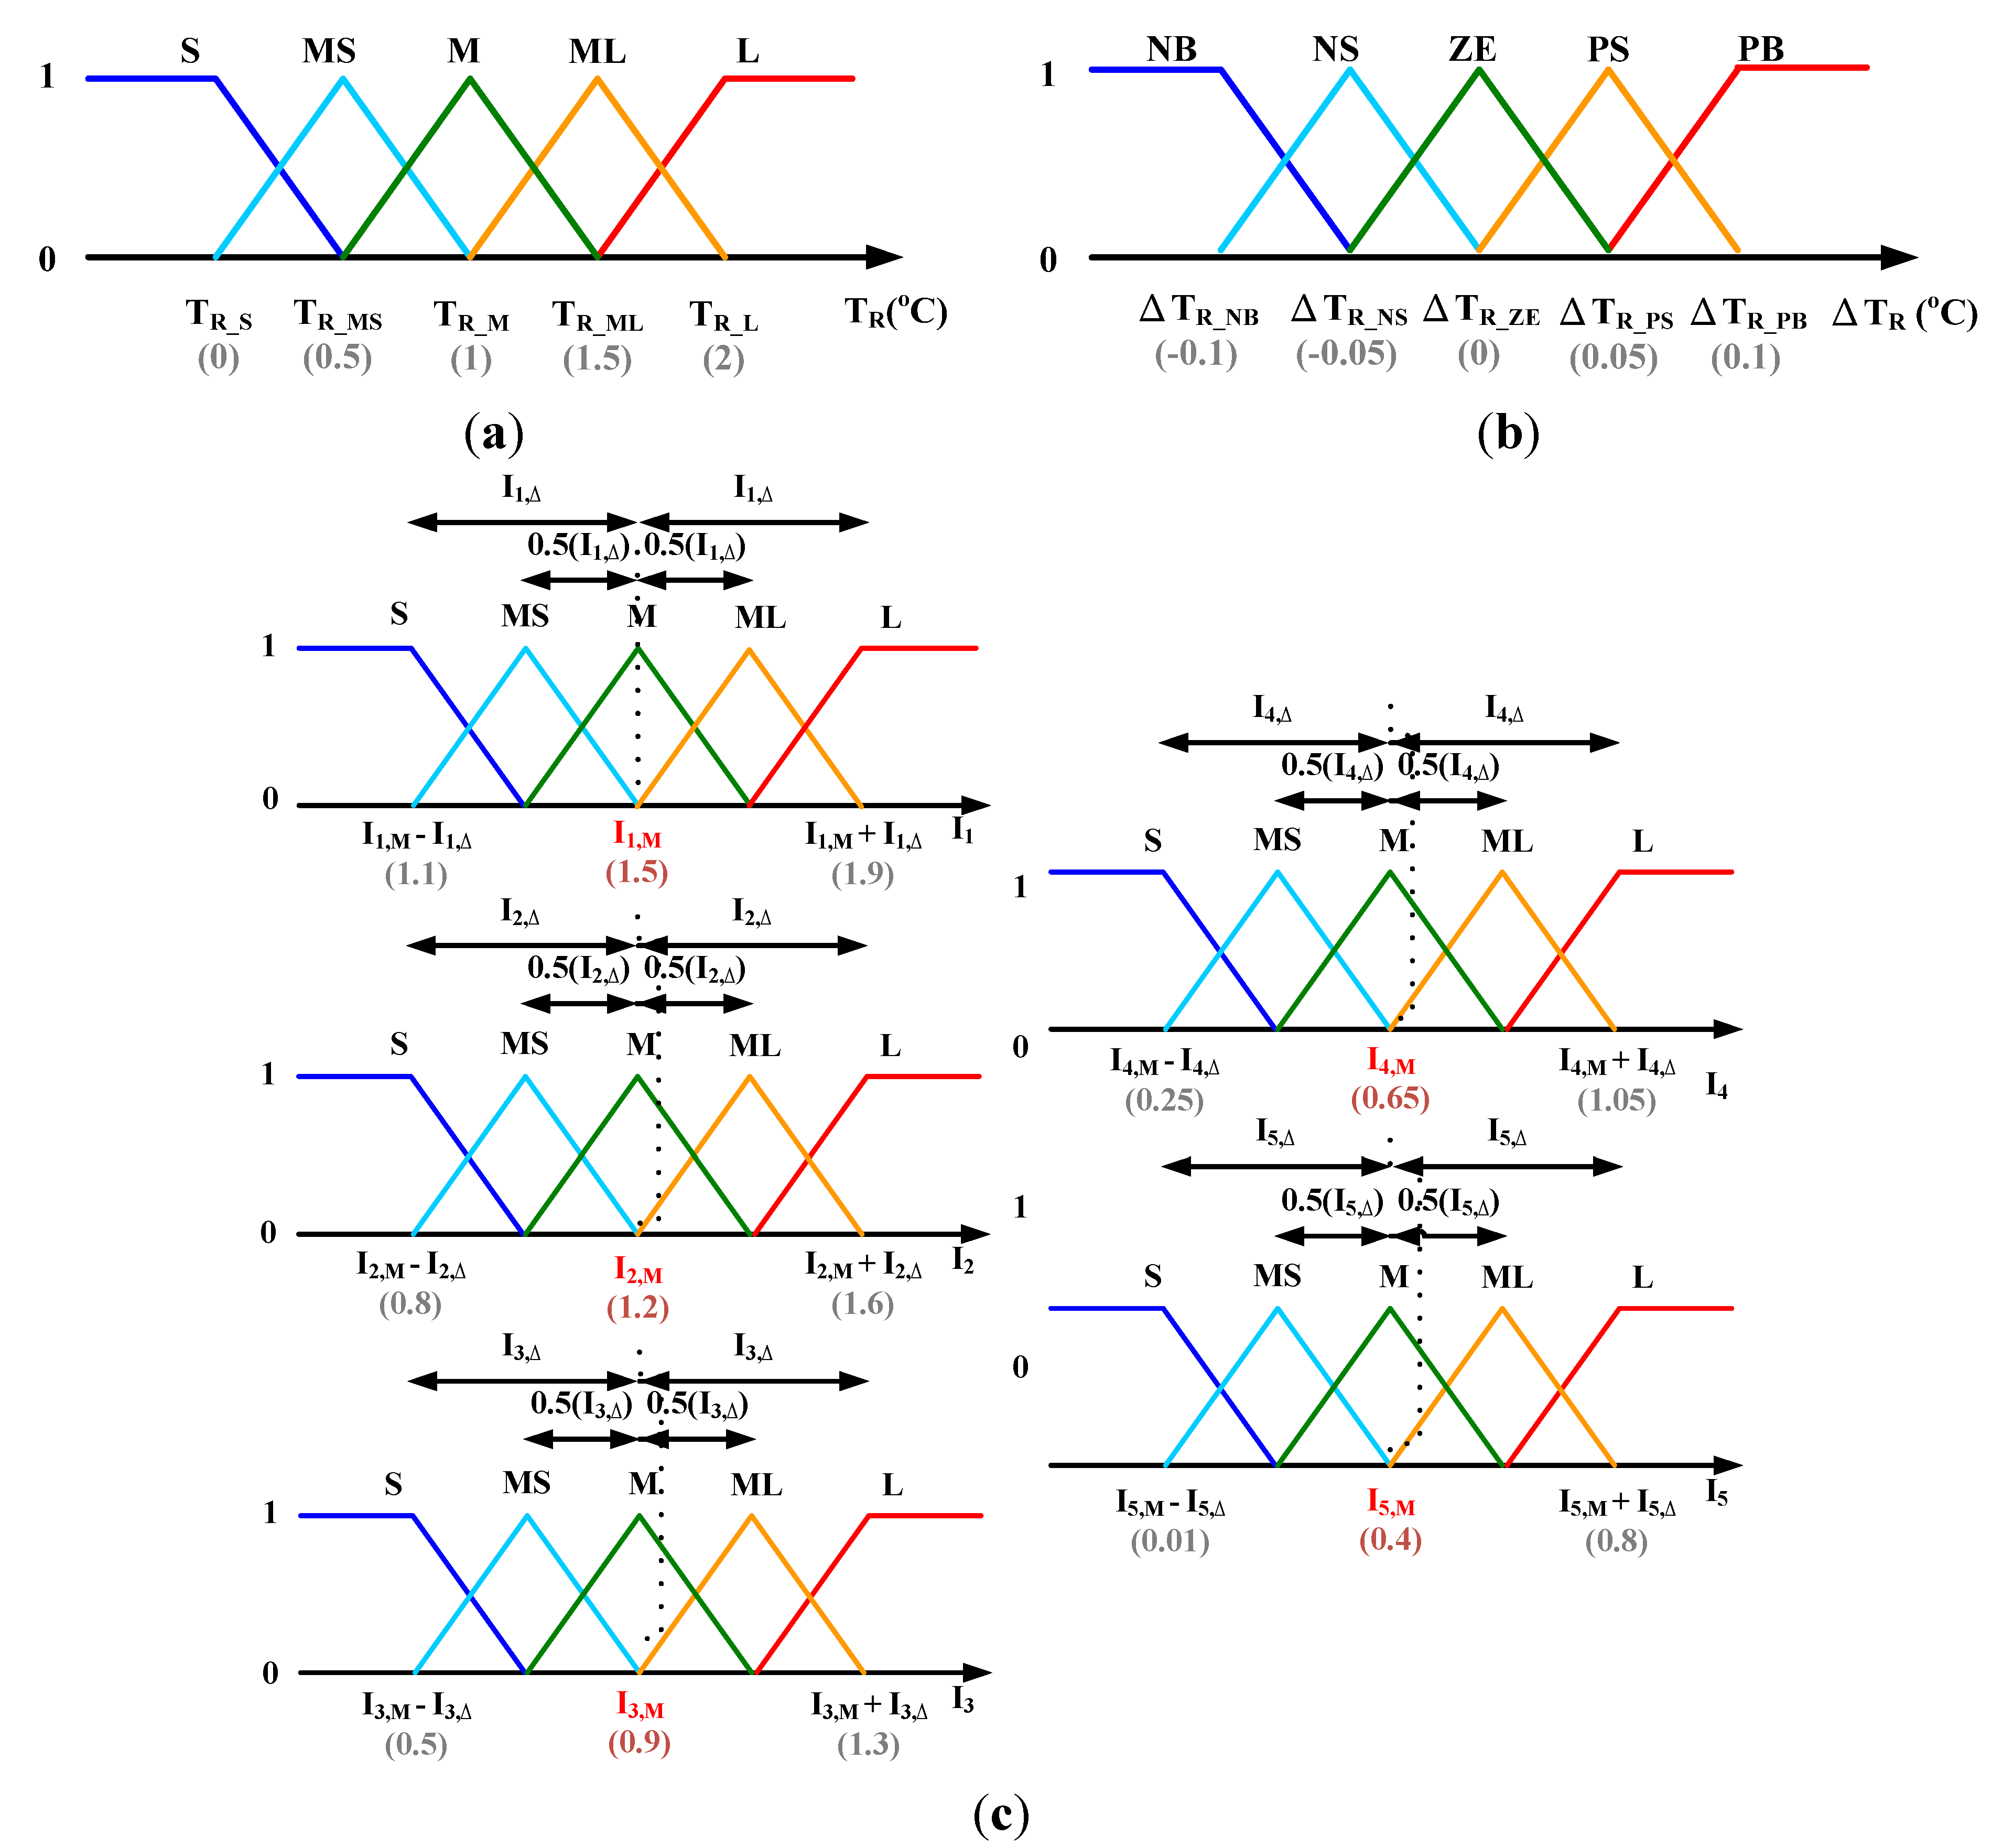
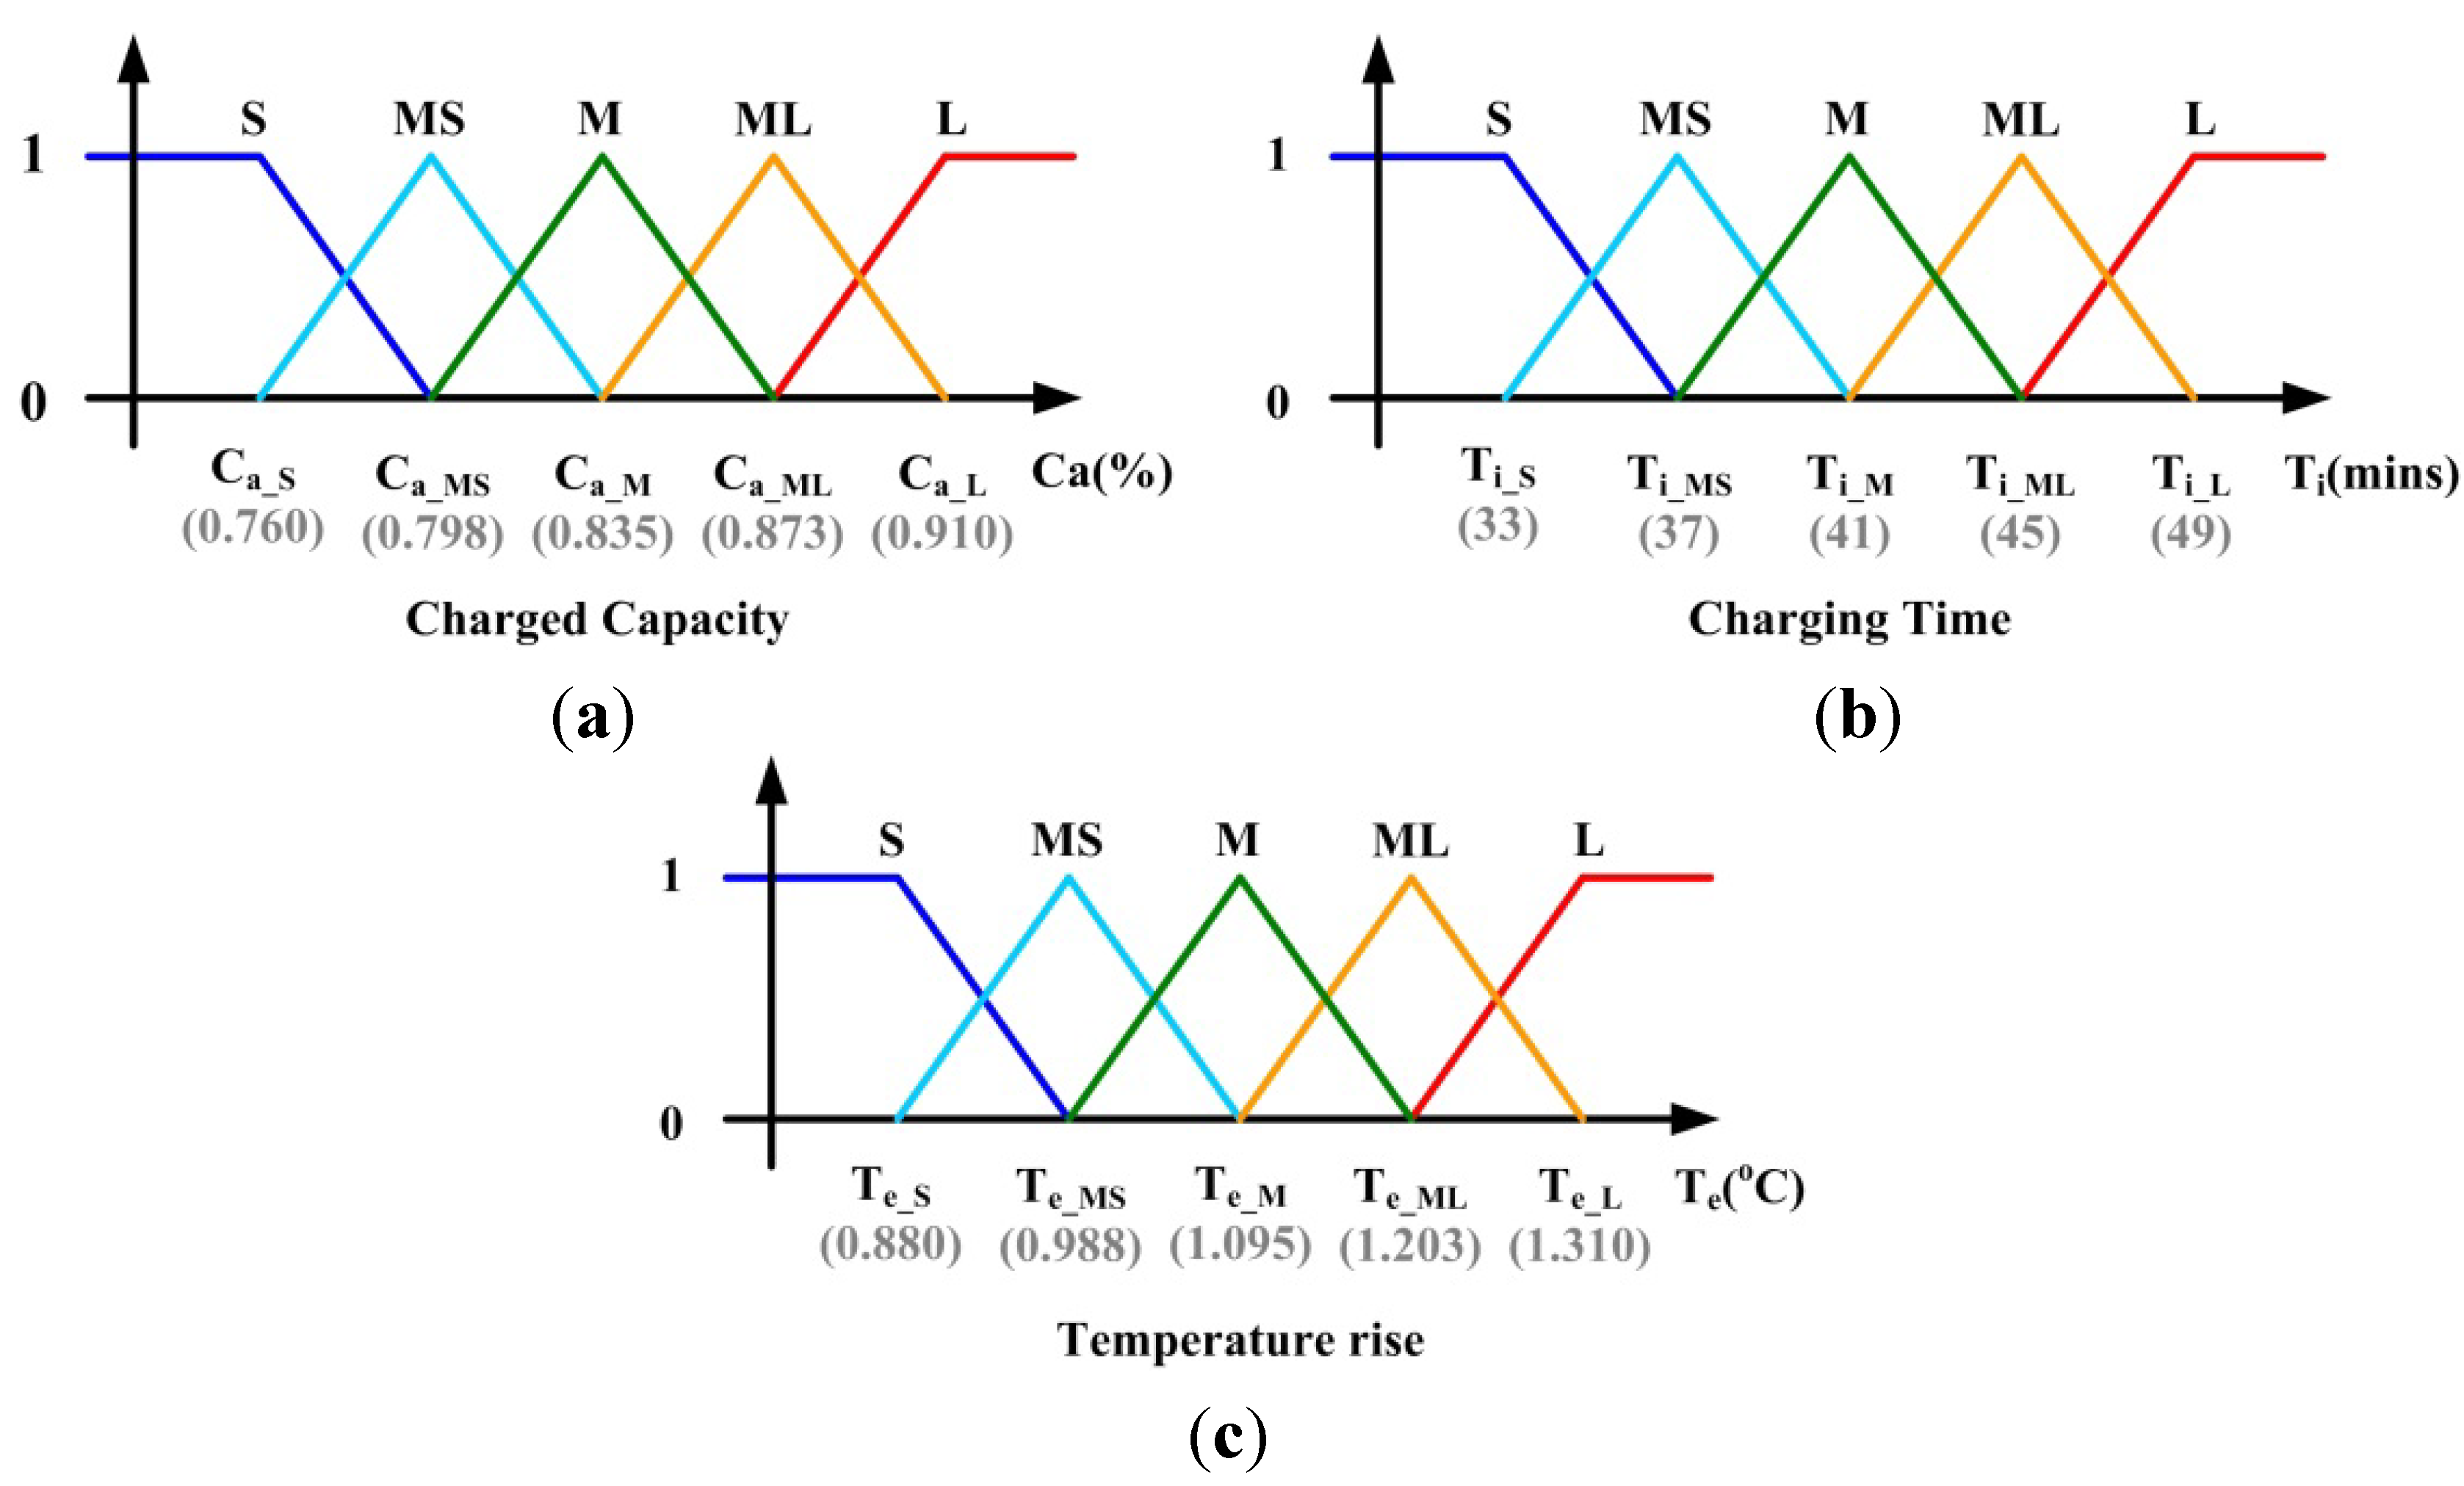
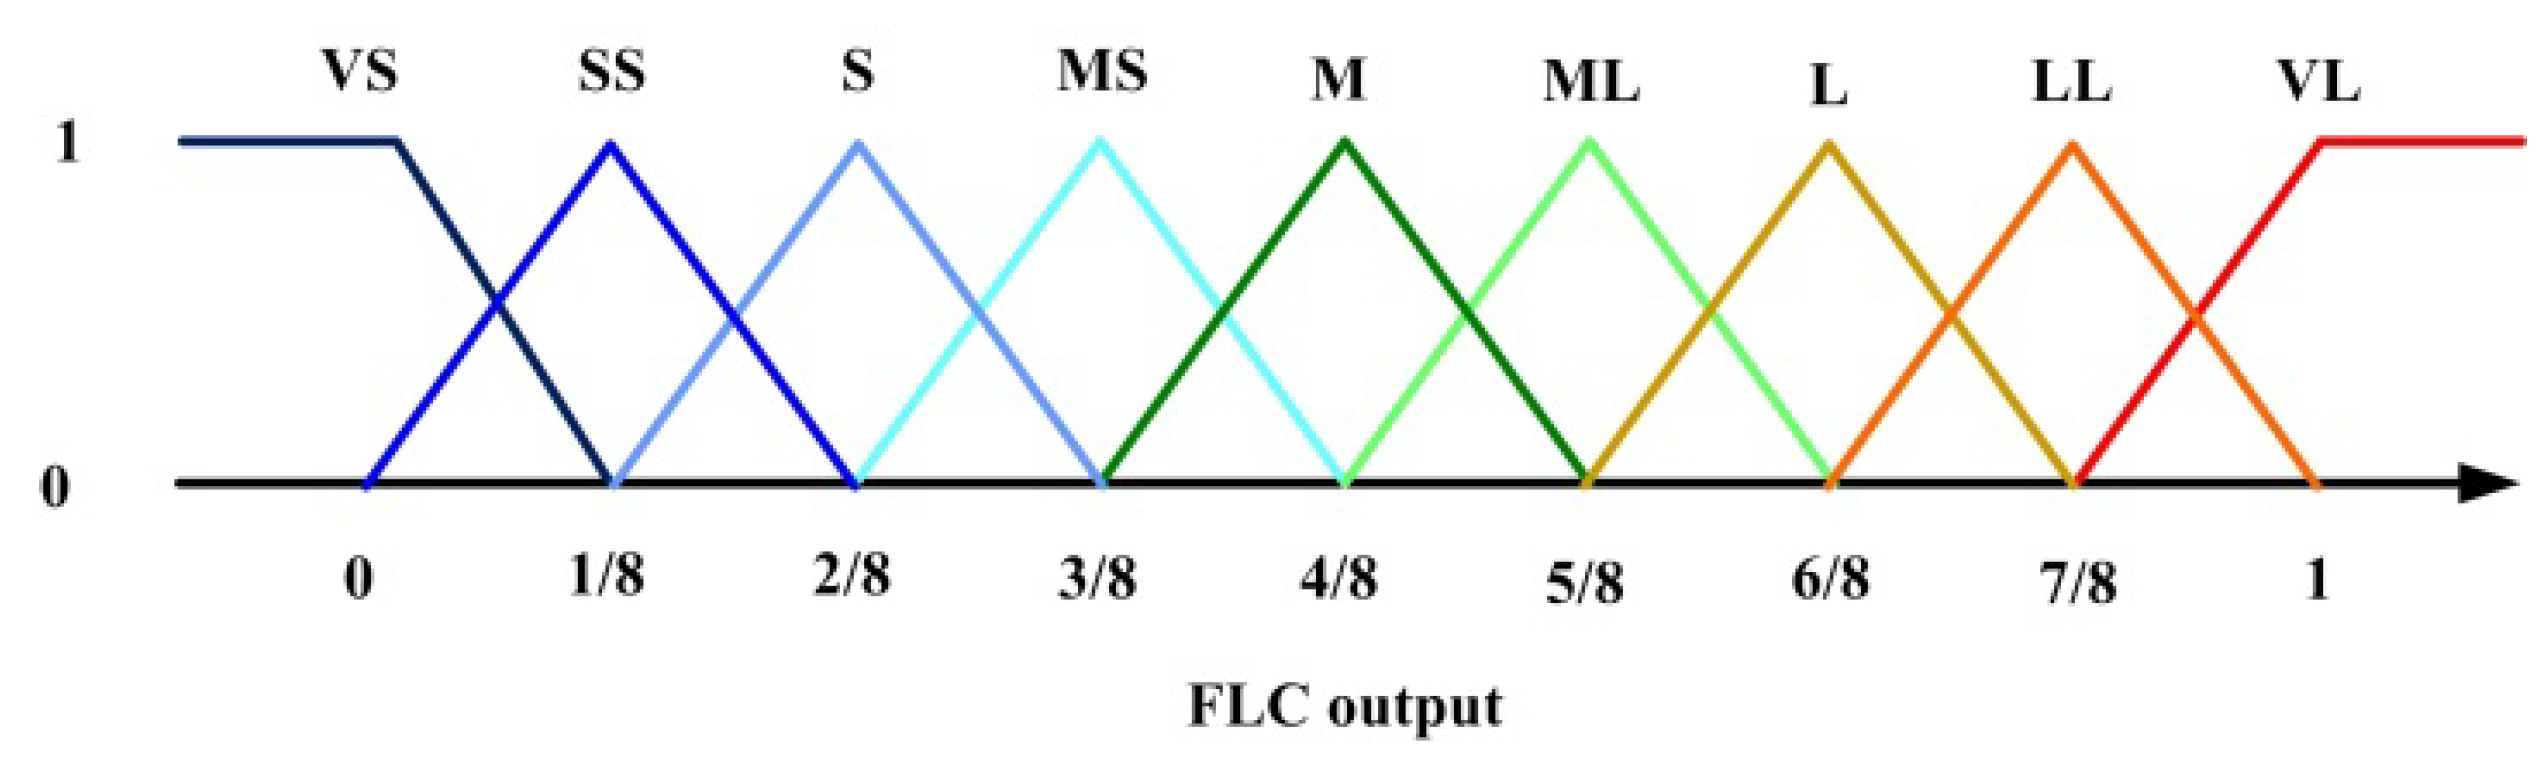
The MFs of the proposed FLC are shown in
Figure 3.
Figure 3a depicts the MF of the input variable
TR,
Figure 3b illustrates the MF of the input variable ∆
TR and
Figure 3c displays the MFs of the output current command, respectively. Since the proposed FLC will be realized using a low cost DSC, triangular-shaped MFs are chosen to represent both the input and output variables so that the computation complexity can be reduced. It should be noted that the five-stage charging algorithm is employed in this study. Therefore, there are five sets of output MFs. In
Figure 3, the linguistic variables S, MS, M, ML, L, NB, NS, ZE, PS and PB, represents small, medium small, medium, medium large, large, negative big, negative small, zero, positive small and positive big, respectively. It should also be noted that the center value (
i.e.,
IX,M,
x = 1–5) of the output MFs is set as the values equal to the optimal charging current values obtained in [
17].
From
Figure 3, each of the input variables
TR and ∆
TR is mapped into five different linguistic values. Therefore, the rule base of the proposed FLC will contain 25 different rules. The basic principle of designing the rules is to adjust the charging current according to the temperature variation. The charging current will decrease when
TR or ∆
TR increases, and
vice versa. Based on this concept, the complete set of fuzzy control rules for the proposed system is tabulated in
Table 1. The defuzzification method used in this study is the commonly used center of gravity (COG) method and is shown in Equation (3):
where
Wi is the inference result of rule
I;
Bi is the corresponding output of rule
i; and
y is the output.
Figure 3.
The MF definition of the proposed FLC (a) MF of the input variable TR; (b) MF of the input variable ΔTR; (c) MFs of the output variable Io.
Figure 3.
The MF definition of the proposed FLC (a) MF of the input variable TR; (b) MF of the input variable ΔTR; (c) MFs of the output variable Io.
Table 1.
Complete rule base for the proposed FLC.
Table 1.
Complete rule base for the proposed FLC.
| TR | ΔTR |
|---|
| NB | NS | ZE | PS | PB |
|---|
| S | L | L | ML | ML | ML |
| Rule1 | Rule2 | Rule3 | Rule4 | Rule5 |
| MS | L | ML | ML | M | M |
| Rule6 | Rule7 | Rule8 | Rule9 | Rule10 |
| M | ML | ML | M | MS | MS |
| Rule11 | Rule12 | Rule13 | Rule14 | Rule15 |
| ML | M | M | MS | MS | S |
| Rule16 | Rule17 | Rule18 | Rule19 | Rule20 |
| L | MS | MS | MS | S | S |
| Rule21 | Rule22 | Rule23 | Rule24 | Rule25 |
5. Experimental Results
From
Section 4, the designed fuzzy-based Taguchi method utilizes a L
18 OA to obtain the optimal setting values of
Ix,Δ After performing the experiments, the measured results are summarized in
Table 9. Based on the data shown in
Table 9, the average
S/
N ratio responses of each parameter can be calculated at each level.
Table 9.
Measured results for the L18 OA.
Table 9.
Measured results for the L18 OA.
| No. | Fuzzy Results1 | Fuzzy Results2 | Fuzzy Results3 | y(Avg.) | S | S/N |
|---|
| 1 | 0.274 | 0.429 | 0.478 | 0.3937 | 0.1065 | 11.356 |
| 2 | 0.407 | 0.485 | 0.484 | 0.4587 | 0.0447 | 20.215 |
| 3 | 0.437 | 0.548 | 0.552 | 0.5123 | 0.0653 | 17.897 |
| 4 | 0.420 | 0.539 | 0.421 | 0.4600 | 0.0684 | 16.552 |
| 5 | 0.402 | 0.553 | 0.554 | 0.5030 | 0.0875 | 15.194 |
| 6 | 0.363 | 0.439 | 0.534 | 0.4453 | 0.0857 | 14.317 |
| 7 | 0.456 | 0.517 | 0.556 | 0.5097 | 0.0504 | 20.097 |
| 8 | 0.436 | 0.467 | 0.552 | 0.4850 | 0.0601 | 18.143 |
| 9 | 0.457 | 0.573 | 0.588 | 0.5393 | 0.0717 | 17.527 |
| 10 | 0.478 | 0.538 | 0.594 | 0.5367 | 0.0580 | 19.324 |
| 11 | 0.493 | 0.548 | 0.647 | 0.5627 | 0.0780 | 17.159 |
| 12 | 0.402 | 0.436 | 0.592 | 0.4767 | 0.1013 | 13.451 |
| 13 | 0.396 | 0.457 | 0.601 | 0.4847 | 0.1053 | 13.263 |
| 14 | 0.445 | 0.434 | 0.574 | 0.4843 | 0.0778 | 15.878 |
| 15 | 0.444 | 0.626 | 0.612 | 0.5607 | 0.1013 | 14.864 |
| 16 | 0.479 | 0.496 | 0.649 | 0.5413 | 0.0936 | 15.241 |
| 17 | 0.360 | 0.429 | 0.589 | 0.4593 | 0.1175 | 11.844 |
| 18 | 0.408 | 0.451 | 0.594 | 0.4843 | 0.0974 | 13.934 |
| C.E | 0.556 | 0.632 | 0.672 | 0.6200 | 0.0589 | 20.442 |
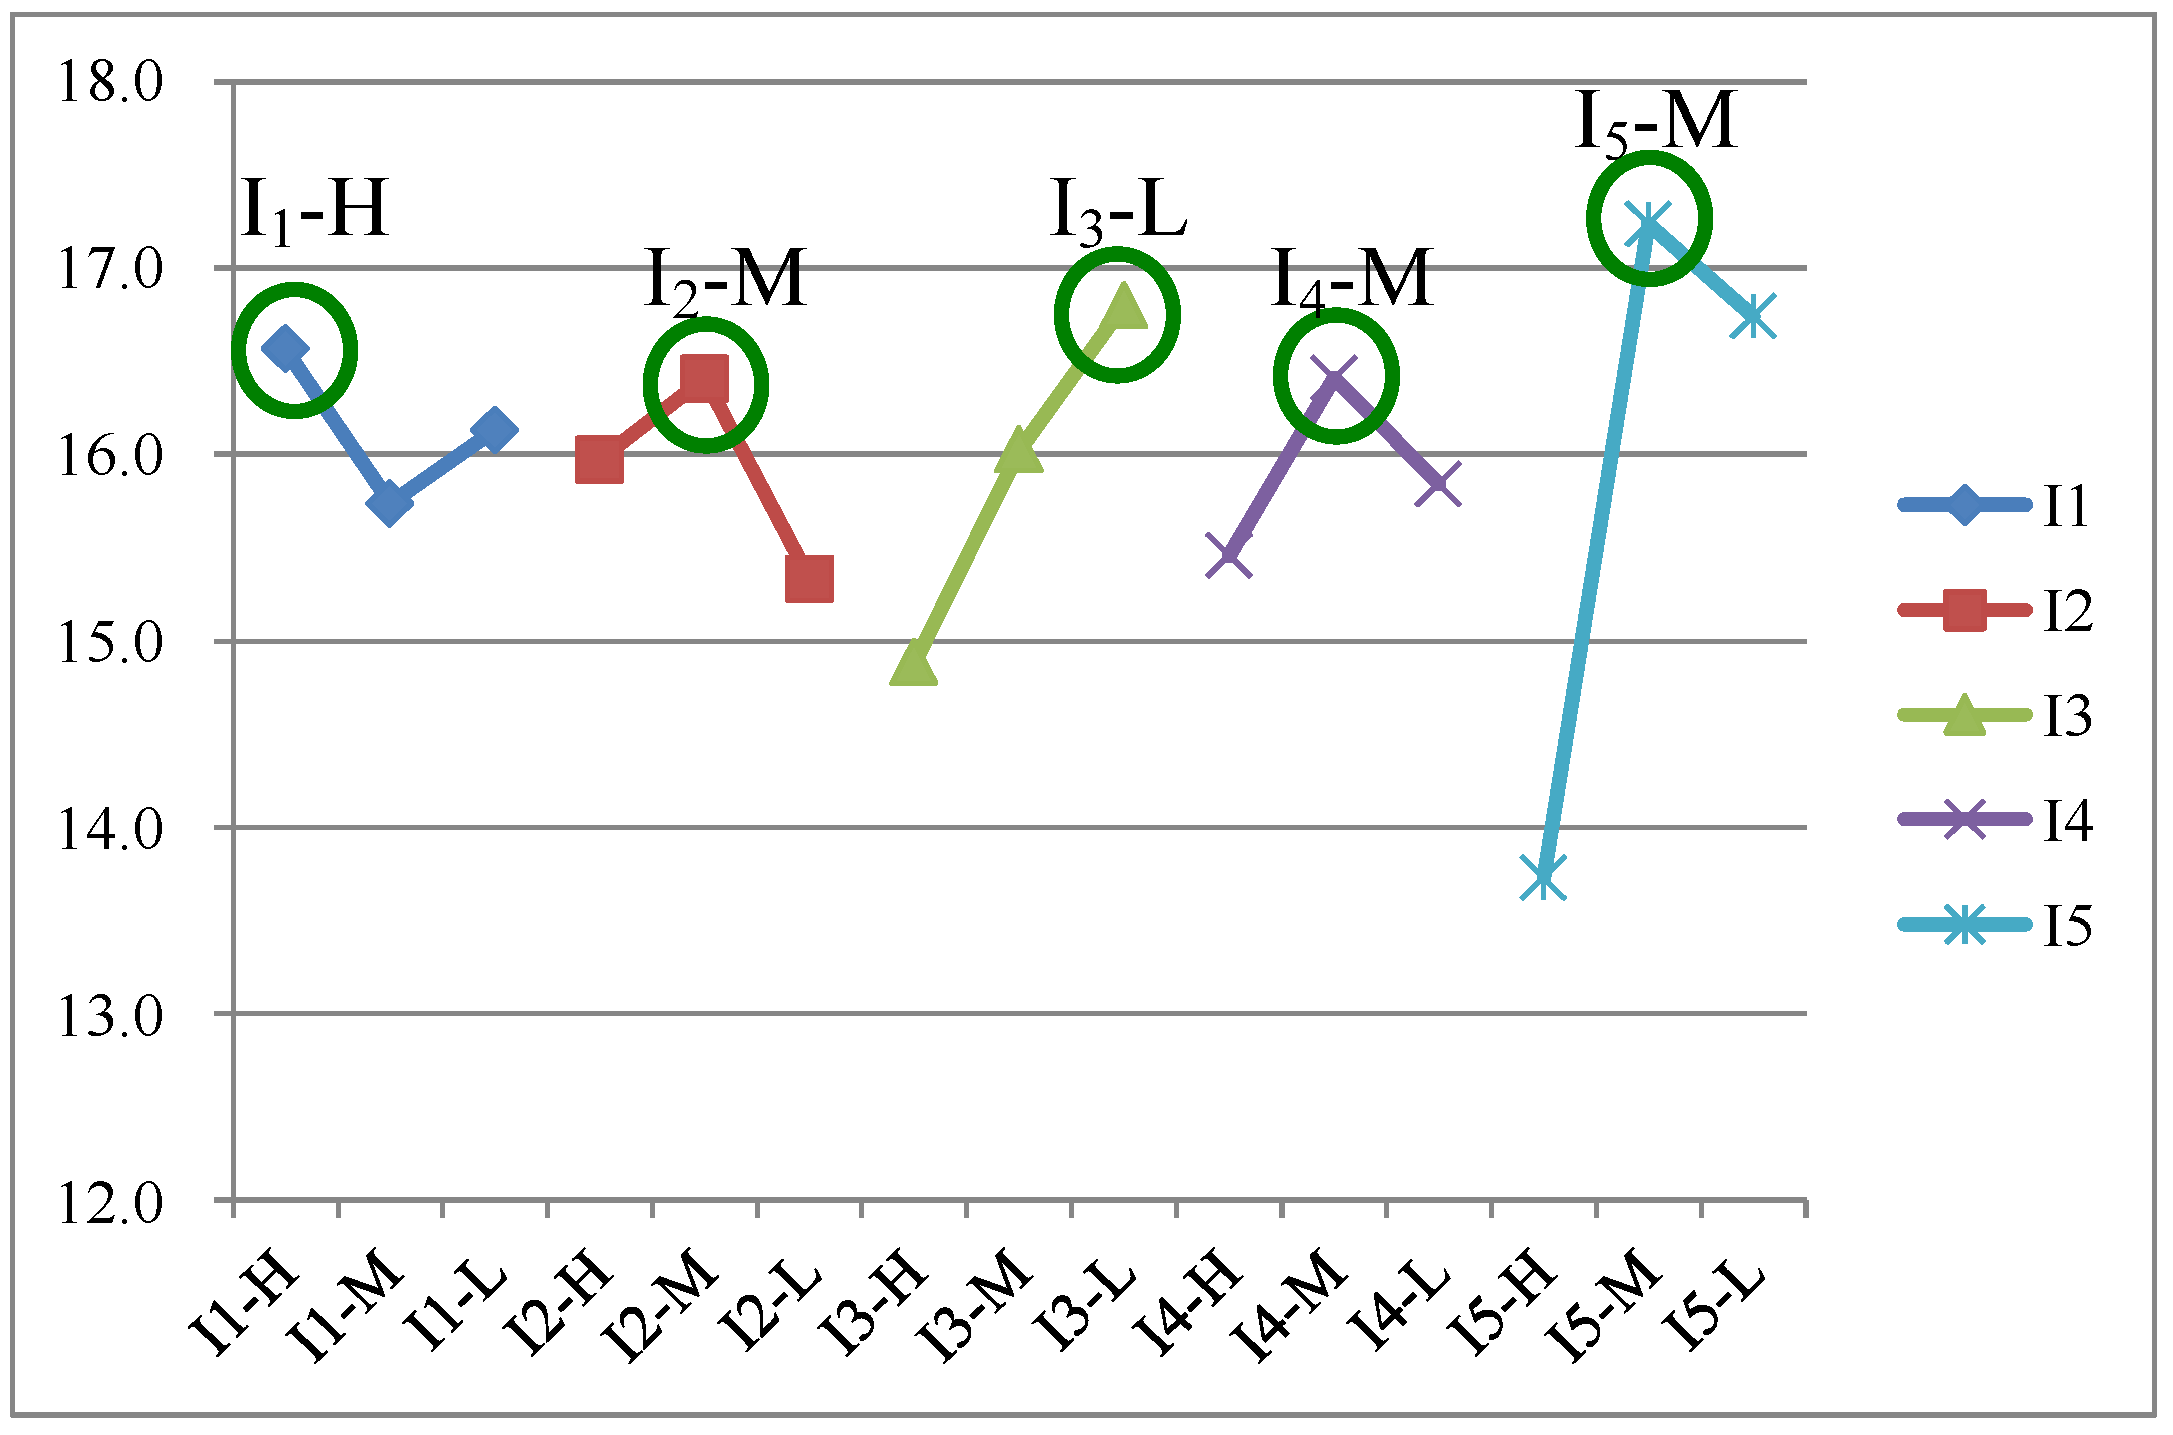
Table 10 shows the response table and
Figure 8 shows the response graph for the
S/
N ratio. Since larger
S/
N ratio corresponds to better performance characteristic, it can be seen that the factor-level combination [
I1,Δ(1),
I2,Δ(2),
I3,Δ(3),
I4,Δ(2),
I5,Δ(2)] contributes to maximize the performance index. Since this combination does not exist in the original L
18 OA, confirmation test should be conducted to verify the correctness of this optimization procedure. The results of the confirmation test using the optimal parameters are shown in the last line of
Table 9.
Table 10.
Response table for the S/N ratio.
Table 10.
Response table for the S/N ratio.
| S/N | X | I1 | I2 | I3 | I4 | I5 | X | X |
|---|
| Level1 | - | 16.57 | 15.97 | 14.88 | 15.46 | 13.73 | - | - |
| Level2 | - | 15.74 | 16.41 | 16.03 | 16.41 | 17.24 | - | - |
| Level3 | - | 16.13 | 15.33 | 16.80 | 15.84 | 16.74 | - | - |
| E1–2 | - | (0.83) | 0.43 | 1.14 | 0.95 | 3.51 | - | - |
| E2–3 | - | 0.39 | (1.07) | 0.77 | (0.57) | (0.50) | - | - |
| Range | - | 0.83 | 1.07 | 1.92 | 0.95 | 3.51 | - | - |
| Rank | - | 5 | 3 | 2 | 4 | 1 | - | - |
Figure 8.
Response graph for the S/N ratio.
Figure 8.
Response graph for the S/N ratio.
In order to verify the performance of the obtained optimal parameter setting, several experiments are also carried out.
Figure 9 shows the measured temperature rise of the CC-CV method and the utilized five-stage CC charging algorithm.
Figure 9.
Temperature rise of the five-stage CC charging algorithm and the conventional CC-CV algorithm.
Figure 9.
Temperature rise of the five-stage CC charging algorithm and the conventional CC-CV algorithm.
From
Figure 9, the temperature rise of the utilized five-stage CC charging algorithm is lower than that of the conventional CC-CV method. Therefore, the charging efficiency of the five-stage CC charging algorithm is higher. Similarly,
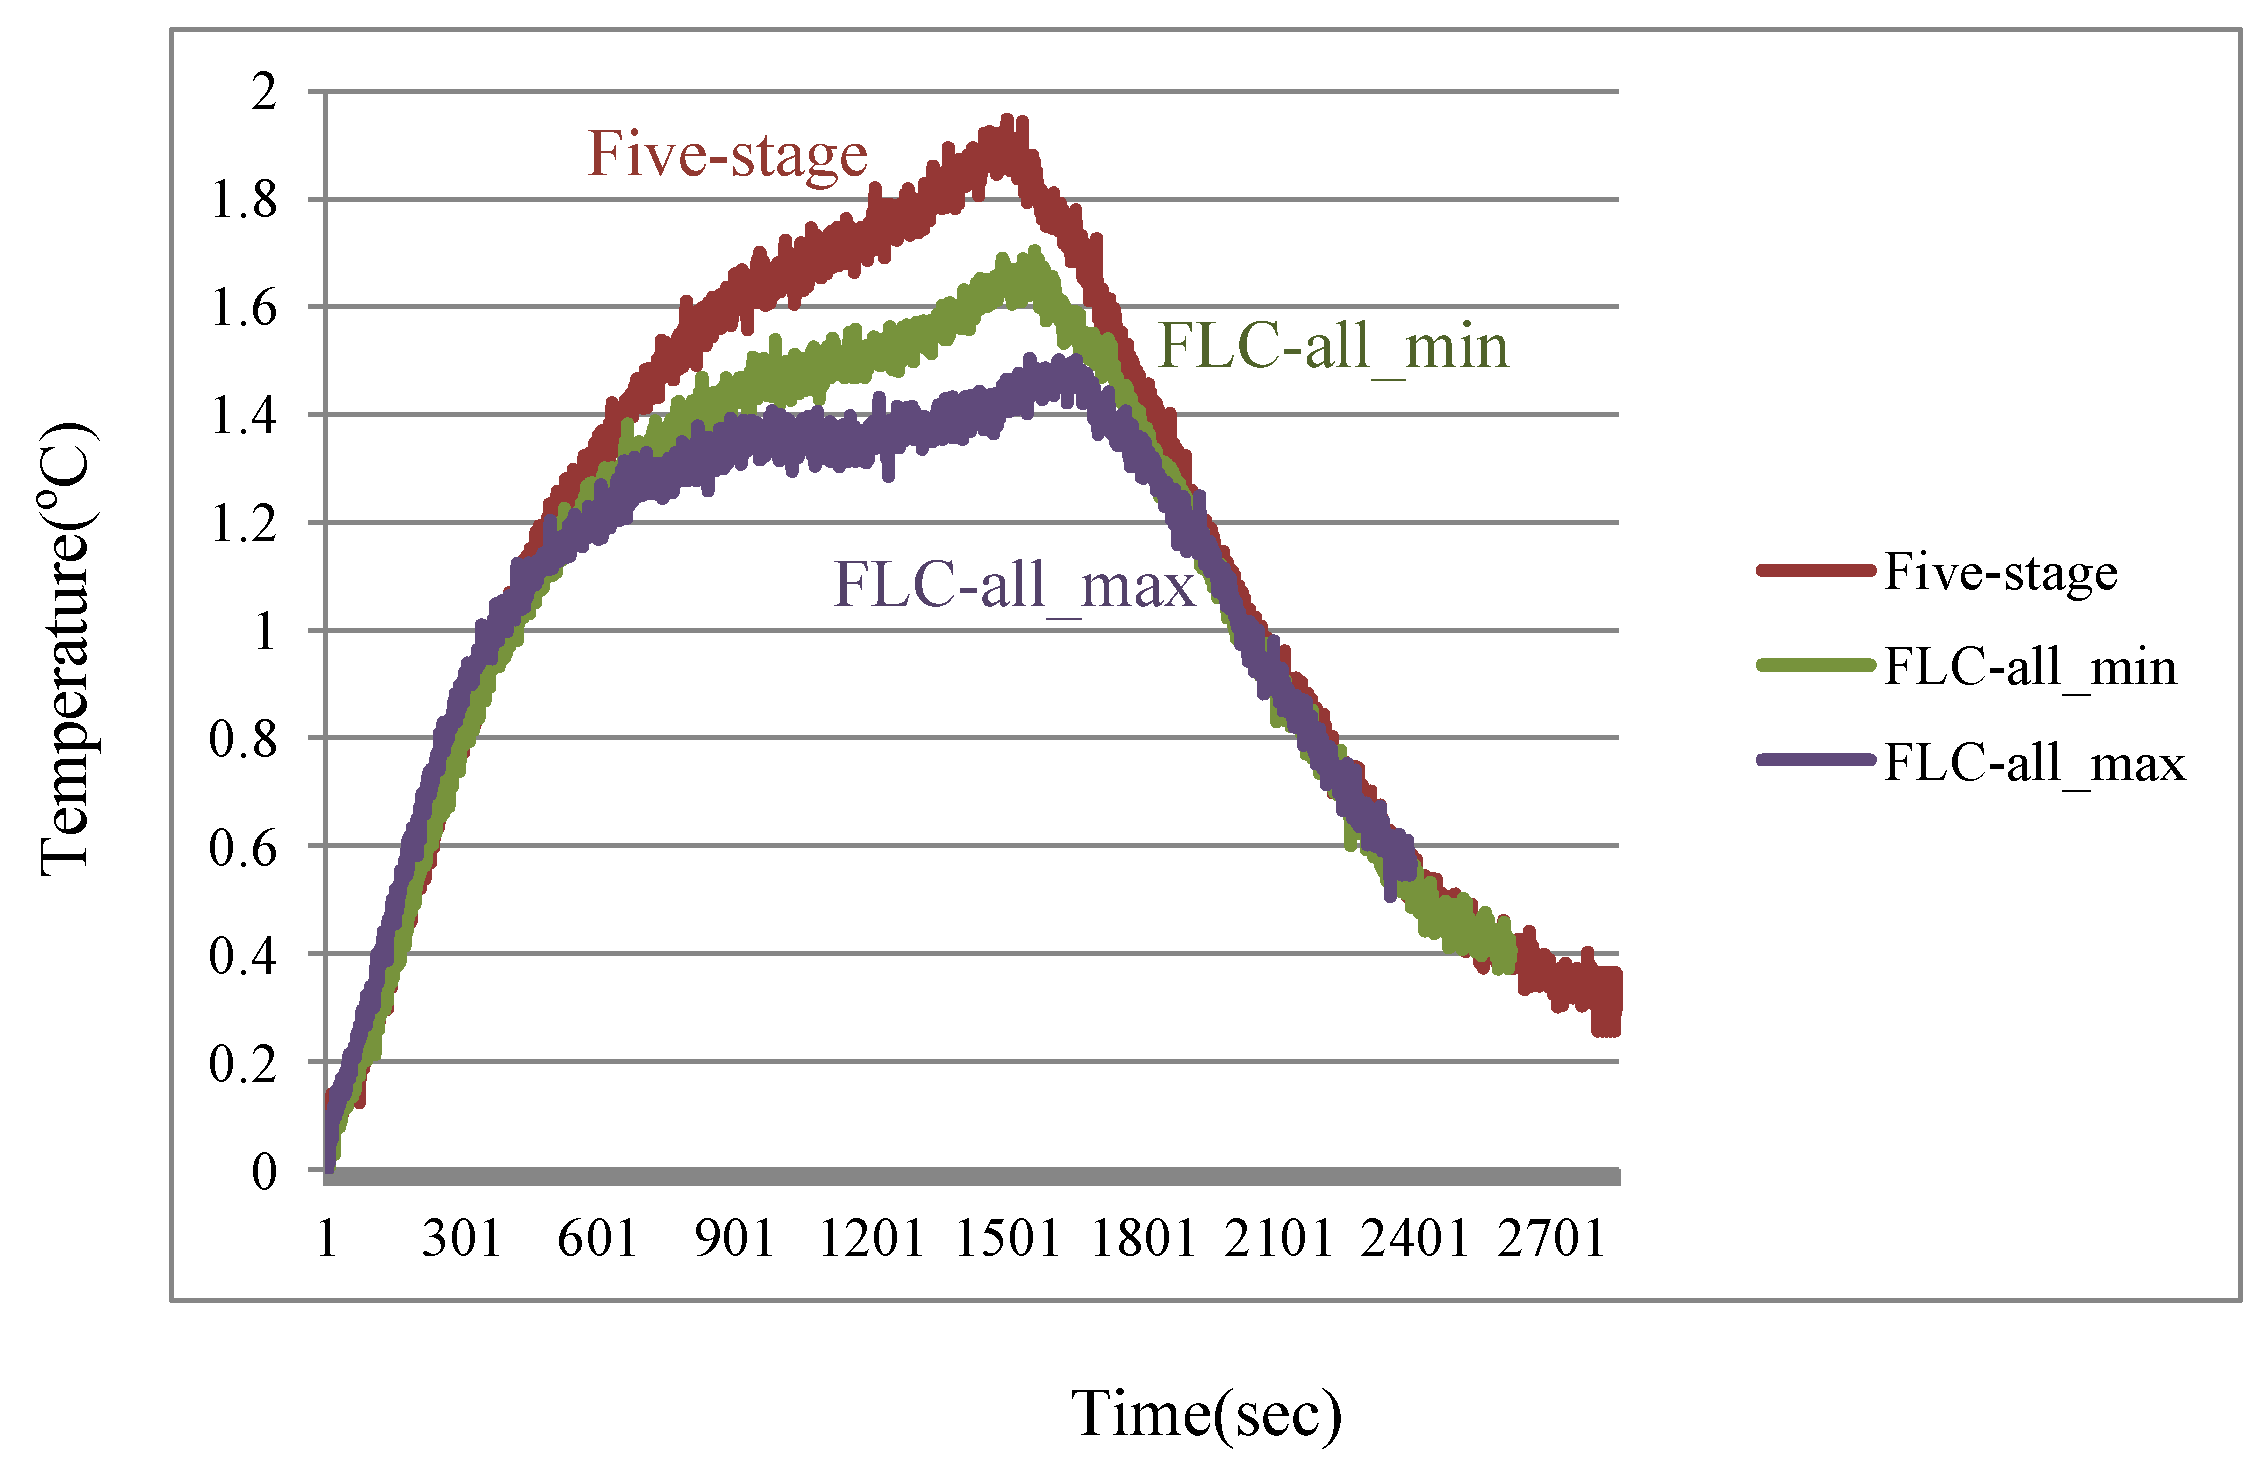
Figure 10 shows the measured temperature rise of the utilized five-stage CC charging algorithm and two FLC-based charging algorithms with different output MF settings.
Figure 10.
Temperature rise of the five-stage CC charging algorithm and the proposed FLC-based charging algorithm.
Figure 10.
Temperature rise of the five-stage CC charging algorithm and the proposed FLC-based charging algorithm.
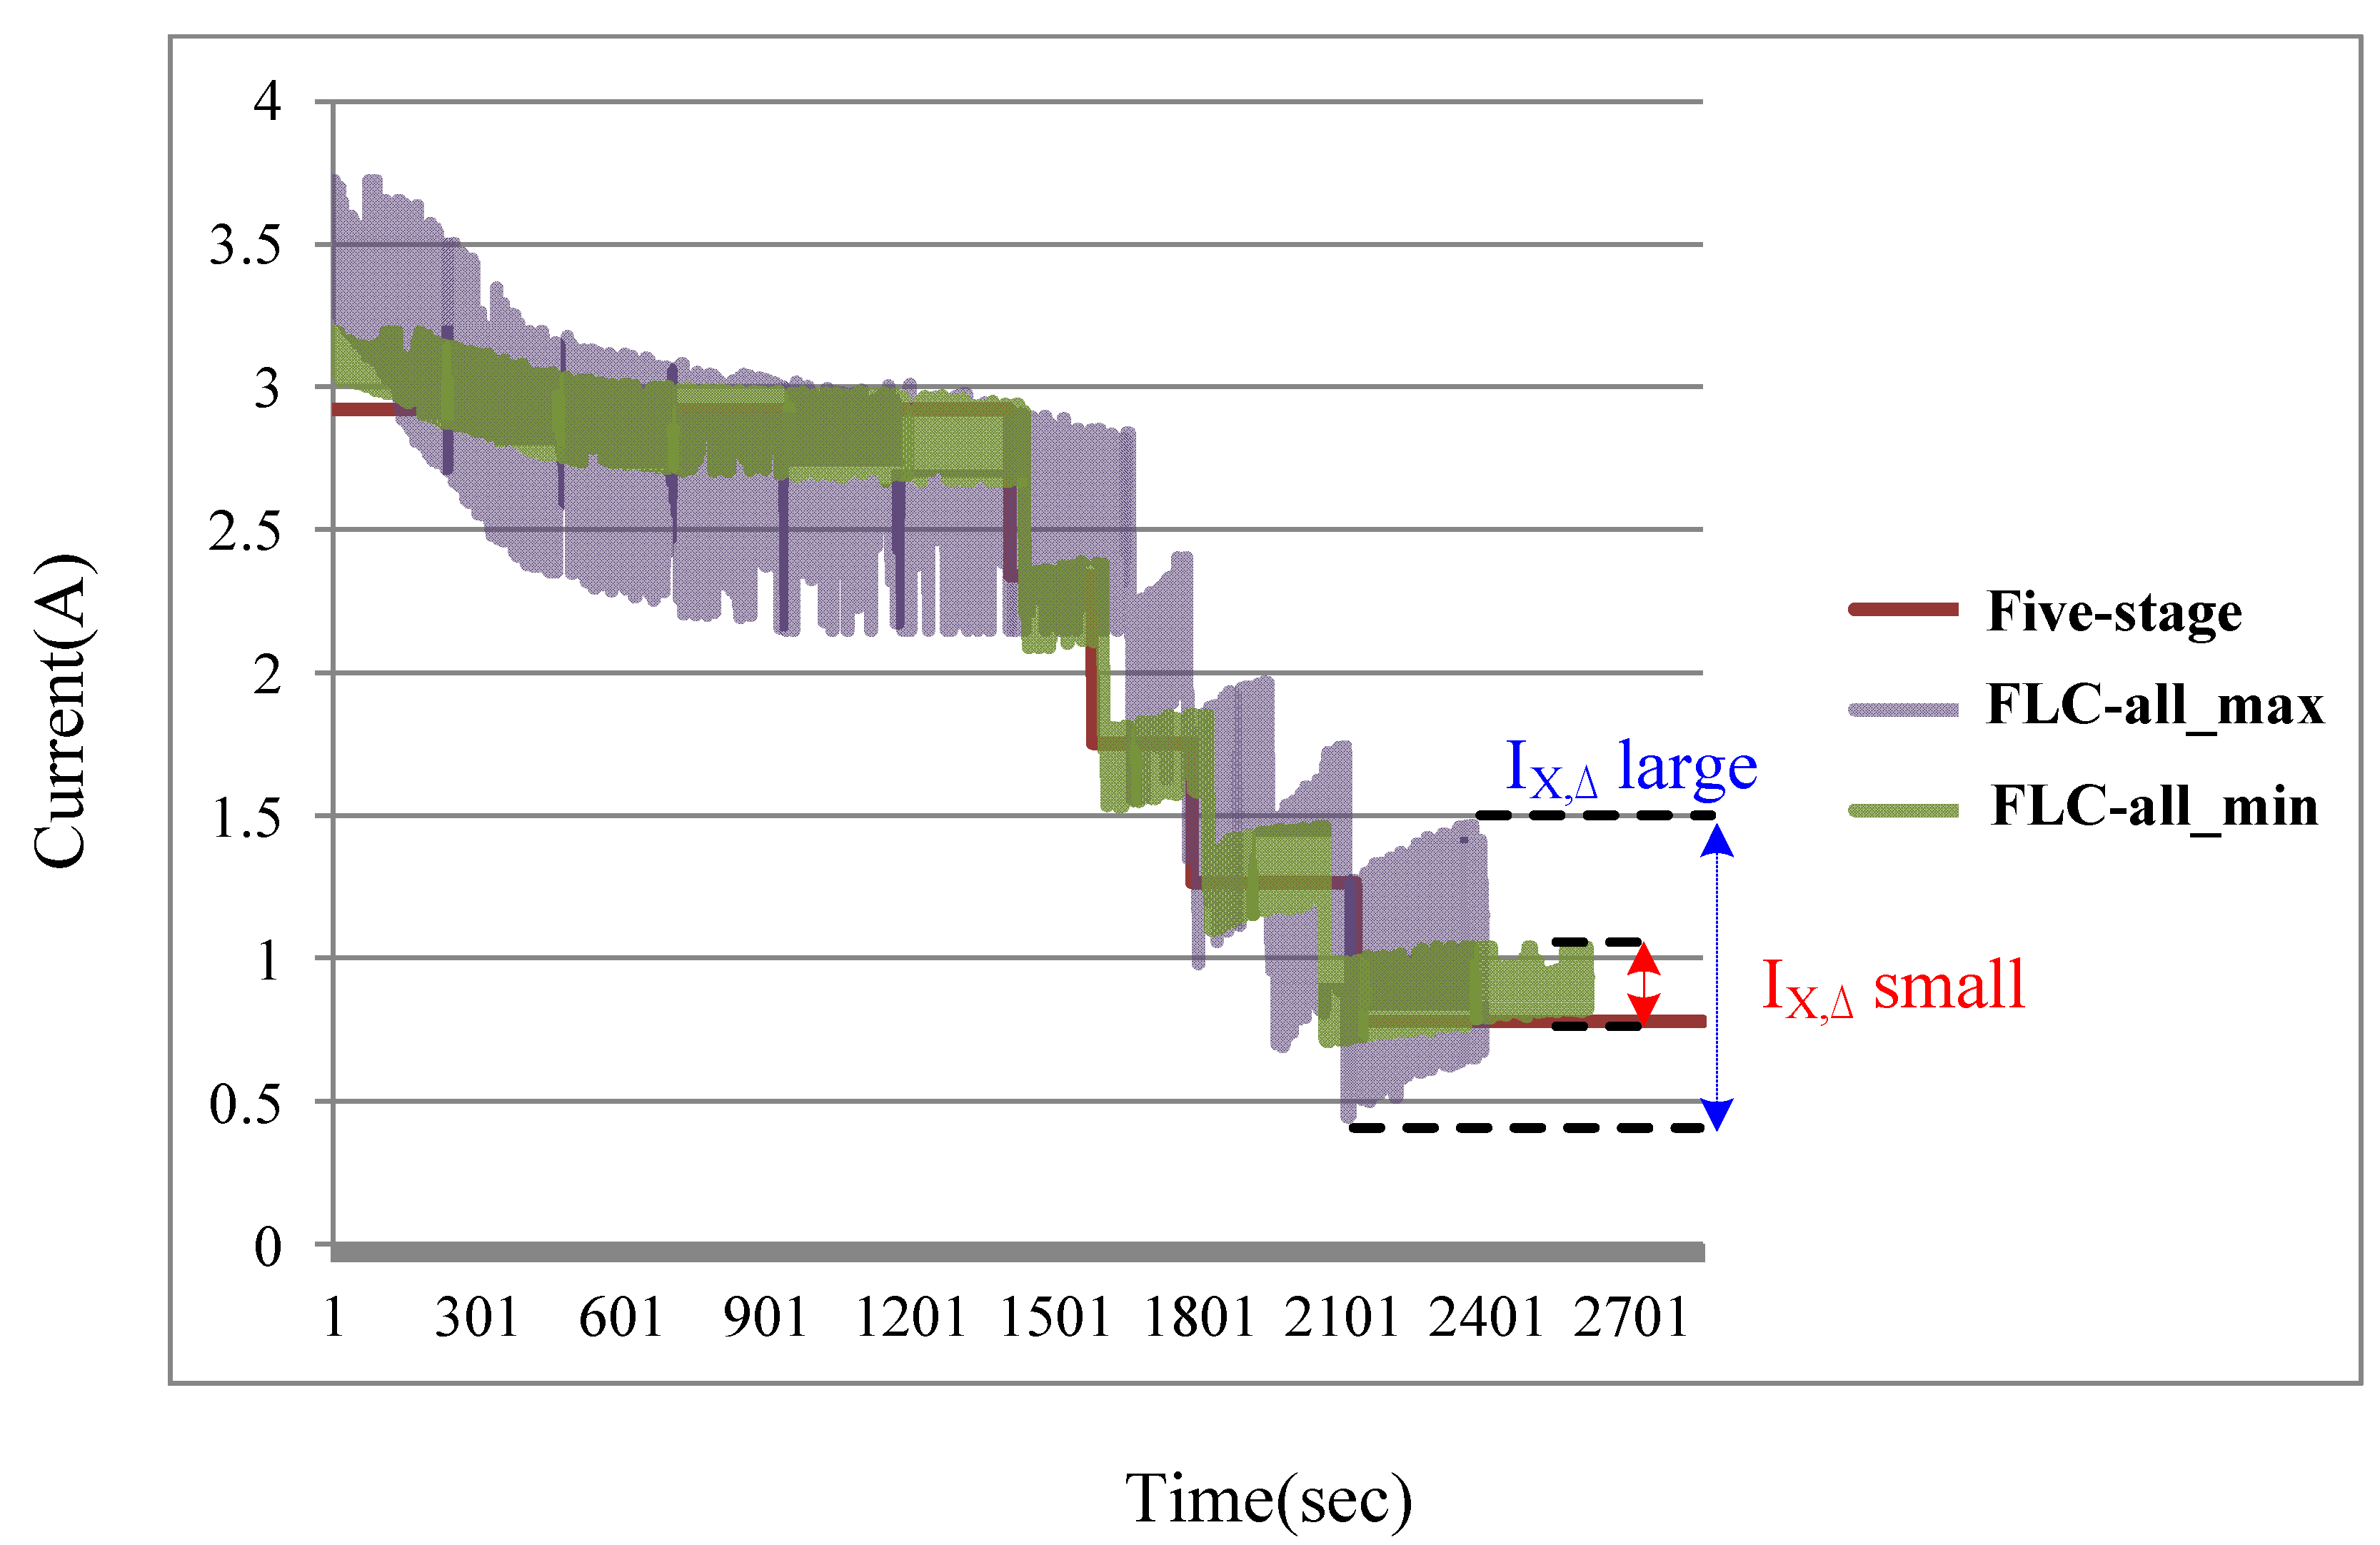
In
Figure 10, the curve denoted as “FLC-all_min” is the FLC-based battery charger with all the
Ix,Δ parameters set as low level [
I1,Δ(3),
I2,Δ(3),
I3,Δ(3),
I4,Δ(3),
I5,Δ(3)], and the curve denoted as “FLC-all_max” is the charger with all the
Ix,Δ parameters set as high level [
I1,Δ(1),
I2,Δ(1),
I3,Δ(1),
I4,Δ(1),
I5,Δ(1)]. From
Figure 10, the proposed FLC-based battery charger has higher charging efficiency than the five-stage CC charging algorithm regardless of the parameters setting value.
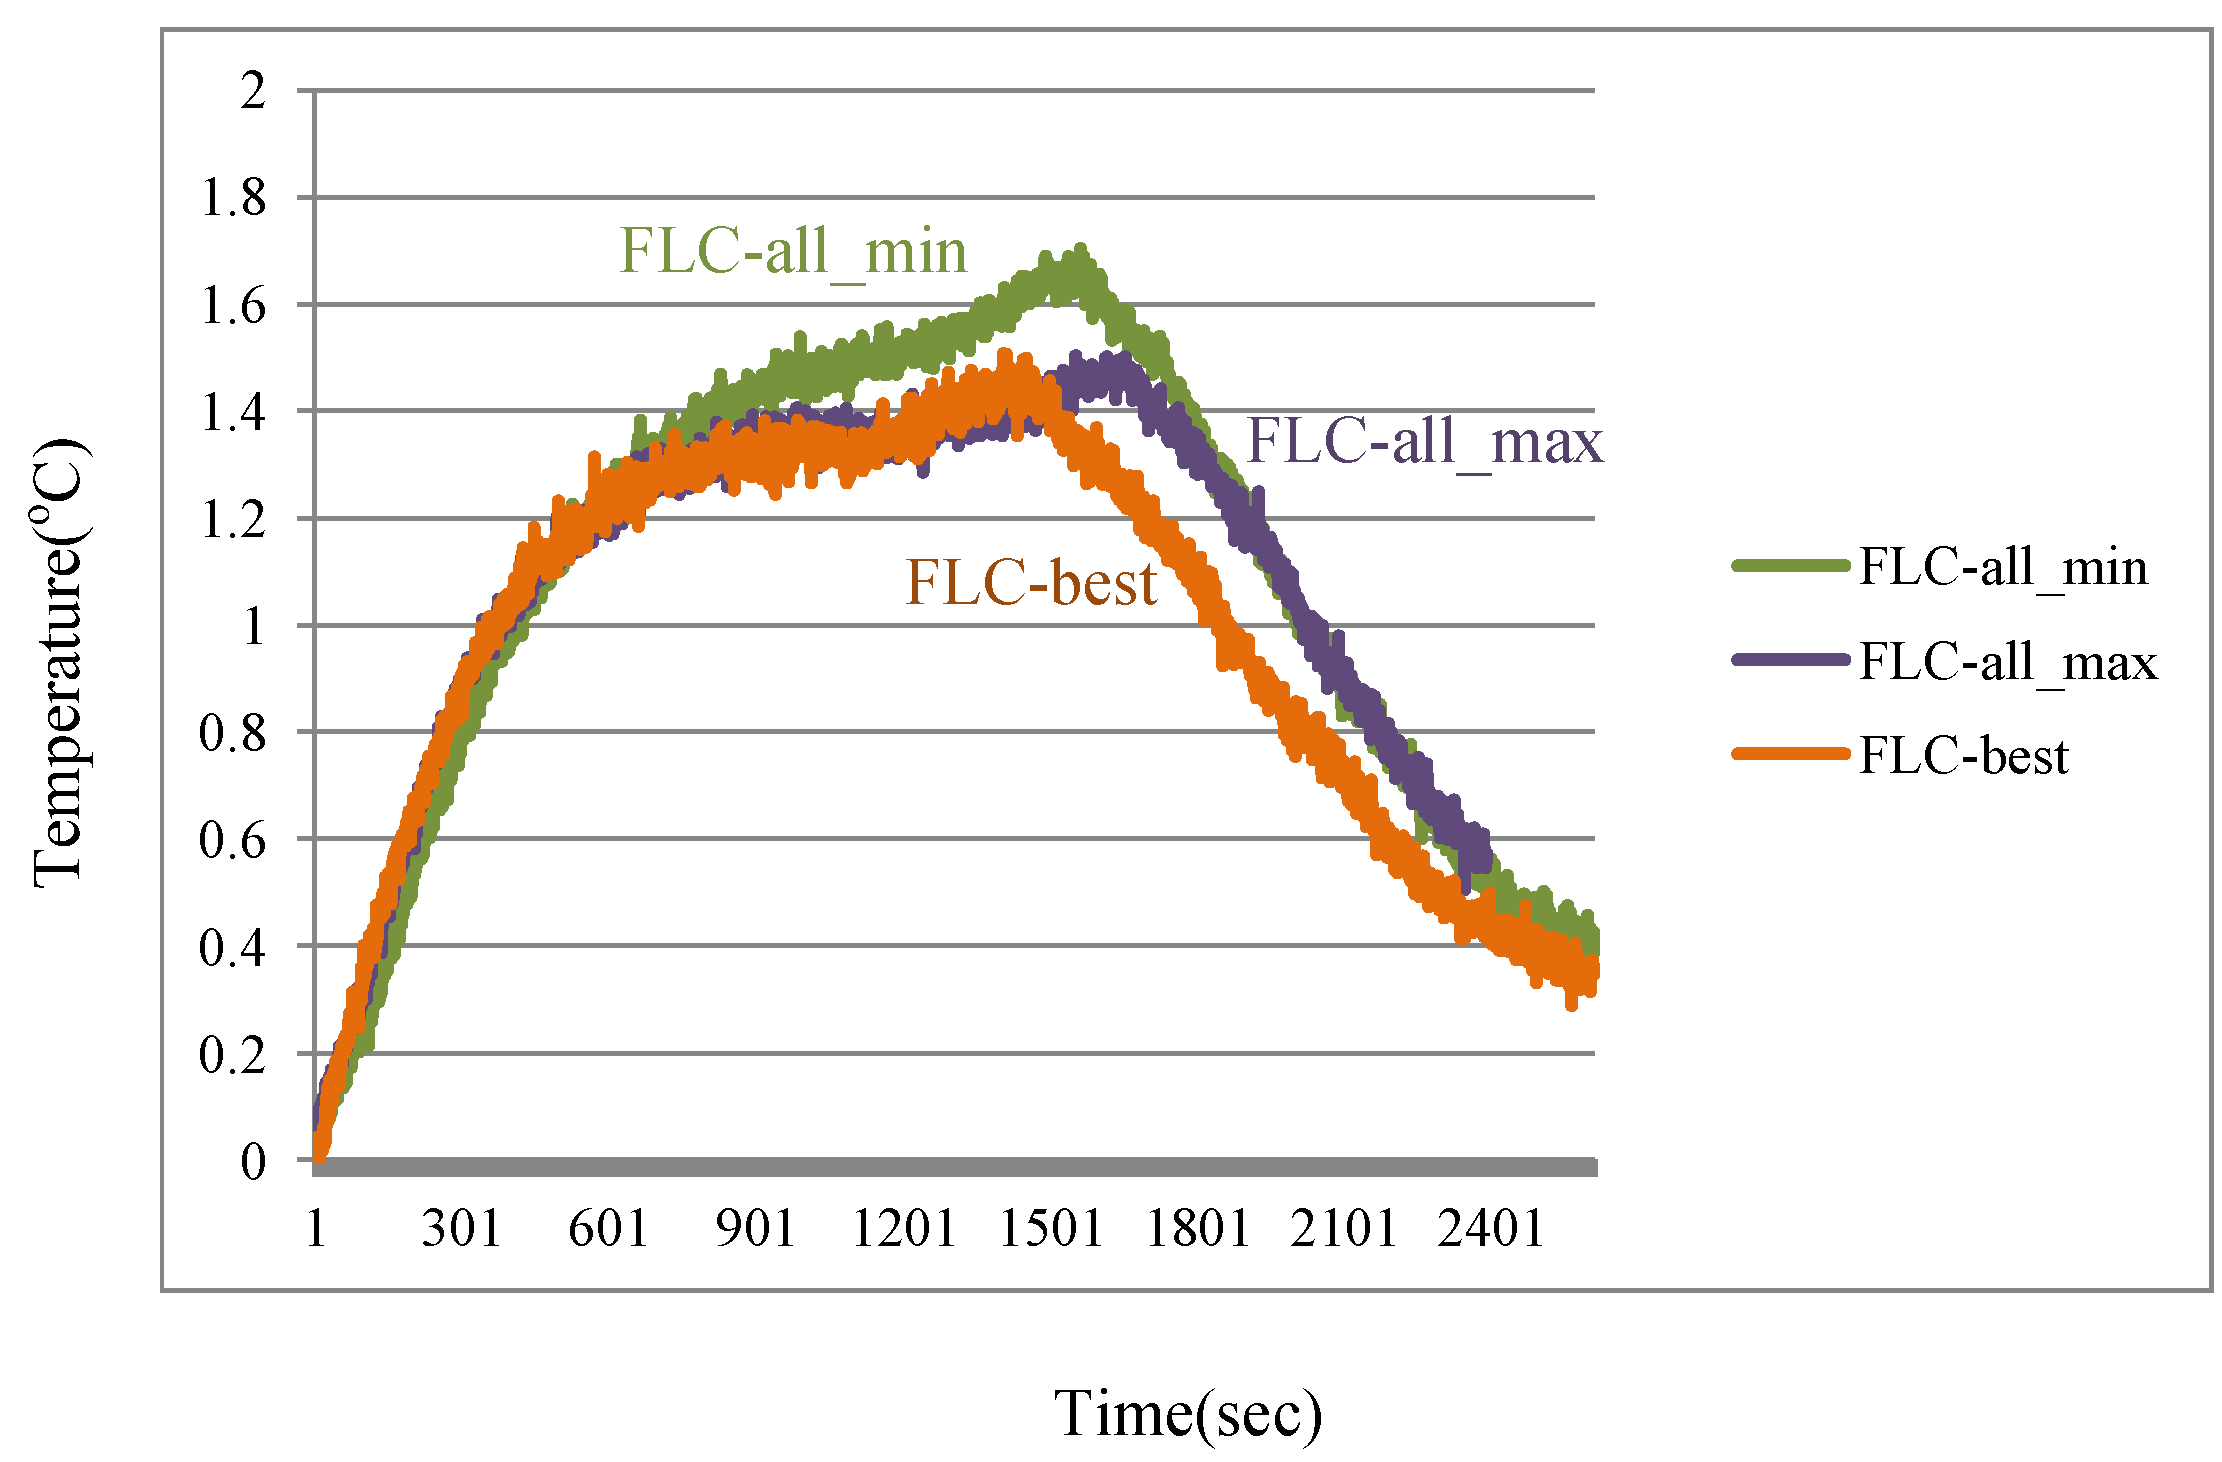
Figure 11 shows the measured temperature rise of the proposed FLC-based battery charger with different settings.
Figure 11.
Temperature rise of the proposed FLC-based charging algorithm with different parameter settings.
Figure 11.
Temperature rise of the proposed FLC-based charging algorithm with different parameter settings.
In
Figure 11, the curve denoted as “FLC-best” is the FLC-based battery charger with the optimal parameter setting [
I1,Δ(1),
I2,Δ(2),
I3,Δ(3),
I4,Δ(2),
I5,Δ(2)]. From
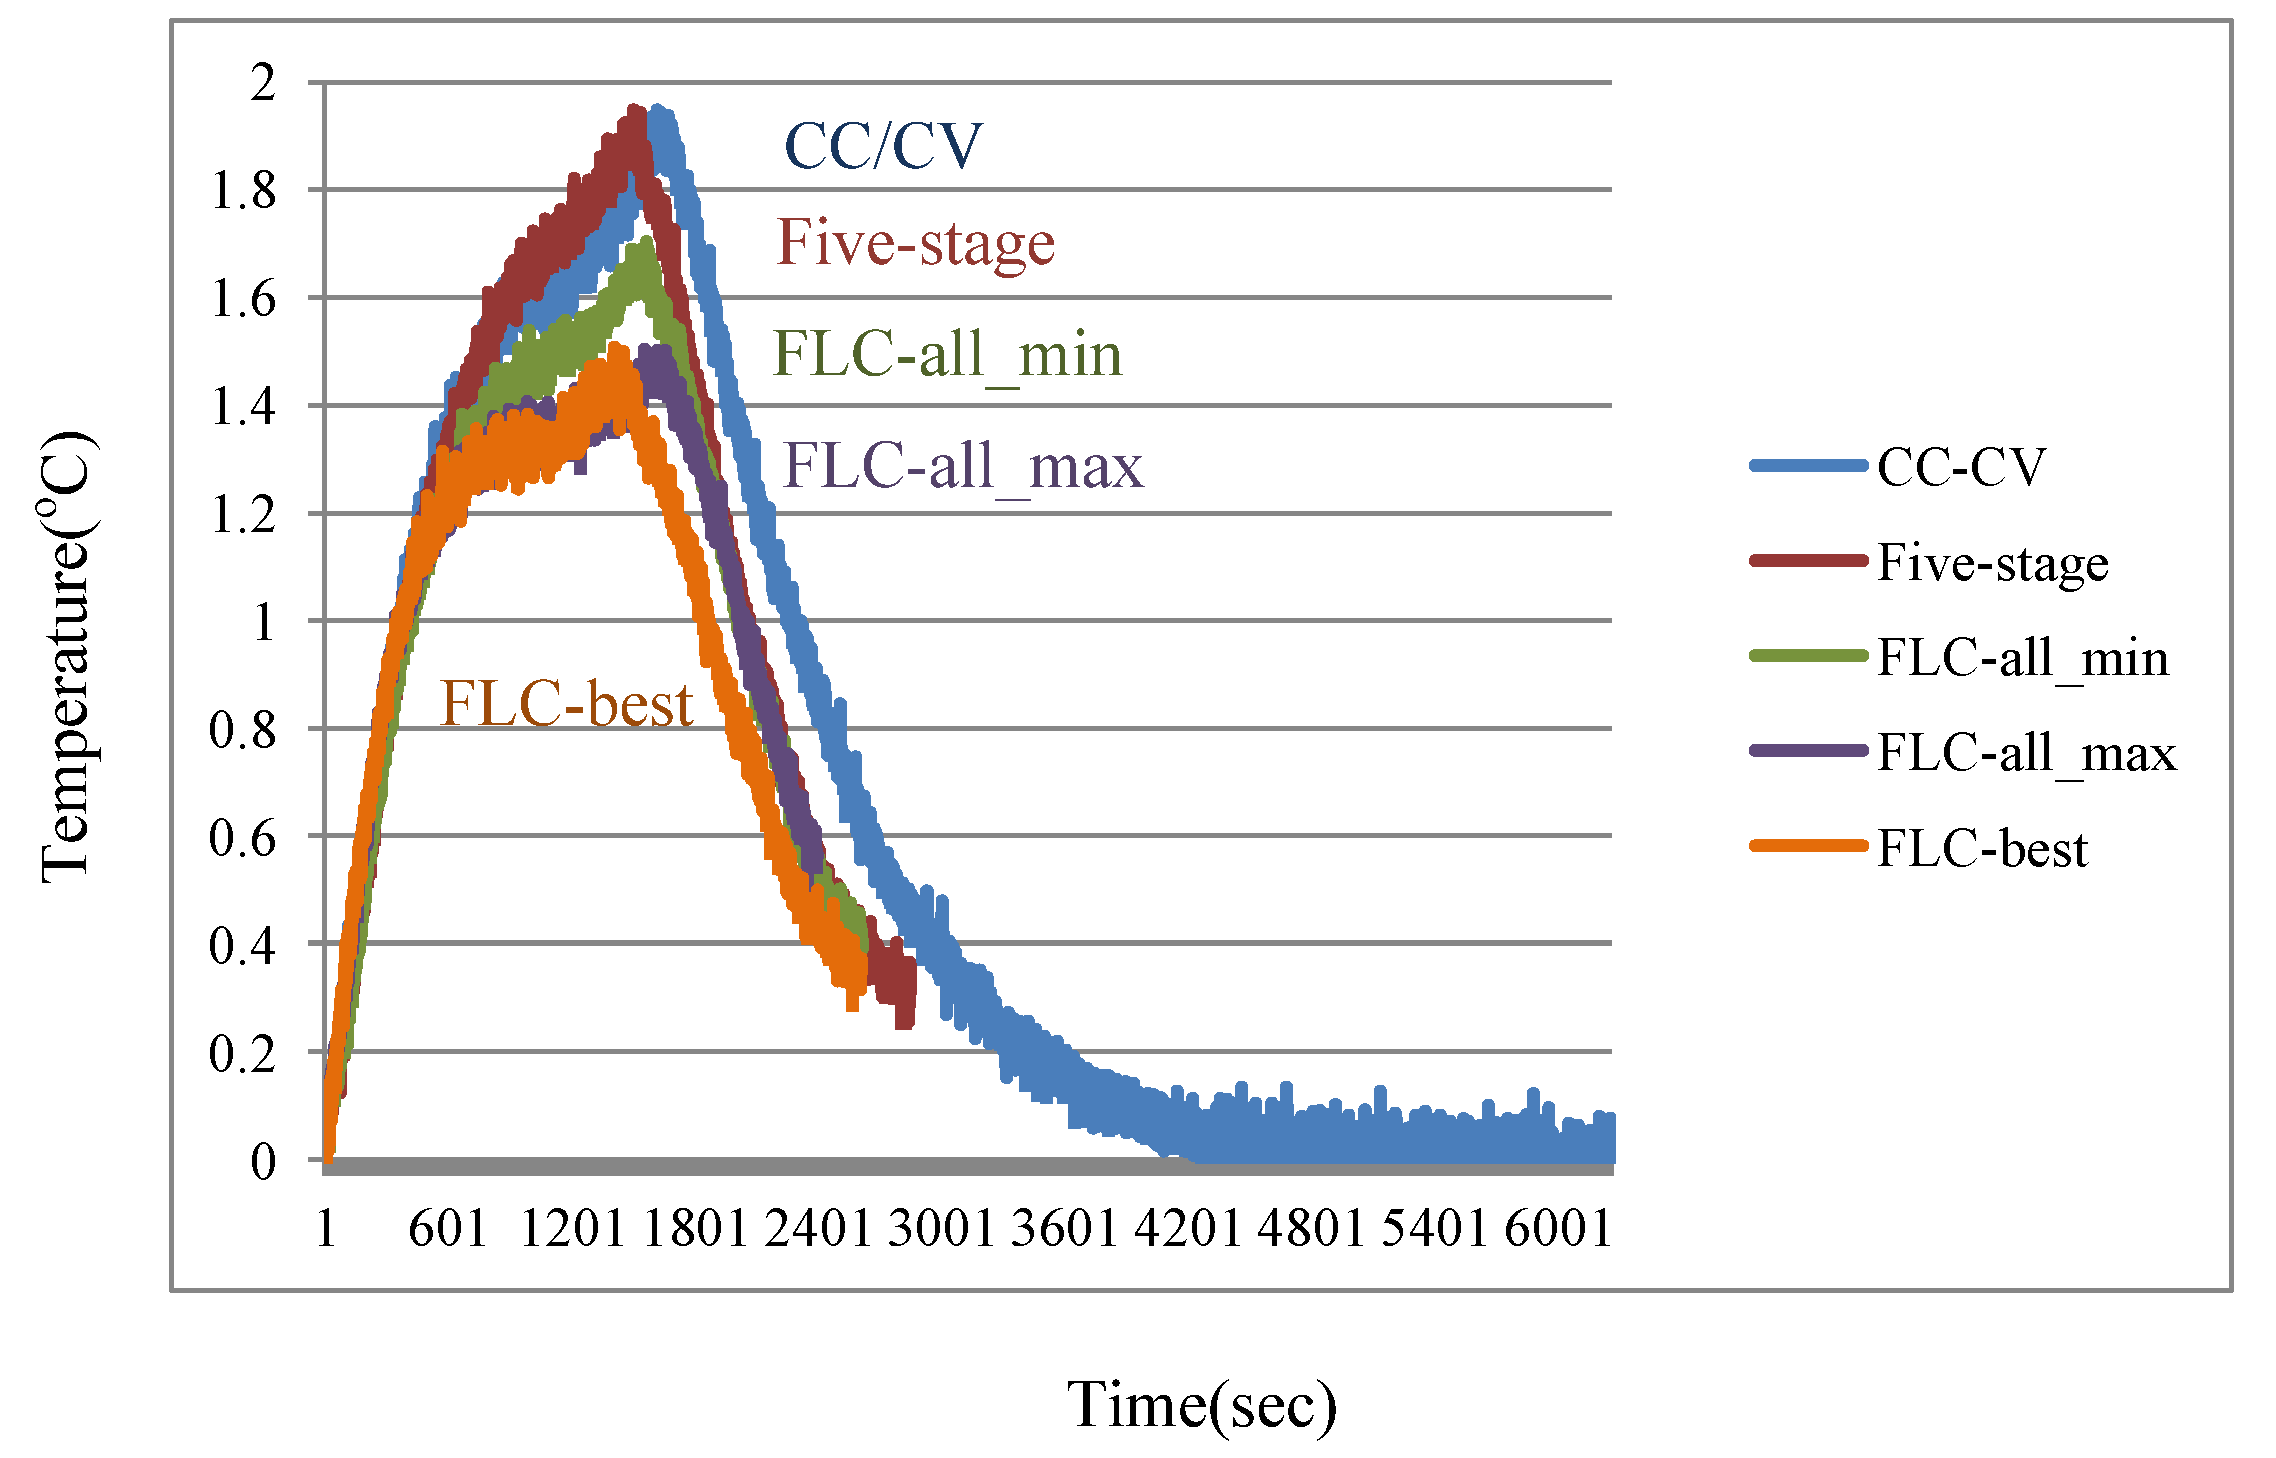
Figure 11, the FLC-based battery charger with the optimal parameter setting has the lowest temperature rise. In order to provide clearer overall comparison, temperature rise data of all the tested algorithms are again illustrated in
Figure 12.
Figure 12.
Temperature rise of five tested algorithms.
Figure 12.
Temperature rise of five tested algorithms.
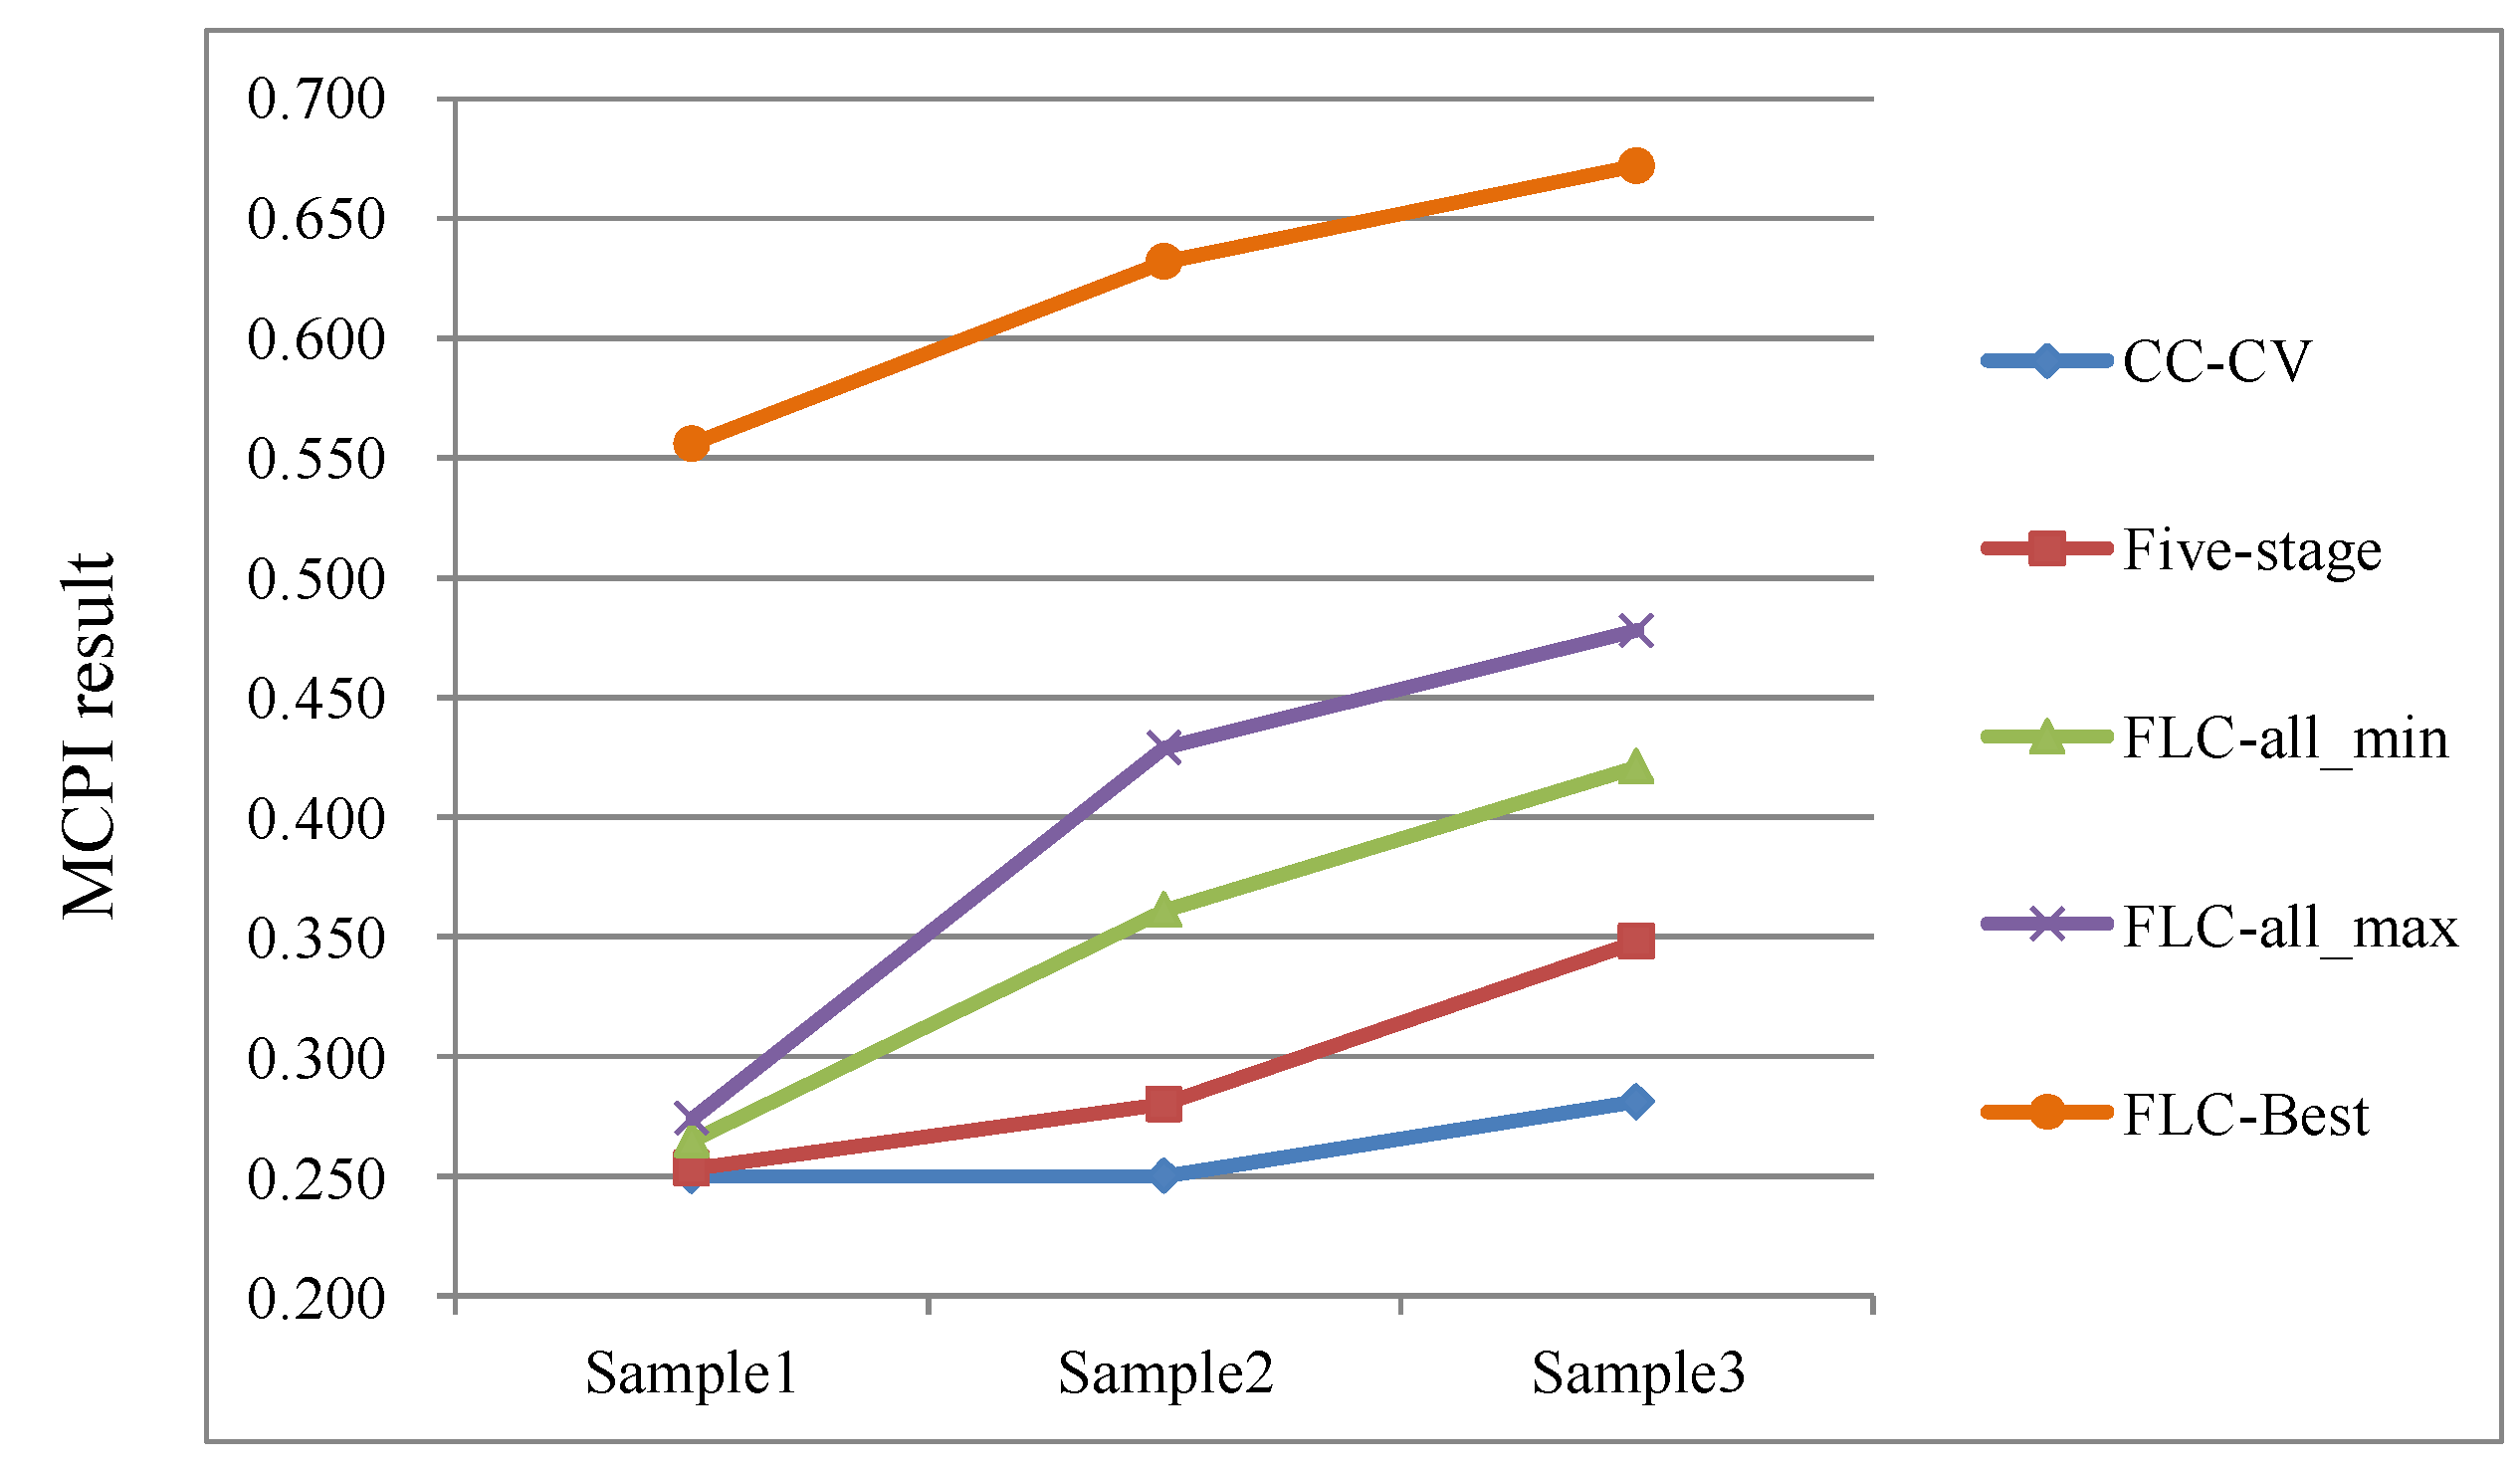
To further validate the effectiveness of the proposed charger, additional experiments are carried out.
Table 11 and
Figure 13 show the calculated MCPI results obtained from charging three brand-new batteries using five different charging algorithms. From
Figure 13, the proposed FLC-based battery charger with optimal parameter setting has the best MCPI value for all the three sample batteries.
Table 12 summarizes the charging efficiency, the average ΔT, the charged capacity, the charging time required and the combined MCPI value for five different charging patterns. In
Table 12, the charging efficiency is defined as the discharged capacity divided by the charged capacity, and the average ΔT is defined as the integration of the temperature rise for the whole charging period (the area under the temperature curve) divided by the charging time required. From
Table 12, although the discharged capacity of the proposed FLC-based charger is lower than that of the CC-CV method, the charging time required can significantly be improved.
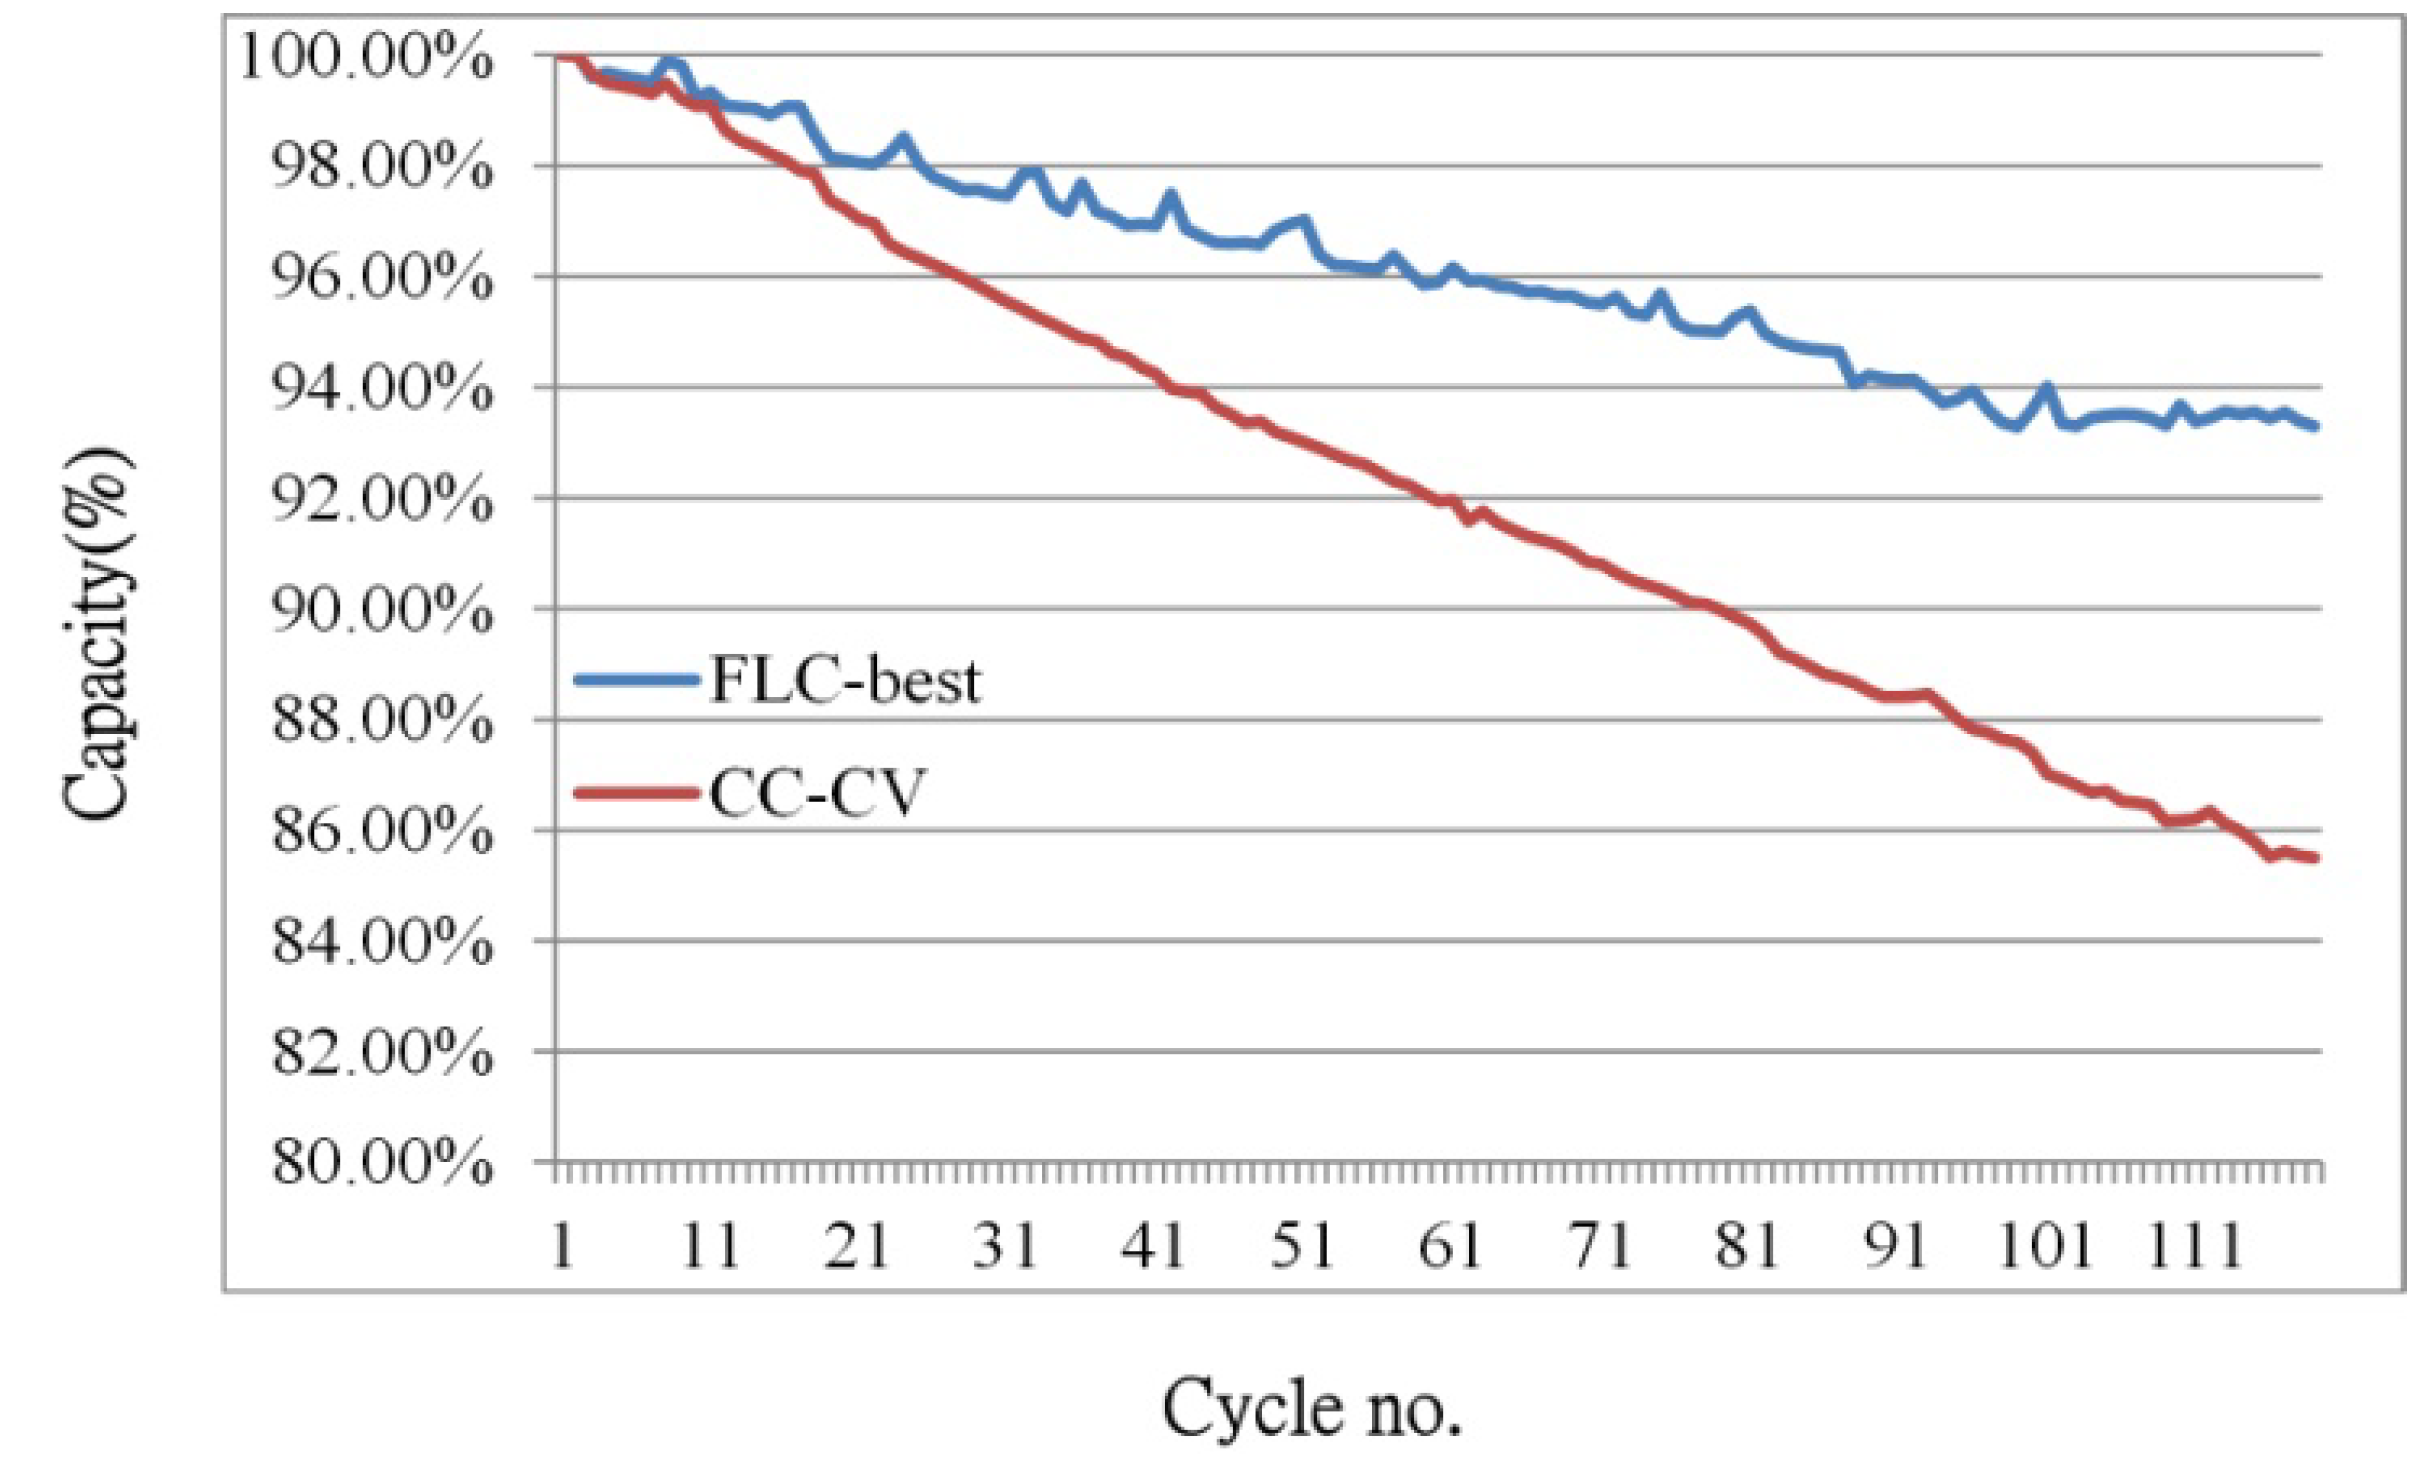
Figure 14 illustrates the remaining capacity (in %) versus cycle numbers for two new batteries from the same manufacturer (2000 mAh), charged using the CC-CV charging method and the proposed charger. From
Figure 14, the cycling number of the proposed algorithm when the capacity drop to 93.3% of the original capacity is 118; the cycling number of the conventional CC-CV method is 48 for the same capacity drop. That is, the proposed charge algorithm can provide 59.3% more cycle-life count than that of the conventional CC-CV method. Comparing with the CC-CV method, the charging time, charging efficiency, average temperature rise and the obtained cycle life of the Li-ion battery are improved by about 58.3%, 1.65% ,26.7% and 59.3%, , respectively. Comparing with the five-stage CC algorithm, adding the FLC to fine-tune the current can improve the charging time, the charging efficiency and the average temperature rise of the Li-ion battery by about 8.35%, 0.99% and 20.3%, respectively.
Table 11.
Obtained MCPI results of five tested algorithms.
Table 11.
Obtained MCPI results of five tested algorithms.
| MCPI_results | CC-CV | Five-stage | FLC all_min | FLC all_max | FLC-best |
|---|
| Sample1 | 0.250 | 0.253 | 0.265 | 0.274 | 0.556 |
| Sample2 | 0.250 | 0.280 | 0.361 | 0.429 | 0.632 |
| Sample3 | 0.281 | 0.348 | 0.421 | 0.478 | 0.672 |
Table 12.
Comparison of five tested algorithms.
Table 12.
Comparison of five tested algorithms.
| Performance | CC-CV | Five-stage | FLC all_min | FLC all_max | FLC-best |
|---|
| Charging efficiency (%) | 97.50 | 98.16 | 98.64 | 98.81 | 99.15 |
| Charging avg. ΔT (°C) | 1.3326 | 1.2257 | 1.1840 | 1.1778 | 0.9771 |
| Charging time (sec) | 6268 | 2852 | 2616 | 2395 | 2614 |
| Discharged cap. (%) | 100 | 87.65 | 84.10 | 81.89 | 85.02 |
| MCPI_results | 0.250 | 0.284 | 0.364 | 0.401 | 0.625 |
Figure 13.
Obtained MCPI results of five tested algorithms.
Figure 13.
Obtained MCPI results of five tested algorithms.
Figure 14.
Comparison of cycle life test between the proposed charger and the CC-CV method.
Figure 14.
Comparison of cycle life test between the proposed charger and the CC-CV method.
6. Conclusions
In this study, a FLC-based five-stage Li-ion battery charger is first proposed. Based on an obtained optimal five-stage charging current setting value, the proposed charger integrates a FLC to fine-tune the charging current according to the battery temperature. Comparing with the conventional CC-CV and five-stage CC charging methods, the proposed charger is capable of charging the Li-ion batteries with shorter charging time, higher charging efficiency and lower temperature rise. To further improve the performance of the proposed charger, a fuzzy-based Taguchi method is utilized. The fuzzy-based Taguchi method can obtain the optimal output MFs in only 54 experimental tests. According to the experimental results, the performance characteristics such as the charging time, the charged capacity and the temperature rise can simultaneously be considered and improved through this approach. Comparing with the conventional CC-CV method, the charging time, the charging efficiency, average temperature rise and the obtained cycle life of the Li-ion battery are improved by about 58.3%, 1.65%, 26.7% and 59.3%, respectively.


