4.5. Long-Term Analysis
The long-term behavior of the average cell voltages of the four cells as well as the corresponding segment current density at the inlet and outlet at the nominal operation point of 500 mA/cm
2 in
Figure 13 (respectively in 1 h intervals) show no significant shifts to higher or lower values for the segment current densities for the majority of the measurements. In general, the long-term measurements lead to an increased spreading of the current density. In short-term operation the segment current densities are closer to each other. At the section of the 117th h a strong decrease of the cell voltages and the current density at the inlet can be noticed. The reason is the faulty volume flow rate for the air supply. Dehydration at the inlet reduces the current density production, which is compensated through the segments at the outlet. While the level of the cell voltages in short-term operation and the first long-term operation stays above 650 mV (20–288th h), the dry conditions of the second long-term measurement (289–383th h) result in a strong cell voltage decrease. In the final measurement, with reversed direction of flow and better humidity balance, the voltage level of the first measurement was nearly reached. The system shows in total a degradation of 19.5 µV/h. A current density production decrease of 137 µA/h at the inlet and an increase of 132 µA/h at the outlet are the result of the operation. These degradation values (
Table 4) cannot be taken directly from
Figure 13. The cell voltages presented are measured at different parameters and are not comparable. The values are clearly below the degradation values in comparison to each individual measurement, which are caused by the parameter variation and led to the fluctuations between h 88 and 383 in
Figure 13. The discontinuous operation of the system led eventually back to the original cell voltages [
14] and segment current densities.
Figure 13.
Long time behavior of cell voltage and current density.
Figure 13.
Long time behavior of cell voltage and current density.
Table 4.
Degradation of the fuel cell stack after 20 and 400 operation h; measurement each after constant phase with identical parameters (see
Figure 3).
Table 4.
Degradation of the fuel cell stack after 20 and 400 operation h; measurement each after constant phase with identical parameters (see Figure 3).
| Operation (h) | Average cell voltage (mV) | Current density inlet (mA) | Current density outlet (mA) |
|---|
| t = 20 | 651.5 | 465.9 | 500.5 |
| t = 400 | 644.1 | 413.9 | 550.6 |
| Degradation | −19.5 µV/h | −137 µA/h | +132 µA/h |
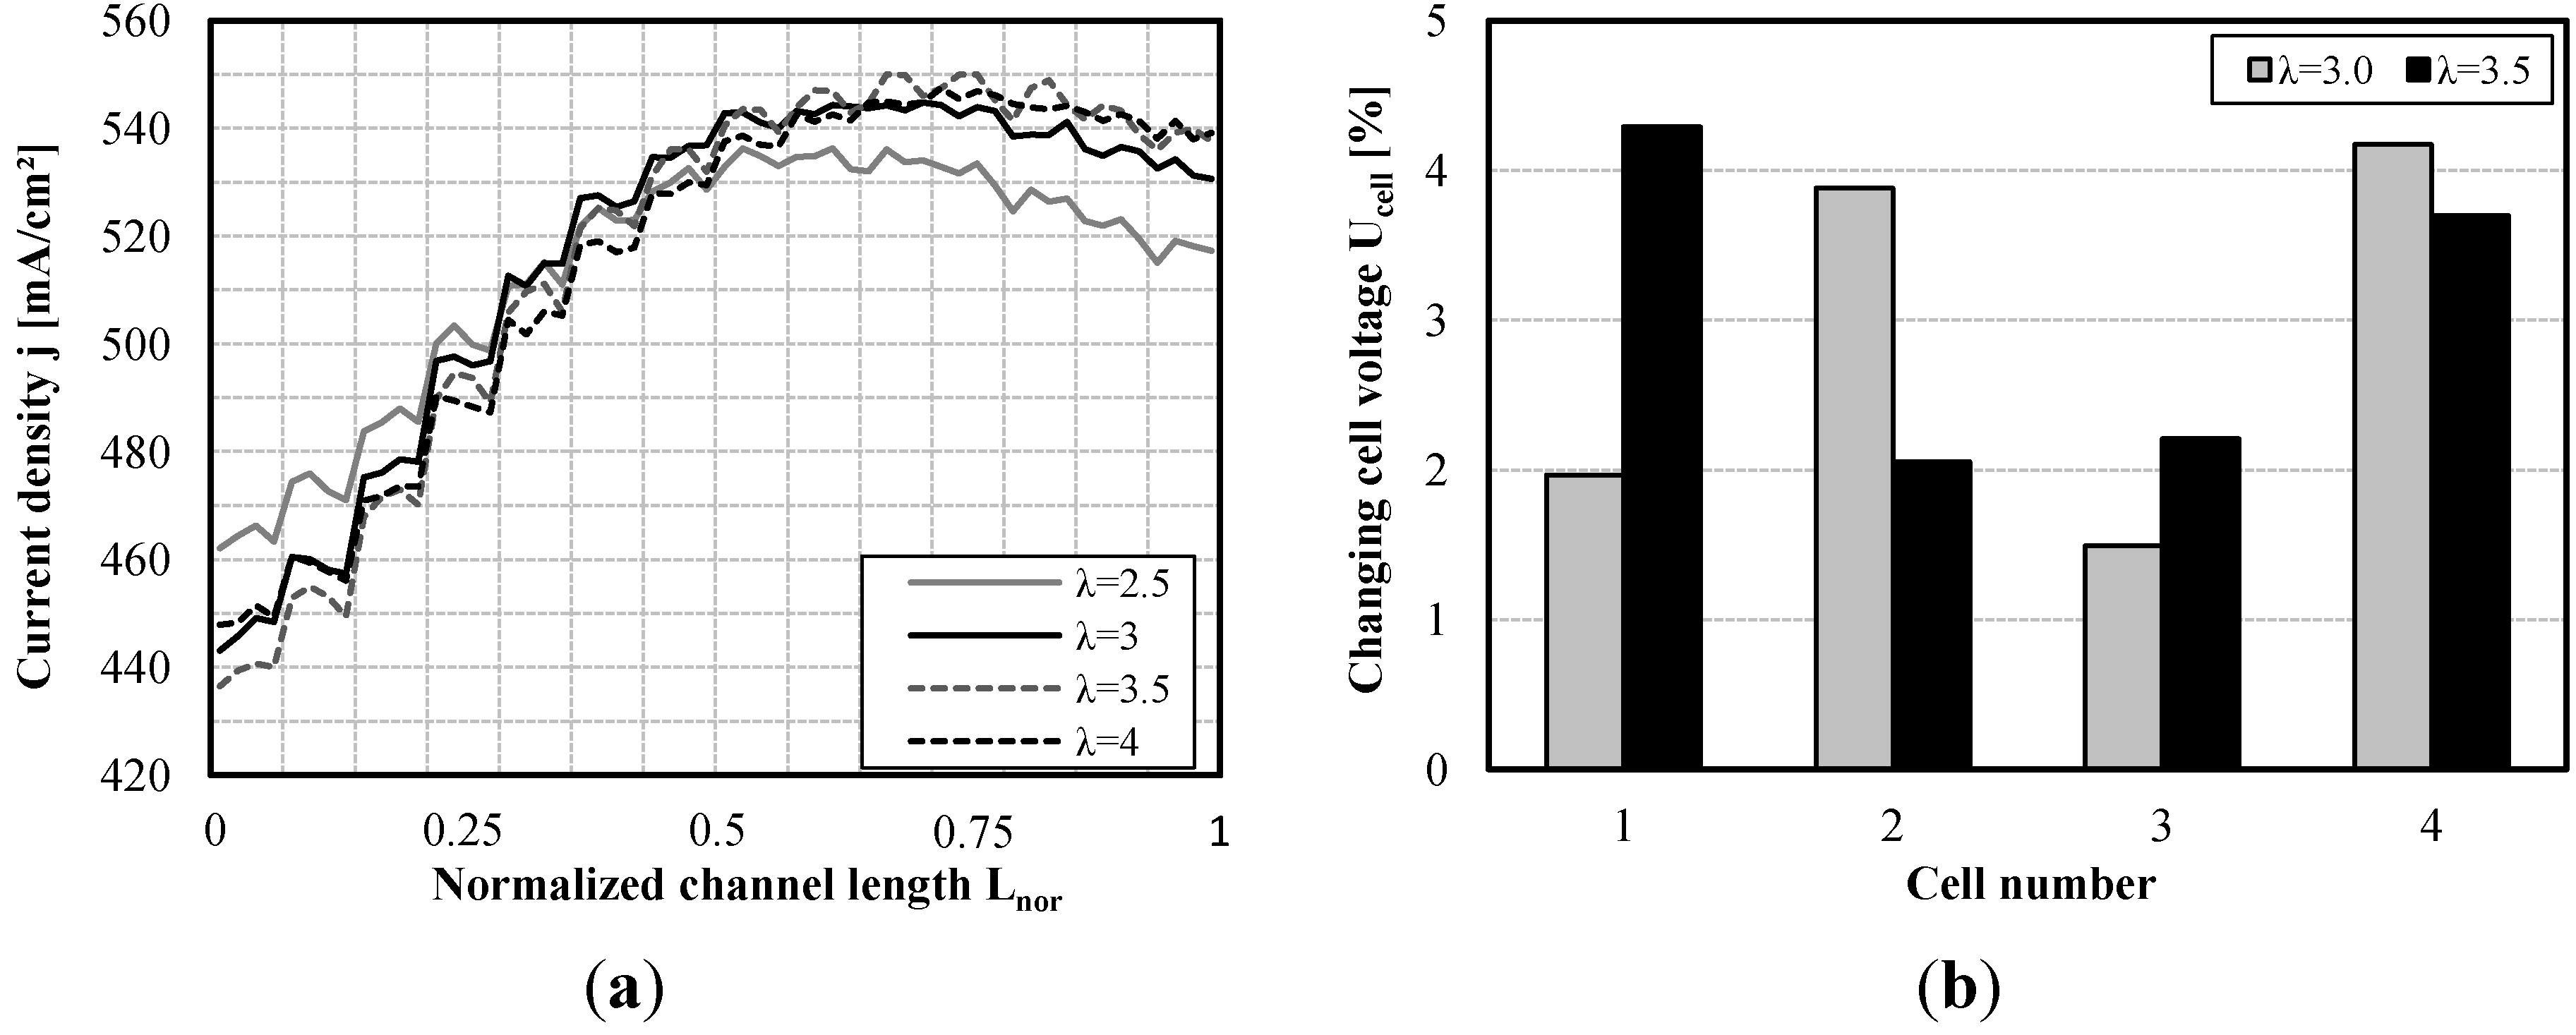
A vectorial experiment scheme was created to analyze the effects of single and combined (cross effects) changes of the operation parameters on the current density profile (CDP) and single cell voltages (SCV). The parameters include stack temperature, cathode stoichiometry and air inlet temperature. The upper and lower values are given in
Table 5 and are marked with “+” and “−” in the results while the parameters are symbolized by “A”, “B” and “C” for simplification. Because recirculation pump speed and purge interval did not show a significant impact, these parameters were not changed during this test.
with
ns = Number of values tested (+ and −),
nf = Number of analyzed parameters.
Table 5.
List of analyzed parameters.
Table 5.
List of analyzed parameters.
| Parameter | Symbol | Value “−” | Value “+” | Unit |
|---|
| Stack temperature TFC | A | 55 | 65 | (°C) |
| Cathode stoichiometry | B | 2.9 | 3.3 | (-) |
| Air inlet temperature | C | TFC-2 °C | TFC-4 °C | (°C) |
| Recirculation pump speed | - | 60 | 60 | (%) |
| Purge interval | - | 30 | 30 | (s) |
Equation (2) results in 8 required measurements for the vectorial experiment scheme with the three analyzed parameters [
15]. The complete experiment scheme is given in
Table 6. The cross effects of combining AB, BC and AC and all three together in ABC were added to the scheme.
Table 6.
Vectorial experiment scheme.
Table 6.
Vectorial experiment scheme.
| Number | A | B | C | AB | BC | AC | ABC |
|---|
| 1 | - | - | - | + | + | + | - |
| 2 | + | - | - | - | + | - | + |
| 3 | - | + | - | - | - | + | + |
| 4 | + | + | - | + | - | - | - |
| 5 | - | - | + | + | - | - | + |
| 6 | + | - | + | - | - | + | - |
| 7 | - | + | + | - | + | - | - |
| 8 | + | + | + | + | + | + | + |
To determine the effects E of the parameters y and the cross effects, Equation (3) is used to subtract the averaged measurement values of the parameters according to the setting [
16].
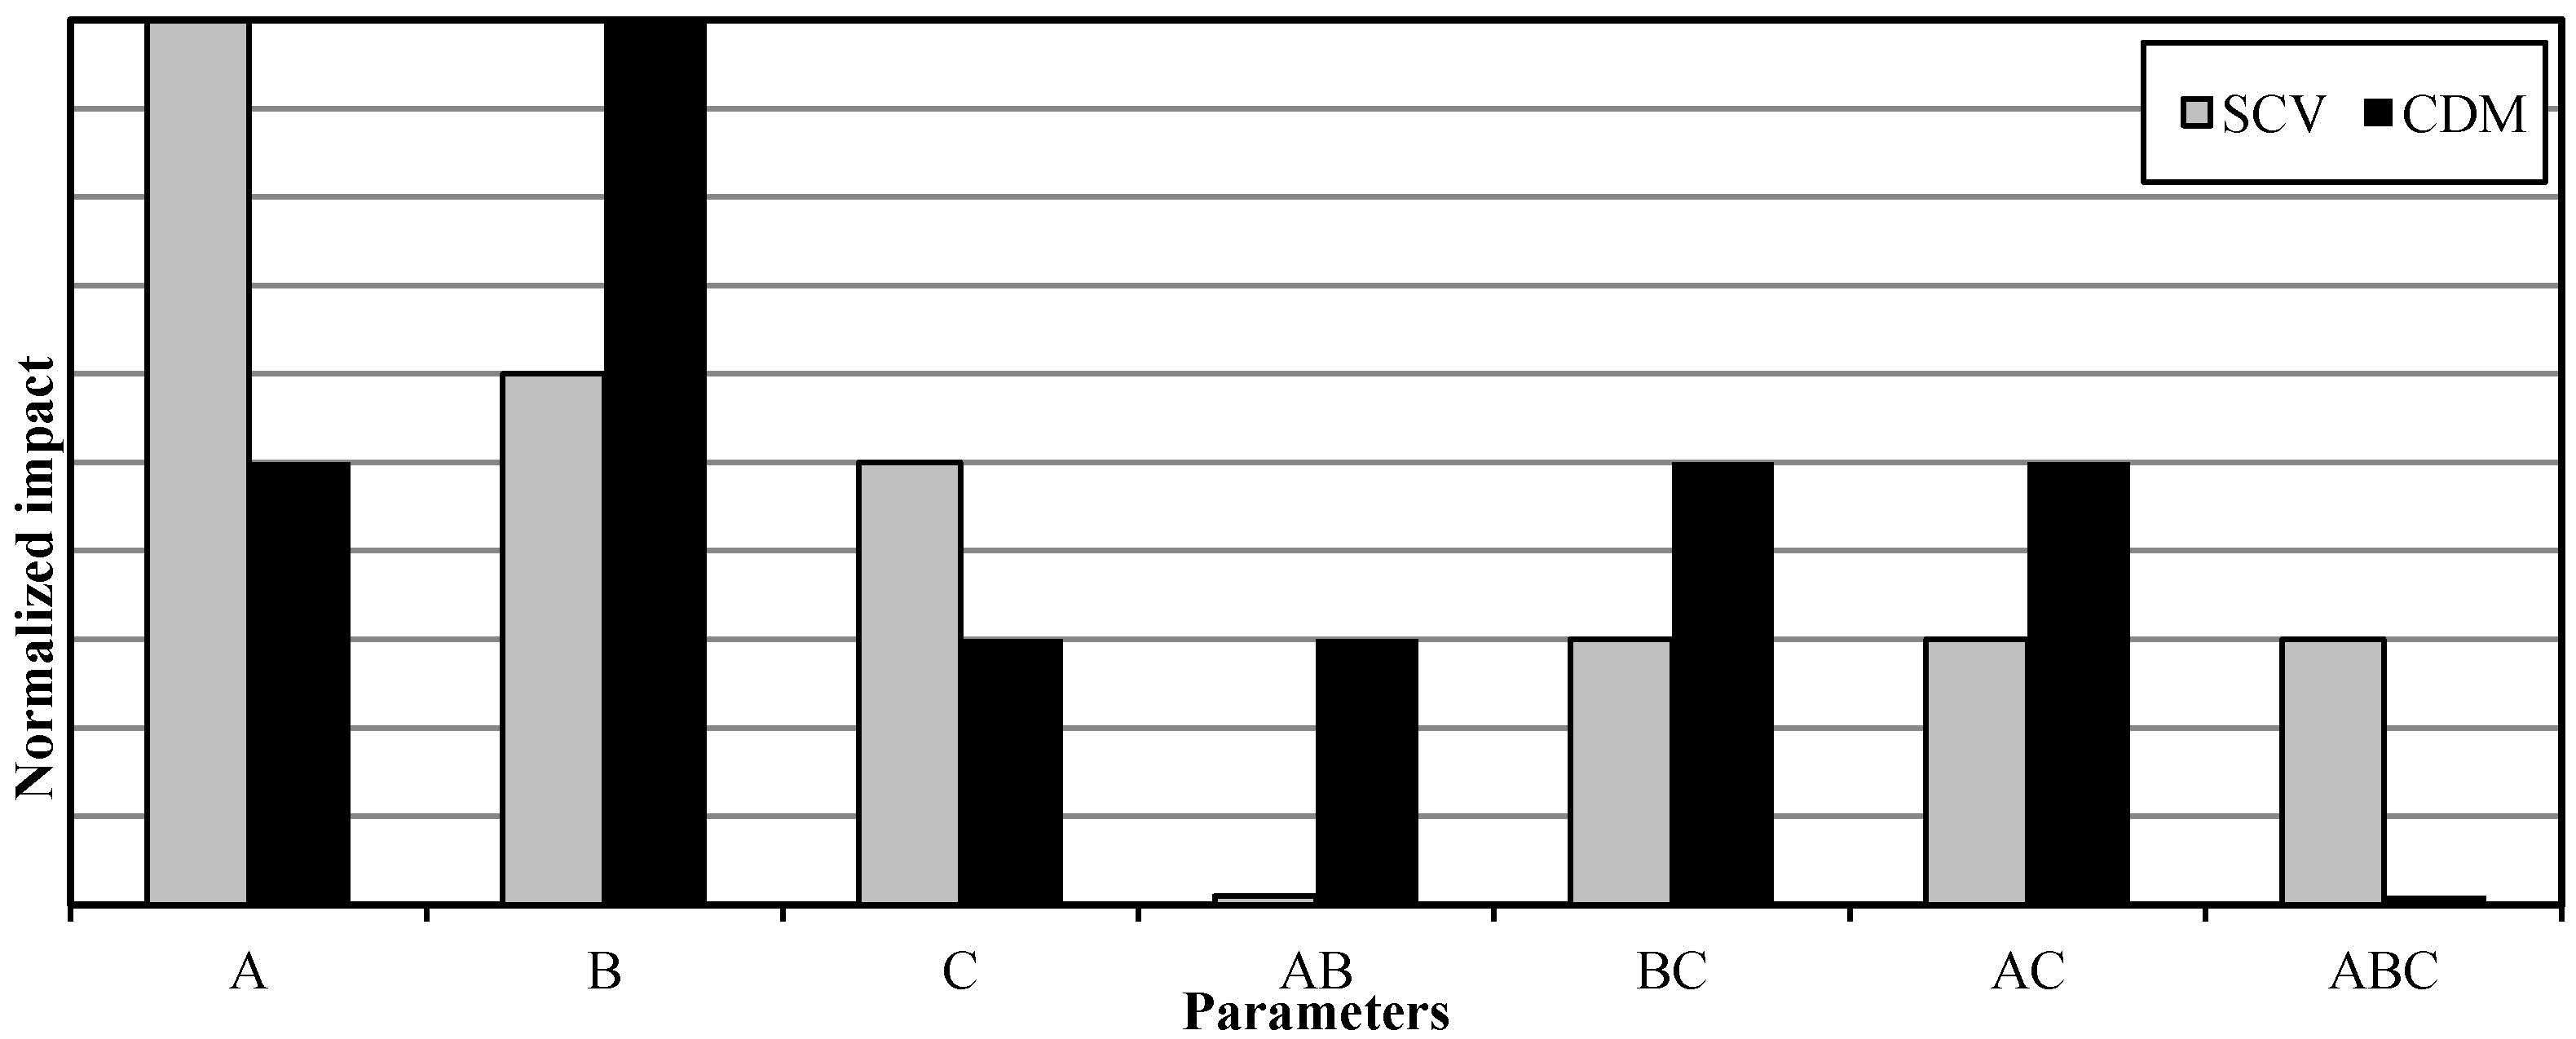
In
Figure 14, the calculated effects for the SCV and CDP measurements are given. The levels represent the impact of the change of parameters (or their combination) on the target value (SCV or CDP).
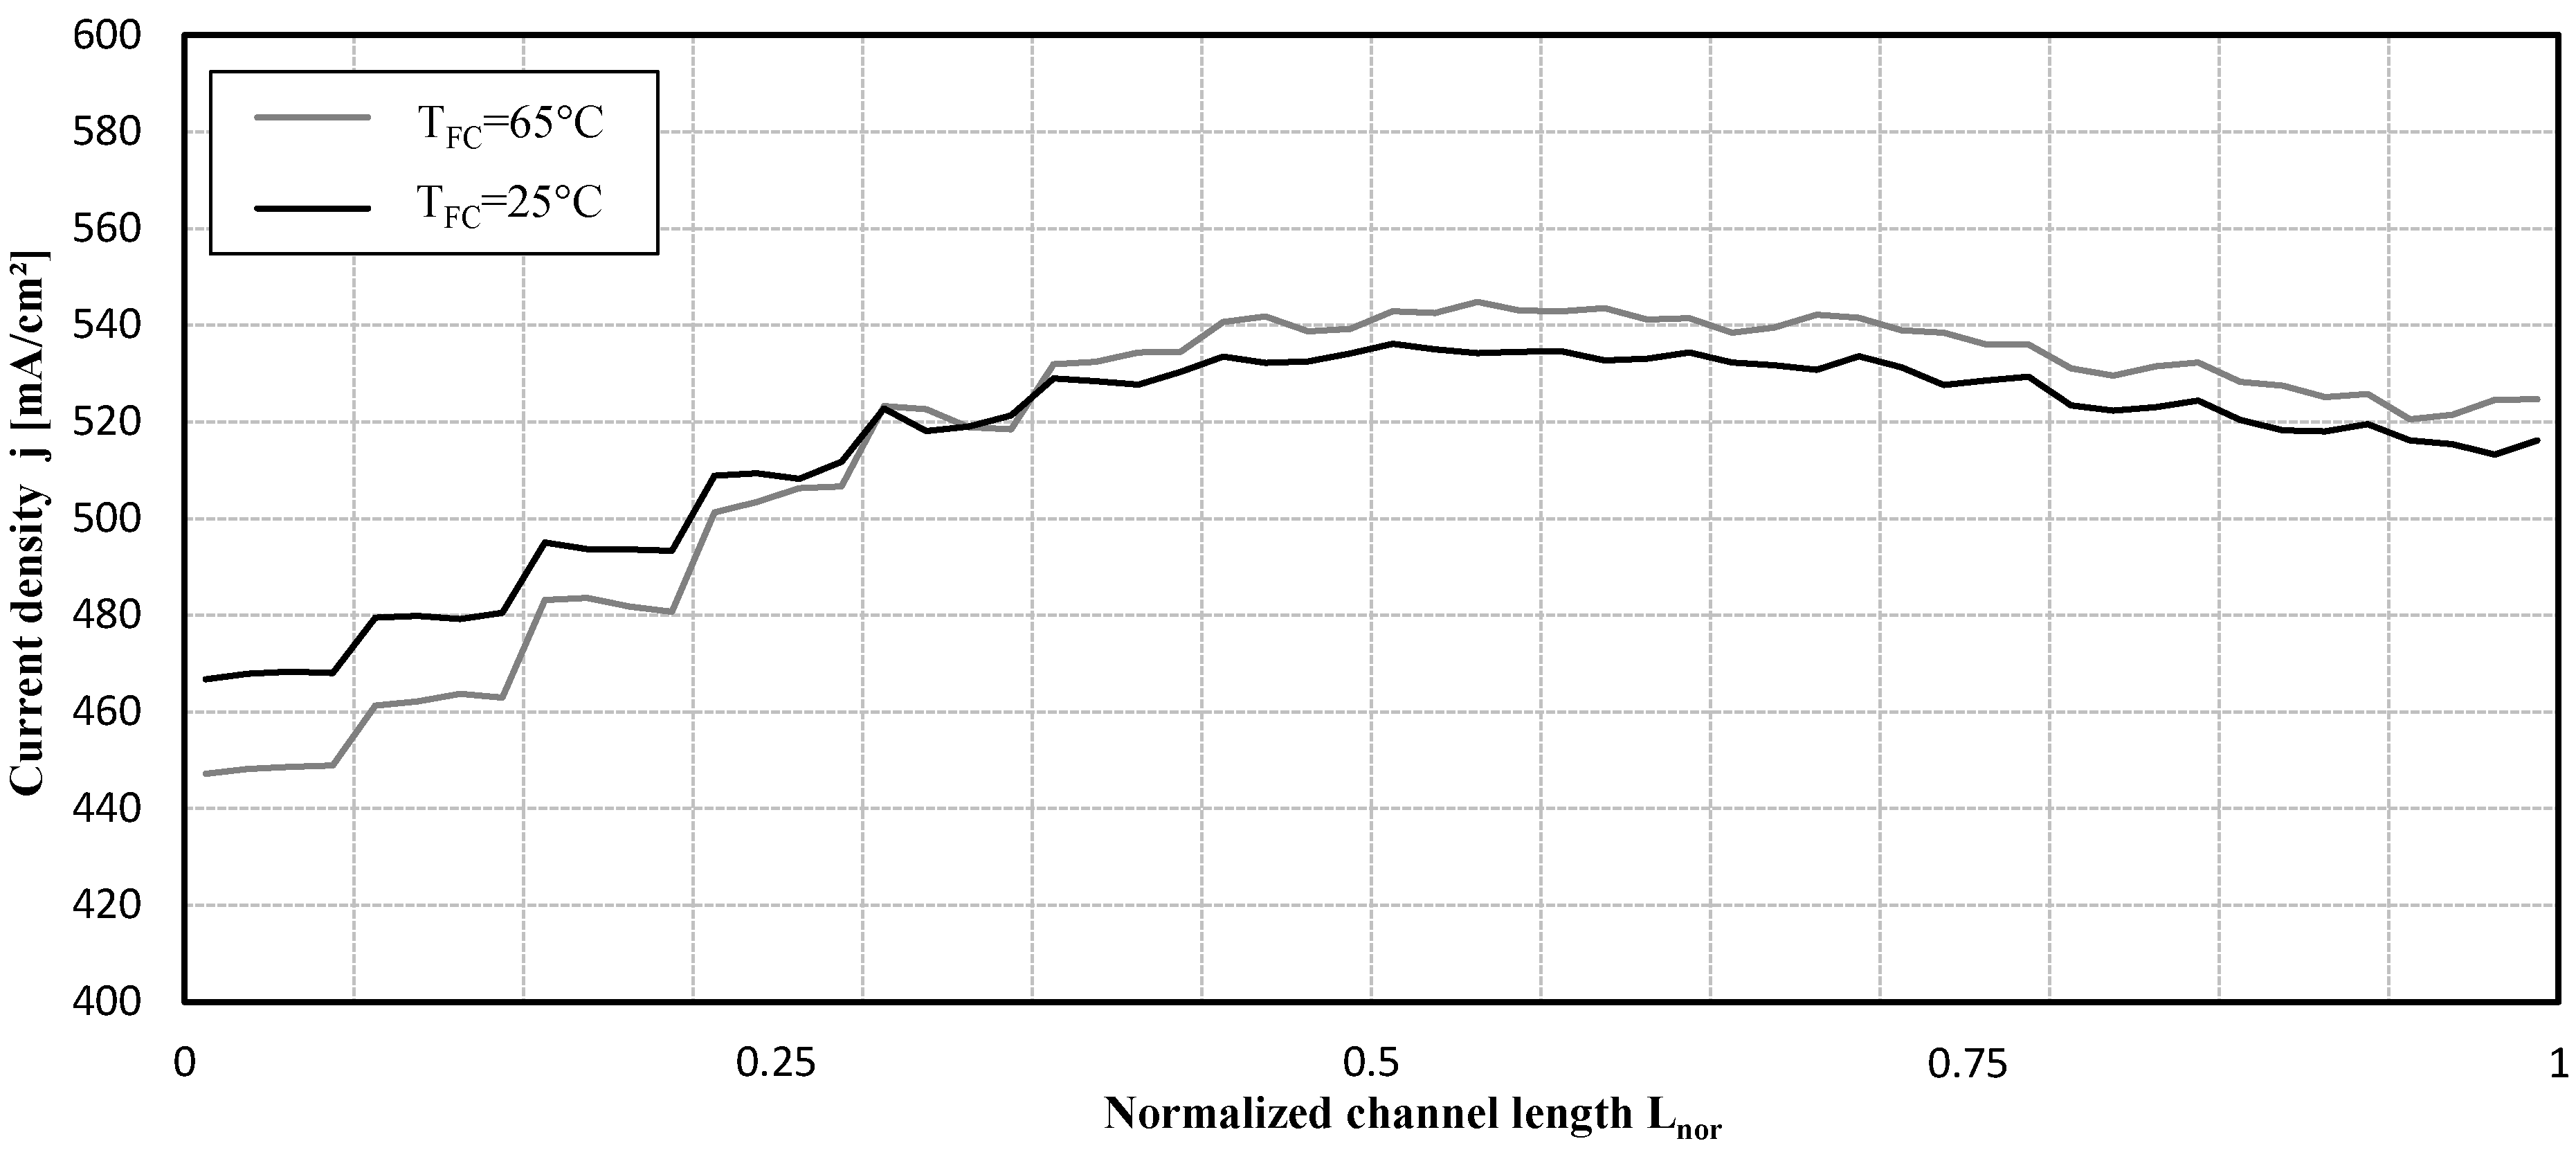
The SCV is only dependent on the main parameters A, B and C while cross effects have almost no impact on the target value. The stack temperature (A) has the biggest impact, the cathode stoichiometry (B) and air inlet temperature (C) are have nearly the same (lower than A) impact. But the cross effects have to be taken into account as well. While the combined change of A and B has almost no effect, the other cross effects are very small. That means setting all parameters to value “+” is not the best option.
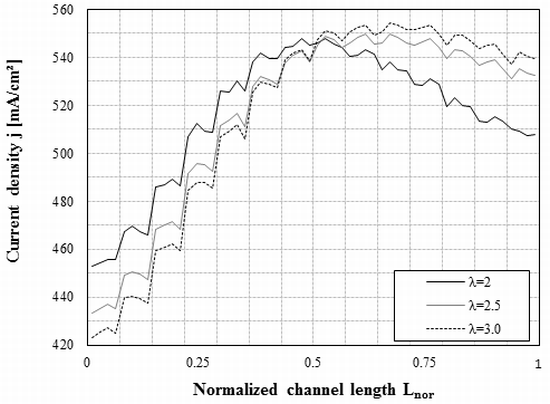
For the CDP the diagram shows a different behavior. The parameter B has the only noteworthy impact on the CDP. Combining B with A or A and B results in almost no effect on the CDP, only the combination of B and C or A and C shows a slight impact
Figure 14.
Diagram of the impact effects on SCV and CDP.
Figure 14.
Diagram of the impact effects on SCV and CDP.


