A Wide-Area Measurement Systems-Based Adaptive Strategy for Controlled Islanding in Bulk Power Systems

Abstract
: Controlled islanding is the last countermeasure for a bulk power system when it suffers from severe cascading contingencies. The objective of controlled islanding is to maintain the stability of each island and to keep the total loss of loads of the whole system to a minimum. This paper presents a novel integrated wide-area measurement systems (WAMS)-based adaptive controlled islanding strategy, which depends on the dynamic post-fault trajectories under different failure modes. We first utilize an improved Laplacian eigenmap algorithm (ILEA) to identify the coherent generators and use the slow coherency grouping algorithm to guarantee coherent stability within an island. Using the identification result, we then define the minimum coherent generator virtual nodes to reduce the searching space in a graph and utilize the k-way partitioning (KWP) algorithm to obtain a preliminary partition of the simplified graph. Based on the preliminary partition, we consider the direction of power flow and propose a variable neighborhood heuristic searching algorithm to search the optimal separation surfaces so that the net imbalanced power of islands is minimized. Finally, the bidirectional power flow tracing algorithm and PQ decomposition power flow analysis are utilized to determine the corrective controls within each island. The test results with the New England 39-bus system and the IEEE 118-bus system show that the proposed integrated controlled islanding strategy can automatically adapt to different fault modes through generator coherency identification and effectively group the different coherent generators into different islands.1. Introduction
Recently, with the expansion of large interconnected power grids and the regional integration of large-scale power systems, along with the increasingly diverse power transmissions driven by market competition, the stability and safety operation of the bulk power system is faced with serious challenges. Specially, severe disturbances, such as earthquakes, hurricanes, human operation errors and malicious attacks, may make the power system unstable and even trigger cascading outages. Cascading outages could spread rapidly across the power system, resulting in significant disruption to modern society, leaving millions of people in the dark. For example, in the Northeastern United States and Canada blackout on 14 August 2003 [1], the outage was initially triggered in Ohio, but then spread quickly to the whole eastern region. It affected an area having over 50 million people and 61,800 MW of electric load in the states of Ohio, Michigan, Pennsylvania, New York, Vermont, Massachusetts, Connecticut and New Jersey in the U.S. and Ontario in Canada. Very recently, on 30 and 31 July 2012, two widespread blackouts occurred in India, which affected the largest number of people in history. The two successive blackouts were both caused by the trip of a certain inter-regional corridors between the northern and western networks. Subsequent faults led to the breaking down of the whole power system.
Consequently, when a power system suffers from cascade contingencies, how to avoid catastrophic failures and guarantee continuous power supply are two of the critical problems we need to tackle. Controlled islanding is the key to solving this problem. Its main purpose is to avoid cascading outages and limit the impact of disturbances by restraining out-of-step oscillations. Furthermore, along with the deployment of WAMS in power networks, controlled islanding has become a feasible and effective solution.
Several approaches have been proposed for controlled islanding. Peponides et al. [2] propose to aggregate generator groups based on the singular perturbation technique and the identification of slow coherency in the power system. According to singular perturbation and two time scales of a dynamic system, the system's working mode can be separated into slow mode and fast mode. After a disturbance, the dynamic system is in the fast mode, and then, the slow mode dominates the system's performance after the fast mode decays. Chow [3] provides a detailed description of slow coherency and its application in power systems. Following Chow's work, You et al. [4,5] improved the slow coherency method and used it to obtain an islanding strategy in power systems. In [6–8], the graph-theoretic method is used to solve the problem of controlled islanding. This type of method normally identifies the minimal cut-set and the weak connection with graph simplification [9,10] and depth-first searching. Li et al. [11] proposed a k-way partitioning (KWP) method, which enhances the graph-theoretic method with the consideration of minimizing the generation-load imbalance in each area. In [12], a two-step controlled islanding algorithm is proposed, which uses spectral clustering to find a suitable islanding solution. This method, however, does not consider the generator coherency after disturbances. In addition, it only considers the absolute value of active power, but ignores the direction of power flows and the influence of electrical distance, both of which are important in the process of controlled islanding.
In addition to the slow coherency-based islanding strategy, several researchers proposed different methods for the real-time determination of the optimal islanding boundaries. Sun et al. [13] introduced the ordered binary decision diagram (OBDD) to identify the islanding cut-set. The OBDD-based approach satisfies necessary steady-state constraints. Sun et al. [14] further extended OBDD by using power system transient simulation to split the power system into stable islands. Other works [15,16] utilized intelligent optimization algorithms, such as the ant searching mechanism and particle swarm optimization, to search for proper islanding solutions.
Nowadays, WAMS have become mature and have been broadly deployed in power systems. With WAMS, we can use phasor measurement units (PMU) to monitor the dynamic properties of generators in real-time, including, for example, rotor angles, generator speeds, voltage magnitudes and phase angles [17,18]. With the global information provided by WAMS, it becomes possible and necessary to develop a better and holistic solution for the controlled islanding problem. Based on synchronized phasor measurements, Sun et al. [18] presented a unified framework to answer three critical problems in controlled islanding: “where to separate?” “when to separate?” and “what to do after separation?”. While the unified framework provides a better idea for the study on controlled islanding, the proposed methods may help either perform controlled islanding or predict and mitigate unintentional separation.
In this paper, we present a novel integrated WAMS-based adaptive controlled islanding strategy. It consists of three major stages. At first, it utilizes an improved Laplacian eigenmap algorithm (ILEA) to identify the coherent generators according to the real-time dynamic post-fault trajectories from WAMS. In order to reduce the searching space, it then utilizes the identification result from the first stage to build the minimum coherent generator virtual nodes and applies the KWP spectral partitioning algorithm to obtain the preliminary partitions and the separation surfaces. Considering the directions of the power flows on these surfaces, it adopts a variable neighborhood heuristic searching algorithm to refine the optimal separation surfaces, so that the net power imbalance of islands is minimized. At last, the bidirectional power flow tracking algorithm is used to determine the adjustments of the generators and/or loads within each island, and the PQ decomposition power flow analysis is utilized to verify the feasibility of the corrective controls.
This paper is organized as follows: Section 2 summarize the proposed integrated adaptive controlled islanding strategy; Section 3 introduces the constraints for controlled islanding; Section 4 presents the details of the strategy in three major stages; in Section 5, we test our approach on the New England 39-bus system and IEEE 118-bus system; and we conclude the paper in Section 6.
2. Summary of Integrated Adaptive Controlled Islanding Strategy
The proposed integrated adaptive controlled islanding strategy includes the following three stages:
- Stage I:
Identification of a coherent generator based on the ILEA:
The dynamic information of the post-fault power system is non-stationary and nonlinear. Generator rotor angle trajectories contain abundant real-time performance and transient information, which will reflect the approximate time-varying characteristics of the power system. Based on real-time dynamic behavior, the ILEA is proposed to identify the coherent generator groups, which is combined with the categorization information of generators in kernel space.
- Stage II:
Searching for the optimal separation surface and refining:
Two steps are included in this stage:
- Step (1):
searching for the dynamic balance graph-partition using the spectral partitioning algorithm. After the first stage, in order to further greatly reduce the searching space of the optimum islanding cut-set, a coherent generator virtual node has been constructed considering the network topology. It mainly aggregates these coherency generator groups and the corresponding buses into a large virtual node, so as to obtain the most simplified graph manipulated layer. Then, taking into account the ratio of the line active power and electrical distance as a new weight index, the spectral partitioning algorithm is applied to achieve the optimal partition of graph, which could minimize the active power imbalance.
- Step (2):
refining separation surfaces based on the variable neighborhood heuristic search algorithm (VNHSA): Because the basic requirement of controlled islanding is minimizing the net imbalance active power in each island and the spectral partitioning graph-partition is not necessarily the best solution, the critical key is searching the optimal separation surfaces using the VNHSA. Taking the spectral partitioning solution as a feasible initial solution, considering fully the network topology and the directions of the power flow, applying the concept of network node degree, the best optimal solution is obtained by using the variable neighborhood heuristic searching algorithm.
- Stage III:
corrective control within each island based on the bidirectional power flow tracing algorithm and PQ decomposition power flow verification:
For each island, the generator power and loads are not in balance. Therefore, load shedding or a generator tripping strategy are needed to maintain inner stability. Considering the transmission lines composed of separation surfaces, with the imbalanced power in each island, the bidirectional power flow tracking algorithm is utilized to determine the allocation of the generators or loads that needed to be adjusted and the preliminary controlled quantity. Then, the PQ decomposition power flow analysis is conducted to adjust the controlled quantity further, which can help each island to balance power and with synchronization.
The distinctive features of the proposed integrated controlled islanding strategy are as follows: (1) the identification of the coherent generators based on the WAMS post-fault trajectories makes the proposed strategy adapt automatically to different fault modes; (2) the variable neighborhood heuristic searching algorithm can refine the separation surfaces obtained by the KWP algorithm and make the net imbalance of the power of islands smaller; and (3) the bidirectional power flow tracking algorithm can help to find the post-fault equilibrium points of each island and calm down the islands as soon as possible.
3. Basic Requirements for Controlled Islanding
Controlled islanding is the last resort to prevent a widespread blackout in the power system under severe disturbance. The main purpose of controlled islanding is to split the original interconnected power network into several independent islands by disconnecting properly selected transmission lines. Therefore, a good controlled islanding strategy should separate asynchronous generator groups into different islands and maintain the power balance within each island. Accordingly, controlled islanding needs to consider the following three key issues: the identification of coherent generators under different fault modes, the optimal partition of the network with the least net imbalanced active power in each island and the stability of each island. We introduce these requirements in more detail as follows.
3.1. The Requirement of Generator Coherency
It has been observed in a multi-machine power system that in the aftermath of a sudden disturbance, some generators have the tendency to “swing” together. It is required that the generators that have similar swing curves should be clustered into one coherent group. For each group formed in this way, generators should have similar or the same rotor dynamic characteristics. To be specific, for any two generators, i and j, within a coherent generator group, it holds that:
3.2. The Requirement of Minimum Imbalanced Power
For modern interconnected power systems, the reactive power can be locally compensated for, so the balance of active power is the most important requirement for the correct operation of power systems. Power imbalance between generation and load can affect the stability of power systems. Therefore, one important requirement for an islanding strategy is to minimize the imbalance of active power within each island to facilitate power system restoration. Once islands are formed, the disconnected transmission lines are called the cut-set. The isolation will generate net imbalanced power in each island, which should be under control. To be specific, the formed islands should be able to preserve generation-load balance through generation control and/or load shedding in each island [19,20]:
3.3. The Stability of Islands
The stability of islands mainly includes the steady-state equilibrium and the transient stability After the implementation of controlled islanding, each island should reach the equilibrium point, which not only maintains active power balance to achieve the rated system frequency, but also guarantees the reactive power balance. Transient stability means that the generators within one island should maintain synchronization after network separation. The total active power of the generators and the total load within one island should be balanced to maintain the rated frequency, and the reactive power also should be balanced to maintain the rated voltage.
Besides, each island should satisfy the black start requirement, a process to recover from a total or partial shutdown of the transmission system without relying on the external electric power transmission networks. It is common that a hydro machine of large capacity is needed for a black start [21]. Each island also should have the proper voltage control capability to maintain a suitable voltage profile. Each island must be monitored by the control center for security checks and coordination. As it is hard to consider all the aspects, we ignore the black start requirement in this paper.
4. Methodology
4.1. Graph Model
To facilitate understanding, we introduce the basic graph model for the power networks. We call graph G(V, E, W) an undirected graph transformed from power system topology, where the sub-stations, generators, bus bars and loads are network nodes, and edges represent the transmission lines between the nodes. The graph consists of a set of nodes V = {v1, v2, … ,vn} and a set of edges E = {e1, e2, … ,em}. W is a set of edge weights. The weighted adjacency matrix of the network is the n x n matrix A(W) = [aij], where aij is the weight of the edge between nodes vi and vj. When vi and vj are connected through a branch, aij equals the absolute value of the active power of the branch. The weighted adjacency matrix is a symmetric matrix, and the diagonal elements of the adjacency matrix are zero.
A undirected graph is called a connected graph if there exits a path between any two nodes in the graph. If the elements in the i-th row of the adjacency matrix are all zeros, the network is disconnected. When the graph G = (V, E, W) is separated into k subgraphs, Gi = (Vi, Ei, Wi), i = 1,2, … , k, we require that V = ∪i=1,…,kVi and Vi ∩ Vj = Ø, i ≠ j. In the context of controlled islanding, we call each subgraph a power island. The edges between two power islands are called the separation surface of the two islands.
4.2. Stage I: Identification of Coherent Generators Based on WAMS and ILEA
WAMS is a new technology with rapid progress in recent years. Based on the real-time characteristics of synchronism measurement, WAMS can acquire real-time information regarding generators' rotor angles. We propose ILEA to identify coherent generators. ILEA is evolved from the conventional Laplacian Eigenmap algorithm (LEA), which was developed by Belkin and Niyogi in 2003, and is effective for the reduction of dimensionality of high-dimensional data [22]. Besides, it is useful for clustering and classification. We introduce LEA first.
4.2.1. LEA
Let X = {x1, x2, … , xn} denote the N initial data points in a high dimensional space, RH, where H denotes the dimension of the feature space. The high dimensional space is mapped into a low dimensional space of a dimension of h(<H), with the requirement that the points that are closed in the original feature space stay as close as possible in the mapped space. Let Y = {y1, y2, … , yn} denote the N data points in the mapped low dimensional space. The objective of LEA is to find such a mapping mechanism, M : X → Y, such that the above geometric characteristic in the original space is maintained in the mapped space. If we consider the distance between two points as the similarity measure of the points, LEA can find the optimal embedding by solving the generalized eigenvalue problem: Lf = λDf, where D is a diagonal weight matrix, Dii = Σj Aji, L = D − A is the Laplacian matrix and f and λ are the eigenvector and eigenvalue of the Laplacian matrix, respectively. Note that the Laplacian matrix is a symmetric, positive semi-definite matrix that can be regarded as an operator on functions defined on the graph. Suppose the feature vector is {y1, y2, … , yn} after embedding, where yi = (yi1, yi2, … , yih)T. The LEA algorithm is to solve the following optimization problem:
The constraint is to remove the arbitrary scaling factor in the embedding.
4.2.2. ILEA
The conventional LEA is an unsupervised manifold learning algorithm. Although it is efficient for projecting high-dimensional sample data to a low-dimensional space, it has pitfalls when applied directly in the coherency identification of generators, since sample data often do not satisfy the triangle inequality relationship if using the distance measure in Equation (4) directly. It is thus necessary to capture the diversity factor of sample data with respect to similarity and proximity. Based on the generators' rotor angle trajectories, we introduce new categorization information of generators to make the clustering more effective. In this paper, we work in the kernel space and propose ILEA in the kernel space coordinates. According to the Euclidean distance calculated with the new categorization information, we compute the nearest-neighbor points. With ILEA, the features can be successfully embedded to a low dimensional space.
The kernel space approach is a new method in pattern recognition and has been found to be very effective for nonlinear pattern analysis. The main idea of this method is to embed original sampling data into a feature space by certain nonlinear mapping and then apply learning methods in the new feature space. The original sample data, x, will be translated into ϕ(x) in the kernel space by nonlinear mapping ϕ, and we define the distance measurement, T(xi, xj), as the Euclidean distance between the points, ϕ(xi) and ϕ(xj), in the kernel space [23], i.e.,
Going further, in order to make the differentiation of coherent generators and non-coherent generators more pronounced, we introduce the concepts of the local measure and inter-area measure. The distance measure, t(xi, xj), in kernel space based on categorization information, which will be introduced below, is defined as:
In our context, we use the distance measure defined in Equation (6) to measure the distance of generators within the same inherent coherency group and otherwise use the measure defined in Equation (7) to measure the distance between generators not belonging to the same inherent coherency group. The former is called the local measure and the latter the inter-area measure. Note that based on formulas, for the same pair of nodes, their local distance measure is less than the inter-area distance measure.
We next introduce categorization information. To identify generators coherency, the ultimate manifestation is reflected in the oscillation modes in weakly-connected transmission, which is determined by the inherent characteristics and external factors. The inherent characteristics mainly include the topology of the network, inertia constants and damping constants, and so on, while the external factors consist of the fault type, position and duration time. The categorization information of generators means the inherent grouping modes. On the basis of slow coherency theory [5], we can obtain the natural oscillation mode in an interconnected power system, which divides all the generators into some inherent coherency groups. Therefore, the categorization information of generators can be determined by the grouping consequence, which has significant influences on the identification of coherent generators under different operating conditions.
According to the real-time dynamic post-fault behavior, ILEA takes into account both the strengths of the distance measure in the kernel space and the categorization information of generators based on slow coherency grouping theory. Using the kernel space coordinates and the Euclidean distance of categorization information in the kernel space, we can compute the nearest-neighbor points and construct the graph weight matrix of generators with the core kernel function. After the features are successfully embedded into a low dimensional space, we can then apply LEA to obtain the grouping results.
4.3. Stage II: Searching of the Optimal Separation Surfaces and Refining
Two steps are included in this stage: (1) KWP spectral partitioning with virtual nodes; and (2) refining the separation surface by VNHSA.
4.3.1. KWP Spectral Partitioning with Virtual Nodes
Islanding should be performed in real time, and as such, it requires high computational efficiency. We adopt the KWP spectral partitioning algorithm, which is a fast and effective graph partitioning algorithm. To speed up processing, we introduce the concept of virtual nodes to aggregate coherent generator groups, such that the complicated network structure of the power system could be mostly simplified. We also set the edge weight of the graph with a novel index on the transmission lines.
4.3.2. Aggregation of Coherency Generator Groups
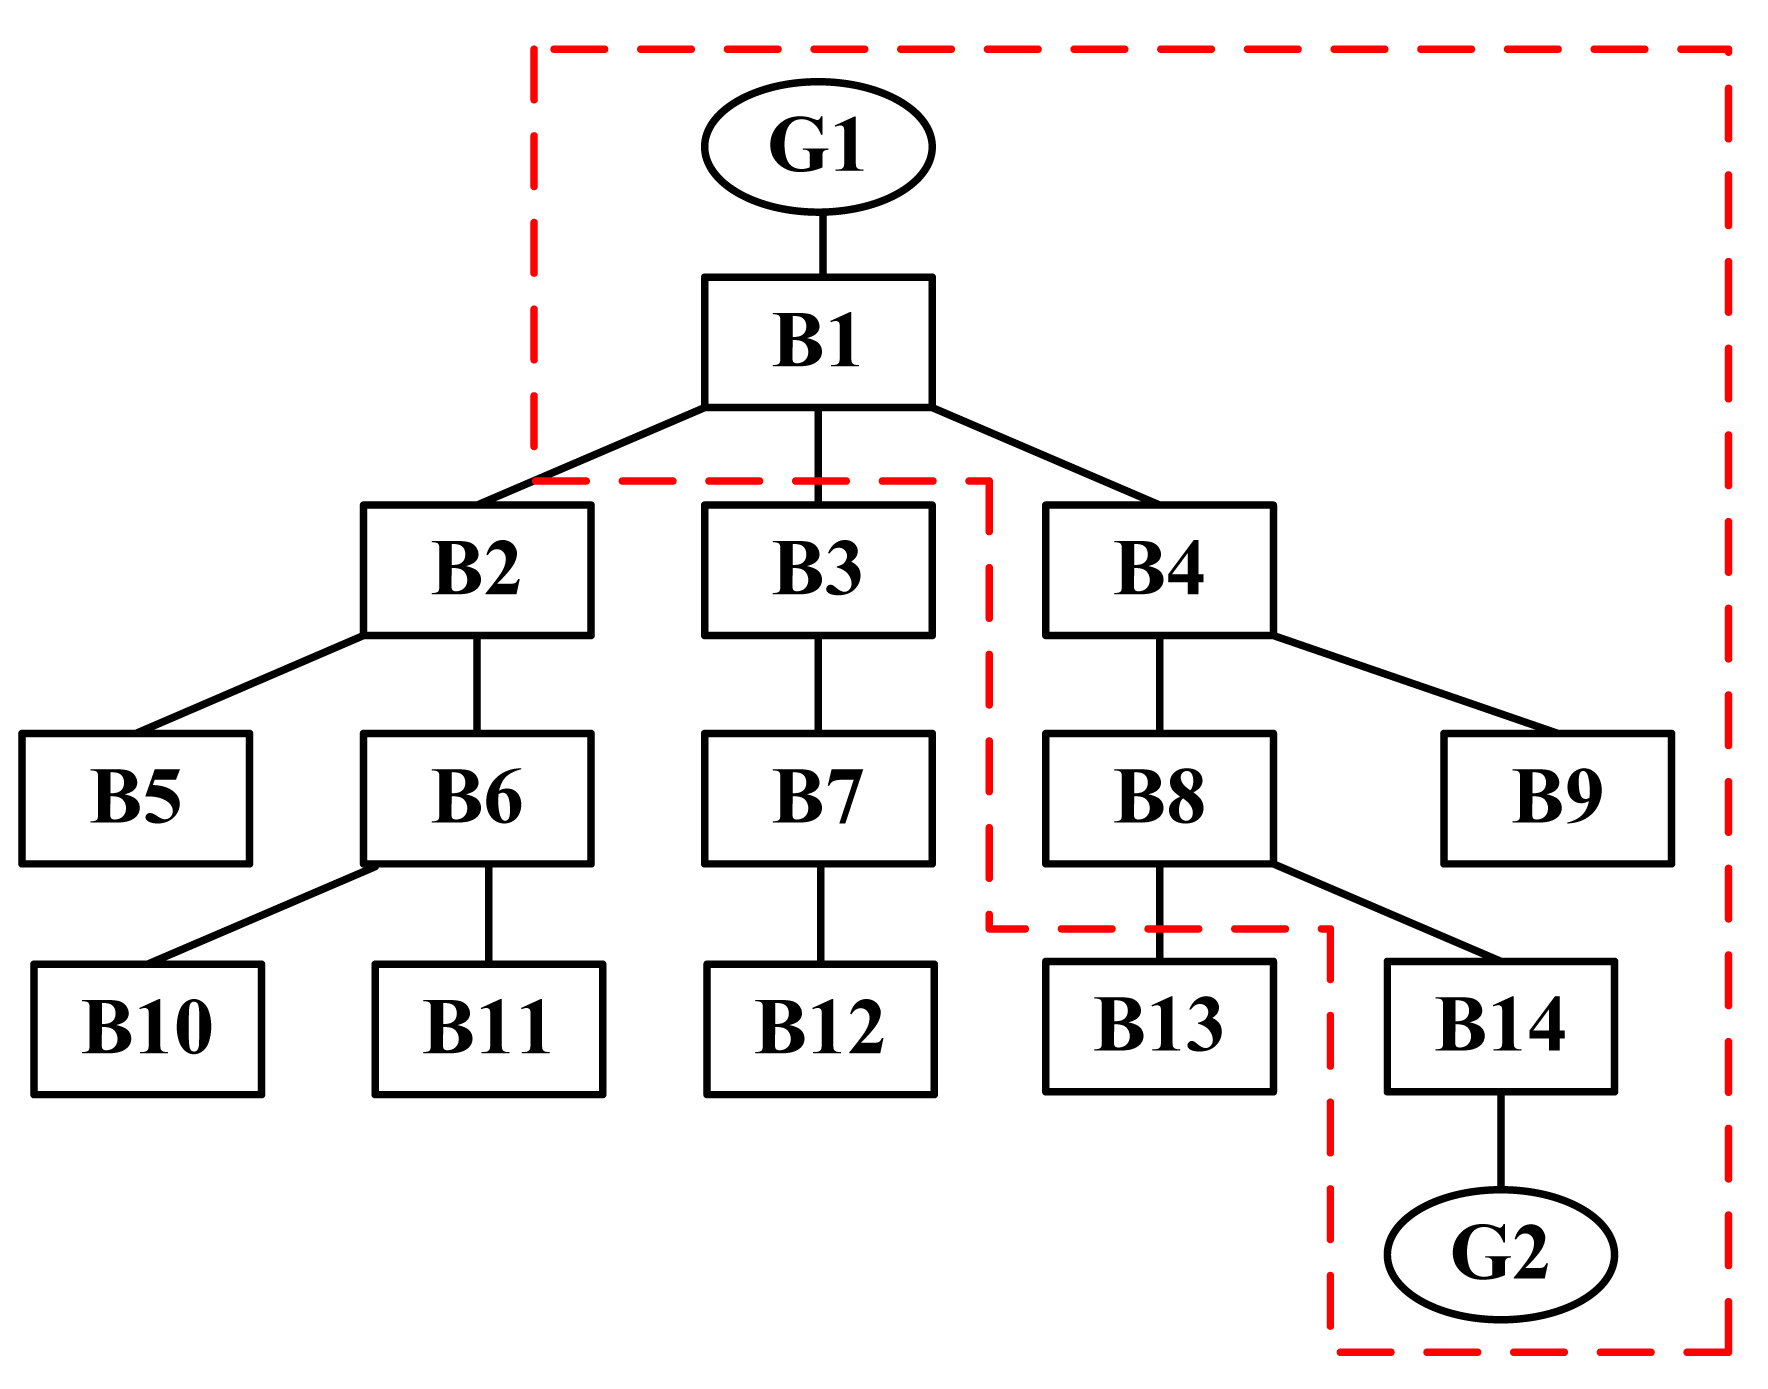
When severe contingency occurs in a power system, according to the real-time dynamic post-fault behaviors provided by PMU, generators can be clustered into coherent groups. Generators within one coherent group have the tendency to swing together. Based on the post-fault real-time information regarding rotors' swing angles, we can identify the generators that have the same or similar oscillation mode. As the basic requirement of controlled islanding, the coherent generators should be in the same island to maintain stability. Therefore, we propose to use a virtual node to replace coherent generators and their corresponding buses, and these virtual nodes cannot be split in the subsequent search for the separation surfaces. To create virtual nodes, we apply the Dijkstra's shortest path algorithm to obtain the minimum number of virtual nodes. Dijkstra's algorithm is to search for the shortest path from a source node to other nodes in a graph with non-negative edge values. To better understand our method, we first introduce some new concepts, including associated nodes of coherent generators, non-associated nodes of coherent generators and the minimum multi-branch tree cut-set of coherent generators:
Associated nodes of coherent generators: There is a shortest path from a generator node to other coherent generator nodes in the same coherent group. All nodes along the path are called associated nodes of the coherent generators. In addition, if the removal of the shortest path results in an isolated bus node (i.e., the bus has no connection to any generator), this isolated bus node should also be counted as an associated node.
Non-associated nodes of coherent generators: In contrast, any node that does not belong to the associated nodes of a coherent generator group is called from the non-associated nodes of the coherent generators.
Minimum multi-branch tree cut-set of coherent generators: We can build the structure tree based on the distribution of the generators and then transfer this tree into the structure of a multi-branch tree. Taking one generator in a coherent generator group as the start point and using Dijkstra's algorithm, we can obtain the minimum cut-set by cutting along the edges of the non-associated nodes of coherent generators.
We use Figure 1 as an example to illustrate the above concepts. In the figure, a circular node represents a generator node and a rectangular node represents a bus node. Assume that the generators, G1 and G2, are coherent generators, the nodes enclosed by red dashed lines are the associated nodes. Note that B9 is also an associated node, because the removal of the path, G1-B1-B4-B8-B14-G2, results in the isolation of B9. The other nodes are called non-associated nodes. Furthermore, the minimum multi-branch tree cut-set of the coherent generators can be obtained with Dijkstra's algorithm, which includes the lines crossing the red dashed boundary, i.e., (B1-B2, B1-B3, B8-B13). We can then use a virtual node enclosed by the red dashed lines to represent the coherent generators and their associated bus nodes.
In this way, we can greatly reduce the searching space for optimal separation surfaces. In addition, the virtual coherent nodes can ensure that the coherent generators are in the same island, to easily maintain the stability of each island after implementing the controlled islanding strategy.
4.3.3. Spectral Partitioning Algorithm
With controlled islanding, the power system network is split into self-sustained subsystems after severe cascading failures. It is important to take into account the stability constraints, especially the balance of power generation and load in each island. The proposed graph partitioning algorithm is based on the graph spectral partitioning technique. The purpose of this algorithm is to separate the whole network graph into several independent sub-graphs satisfying certain constraints. It is well suited for controlled islanding when searching for the optimal separation surfaces. The main idea of the spectral partitioning algorithm is to divide the power system network into disjoint islands, based on the global information available in the eigenvectors and, in the meantime, to minimize the imbalance between power generation and the load in each island.
To better understand the KWP algorithm, we need to explain several basic concepts first. Given an undirected edge-weighted graph G = (V, E, W), the Laplacian matrix, L, of graph G can be constructed by its adjacency matrix, A, and its diagonal degree matrix, D, L = D − A. In the spectral partitioning algorithm, the set of edge weights of G is an important index. It could directly influence the result of the optimal separation surfaces. In order to get a reasonable partition solution, we introduce a new weight index of an edge, |PG|/x, where |PG| represents the absolute value of the active power and x represents the value of line reactance. The new weight index takes into account the absolute value of the active power and the electrical distance of the line, which represents the closeness of the two adjacent nodes. The greater the active power or the smaller the line reactance, the closer the two nodes.
A k-way partition of the vertices of G, U = [U1, U2, … , Uk], is represented by an n x k matrix [uih] where:
Equivalently, a k-way partition of the vertices of G, U = [U1, U2, … , Uk], can also be represented by the n x n partition matrix, P = [pij], where:
We call U the assignment matrix and P the partition matrix. For a given partition U = [U1, U2, … , Uk], we have P = UUT.
A k-way partition of the vertices of G, U = [U1, U2, … , Uk], can also be represented by the n x k ratioed assignment matrix, Û = [ûij], where:
The relation between the KWP spectral algorithm and islanding separation is explained by the following theorem [11].
Theorem 1
The sum of the smallest k eigenvalues of Laplacian matrix, L, of a weighted graph, G, is a lower bound of for any KWP spectral of G, i.e.,
An eigenvalue and its corresponding eigenvector can be obtained by the KWP spectral partitioning algorithm. These k eigenvectors provide a way to partition the graph's n vertices into k subgroups. We further consider the problem of partitioning a power system network into k islands with minimized net imbalanced power in each island. The detailed steps are given as follows.
Calculate the k smallest eigenvalues λ1, λ2, … , λk of Laplacian matrix, L. Compute the k real eigenvectors, x1, x2, … , xk, associated with λ1, λ2, … , λk, respectively. The number of k can be determined by the multiple time scale principle. Arrange all the eigenvalues by their absolute values ordered from the smallest to the largest, denoted by |λ1|, |λ2|, … , |λn| without loss of generality. Then, the value of k can be determined with:
Construct the ratioed assignment matrix, Û, from the first k eigenvectors of L. The ratioed assignment matrix, Û, can be approximated with the first k eigenvectors X = [x1, x2, … , xk] after normalization. If X is an approximation of Û, then an approximation to P̂ is Z = XXT, because P̂ = ÛÛT. Each zij element in Z is the dot product of the i-th and the j-th rows of X. If , then . Since recognizing partitions from an approximation to P rather than P̂ is eaiser, we need to construct the partition matrix, P. To this end, by exploring the relationship between P and P̂, we have [24]:
which is the cosine of the angle between these two row vectors, i and j, of matrix X. It provides a measure of how close these two vertices are to each other.Select k vertices to serve as the k seeds of the k partitioned areas; and classify the remaining n − k vertices into these areas, and obtain the k partitions. We thus obtain the separation surfaces.
4.3.4. Refining the Separation Surface by VNHSA
The variable neighborhood search (VNS) algorithm developed by Mladenović and Hansen [25] is based on a systematic change of neighborhood within a local search algorithm. Given a local search algorithm, the main purpose of using VNS is to avoid being trapped in local optima. To achieve this, VNS explores increasingly distant neighborhoods of the current best solution and jumps from there to a new solution if and only if an improvement can be made.
To begin with, VNS needs to initially determine a set of neighborhood structures, Nm, m = 1, 2, …, mmax, which will be used in the search. It starts with a given initial solution and adopts a shaking-searching-moving process to search for the optimum solution. The basic steps of VNS are illustrated in Algorithm 1, in which we use a quite general description. We will further discuss how VNS is implemented and improved in VNHSA.
The VNS algorithm cannot be applied directly to solve the controlled islanding problem. We need to: (1) construct a suitable initial solution; and (2) define the neighborhood structure in our application context and quickly check whether a new solution is better than the existing one. We address the above problems as follows.
(1) Initial Solution Generation
The objective of electric power network partitioning is to maintain the active power balance between generation and the load in each island. This means that we should form islands with sufficient generation to supply all the loads. In order to search for the optimum partition solution that minimizes the net imbalanced power of islands, we need to consider the directions of the active power near the separation surfaces. Nevertheless, the new edge weight index used in the spectral partitioning algorithm (i.e., |PG|/x, where |PG| represents the absolute value of the active power and x represents the value of line reactance) does not take into account the directions of the active power. Despite this pitfall, the result obtained from the spectral partitioning algorithm could be a suitable initial solution.
| Algorithm 1 VNS. |
| Initialize the set of neighborhood structures Nm, m = 1, 2, … , mmax, where Nm(x) denotes the m-th neighborhood of x; |
| Determine a stopping condition; |
| Find an initial solution, x; |
| while (the given stopping condition is not met) do |
| m = 1; |
| repeat |
| Shaking:Generate a point x′ randomly from the m-th neighborhood of x(x′ ∈ Nm(x)); |
| Local search:Find the local optimum (with any local search algorithm, e.g., gradient descent) |
| with x′ as the initial solution; |
| if (the local optimum results in a better global solution) then |
| Moving:x = x′; |
| continue the same search (i.e., m = 1); |
| else |
| m = m + 1; |
| end if |
| until (m == mmax) |
| end while |
(2) Heuristic Neighborhood Search Space
Under our application context, we need to define how the neighborhood search space, Nm, m = 1, 2, … , mmax, should be constructed. First of all, we introduce some conceptions to ease understanding.
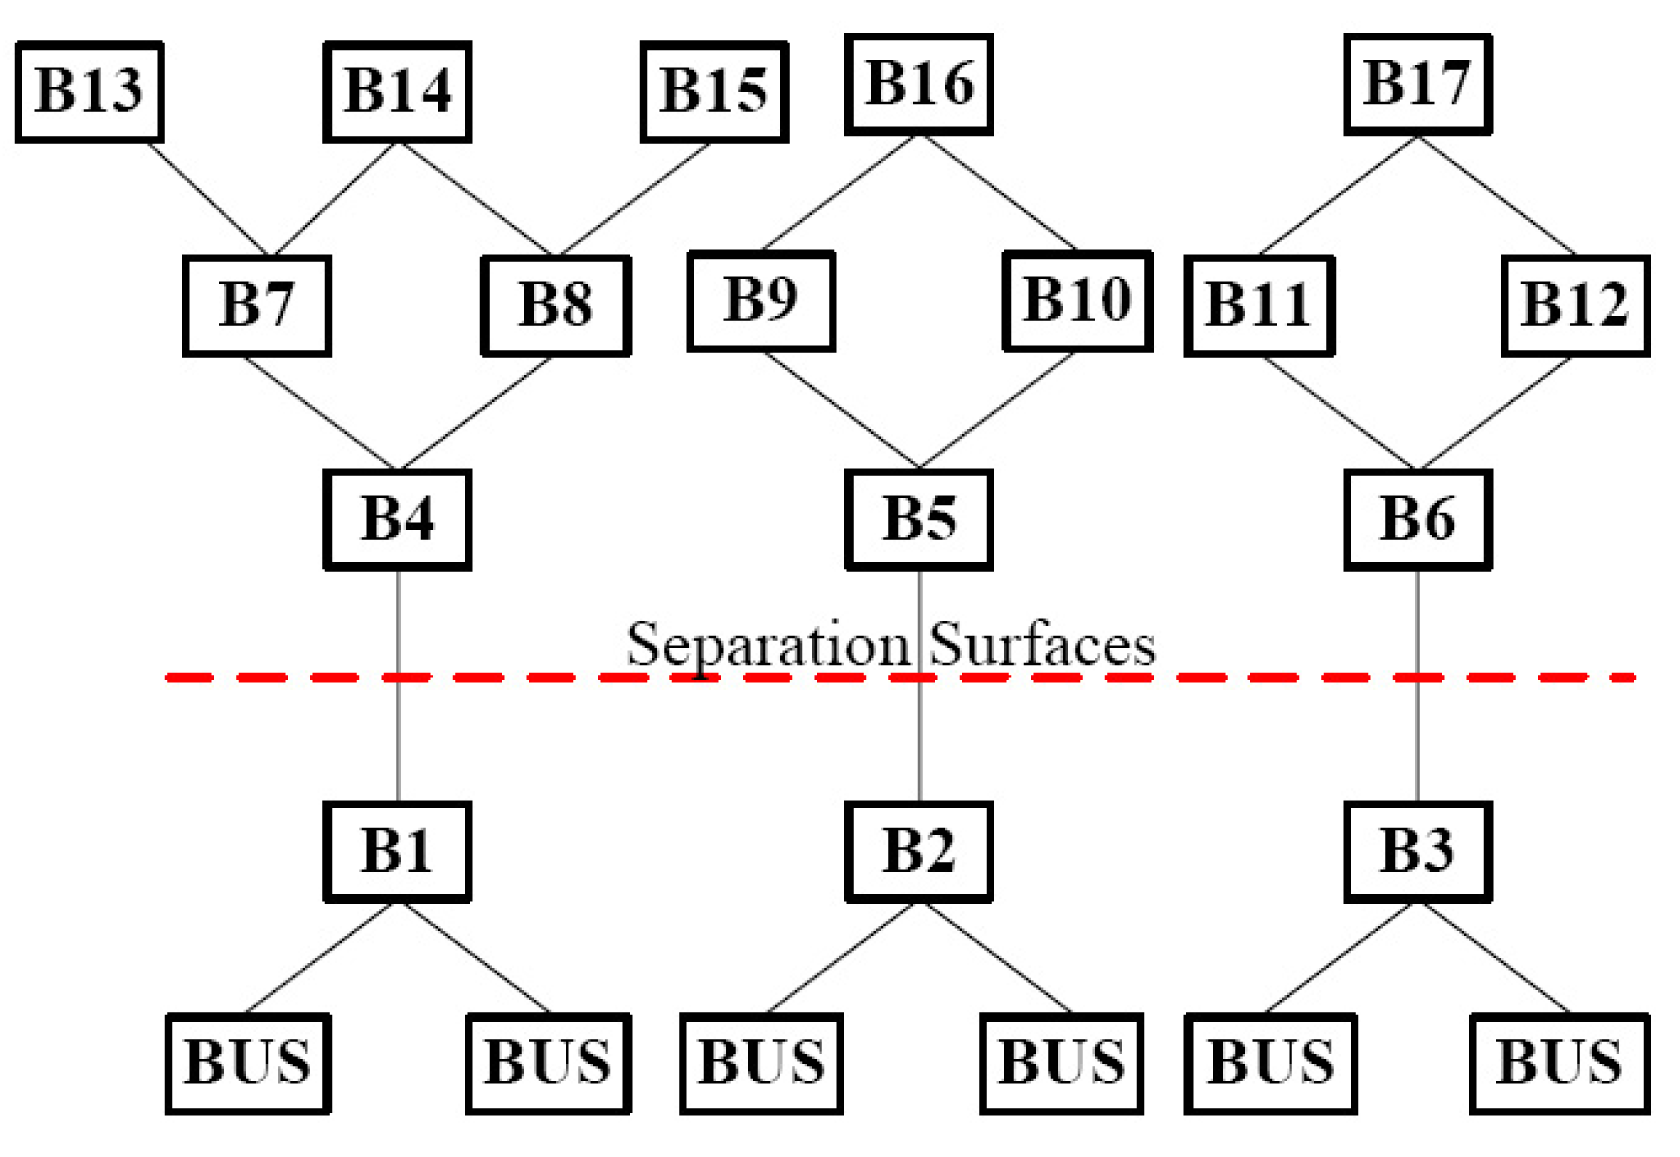
Disconnected line: When controlled islanding is implemented, it is necessary to disconnect some lines to form islands. A disconnected line is called a fault line. It corresponds to a point, x, illustrated in Algorithm 1.
Distance: The lines that directly connect to a fault line via a bus node are called distance-one lines to the fault lines; the lines that connect directly to a distance-one line via a bus node are called distance-two lines to the fault lines, and so on. Corresponding to Nm in Algorithm 1, the lines with a distance no larger than m to a fault line together form the m-th neighborhood set of the fault line.
As an example shown in Figure 2, the rectangle symbol represents the bus node, and the red dotted line indicates a cut. In this example, (B1-B4), (B2-B5) and (B3-B6) are three fault lines. For fault line (B1-B4), the distance-one lines include (B4-B7) and (B4-B8), the distance-two lines include (B7-B13), (B7-B14), (B8-B14) and (B8-B15). For the current separation surfaces (B1-B4, B2-B5, B3-B6), if we fix (B2-B5, B3-B6), the neighborhood structure of (B1-B4) includes: (B4-B7, B4-B8),(B7-B13, B7-B14, B4-B8), (B4-B7, B8-B14, B8-B15) and (B7-B13, B7-B14, B8-B14, B8-B15). We also need to check whether one solution is better than the other. For the comparison, we consider the directions of active power flows in the calculation of the net imbalanced power of islands.
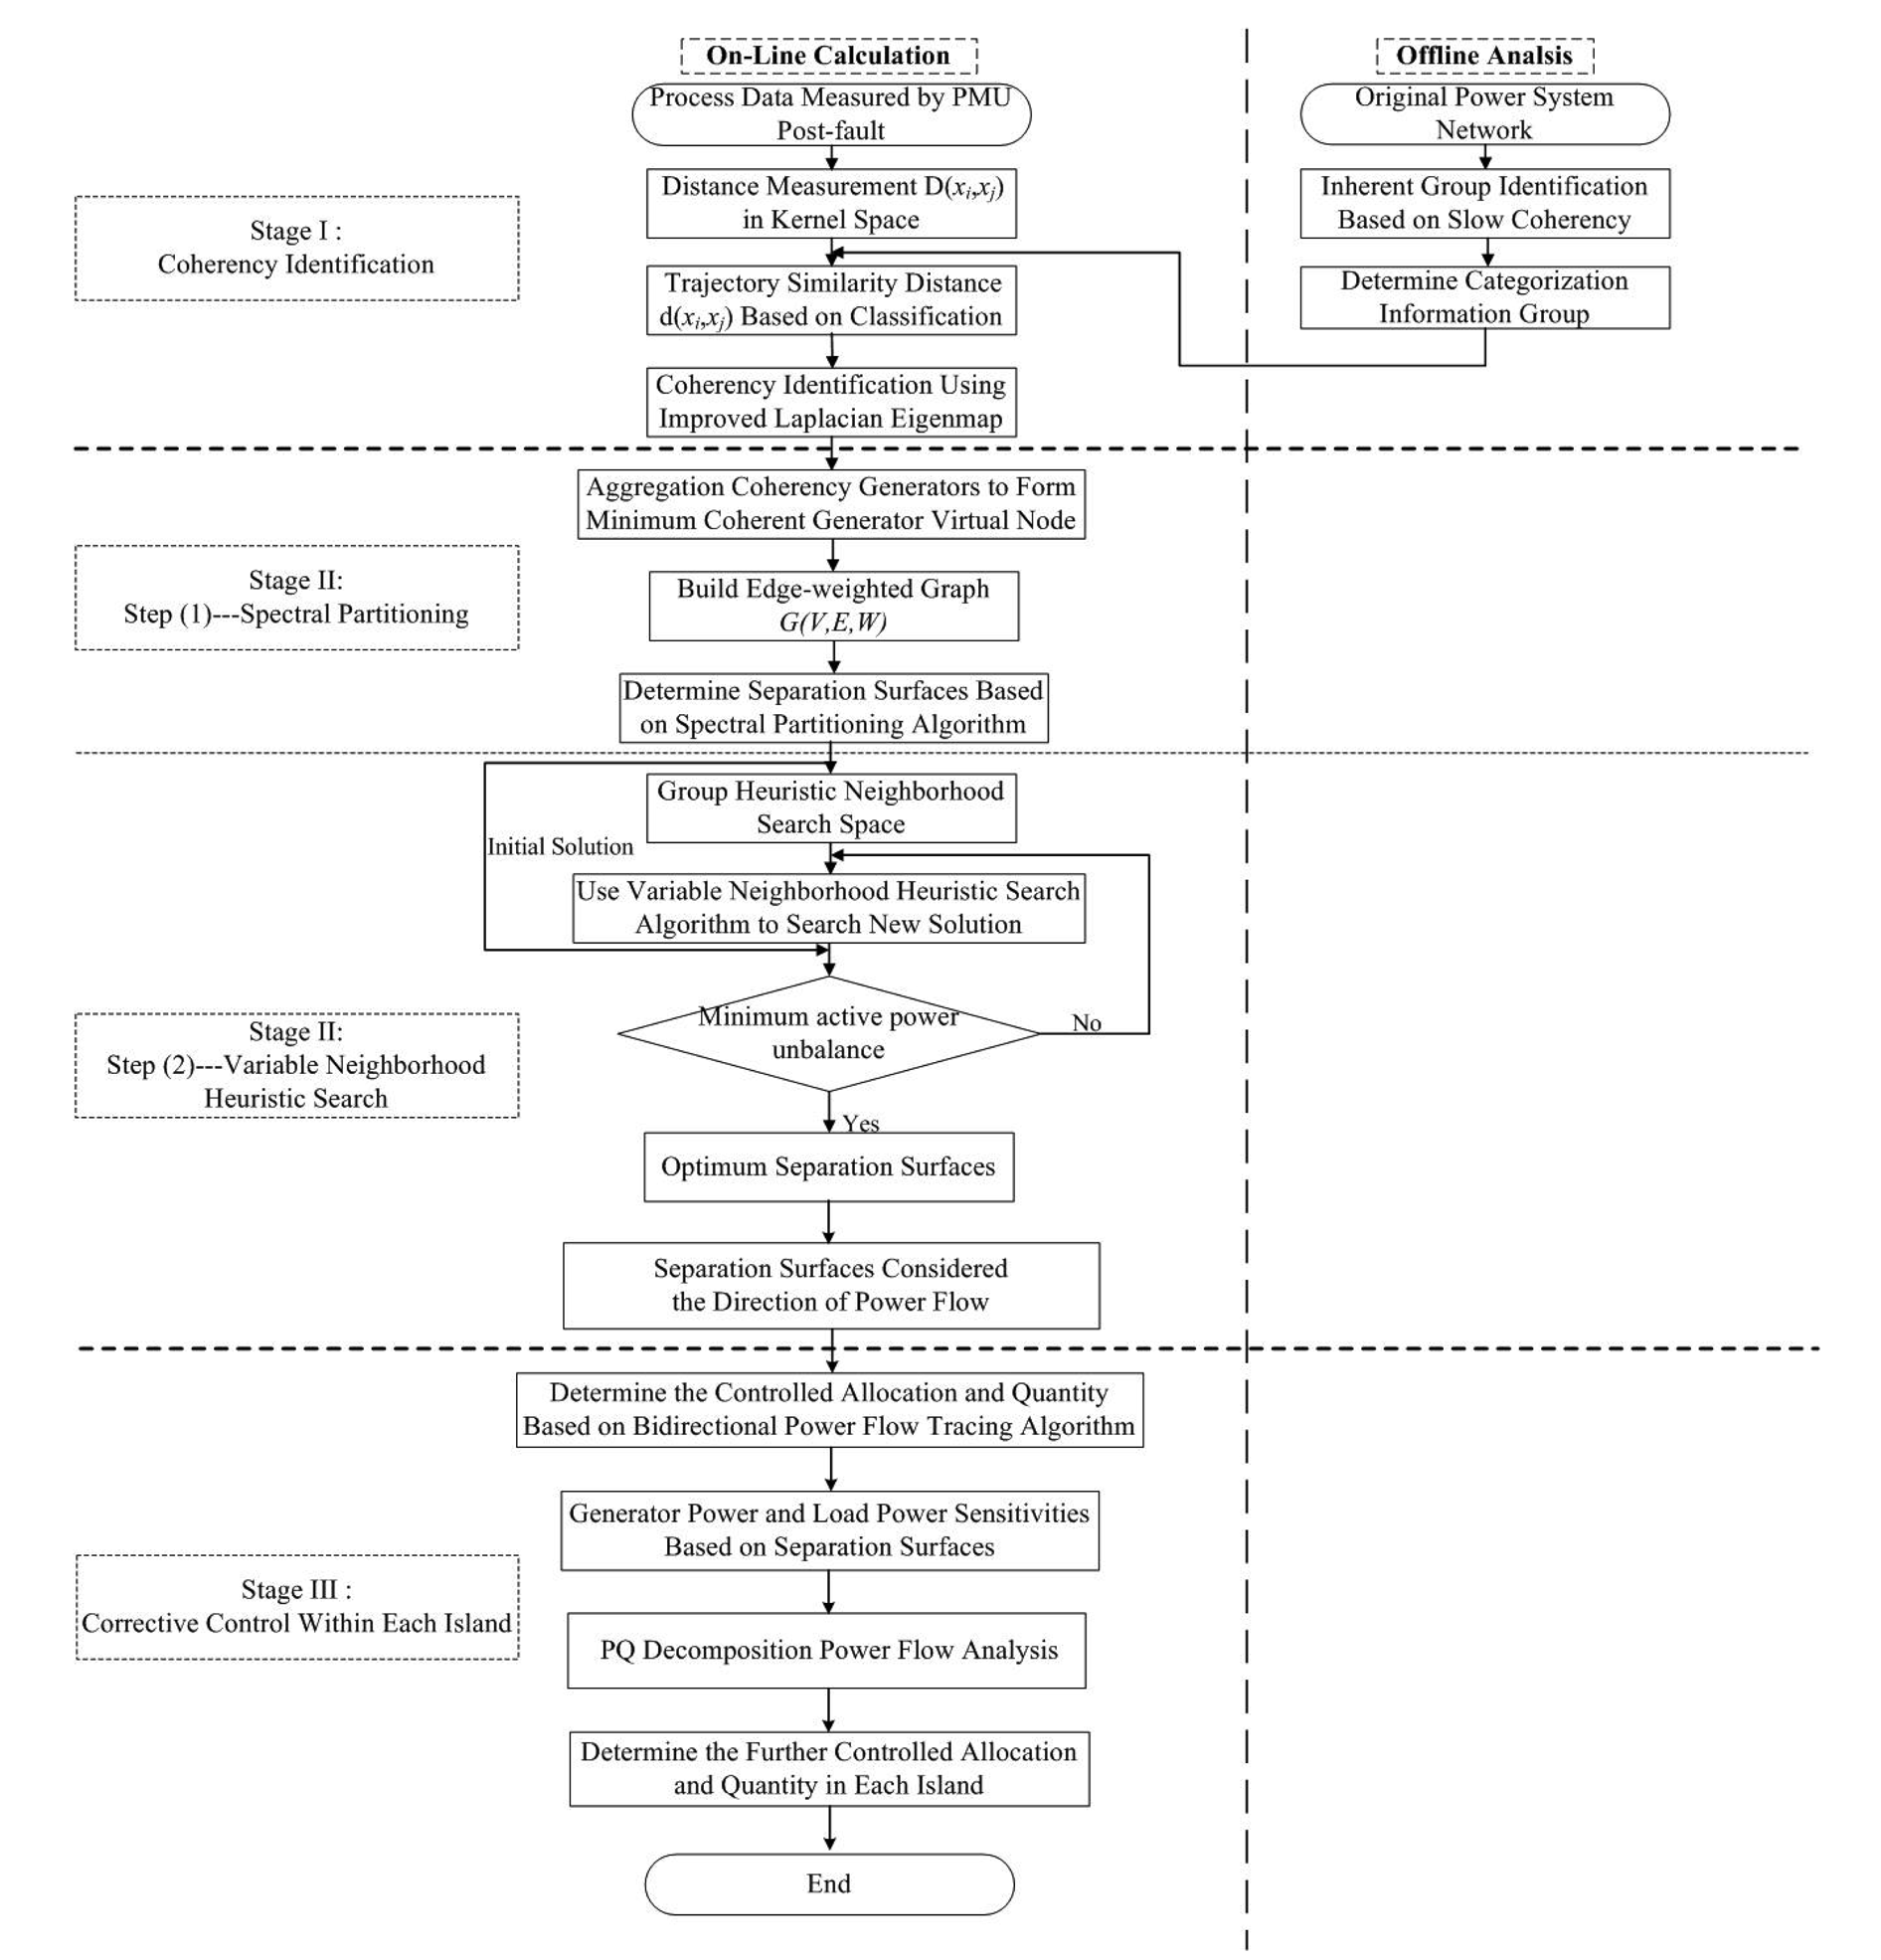
Finally, with all the ingredients introduced, we illustrate the flow chart of our adaptive controlled islanding strategy in Figure 3. As described above, the process includes the three major steps in succession: coherency identification, spectral partitioning and variable neighborhood heuristic search. Note that in the process of identifying coherent generators, categorization information based on offline analysis is injected to help the online calculation.
The flow chart for the proposed algorithm is given in Figure 3.
4.4. Stage III: Corrective Control within Each Island
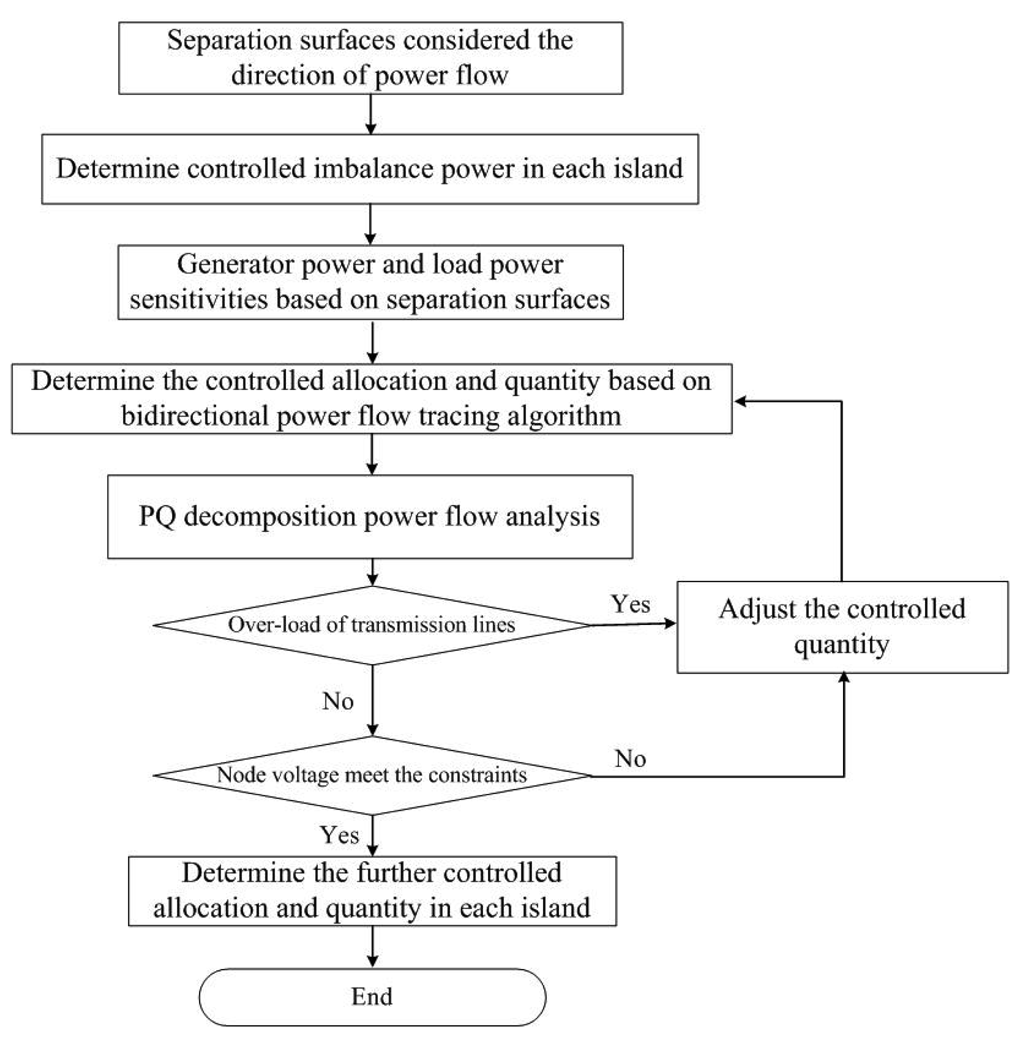
After the implementation of controlled islanding, the separation surfaces split the whole system into two or more power islands; considering the net imbalanced power of islands is minimized and that all generators in each island are synchronized, but that the formed islands need to be adjusted to ensure the power balance, which needs load shedding or generator tripping to maintain island stability. Furthermore, the island corrective control strategy should determine the controlled allocation and quantity quickly and accurately. For the island with more generation power, it is necessary to use the generator tripping approach.Additionally, for the island with more loads, the load shedding approach is utilized to mitigate the impact of the power imbalance. This paper proposes the bidirectional power flow tracing algorithm to determine the controlled allocation and preliminary controlled quantity. In order to avoid over-load on the transmission lines and the node voltages being out-of-limits, the PQ decomposition power flow analysis is utilized to verify the feasibility of the inner island corrective control and to determine the further adjusted quantity.
It should be pointed out that power flow tracing algorithms are generally based on the proportional sharing principle, and the detailed algorithm process is shown as in the literatures [26,27]. Combined with the searching of separation surfaces, the corresponding load shedding and generation tripping can be gotten and the imbalance power allocated to the load and generator buses. Considering the direction of active power flow, each line on the separation surfaces has an active power direction with respect to the formed islands. Therefore, according to the imbalance power in each island, the power flow tracing algorithm is applied to each line on the separation surfaces, including upstream tracing and downstream tracing, to determine the controlled allocation. For the island with the greater load, the load shedding method is implemented to mitigate the imbalanced power. Downstream power flow tracing is utilized for the separation surfaces to the load buses. The allocation can be determined. Similarly, for the island with the greater power generation, the generation tripping approach is used to maintain the power balance. Upstream power flow tracing is used to determine which generators should be controlled.
Furthermore, in order to avoid the over-load of transmission lines and the node voltages being out-of-limit, the PQ decomposition power flow analysis is a better and fast method to adjust the controlled quantity. Taking the result of power flow tracing as the initial value for the corrective controls, if one transmission line is over-loaded, the nearest upstream generator and the downstream load should be adjusted more; so does the out-of-limit voltages on the node, until the power is balanced, and without being over-loaded on the transmission lines and out-of-limits on node voltages, the final corrective controls within each island are achieved. The flow chart for the corrective control within islands is shown in Figure 4.
5. Performance Evaluation
In order to demonstrate the effectiveness and feasibility of our proposed controlled islanding strategy, we test it with the New England 39-bus and the IEEE 118-bus test systems. We perform a simulation with the Power System Analysis Software Package (PSASP) to obtain the generators' rotor angle dynamic trajectory information. For comparison, we compare our results with those from one of the state-of-the-art solutions, OBDD [13].
Since the OBDD method aims at solving the non-deterministic polynomial (NP) hard problem, which is capable of searching the entire space and finding all possible solutions, the controlled islanding strategy proposed in this paper, the graph model, considers the absolute values of line flows and electrical distance; it is a polynomial (P) problem to solve the separation surfaces solution. Then, based on the preliminary analysis , we consider the direction of power flow and propose the variable neighborhood heuristic searching algorithm to search the enhanced separation surfaces, which is for solving the NP problem. This method can improve the initial solution, so that the total amount of imbalanced active power could be further reduced. In this way, this method not only provides good static and dynamic stability performance, but also helps the self-healing control for the partitioned islands. We present the environment and assumptions for comparing their approach with the OBDD approach. When OBDD finds an acceptable solution, the searching process will stop, to save time. This searching approach proposed in this paper is proven to be feasible compared with the OBDD method. The results of controlled islanding strategy apply to test cases.
5.1. Results with the New England 39-Bus System
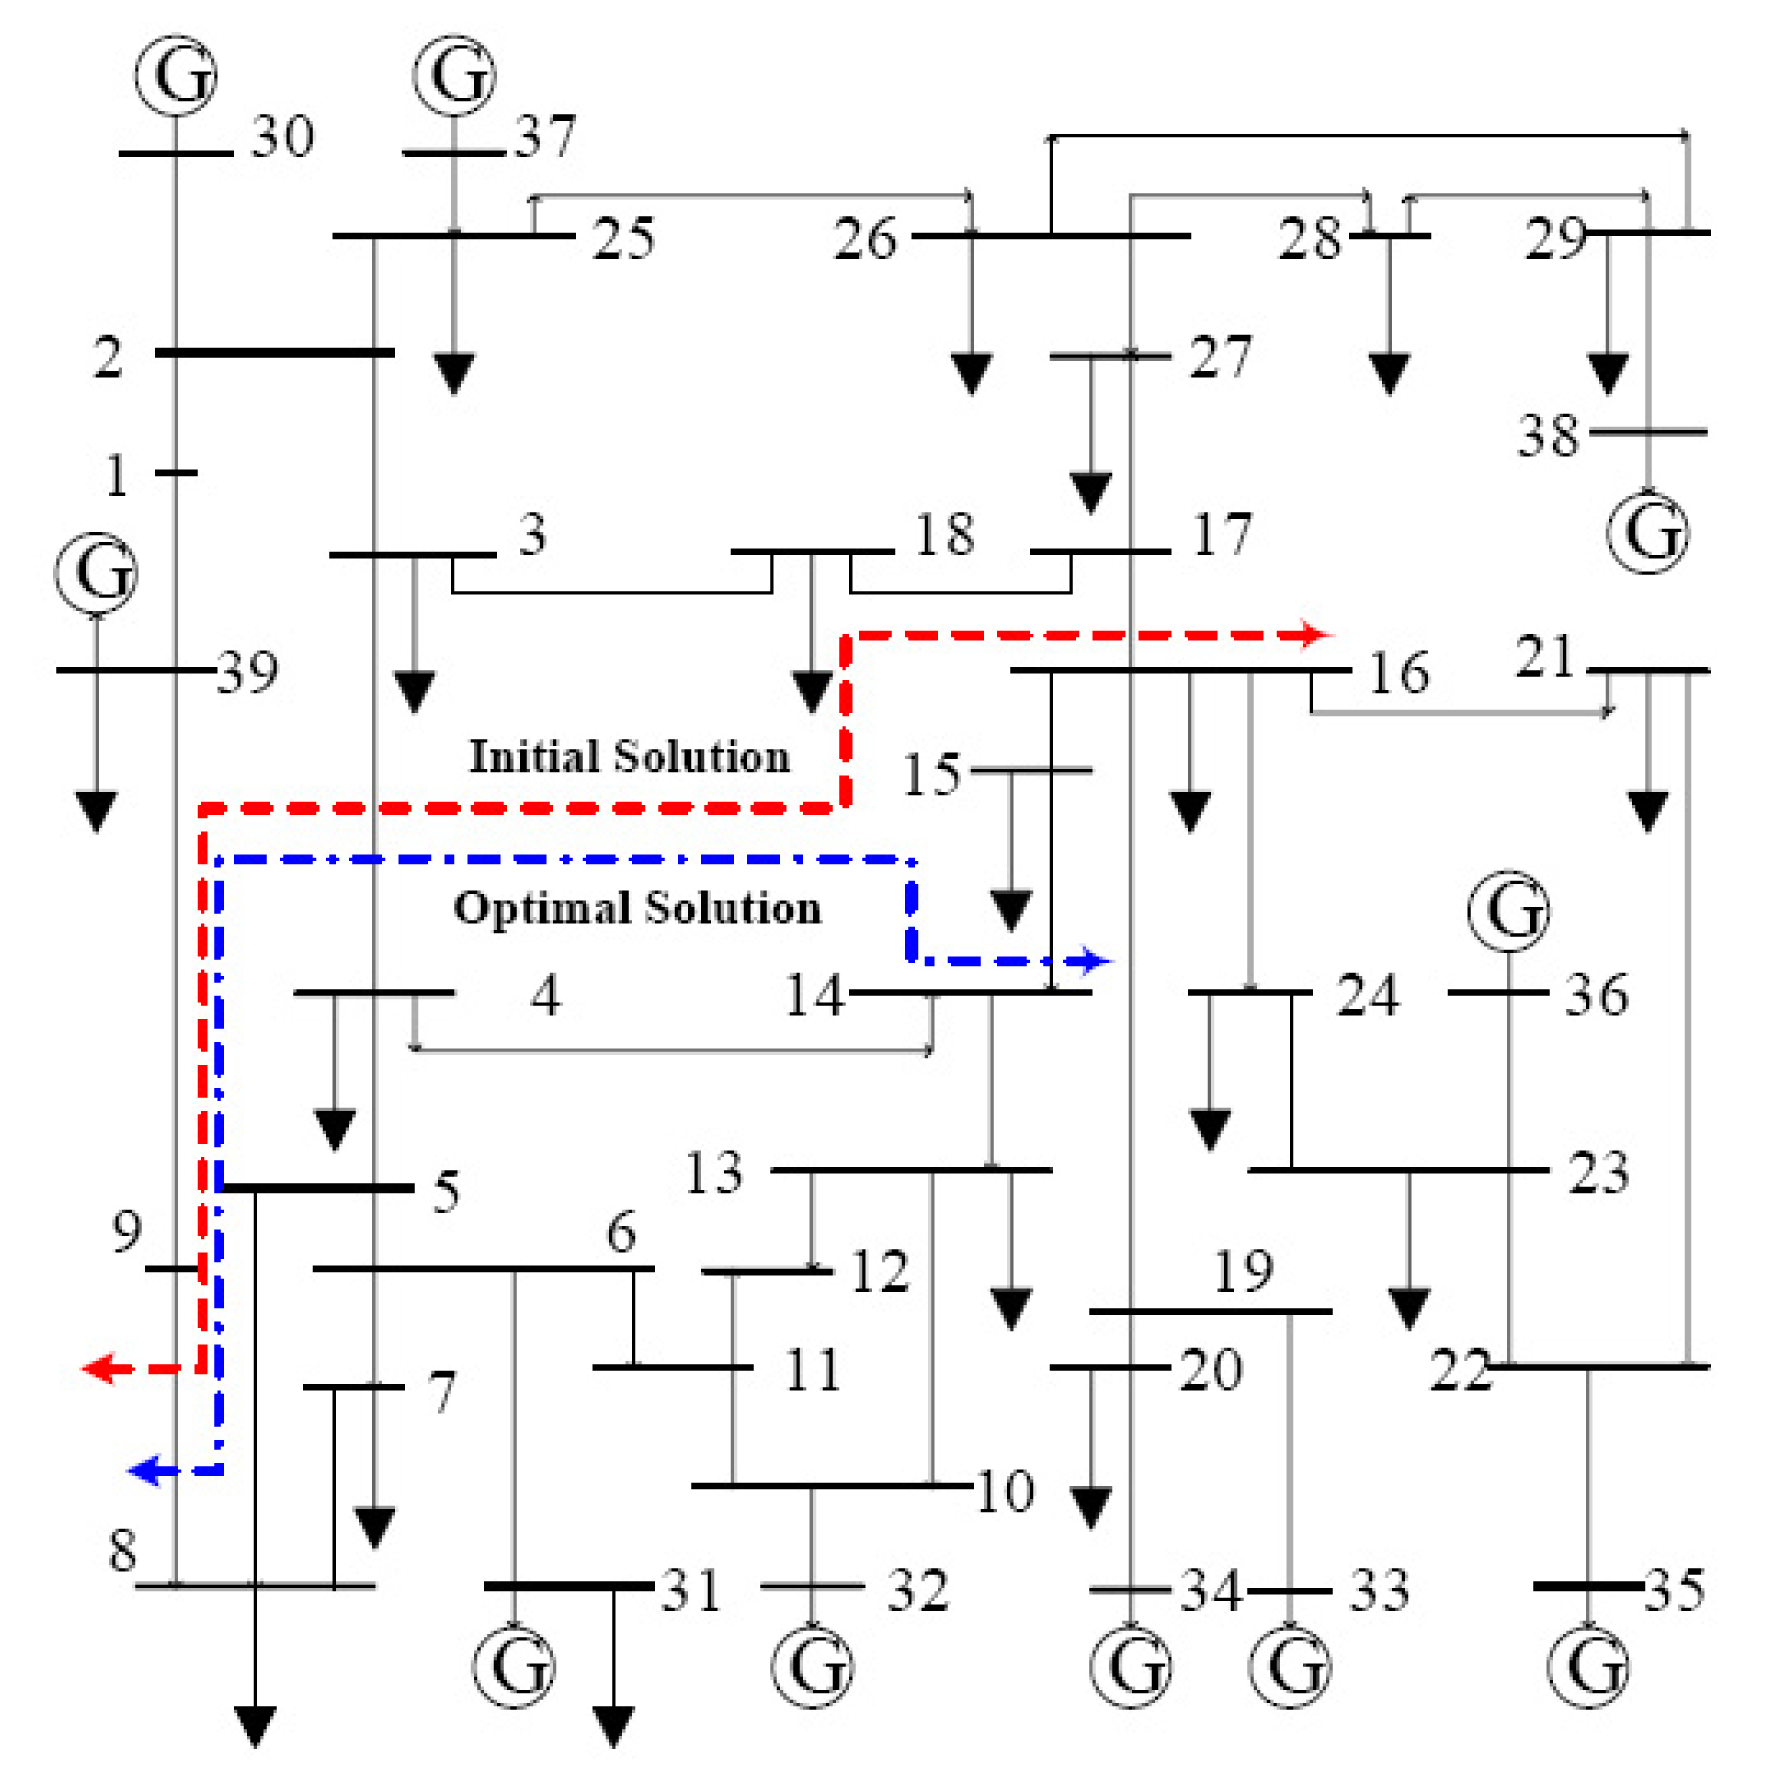
The configuration of the New England 39-bus system is shown in Figure 5. It includes 10 generators with a total generation of 6192.84 MW and 19 loads of 6150.5 MW in total. In the case study, we consider Line 6–7 with a three-phase fault near Bus 6, and the fault duration is 0.50 s, which would lead to transient instability. In order to effectively monitor the rotor angle dynamic behavior following the disturbance, we typically need to collect data within a one-second time window. Following the recent IEEE standard for synchrophasor measurements for power systems, the sampling rate is set to 60 Hz.
5.1.1. Slow Coherency-Based Generator Grouping
Based on the power network topology and the configuration, it is critical to identify inherent groups of generators by slow coherency theory under stable operation conditions. The grouping result will be used as the categorization information in the improved kernel space-based LEA. In this test case, with the slow coherency grouping algorithm, we calculate the eigenvalues of the state matrix to determine the slow mode. According to the expression of time scale, it is recognized that the optimum inherent grouping number is three, i.e., (30, 37, 38), (31, 32, 39), (33, 34, 35, 36), respectively. The groups are shown in Table 1.
5.1.2. Coherency Identification Based on ILEA
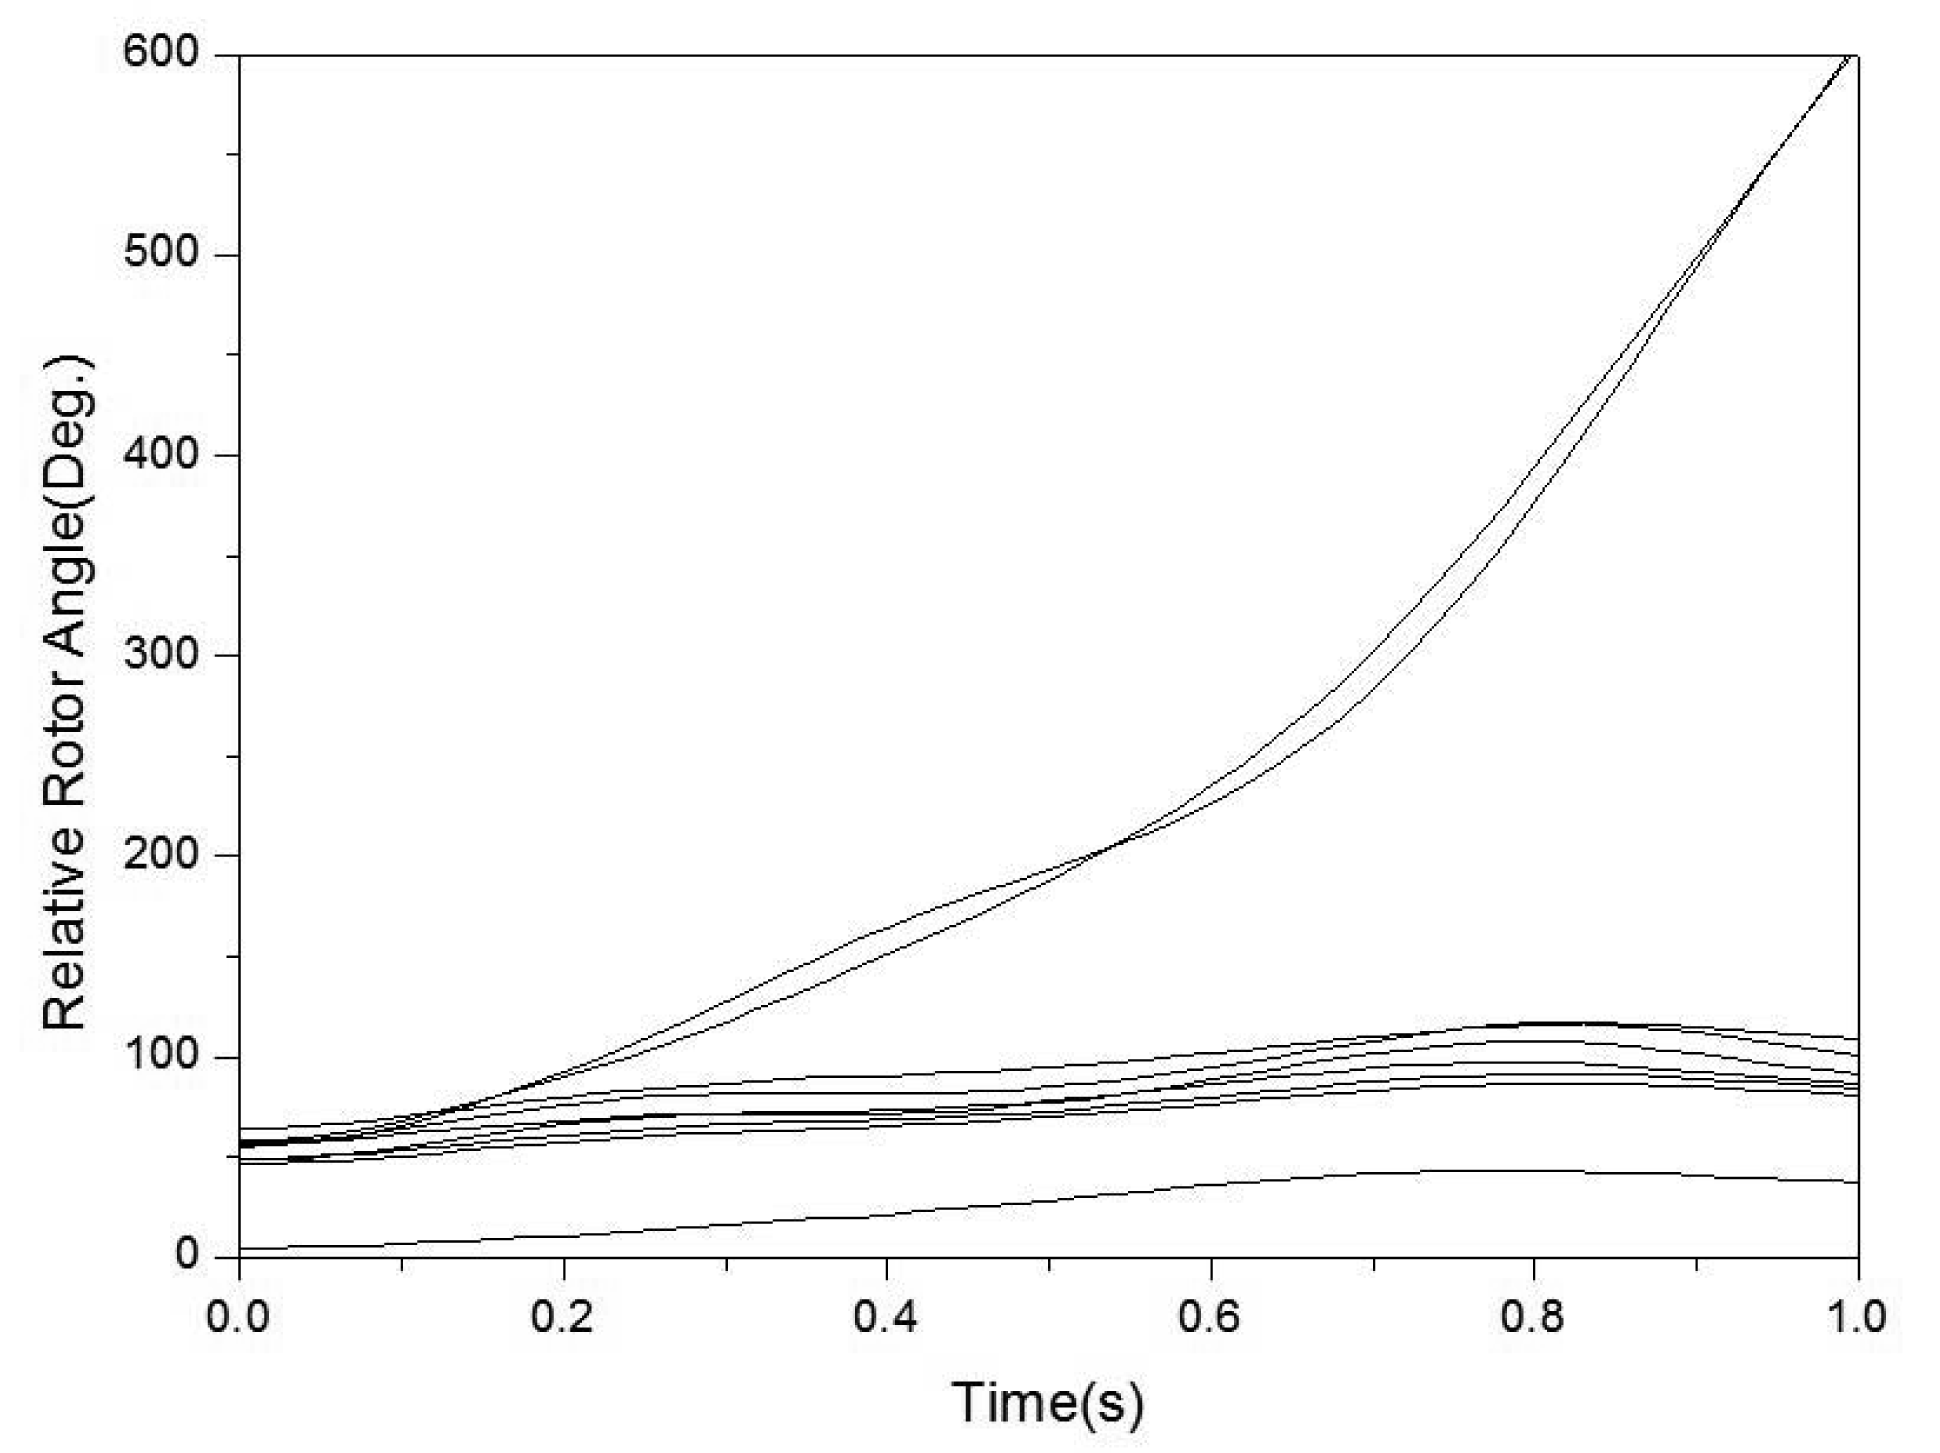
As shown from the post-fault rotor trajectories measured by WAMS in Figure 6, the relative rotor angles of two generators (G31 and G32 to be specific) increase beyond the dynamic rotor angle index and go out of step. Both the generators lose synchronism with the other generators and make the system transient unstable. It is thus necessary to implement a controlled islanding strategy to avoid large damage to the whole network and/or cascading failure.
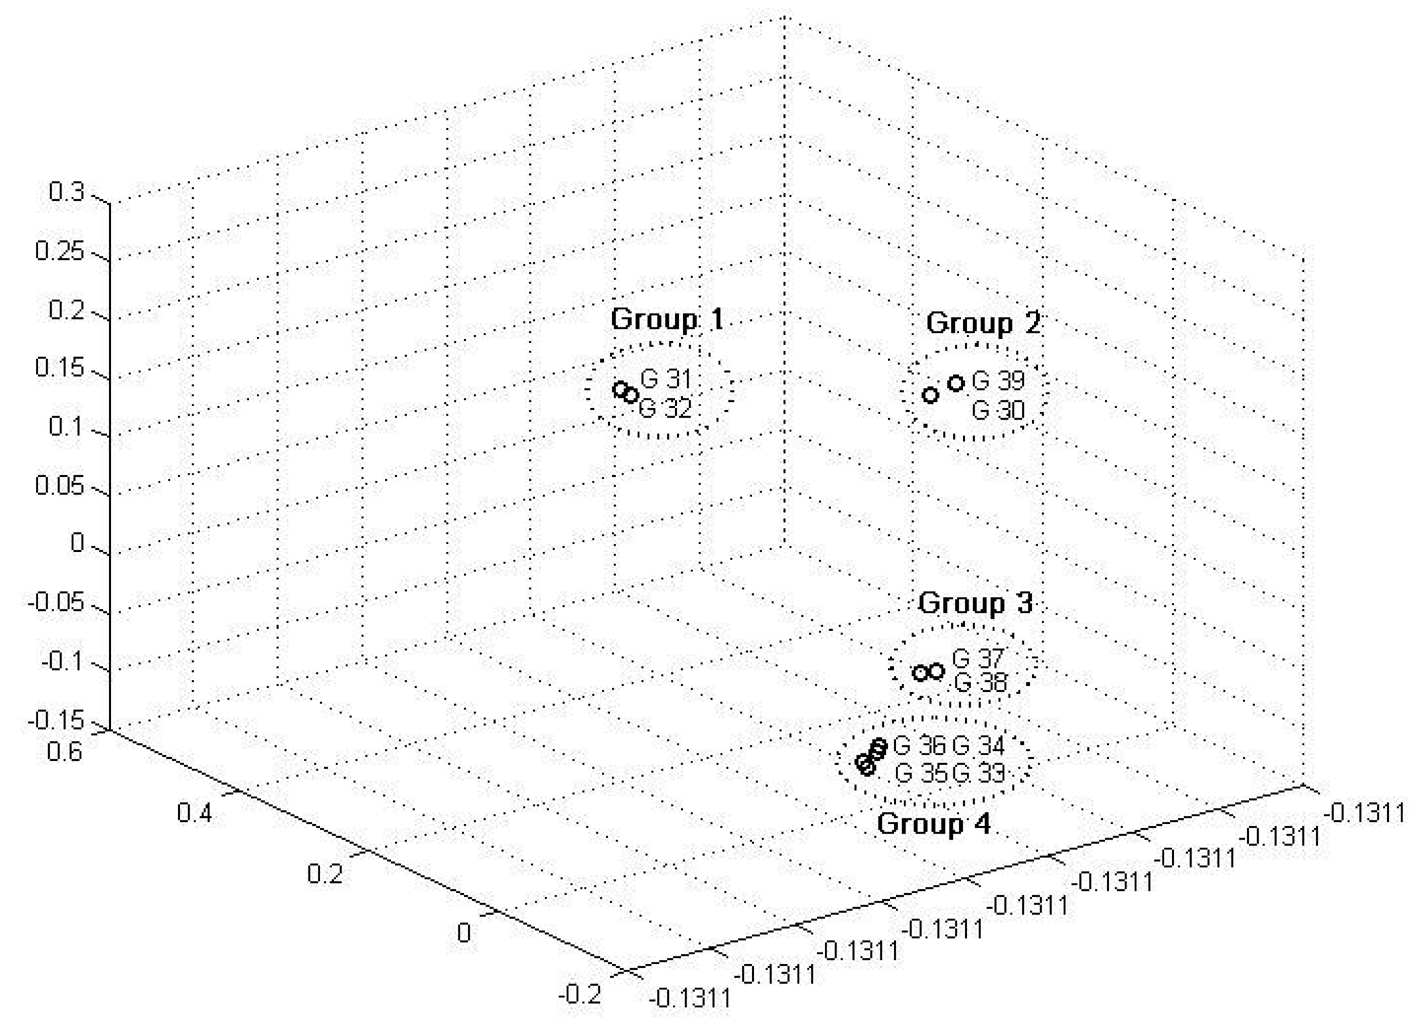
Based on inherent generator groups obtained with the slow coherency grouping algorithm, the kernel space distance measurement can be obtained by trajectory similarity distance, and the corresponding neighbor graph matrix indicates the closeness of any two generators. The kernel space approach has the favorable performance to reveal the post-fault dynamic operating characteristics. It is critical to utilize the ILEA to transform the original signal data from a high-dimensional space to a lower dimensional (latent) feature space. Based on the dynamic rotor angle index, because when a large disturbance occurs to a power system and the third line of defense is unable to maintain system stability, the controlled islanding strategy starts. Meanwhile, the WAMS collects the rotor angle data, so that the WAMS data time is suitable. Forty-two data (about 0.7 s) are needed from failure occurrence to the generator losing synchronism. After mapping the dynamic characteristic into three-dimensional (latent feature) space, we obtain four coherent clusters of coherent generators, as shown in Figure 7 and Table 2.
From Figure 7, we can see that the unstable generators, G31 and G32, are the first group; generators G30 and G39 are the second group; G37 and G38 are the third group, and the others are the fourth group. This result is associated with the post-disturbance data measured with WAMS. Compared with the slow coherency grouping algorithm, ILEA creates different coherent groups. This is because our identification of coherent generators is based on the post-fault dynamic behaviors and the result reflects the influence of different failure modes. This makes the controlled islanding approach adapt effectively to different faults.
5.1.3. KWP Spectral Partitioning
After we determine the coherent generator groups, we use the Dijkstra's algorithm to aggregate coherent generators to a virtual node to reduce the searching space for optimum separation surfaces. These virtual nodes cannot be split further in the subsequent separation surface search. In this way, the number of possible lines for the separation surfaces reduces from the original 46 to 23, simplifying the system complexity significantly and improving the searching speed and accuracy. After applying the spectral partitioning algorithm, we split the network into two islands and obtain the initial separation surfaces, as shown in Table 3.
From Table 3, it can be seen that three transmission lines, 8-9, 3-4 and 16-17, should be disconnected to form the two islands. The first island contains four generators and eleven buses, and the second one contains six generators and eighteen buses. In the two islands, the total amount of imbalanced active power is 118.1241 MW.
5.1.4. Refining Separation Surfaces by VNHSA
The above separation result, however, separates the unstable generators, G31 and G32, from some stable generators in the same island. This might cause the stability problem in this island. It is necessary to conduct VNHSA to further improve the initial result. The final result is shown in Table 4.
Because the OBDD approach can search the entire space of solutions, but in order to compare with the results of OBDD [13,14], we have to propose the feasible solution under the same condition of searching time. The OBDD approach is configured to find a solution with a power imbalance less than 41 MW. It can give a solution with an imbalance of 40.5617 MW after about 0.092 s of searching. If we want the OBDD approach to give as good of a solution as the proposed strategy, it will take more time. It is obvious that the results of our proposed strategy are feasible. The total amount of imbalanced active power is 24.9695 MW with our method. The final result is also much better than the initial solution, indicating the effectiveness of VNHSA. The smaller amount of imbalanced active power means better generation-load balance and smaller impacts in each island. Furthermore, in this unstable case, both generators G31 and G32 are beyond the stability limit and go out of step, and they need to be isolated from the other generators to maintain the system's transient stability. Our solution takes full consideration of the transient constraints and the minimum imbalanced active power constraint, leading to a better controlled islanding strategy than existing methods.
5.1.5. Corrective Control within Each Island
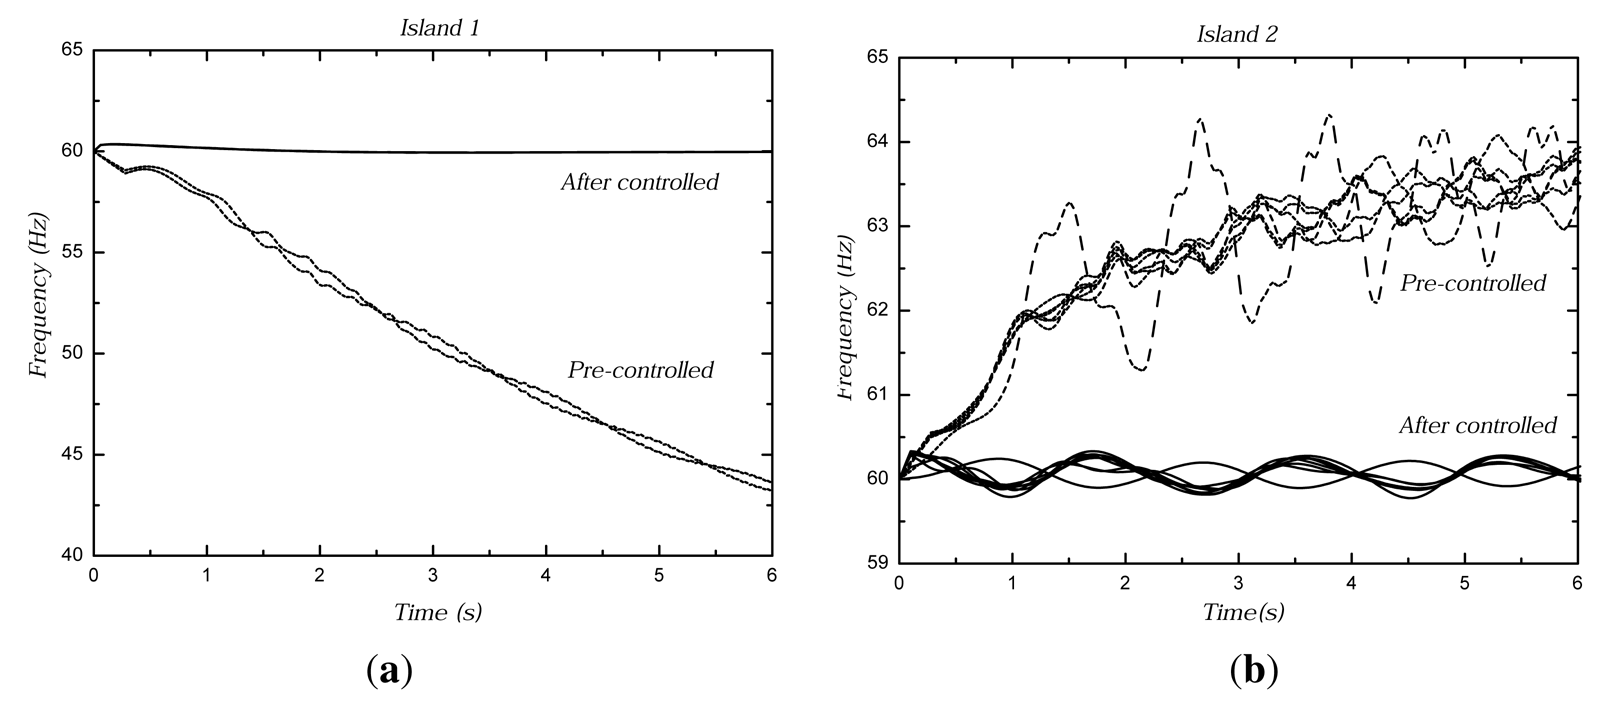
For the two islands formed by the enhanced separation surfaces, it is necessary to perform load shedding and generation tripping for stable running. In Island I, the load power is more than the generator power, and the frequency descends quickly. The load shedding method is utilized to maintain the island stability. The load Nodes 4 and 8 need control by the bidirectional power flow tracing algorithm and the PQ decomposition algorithm. In the Island II, the generator power is more than the load power, and the frequency increases. The generation tripping method is utilized to maintain the island stability. The generator Nodes 30, 33, 35, 37 and 39 need control. Figure 8 shows the generator frequencies compared with the pre-controlled ones in the island. The generator frequencies of those pre-controlled express the two islands without any control actions. The generator frequencies after being controlled show the two islands with the stability control measures. We focus on adjusting the load and generator in each island to mitigate the impact of imbalance power, so we ignore the control time. We can see that the Islands I and II lose stability soon without any control action. With the control measures proposed, the generator frequencies will achieve a stable level.
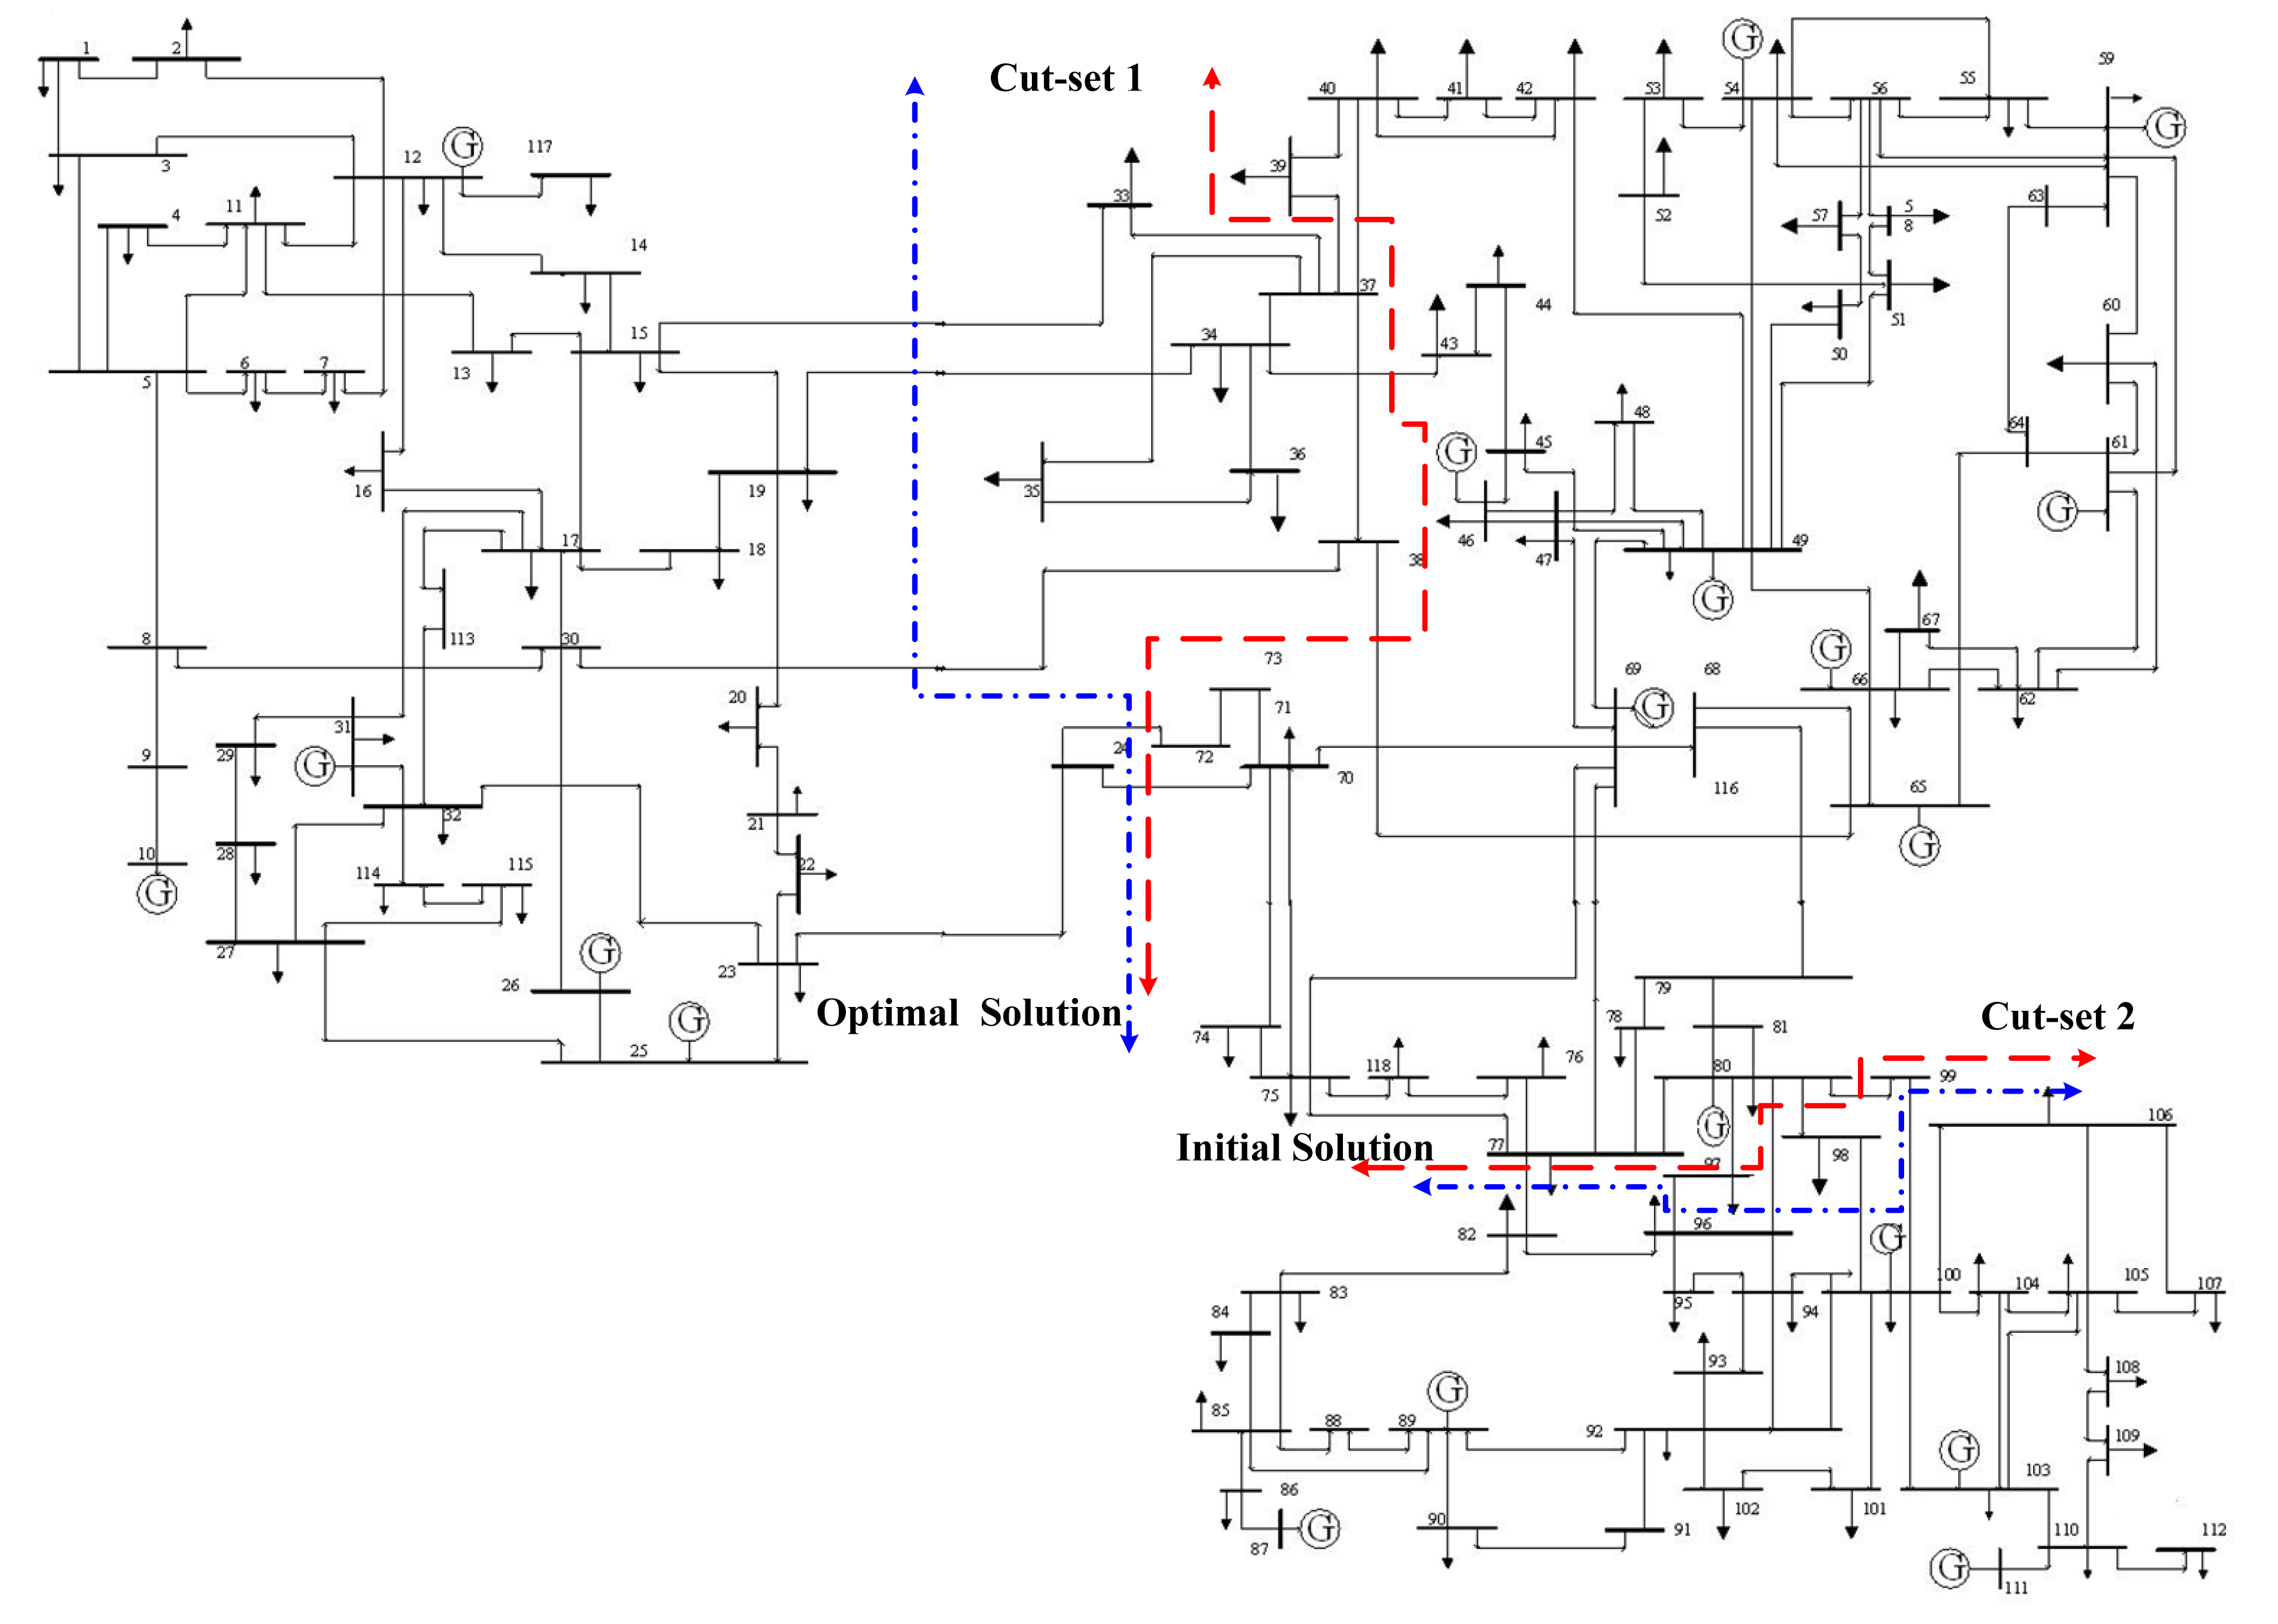
5.2. Results with the IEEE 118-Bus Test System
In order to explore the computational efficiency, we test our approach with the IEEE 118-bus power system. The topology of the test system is depicted in Figure 9. The system consists of 19 generators and 91 loads. In this case study, we consider two three-phase faults. First, a three-phase fault occurs on Lines 23–25 near Bus 25 with a fault duration of 0.2 s, and then, another three-phase fault occurs on Lines 100–103 near Bus 100 with a fault duration of 0.30 s. The two consecutive faults will lead to transient instability, and the power system needs to be separated to isolate the impacts.
According to the slow coherency grouping algorithm, the generators can be separated into three inherent groups, as shown in the second column of Table 5. This result is obtained offline and does not consider the fault modes. Based on the rotor angle trajectory information following severe disturbances, we apply the improved kernel space-based LEA to partition all the generators into three coherency groups, as shown in the third column of Table 5. After aggregating the associated bus, we can reduce the searching space of separation surfaces from the original 177 transmission lines to 107 lines.
The next step is to apply the spectral partitioning algorithm on the simplified graph to obtain the initial separation surfaces. At last, we determine the optimal islanding solution with VNHSA. The separation surfaces are shown in Table 6. From the table, we can see that our approach achieves the same optimal solution as OBDD does in this case study. OBDD approach is capable of searching the entire searching space and finding all possible solutions. When OBDD finds an acceptable solution and meets the criteria, the searching process will stop to save time. Compared with the OBDD method, although the environment and assumptions are different, this searching approach proposed in this paper is proven to be feasible by comparison. Meanwhile, our method creates an acceptable reasonable solution. This has also been observed in the New England 39-bus test system and the IEEE 118-bus test system.
5.3. Further Discussion: Adaptability and Efficiency
Our proposed approach adapts to failure correlations and has high computational efficiency. These good features are important in real-world practice. Generally, there are two crucial factors affecting the accurate identification of coherent generators in practice: the inherent characteristics and the external influences. The former includes the topology structure, generator inertia and damping constants, and the latter includes fault type, location and fault duration. For this reason, different failure modes following complicated operating conditions, especially severe disturbances, will change the coherent generator groups. In our proposed approach, the above factors are adequately considered. In addition, the inherent groups obtained by the slow coherency theory are used as the categorization information to help identify the post-fault coherency. Combining with the real-time post-fault dynamic rotor angle data, our approach can effectively adapt to various failure conditions.
To further illustrate the advantages, we test another case in the New England 39-bus system with a three-phase fault occurring on Line 25–26 near Bus 25 with a fault duration of 0.20 s. The result indicates that the unstable generators, G37 and G38, are classified as the first group, G30 and G39 as the second group and the others as the third group. This result is relevant to the failure modes using the ILEA. Compared to the results in Section 5.1, it is obvious that with the change of the failure mode, such as the fault position and the fault duration, the instability mode is different. It is necessary to identify coherent generators on the basis of real-time post-fault response information. Therefore, our proposed controlled islanding strategy reflects accurately the different fault modes, to achieve selective coherency identification following different failure modes. It can guarantee that unstable generators and stable generators are separated into different islands, which can help each island to easily come back to stability at a later time.
Furthermore, meeting the stability requirement in each islands is not the sole objective of controlled islanding. Computational efficiency is also an important target to allow a real-time response to dynamic network changes. We achieve this goal by introducing the concept of the virtual node, which aggregates coherent generators and associated buses as a single (virtual) node. This greatly simplifies the network and reduces the search space for optimal separation surfaces. As shown in our case studies, this strategy can reduce the branch edges from 46 to 23 (50% reduction) in the New England 39-bus, and from 177 to 107 (40% reduction) in the IEEE 118-bus systems. Such an efficiency makes our approach suitable for online implementation. The simulations reported in this paper were performed with the MATLAB R2009b software tool on a 32-bit Pentium PC with 2.80 GHz. The running time is shown in Table 7.
6. Conclusions
We present a novel integrated adaptive WAMS-based controlled islanding strategy to avoid catastrophic failures in a bulk power system. According to the real-time post-fault dynamic behavior of generators from WAMS, our approach can identify coherent generators, partition the power system into balanced islands, search for the optimal separation surfaces with the least net imbalanced active power and give out the corrective controls within each island.
Based on the ILEA, our method works better than existing approaches with respect to identifying coherent generator groups, because our method considers the influence of various failure modes. In order to improve the computational efficiency and to guarantee the transient stability of each island, we propose to aggregate the coherent generators and their associated buses into a virtual node to reduce the searching space. In addition, taking the result of the KWP spectral partition algorithm as the initial solution, we propose a VNHSA to refine the initial solution, so that the total amount of imbalanced active power could be further reduced. Furthermore, based on the bidirectional power flow tracing algorithm and PQ decomposition power flow analysis, the associated corrective controls to generators and loads within each island are obtained to find the post-fault equilibrium points of each island and to calm down the islands as soon as possible. In this way, our method not only provides good static and dynamic stability performance, but also helps the self-healing control for the partitioned islands. We performed case studies with the New England 39-bus system and the IEEE 118-bus system. The evaluation results verify that our method can adapt to various failure modes and runs fast enough for real-time islanding control.
Acknowledgments
This work is supported by the Doctorate Fund of the Ministry of Education of China under Grant No. 20100009110025 and by a seed fund of the Canada-China collaborative research on clean energy and smart grids.
Conflicts of Interest
The authors declare no conflict of interest.
References
- Yang, B.; Vittal, V.; Heydt, G.T. Slow-coherency-based controlled islanding, a demonstration of the approach on the 14 August 2003 blackout scenario. IEEE Trans. Power Syst. 2006, 21, 1840–1847. [Google Scholar]
- Peponides, G.; Kokotovic, P.V.; Chow, J.H. Singular perturbations and time scales in nonlinear models of power systems. IEEE Trans. Circuits Syst. 1982, 29, 758–767. [Google Scholar]
- Chow, J.H. Time-Scale Modeling of Dynamic Network with Application to Power Systems; Springer Verlag: Berlin, Germany, 1982. [Google Scholar]
- You, H.; Vittal, V.; Yang, Z. Self-healing in power systems: An approach using islanding and rate of frequency decline based load shedding. IEEE Trans. Power Syst. 2003, 18, 174–181. [Google Scholar]
- You, H.; Vittal, V.; Wang, X. Slow coherency based islanding. IEEE Trans. Power Syst. 2004, 19, 483–491. [Google Scholar]
- Wang, X. Slow Coherency Grouping Based Islanding Using Minimal Cut-Sets and Generator Coherency Index Tracing Using the Continuation Method. Ph.D. Thesis, Iowa State University, Ames, IA, USA, 2005. [Google Scholar]
- Kumar, M.M.; Swarup, K.S. Graph theoretic approach for preventive control of power system. Int. J. Electr. Power Energy Syst. 2010, 32, 254–261. [Google Scholar]
- Sen, A.; Ghosh, P.; Vittal, V. A new min-cut problem with application to electric power network partitioning. Eur. Trans. Electr. Power 2009, 19, 778–797. [Google Scholar]
- Xu, G.; Vittal, V. Slow coherency based cutset determination algorithm for large power systems. IEEE Trans. Power Syst. 2010, 25, 877–884. [Google Scholar]
- Xu, G.; Vittal, V.; Meklin, A. Controlled islanding demonstrations on the WECC system. IEEE Trans. Power Syst. 2011, 26, 334–343. [Google Scholar]
- Li, H.; Rosenwald, G.W.; Jung, J.; Liu, C.C. Strategic power infrastructure defense. IEEE Proc. 2005, 93, 918–933. [Google Scholar]
- Ding, L.; Gonzalez-Longatt, F.M.; Wall, P. Two-step spectral clustering controlled islanding algorithm. IEEE Trans. Power Syst. 2013, 28, 75–84. [Google Scholar]
- Sun, K.; Zheng, D.Z.; Lu, Q. Splitting strategies for islanding operation of large-scale power systems using obdd-based methods. IEEE Trans. Power Syst. 2003, 18, 912–923. [Google Scholar]
- Sun, K.; Zheng, D.Z.; Lu, Q. A simulation study of obdd-based proper splitting strategies for power systems under consideration of transient stability. IEEE Trans. Power Syst. 2005, 20, 389–399. [Google Scholar]
- El-Zonkolym, A.; Saad, M.; Khalil, R. New algorithm based on clpso for controlled islanding of distribution systems. Int. J. Electr. Power Energy Syst. 2013, 45, 391–403. [Google Scholar]
- Aghamohammadi, M.R.; Shahmohammadi, A. Intentional islanding using a new algorithm based on ant search mechanism. Int. J. Electr. Power Energy Syst. 2012, 35, 138–147. [Google Scholar]
- Nourizadeh, S.; Sarmadi, S.A.; Karimi, M.J.; Ranjbar, A.M. Power system restoration planning based on wide area measurement system. Int. J. Electr. Power Energy Syst. 2012, 43, 526–530. [Google Scholar]
- Sun, K.; Hur, K.; Zhang, P. A new unified scheme for controlled power system separation using synchronized phasor measurements. IEEE Trans. Power Syst. 2011, 26, 1544–1554. [Google Scholar]
- Ford, J.J.; Bevrani, H.; Ledwich, G. Adaptive load shedding and regional protection. Int. J. Electr. Power Energy Syst. 2009, 31, 611–618. [Google Scholar]
- Xu, F.; Wang, X.F. Determination of load shedding to provide voltage stability. Int. J. Electr. Power Energy Syst. 2011, 33, 515–521. [Google Scholar]
- Joglekar, J.J.; Nerkar, Y.P. A different approach in system restoration with special consideration of islanding schemes. Int. J. Electr. Power Energy Syst. 2008, 30, 519–524. [Google Scholar]
- Chen, C.; Zhang, L.J.; Bu, J.J.; Wang, C.; Chen, W. Constrained Laplacian Eigenmap for dimensionality reduction. Neurocomputing 2010, 73, 951–958. [Google Scholar]
- Xiong, H.L.; Swamy, M.N.S.; Ahmad, M. Optimizing the kernel in the empirical feature space. IEEE Trans. Neur. Netw. 2005, 16, 460–474. [Google Scholar]
- Chan, P.K. Spectral k-way ratio-cut partitioning and clustering. IEEE Trans. Comput.-Aid. Des. Integr. Circuits Syst. 1994, 13, 1088–1096. [Google Scholar]
- Mladenović, N.; Hansen, P. Variable neighborhood search. Comput. Oper. Res. 1997, 24, 1097–1100. [Google Scholar]
- Gross, G.; Tao, S. A physical-flow-based approach to allocating transmission losses in a transaction framework. IEEE Trans. Power Syst. 2000, 15, 631–637. [Google Scholar]
- Abdelkader, S.M. Transmission loss allocation through complex power flow tracing. IEEE Trans. Power Syst. 2007, 22, 2240–2248. [Google Scholar]


| Number | Coherent generator group | Aggregation buses |
|---|---|---|
| 1 | 30, 37, 38 | 2, 25, 26, 28, 29 |
| 2 | 31, 32, 39 | 6, 7, 8, 9, 10, 11 |
| 3 | 33, 34, 35, 36 | 19, 20, 21, 22, 23, 24 |
| Number | Coherent generator group | Aggregation buses |
|---|---|---|
| 1 | 31, 32 | 6, 10, 11 |
| 2 | 30, 39 | 1, 2 |
| 3 | 37, 38 | 25, 26, 28, 29 |
| 4 | 33, 34, 35, 36 | 19, 20, 21, 22, 23, 24 |
| Island number | Coherent generator | Aggregation buses | Open lines | Total imbalanced active power |
|---|---|---|---|---|
| Island1 | 30, 37, 38, 39 | 1-3, 9, 17-18, 25-29 | 8-9, 3-4, 16-17 | 118.1241 (MW) |
| Island 2 | 31, 32, 33, 34, 35, 36 | 4-8, 10-16, 19-24 |
| Method | Separation soltuions | Separation surfaces | Generators in each island | Total imbalanced active power |
|---|---|---|---|---|
| Our method | Initial solution | 8-9, 3-4, 16-17 | (30, 37-39); (31-36) | 118.1241 MW |
| Optimal solution | 8-9, 3-4, 14-15 | (31, 32); (30, 33-39) | 24.9695 MW | |
| OBDD | Solution 1 | 8-9, 3-4, 3-18, 17-27 | (30, 37-39); (31-36) | 40.5617 MW |
| Solution 2 | 9-39, 3-4, 3-18, 17-27 | (30, 37-39); (31––36) | 41.1284 MW | |
| Solution 3 | 8-9, 3-4, 17-18, 17-27 | (30, 37-39); (31-36) | 147.4175 MW | |
| Number | Coherent generator group | Coherency identification based on ILEA |
|---|---|---|
| 1 | 46, 49, 80, 89 | 10, 12, 25, 26, 31, 32 |
| 2 | 66, 87, 100, 103, 111 | 46, 49, 54, 59, 61, 65, 66, 69, 80 |
| 3 | 10, 12, 25, 26, 31, 54, 59, 61, 65, 69 | 87, 89, 100, 103, 111 |
| Method | Separation solutions | Separation surfaces | Imbalance active power | Total imbalanced active power |
|---|---|---|---|---|
| Our Method | Initial solution | 24-70, 24-72, 34-43, 37-39, 37-40, 38-65 | 80.7617 MW | 170.9680 MW |
| 77-82, 80-96, 80-97, 80-98, 80-99 | 90.2063 MW | |||
| Optimal solution | 15-33, 19-34, 24-70, 24-72, 30-38 | 62.0058 MW | 63.5957 MW | |
| 77-82, 80-96, 96-97, 98-100, 99-100 | 1.5899 MW | |||
| OBDD | Solution 1 | 15-33, 19-34, 24-70, 24-72, 30-38 | 62.0058 MW | 63.5957 MW |
| 77-82, 80-96, 96-97, 98-100, 99-100 | 1.5899 MW | |||
| Solution 2 | 19-34, 24-70, 24-72, 30-38, 33-37 | 38.9796 MW | 94.9803 MW | |
| 77-82, 80-96, 80-97, 80-99, 98-100 | 56.0007 MW | |||
| Solution 3 | 15-33, 19-34, 30-38, 23-24 | 75.0859 MW | 115.7652 MW | |
| 77-82, 80-96, 80-99, 96-97, 98-100 | 40.6793 MW | |||
| Test cases | Program running time (S) | ||||
|---|---|---|---|---|---|
| Stage I | Stage II | Stage III | Total time | ||
| Coherency identification | KWP spectral partitioning | Refining separation surfaces | Corrective control | ||
| New England 39-bus system | 0.045 | 0.0086 | 0.08 | 0.44 | 0.5736 |
| IEEE 118-bus system | 0.075 | 0.0415 | 0.18 | 0.97 | 1.2665 |
© 2014 by the authors; licensee MDPI, Basel, Switzerland. This article is an open access article distributed under the terms and conditions of the Creative Commons Attribution license ( http://creativecommons.org/licenses/by/3.0/).
Share and Cite
Song, H.; Wu, J.; Wu, K. A Wide-Area Measurement Systems-Based Adaptive Strategy for Controlled Islanding in Bulk Power Systems. Energies 2014, 7, 2631-2657. https://doi.org/10.3390/en7042631
Song H, Wu J, Wu K. A Wide-Area Measurement Systems-Based Adaptive Strategy for Controlled Islanding in Bulk Power Systems. Energies. 2014; 7(4):2631-2657. https://doi.org/10.3390/en7042631
Chicago/Turabian StyleSong, Honglei, Junyong Wu, and Kui Wu. 2014. "A Wide-Area Measurement Systems-Based Adaptive Strategy for Controlled Islanding in Bulk Power Systems" Energies 7, no. 4: 2631-2657. https://doi.org/10.3390/en7042631