Article

3-D CFD Modeling for Parametric Study in a 300-MWe One-Stage Oxygen-Blown Entrained-Bed Coal Gasifier

Department of Mechanical Engineering, Yonsei University, Seoul 120-749, Korea
*
Author to whom correspondence should be addressed.
Energies 2015, 8(5), 4216-4236; https://doi.org/10.3390/en8054216
Submission received: 16 March 2015 / Revised: 30 April 2015 / Accepted: 5 May 2015 / Published: 11 May 2015

Abstract

:
Three-dimensional computational fluid dynamics (CFD) modeling of the gasification performance in a one-stage, entrained-bed coal gasifier (Shell Coal Gasification Process (SCGP) gasifier) was performed, for the first time. The parametric study used various O2/coal and steam/coal ratios, and the modeling used a commercial code, ANSYS FLUENT. CFD modeling was conducted by solving the steady-state Navier–Stokes and energy equations using the Eulerian–Lagrangian method. Gas-phase chemical reactions were solved with the Finite–Rate/Eddy–Dissipation Model. The CFD model was verified with actual operating data of Demkolec demo Integrated Gasification Combined Cycle (IGCC) facility in Netherlands that used Drayton coal. For Illinois #6 coal, the CFD model was compared with ASPEN Plus results reported in National Energy Technology Laboratory (NETL). For design coal used in the SCGP gasifier in Korea, carbon conversion efficiency, cold gas efficiency, temperature, and species mole fractions at the gasifier exit were calculated and the results were compared with those obtained by using ASPEN Plus-Kinetic. The optimal O2/coal and steam/coal ratios were 0.7 and 0.05, respectively, for the selected operating conditions.

1. Introduction

Environmental and fuel supply concerns are driving the demand to develop more efficient uses of fossil fuel by energy industries. Therefore, efforts are being made to employ Integrated Gasification Combined Cycle (IGCC) processes rather than conventional or super critical Rankine-based cycles, which would also benefit the increased use of hydrogen fuel. The use of coal in IGCC is a promising alternative to combustion and is already commercially cost-competitive in many locations [1,2,3,4]. Gasification occurs when insufficient oxidant is supplied; the amount of oxygen supplied for coal gasification is usually 1/3 to 1/5 of that supplied for complete combustion [5].
Currently, commercial coal gasification technologies are classified by the feed flow pattern in the gasifier, such as fixed-, fluidized-, and entrained-bed gasification technologies [6]. Entrained-bed gasifiers have higher fuel conversion rates and shorter solid residence times than other gasifiers because the feedstock particles are usually ground to smaller than 1 mm [7].
Although entrained-bed gasifiers have become available through a number of demonstration projects, information on commercial coal gasifiers is restricted. Therefore, a technical understanding should be developed independently. Empirically characterizing any gasification process is difficult because of the high heating rate and short residence time, so numerical simulations are one of the most important tools used by universities and institutes, such as the United States Department of Energy (DOE), to advance gasification technology [8]. Computational fluid dynamics (CFD) analysis provides predictions of fluid flow and species concentrations in the gasifier while considering the reactor geometry and operating conditions [9]. While CFD is definitely required to design and operate the gasifier reactor and the burners, simplified models (or reduced order models) are used to simulate the overall gasification process and to integrate the process with the power plant [10,11,12,13].
CFD analysis has been carried out by many researchers to understand gasification reactions [14,15,16,17,18,19,20,21,22,23]. Chen et al. [14] performed CFD modeling of a 200-ton/day, two-stage, air-blown, entrained-bed gasifier (Mitsubishi Heavy Industry, Fukushima, Japan). Watanabe and Otaka [15] carried out a numerical simulation of the gasification reaction in the Central Research Institute of Electric Power Industry (CRIEPI)’s 2-ton/day, research-scale, coal gasifier by using a commercial CFD code, CFX-4, with a User FORTRAN interface. Slezak et al. [16] developed a comprehensive three-dimensional model to simulate a 2423-ton/day E-Gas coal gasifier using ANSYS FLUENT. Sun et al. [17] developed a three-dimensional numerical model to simulate a 2000-ton/day, industrial, opposed multiburner (OMB), coal-water slurry, entrained-bed gasifier at the East China University of Science and Technology (ECUST) in China by using ANSYS FLUENT. Luan et al. [18] developed a three-dimensional numerical model of a 2230-ton/day E-Gas coal gasifier by using ANSYS FLUENT. Kumar and Ghoniem [19,20] described the construction, validation, and application of a multi-scale model of entrained flow gasification. While the validation of the turbulence and particle turbulent dispersion submodels was focused on Kumar and Ghoniem [19], the impact of suggested improvements in these submodels on the predictions of key output parameters was analyzed through appropriate sensitivity analyses in Kumar and Ghoniem [20]. Abani and Ghoniem [21] investigated multi-phase reacting flow in a coal-fed entrained flow gasifier using large-eddy simulations (LES) and Reynolds-averaged Navier–Stokes (RANS) models. Seggiani [22] performed simulation for slag accumulation and flow on walls in a Prenflo coal gasifier using a slag building simplified model. Ye et al. [23] investigated the detailed flow and heat transfer characteristics in the quench pipe and transfer duct of the Taean 300 MWe IGCC process using CFD. Turbulent mixing and heat transfer by the hot syngas and quench gas streams were analyzed.
Most of these CFD studies analyzed E-Gas coal gasifiers, and no public results have been reported for a Shell coal gasification process (SCGP) gasifier except two papers published by our group [24,25]. In Hong et al. [24], a slag building simplified model was developed to determine wall heat flux of a Shell 300 MW coal gasifier. In the model, 4 layers (particulate, sintered, molten slag, solidified slag) were considered and mass conservation and energy balance were used to obtain each slag layer’s thickness and surface temperature. Thermo-chemical and fluid characteristics of the gasifier were studied with and without considering the slag model using commercial CFD code FLUENT. In Hong et al. [25], the efficiency and characteristics of the SCGP gasifier were predicted using CFD simulation for different biomass-coal blending ratios. In their study, kinetic parameters obtained by char-CO2 gasification experiments were used for the 3D-simulation. In Korea, a national project for constructing a 300 MWe IGCC demonstration plant has been going on. The Korea Western-Power Company and DOOSAN Heavy Industries and Construction Company (Taean, Korea) selected the SCGP gasifier type. In this paper, a comprehensive three-dimensional, full-scale CFD analysis of the SCGP gasifier was carried out with ANSIS FLUENT 14.0. For the CFD analysis, a numerical model suggested by Jeong et al. [26] was used. They performed CFD modeling of an E-Gas gasifier and validated the model by comparing calculated results with operating data of the Wabash plant in the United States and also with those of Ma and Zitney [27].
In this study, various O2/coal and steam/coal ratios were used to predict optimal operation conditions of the SCGP gasifier. The CFD model was verified with actual operating data of Demkolec demo IGCC facility in Netherlands that used Drayton coal. For Illinois #6 coal, the CFD model was compared with ASPEN Plus results reported in NETL. For design coal used in the SCGP gasifier in Korea, carbon conversion, cold gas efficiencies, temperature, and species mole fractions at the gasifier exit were calculated and the results were compared with those obtained by using ASPEN Plus-Kinetic.

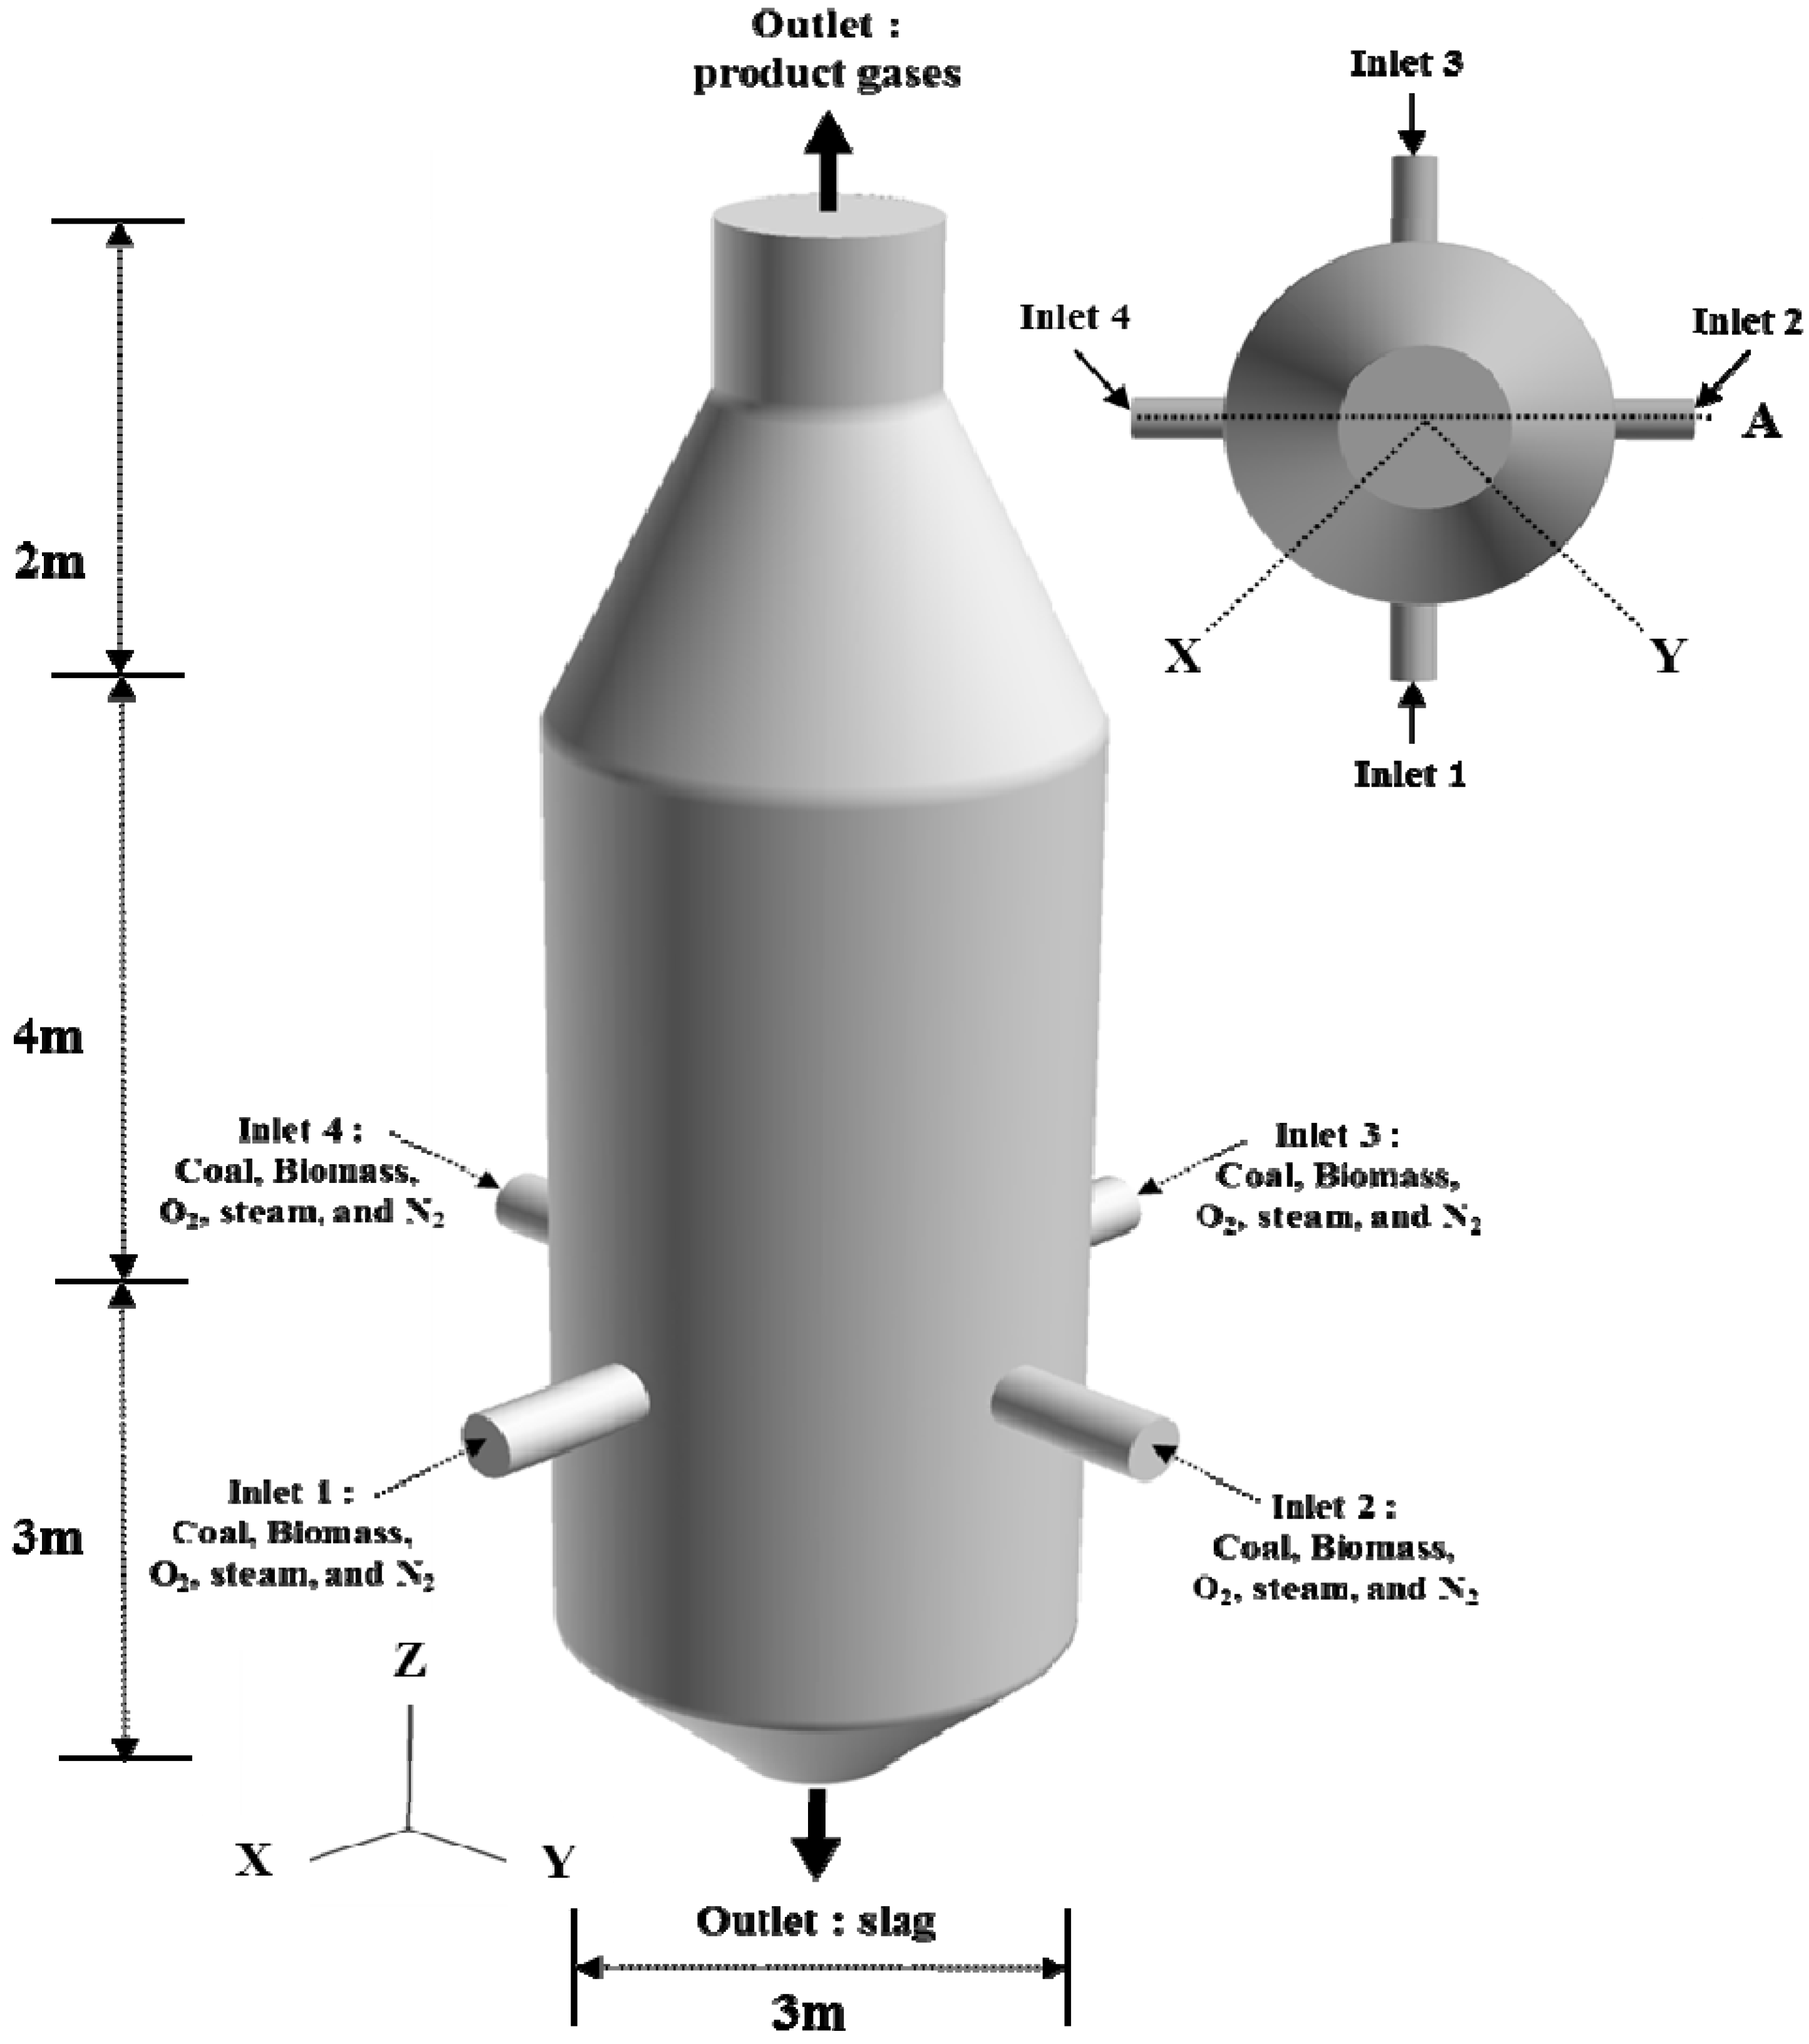
2. The SCGP Gasifier and Coals

The specific dimensions of the SCGP gasifier are confidential, so the geometry of the gasifier was simplified. The geometry of the gasifier is described in Figure 1 [9,11]. Pulverized coal and nitrogen as a transport gas were injected into the gasifier through the center hole of each burner in partial oxidation conditions. At the same time, a mixture of oxygen and steam was blown through the surrounding holes. In this study, it was assumed that all the reactants were injected together into the gasifier through the center hole of each burner. It was also assumed that the reactants were injected toward the center of the gasifier cross-section from four burners located at four corresponding inlets.
Drayton coal and Illinois #6 coal were used to compare calculated results with actual operating data from Demkolec demo IGCC facility and analysis data from a report of NETL, respectively. After verifying the numerical model, the design coal of the SCGP gasifier in Korea was used for the CFD analysis. Proximate, ultimate analysis, higher heating value (HHV), and feeding rate for each coal are provided in Table 1.
Figure 1. Model gasifier.
Energies 08 04216 g001
Table 1. Properties of Illinois #6 coal, Drayton coal, and design coal for the SCGP gasifier in Korea.
AnalysisContentsIllinois #6 CoalDrayton CoalDesign Coal
Proximate analysis (wt%)Moisture11.122.02.06
Fixed Carbon44.1951.2549.25
Ash9.712.549.93
Volatiles34.9934.2038.76
Total100100100
Ultimate analysis (wt%)Moisture11.122.02.06
Carbon63.7568.0162.36
Hydrogen4.54.824.49
Nitrogen1.251.330.70
Chlorine0.29--
Sulfur2.510.990.94
Ash9.712.549.93
Oxygen6.8810.3919.53
Total100100100
Calorific value (HHV) (kcal/kg)6481.256616.036925.11
The Illinois #6 coal used in this study contains 11.12% total moisture on an as-received basis. It was assumed that the coal must be dried to 5% moisture to allow for smooth flow through the dry feed system [28]. According to Ma and Zitney [27], the minimum, mean, and maximum diameters of Illinois #6 coal were 74,100, and 297 μm, respectively.

3. Numerical Model

In the numerical procedure, the 3-D, steady-state, Navier–Stokes equations, energy equation, and gas-phase species transport equations were solved in an Eulerian frame of reference. The realized k–ε model was applied to capture the turbulence flow. The gas-phase species transport equations were solved with the Finite–Rate/Eddy–Dissipation Model. In this model, the Finite–Rate and the Eddy–Dissipation rate were compared, and the slower rate was used to compute the continuous phase reactions. All coal particles were treated as discrete, secondary phase, and dispersed in the continuous phase via the discrete phase model (DPM) with stochastic tracking to consider the turbulent dispersion effect. Coal devolatilization and char gasification were considered. In this model, the particle size did not change while the particle density changed. The particle density was initially 1400 kg/m3, however, continuously decreased by devolatilization, and further decreased during the char gasification. Two radiation models (discrete ordinate (DO) model and P-1 model) were used for radiation interactions between gas and particle. The domain-based weighted-sum-of-gray-gases model (WSGGM) for the radiative properties of the gases was applied, and the gravitational force was considered in the modeling. Results of the comparison between the two radiation models are presented in Table S1 and Figures S1–S3 of Supplementary Materials, which show a negligible difference between the two models. Coal devolatilization model, gas phase reaction model, and char gasification model were applied as coal reaction sub models in this study.

3.1. Coal Devolatilization Model

The generic coal devolatilization reaction by coal pyrolysis can be described as follows [17]:
Coal → volatiles + char (C(S) and ash)
The two competing rates model proposed by Kobayashi describes the devolatilization rate as follows [29]:
R 1 = A 1 e ( E 1 / R T p ) ,   R 2 = A 2 e ( E 2 / R T p )
where R1 and R2 are competing rates that control the devolatilization over different temperature ranges. Tp is the temperature of the particle (K), A1 and A2 are Arrhenius-type pre-exponential factors, E1 and E2 are activation energies (J/kmol), and R is the universal gas constant (8314 J/kmol·K). In this study, A1 and A2 were 2.0 × 10⁶ s−1 and 1.3 × 10⁷ s−1, respectively, and E1 and E2 were 1.046 × 10⁸ J/kmol and 1.674 × 10⁸ J/kmol, respectively [29].
The two kinetic rates were weighted to yield an expression for the devolatilization:
m v ( t ) ( 1 f w , o ) m p , 0 m a = 0 t ( α 1 R 1 + α 2 R 2 ) exp ( 0 t ( R 1 + R 2 ) d t ) d t
where mv(t) is the devolatilized mass at time t (kg), mp,0 is the initial coal particle mass (kg) and ma is the ash content of coal (kg). fw,0 is the mass fraction of evaporating/boiling material. In this study, yield factors for α1 of design coal, Illinois #6 coal, and Drayton coal were α1 = 0.369, α1 = 0.371, and α1 = 0.336, respectively, while those for α2 of design coal, Illinois #6 coal, and Drayton coal were α2 = 0.672 [27].
In this model, volatile matter produced during devolatilization was assumed to be CηHθOκ. η, θ, and κ can be calculated from the ultimate and proximate analyses of coal. The values of η, θ, and κ were 1, 2.761, and 0.264, respectively. Once CH2.761O0.264 is released, it decomposes into hydro-carbonaceous gas and syngas (i.e., CxHy, CO, and H2) or is partially oxidized through chemical reactions [30,31]. In this study, CH4, and C6H6, and C7H8 were assumed to be the representative species of CxHy.

3.2. Gas Phase Reaction Model

The turbulence-chemistry interaction is modeled through composite Magnussen eddy-dissipation and Arrhenius rates. The constants of Magnussen eddy-dissipation for reactants and products are 4.0 and 0.5, respectively [29]. The reaction rate for each reaction modeled is defined by taking the smaller of the chemical reaction rate and the turbulent mixing rate [29]. The turbulence mixing rate is a function of turbulence kinetic energy, the dissipation rate of turbulence kinetic energy, and the mole fractions of reactant and product. Turbulence mixing rates can be described as the non-premixed mixing rate and premixed mixing rate. Of these two turbulence mixing rates, the smaller value was used to calculate the reaction rate (Rrxn, t) [29]. The chemical reaction rate (Rrxn, c) can be expressed as:
R r x n , c = R r x n , c C 3 c , R r x n , c = A r T m e E r / R T C 1 a C 2 b
where Ar is the pre-exponential factor, T is the gas temperature (K), m is the exponent of temperature. Er is the activation energy (J/kmol), C1 and C2 are the molar concentrations of the first and second reactants, respectively, a and b are the reaction orders corresponding to each reactant, C3 is the concentration of a third species that is neither a reactant nor a product, and c is the reaction order corresponding to C3. Note that the rates of all reactions except CO oxidation reaction (Equation (8)) are not related to the concentration of the third species (c = 0). For Equation (8), the rate is half order (c = 0.5) with respect to H2O. The smaller value of the turbulence mixing rate (Rrxn, t) and chemical reaction rate (Rrxn, c) was applied in the CFD calculation and can be expressed as:
R r x n = min ( R r x n , t ,    R r x n , c )
Table 2 shows gas phase reactions included in the model and the kinetic parameters of each reaction.

3.3. Char Gasification Model

After the complete de-volatilization of volatile matter in the coal particles, heterogeneous reactions between char (C(s)) and gas-phase species (O2, CO2, and H2O) occurred in the gasifier. These heterogeneous reactions have been suggested by Chen et al. [5], Chen et al. [14], Watanabe and Otaka [15], and Luan et al. [18].
The rate of reaction r (r =1, 2, 3) of the char with gas n (O2, CO2, and H2O) is described by [29]:
R ¯ c h a r , r = A p η r R c h a r , r
R c h a r , r = R k i n , r ( p n R c h a r D 0 , r ) N r
where Rchar,r is the rate of char surface depletion (kg/s), ηr is the effectiveness factor, which was 1.0 for all the reactions in this study, Rchar is the rate of char surface reaction per unit area (kg/m2/s), Nr is the mass fraction of surface species r in the particle, pn is the bulk partial pressure of the gas phase (Pa), D0,r is the diffusion rate coefficient for reaction r (kg/m2/s/Pa0.5), Rkin,r is the kinetic rate of reaction r (kg/m2/s/Pa0.5), and Nr is the reaction order. D0,r is given by:
D 0 , r = C 1 , r [ ( T p + T ) / 2 ) ] 0.75 d p
where TP is the particle temperature and C1,r is the molar concentration of the first reactant (O2). The kinetic rate of the reaction is defined as:
R k i n , r = A r T P β r e ( E r / R T P )
where βr is the exponent of the particle temperature. The kinetic parameters of reactions (25), (26), and (27) are listed in Table 3.
Table 2. Kinetic parameters for gas phase reactions.
Gas Phase ReactionsEquationArEr (J/kmol)mabRef.
CηHθOκ → αcC7H8 + βcCO + γcH2(6)4.26 × 10⁶ 1/s1.08 × 108000[32]
CηHθOκ + δgO2 → εgCO + ζgH2O(7)9.2 × 10⁶ 1/K/s8.02 × 107100[32]
CO +0.5O2 → CO2(8)2.239 × 10¹² (m3/kmol)0.75/s1.674 × 108010.25[33]
H2 + 0.5O2 → H2O(9)6.8 × 10¹⁵ (m3/kmol)0.75/K−1/s1.67 × 108−10.251.5[33]
CH4 + 0.5O2 → CO + 2H2(10)4.4 × 10¹¹ (m3/kmol)0.75/s1.25 × 10800.51.25[34]
CO + H2O → CO2 + H2(11)2.34 × 10¹⁰ (m3/kmol)0.5/s2.883 × 10800.51[35]
H2 + CO2 → CO + H2O(12)2.2 × 10⁷ (m3/kmol)0.5/s1.9 × 10800.51[27]
CH4 + H2O → CO+ 3H2(13)8.7 × 10⁷ (m3/kmol)0.5/s2.51 × 10800.51[27]
CO +3H2 → CH4 + H2O(14)5.12 × 10⁻¹⁴ m3/kmol/s2.73 × 104011[9]
C7H8 + H2 → C6H6 + CH4(15)1.04 × 10¹² (m3/kmol)0.5/s2.47 × 108010.5[35]
C7H8 + 9O2 → 7CO2 + 4H2O(16)1.6 × 10⁸ (m3/kmol)0.75/s1.255 × 1080−0.11.85[36]
C6H6 + 5H2O → 5CO + 6H2 + CH4(17)4.4 × 10⁸ m3/kmol/s2.2 × 108011[37]
C6H6 + 7.5O2 → 6CO2 + 3H2O(18)2 × 10⁸ (m3/kmol)0.75/s1.255 × 1080−0.11.85[38]
C6H6 + 3O2 → 6CO + 3H2(19)1.58 × 10¹⁵ m3/kmol/s2.026 × 108011[39]
H2O → H2 + 0.5O2(20)2.5 × 10¹⁰ m3/kmol/s3.5 × 108010.5[27]
Table 3. Kinetic parameters for char gasification (heterogeneous reactions).
ZoneGlobal ReactionsEquationβrAr (kg/m2/s/Pa0.5)Er (J/kmol)Ref.
Combustion/GasificationC(s) + 0.5O2 → CO(25)00.0526.1 × 107[14]
C(s) + CO2 → 2CO(26)00.07321.125 × 108[40]
C(s) + H2O → CO + H2(27)00.07821.15 × 108[14]

4. Numerical Methods

4.1. Numerical Scheme

A commercial CFD code, FLUENT, which employs the finite volume method (FVM), was employed as the solver. The geometry and mesh of the gasifier were generated with a hybrid-mesh using GAMBIT (Version 2.4.6) (see Figure 2). The semi-implicit method for pressure-linked equations (SIMPLE) was used for the pressure-velocity coupling of mass and momentum conservation equations, and a second-order, upwind algorithm was used for discretization. To update the specific heat of the mixture, the mass-weighted mixing law for consistent species was used. The mixture’s viscosity, conductivity, and specific heat capacity were assumed to be constants. To effectively control the solution, under-relaxation factors for all variables were less than 0.5.
Figure 2. Mesh and boundary conditions.
Energies 08 04216 g002
Calculations were carried out using meshes considering both the 1/4 periodic geometry and whole geometry of the gasifier (See Figure 2). The comparison was made in Figures S4–S9 for spatial distributions of temperature, H2 and CO molar concentrations (See Supplementary Materials). Considering the time required for calculation, the 1/4 periodic geometry was selected hereafter. The mesh number of 220,000 was determined from a mesh sensitivity study. Sun et al. [17] and Ni et al. [41] also used 1/4 periodic geometry in their numerical simulation of industrial opposed multi-burner (OMB) coal-water slurry entrained flow gasifier.

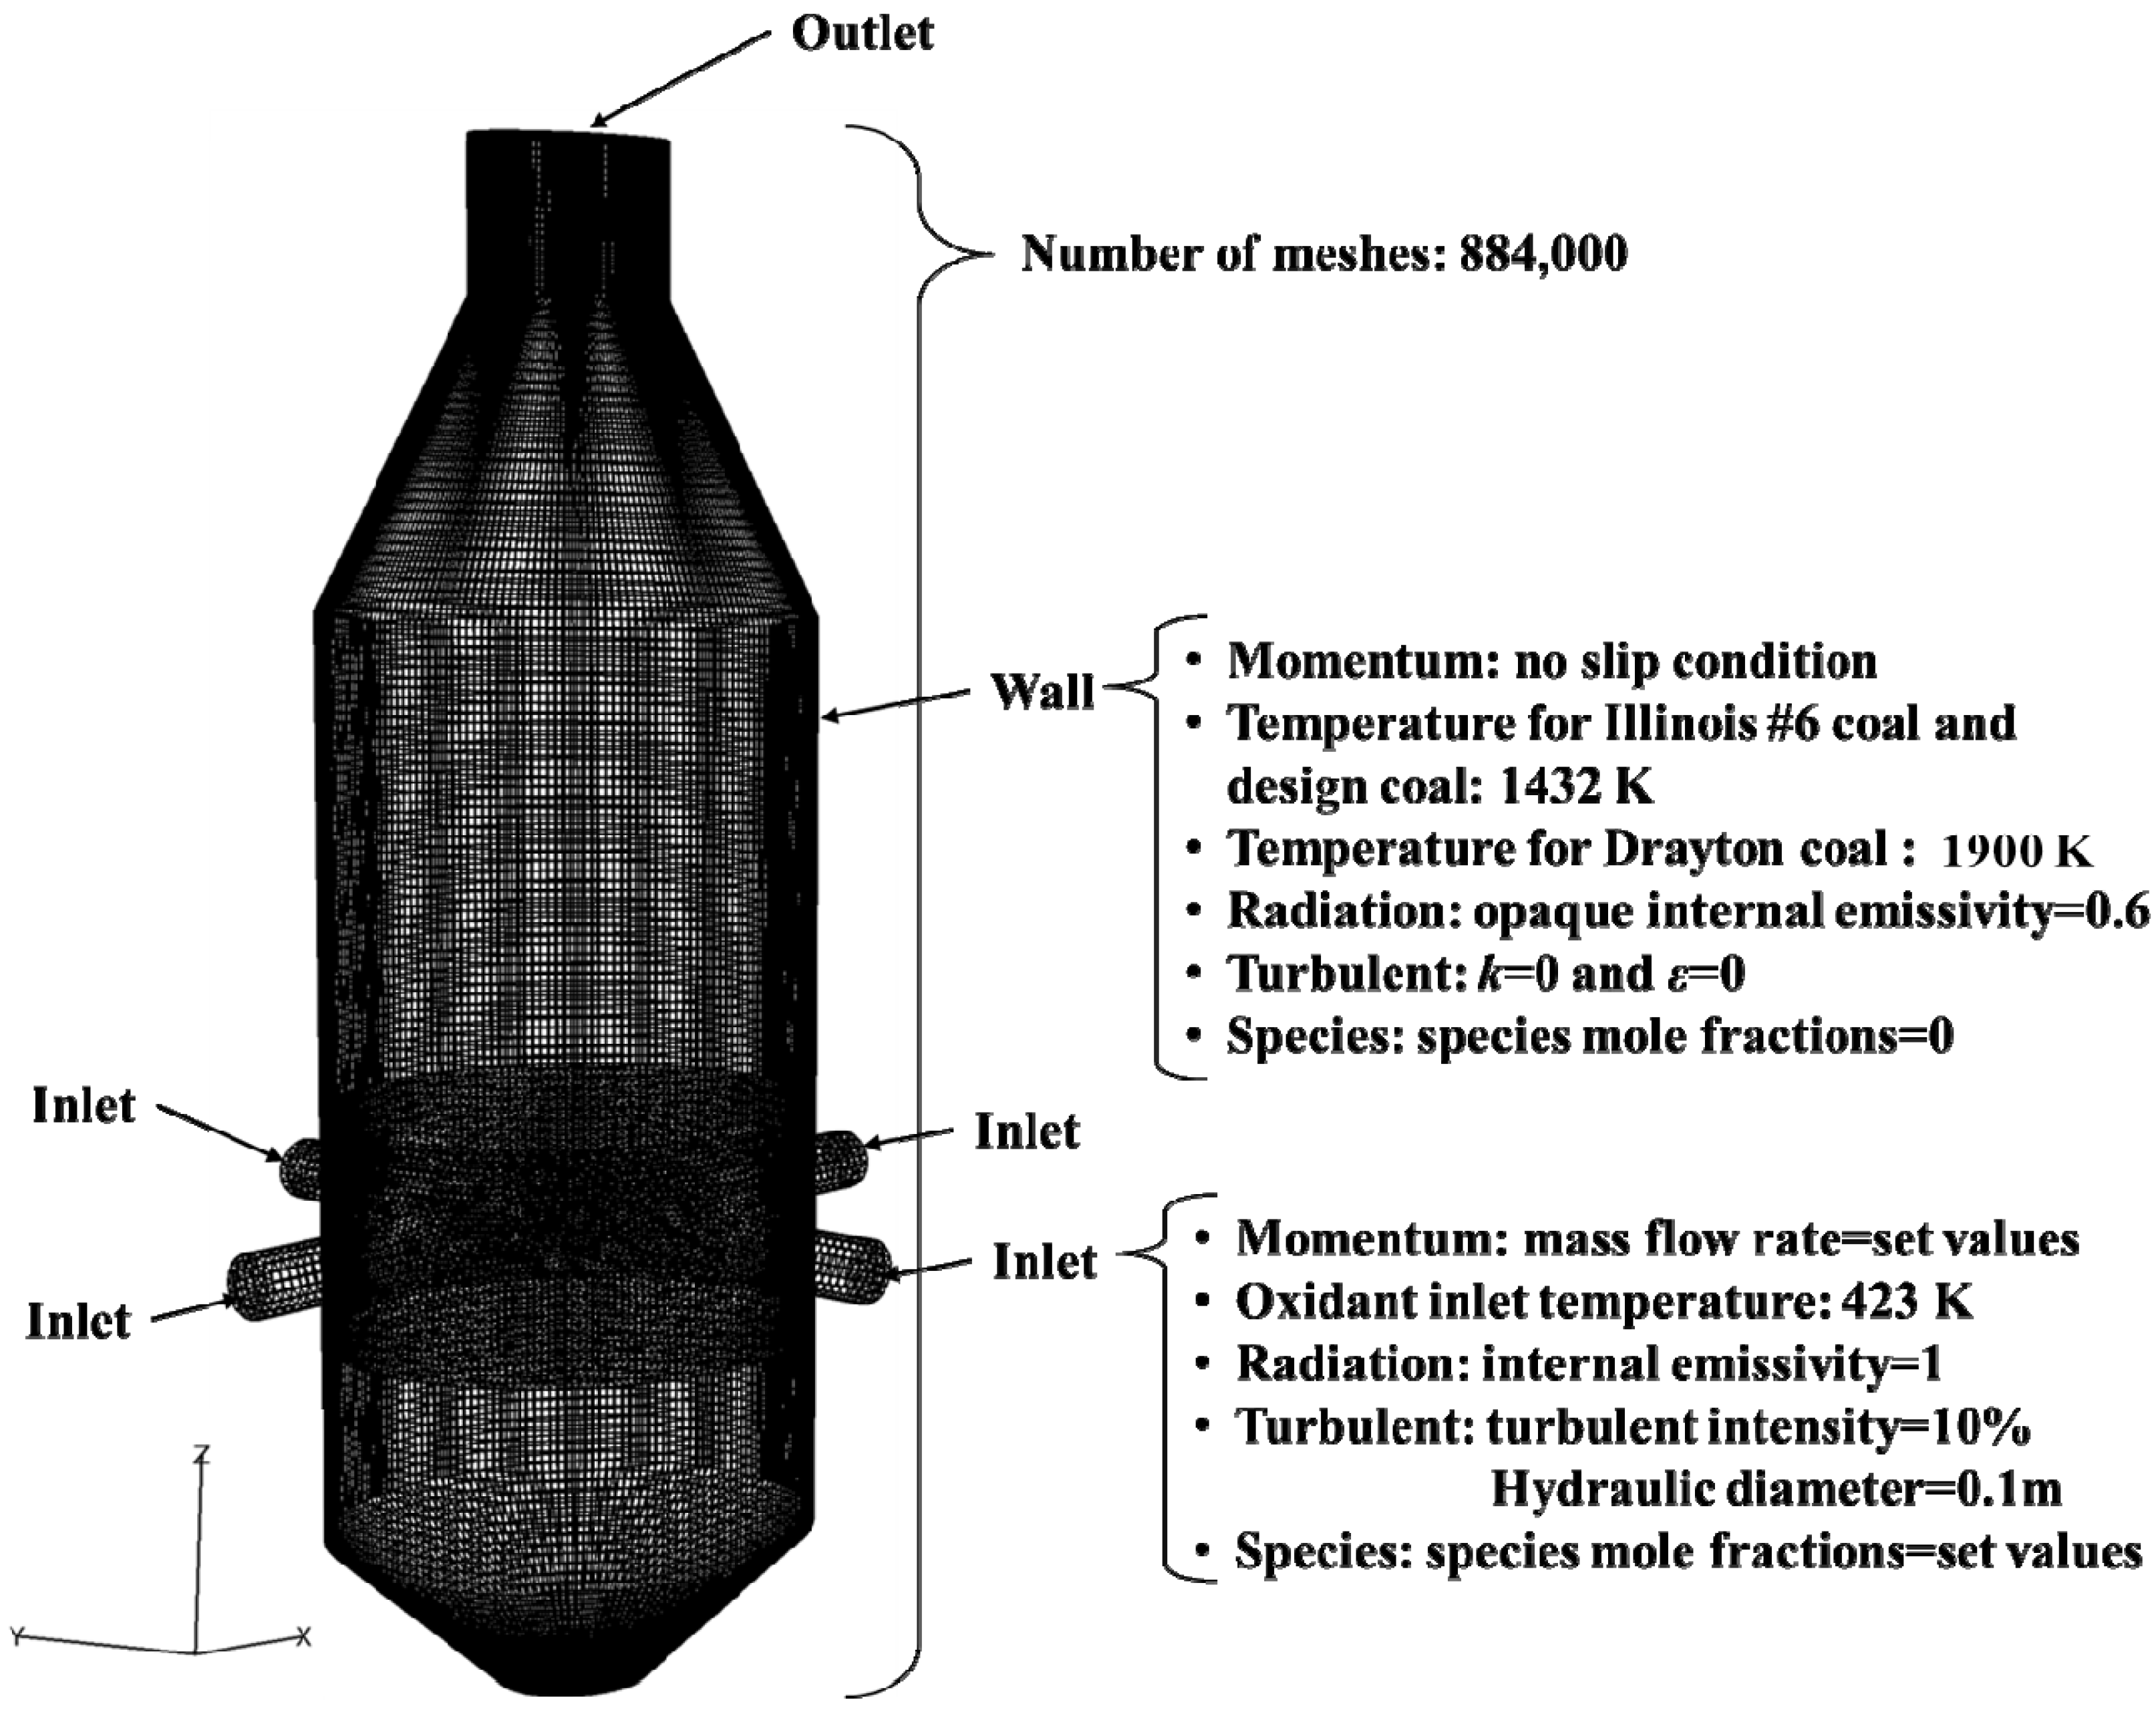
4.2. Numerical Conditions

4.2.1. Drayton Coal

The mixture of O2, N2, and steam with coal was injected to the model gasifier. The feed rate, size, and inlet temperature of coal particles were 1889 tons/day, 100 μm, and 423 K, respectively. The pressure for the model gasifier was 2.6 MPa. These values were obtained from previous literature [42]. In this study, the O2/coal and steam/coal ratios were 0.88 and 0.07, respectively [42]. The SCGP coal gasifier should be operated under the ash slagging mode. The wall temperature was assumed to be 1900K, which is higher than the ash fusion temperature of Drayton coal [43]. The internal emissivity of the membrane wall was assumed to be 0.6 [27]. The mesh and boundary conditions for numerical analysis are summarized in Figure 2.

4.2.2. Illinois #6 Coal and Design Coal

For Illinois #6 coal, two feeding rates of 2450 tons/day and 1923 tons/day were used. The inlet temperature of coal particles was 423 K. For design coal, the feeding rate and inlet temperature of coal particles were 2450 tons/day and 423 K, respectively. For both coals, the pressure for the model gasifier was 4.2 MPa. These values were suggested by Doosan Heavy Industries & Construction Company [9]. In this study, the O2/coal and steam/coal ratios were 0.1–1.1 and 0.05–0.2, respectively. The N2/coal ratio was 0.112 [9]. The wall temperature was assumed to be 1432K, which is higher than the ash fusion temperature of Illinois #6 coal [44]. The internal emissivity of the membrane wall was assumed to be 0.6 [27].

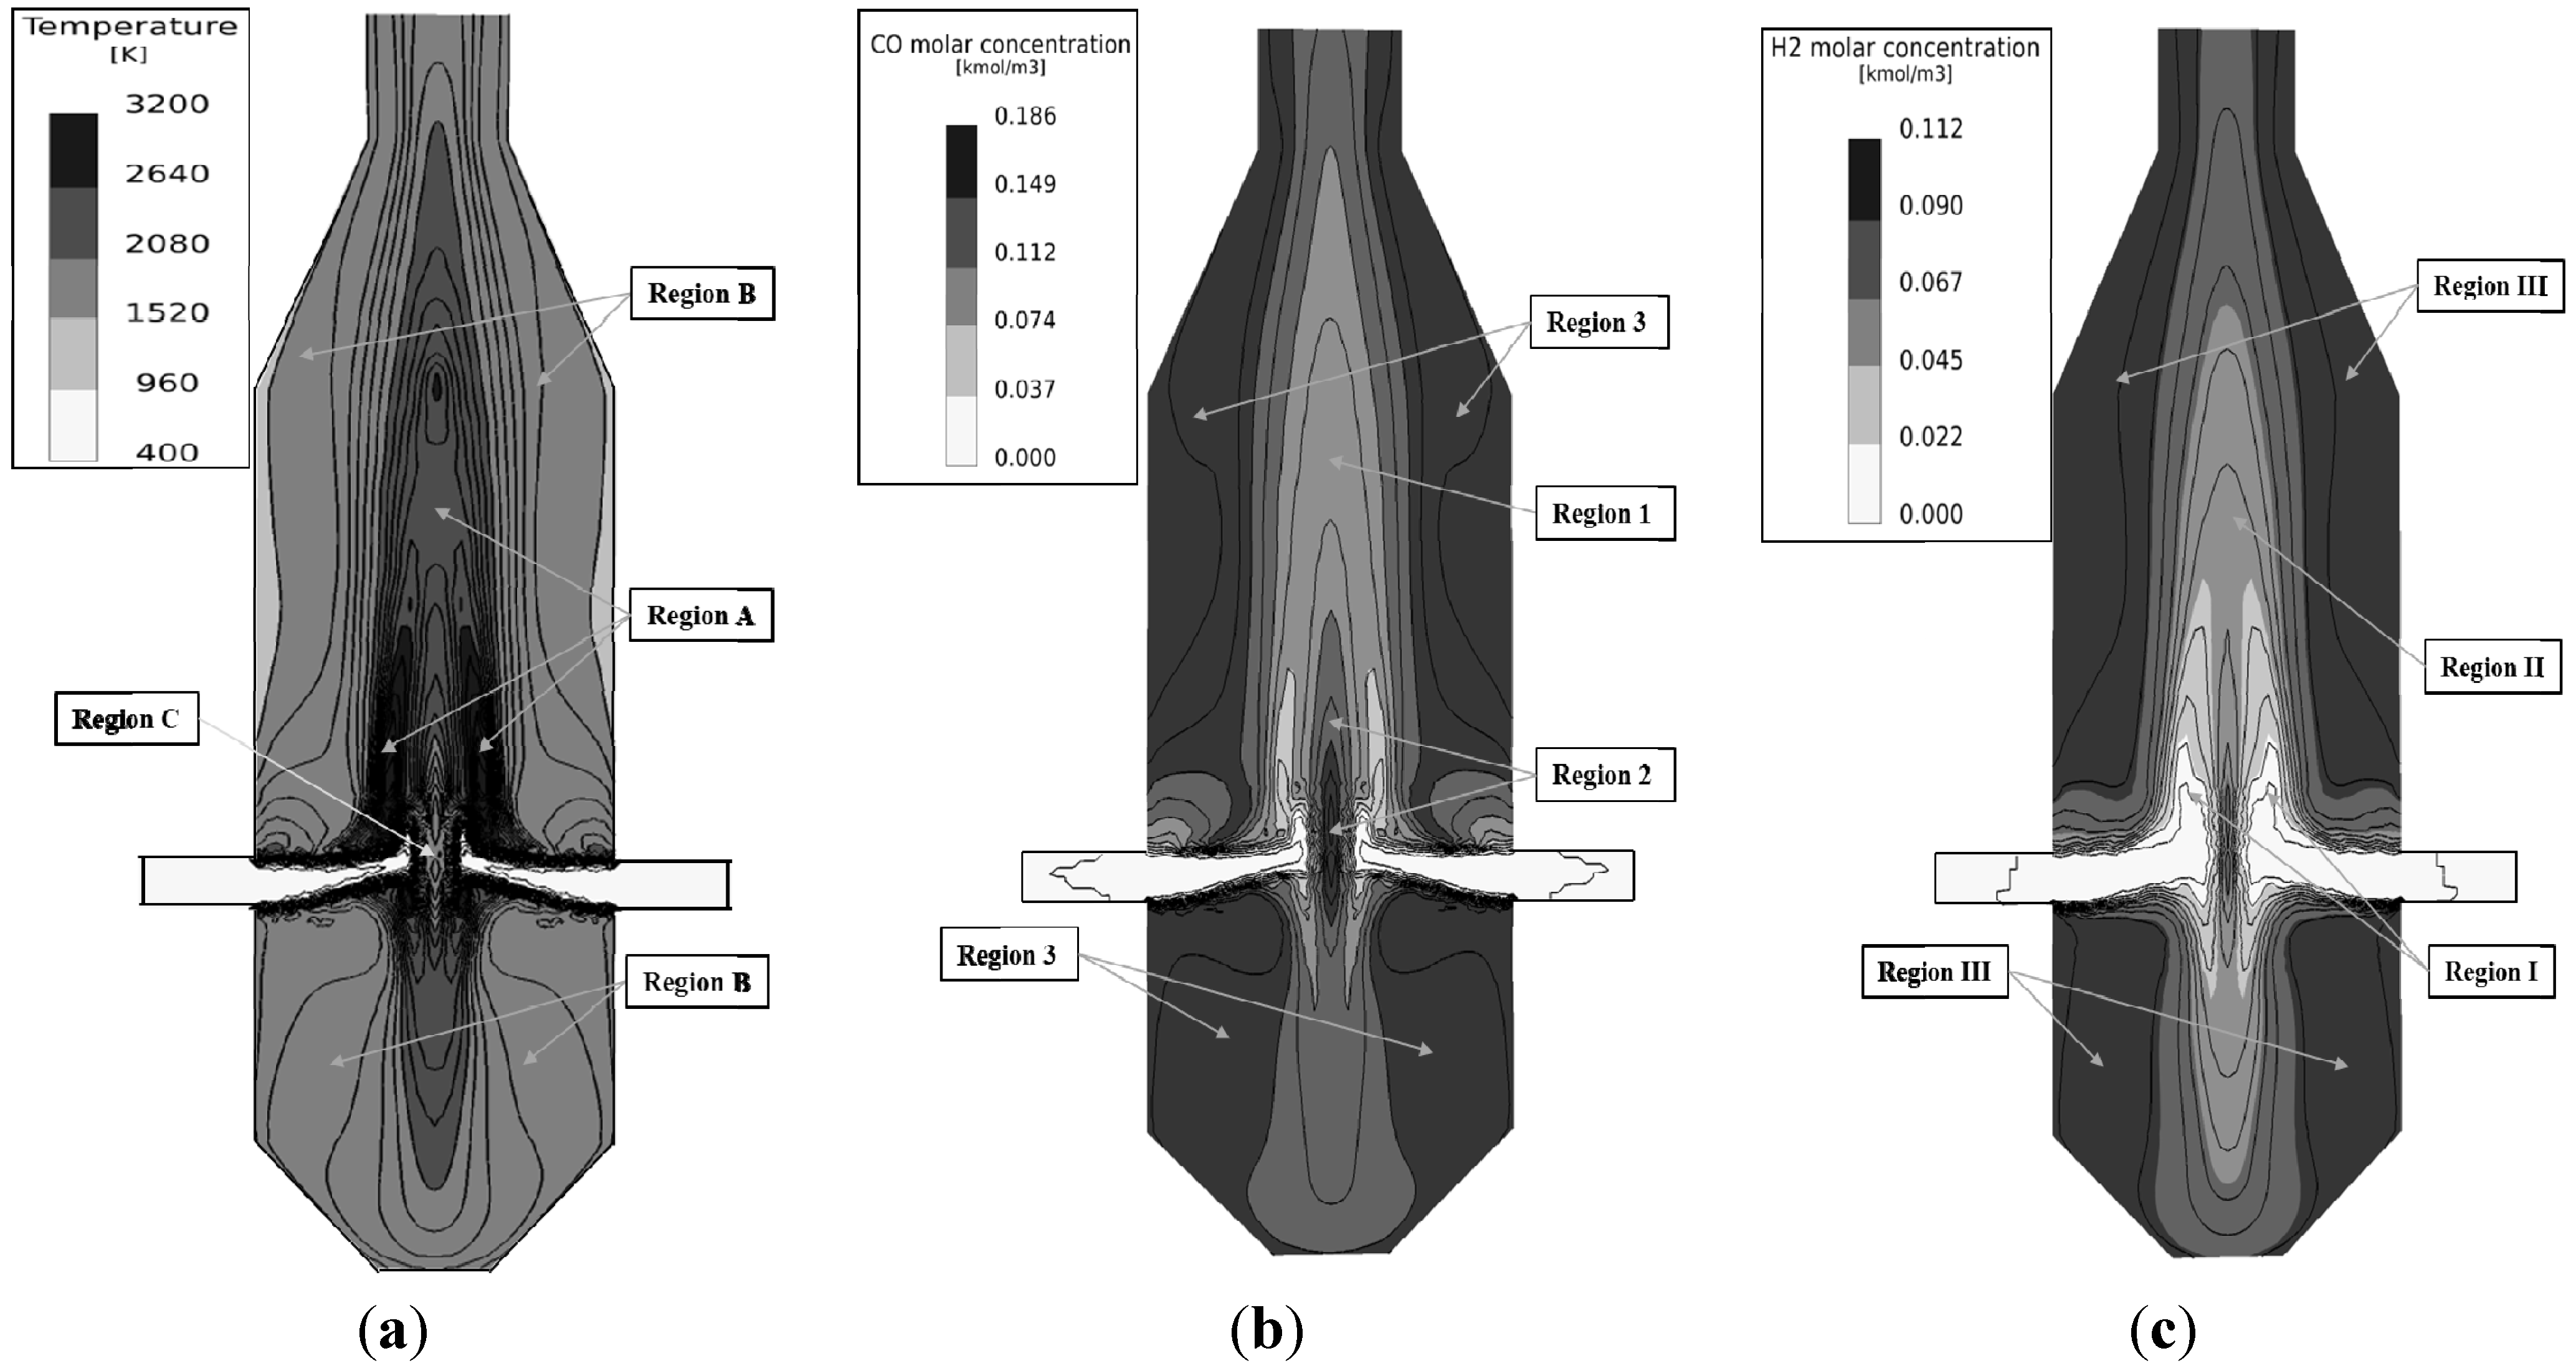
5. Results and Discussion

Three parameters are typically chosen in order to evaluate the performance of a gasifier [45]: Average temperature at the cross-section of the gasifier exit, cold gas efficiency (CGE), and carbon conversion efficiency (CCE). The CGE represents how the higher heating value (HHV) of solid fuel converts to the HHV of gas fuels. The CGE is defined as:
CGE = HHV   of   product   gas HHV   of   feedstock
The CCE represents the conversion ratio of carbon in the gas fuels relative to the total carbon in the solid fuel and is defined as:
CCE = 1 mass   of   carbon   particles   in   outlet mass   of   carbon   particles   in   feedstock
In addition to these three parameters, mole fractions of product gases at the exit were selected in order to evaluate and verify the performance of the SCGP gasifier.
In order to investigate effects of coal size distribution on temperature and mole fractions of product gases at the gasifier exit, calculations were carried out by assuming that the size distribution of Illinois #6 coal follows the Rosin-Rammler distribution. In addition, calculations were performed by assuming that the coal size was uniform as 100 μm. Table 4 shows that these two calculated results are slight different with each other. Therefore, in the following, it was assumed that the coal size was uniform as 100 μm.
Table 4. Effect of coal size distribution on temperature and mole fractions of product gases at the gasifier exit (Feeding rate of coal = 28.35 kg/s).
ContentsSpecific Coal Particle Size (100 μm)Coal Particle Size Distributions (74–297 μm)
Mole Fraction of CO0.57020.5689
Mole Fraction of H20.29670.2755
Mole Fraction of CO20.01880.0315
Mole Fraction of CH40.000760.00095
Mole Fraction of H2O0.03750.0581
Mole Fraction of N20.02130.0329
Exit Temperature (K)18471874

5.1. Verification of Simulation

5.1.1. Drayton Coal

In this CFD analysis, the gas-phase species transport equations were solved via the Finite–Rate/Eddy–Dissipation Model. In order to compare and verify actual operating data from Demkolec demo IGCC facility in Netherlands with CFD results, the CFD calculation were performed for the selected O2/coal and steam/coal ratios (0.88 and 0.07, respectively) [42]. The DO radiation model was used. The product gases (CO, H2, CO2, N2, others), CGE, CCE and temperature at the exit were calculated. Table 5 shows that the CFD analysis results (for 1/4 periodic geometry) were in good agreement with the actual operating data from Demkolec demo IGCC facility. The CFD analysis results for the whole geometry are presented in Supplementary Materials.
Table 5. Comparison of the CFD results with actual operating data from Demkolec demo IGCC facility.
ContentsDemkolec Plant (SCGP Gasifier) [42]CFD Calculation Results
CO (%)63.462.96 (34.19 kg/s)
H2 (%)28.429.23 (1.10 kg/s)
CO2 (%)1.52.62 (2.23 kg/s)
N2 (%)6.24.35 (1.13 kg/s)
Others (%)0.51.84 (1.72 kg/s)
Temperature (K) 2068.65
CGE (%)78.678.29
CCE (%)98–99.599.63
Operating conditionsFeed rate of coal: 21.86 kg/s
O2/coal ratio: 0.885
Steam/coal ratio: 0.071
N2/coal ration: 0.044

5.1.2. Illinois #6 Coal

For the selected O2/coal, steam/coal, and N2/coal ratios (0.798, 0.103, and 0.112, respectively) [28], the flow velocity vectors, particle trajectories, and particle residence times are shown in Figure 3. The DO radiation model was also used. Both gas and particle motions had axisymmetric behaviors. As a stream of coal particles and gases was injected through an inlet, it met another stream injected from the opposite inlet, and some coal particles and gases headed toward the gasifier exit while the others followed downward recirculation flows. This recirculation motion in the lower part of the gasifier led to the longest particle residence time, which was 11.18 s. The average values of particle residence time (the time elapsed for one particle to exit the gasifier once the particle enters the gasifier) were about 3–6 s.
Spatial distributions of temperature, CO molar concentration, and H2 molar concentration in the gasifier are shown in Figure 4. In Figure 4a, temperatures were relatively high in Region A due to the combustion of coal with injected oxygen, while the temperature decreased in Region B due to gasification reactions of char with O2, H2O, and CO2 under the oxidant-starved condition. The temperature was also low in Region C due to devolatilization of coal. Figure 4b shows that the CO molar concentration was therefore lower in Region 1 than in Regions 2 and 3. In Figure 4c, the molar concentration of H2 in Region II was lower than in Regions I and III. The different H2 concentrations among regions can also be explained by temperature differences in those regions.
Figure 3. Distributions of flow velocity and particle residence time (ZA plane, see Figure 1). (a) Flow velocity vector (m/s); (b) Particle trajectories and residence time.
Energies 08 04216 g003
Figure 4. Distributions of temperature, CO, and H2 molar concentrations. (a) Temperature; (b) Molar concentration of CO; (c) Molar concentration of H2.
Energies 08 04216 g004
Finally, the CFD analysis results were compared with two different ASPEN Plus results introduced in a report of NETL, where Illinois #6 coal was used [28]. The mole fractions of product gases at the gasifier exit were calculated, as were the CCE and exit temperature. Table 6 shows that the CFD analysis results were in good agreement with ASPEN Plus calculation results.
Table 6. Comparison of the CFD results with ASPEN Plus results of NETL report.
ContentsOur CFD ResultsOur ASPEN Plus ResultsASPEN Plus Results of NETL [28]Our CFD ResultsOur ASPEN Plus ResultsASPEN Plus Results of NETL [28]
Mole Fraction of CO0.57020.54210.57970.50160.49070.5187
Mole Fraction of H20.29670.31710.30060.28140.29810.2691
Mole Fraction of CO20.01880.02380.01430.04120.05140.0126
Mole Fraction of CH40.000760.000310.00060.000230.000170.0005
Mole Fraction of H2O0.03750.01070.02520.09850.11530.1278
Mole Fraction of N20.02130.01590.05670.03120.01350.0507
Others0.054740.090090.02290.045870.030830.0206
Exit Temperature (K)1846.551850 (Calculation temperature)1850.151887.421895 (Calculation temperature)1895.15
CCE (%)99.3-99.599.7-99.8
CGE (%)78.7-79.577.1-78.1
Operating conditionsFeed rate of coal: 28.35 kg/sFeed rate of coal: 22.26 kg/s
O2/coal ratio: 0.798O2/coal ratio: 0.881
Steam/coal ratio: 0.103Steam/coal ratio: 0.127
N2/coal ration: 0.112N2/coal ration: 0.165
CoalIllinois #6 coal
To understand the effect of gas-phase chemical reactions on the CFD results, additional calculations were conducted using the Eddy–Dissipation Model. Figure 5 shows that the effect of gas-phase chemical reactions on the mole fractions of CO, H2, CO2, and H2O at the gasifier exit was negligible. This negligible effect can be explained with the Damköhler number (Da). When chemical reaction rates are fast in comparison with fluid mixing rates (convective mass transport regime), Da is greater than unity. Conversely, when the reaction rates are slow in comparison with mixing rates (reaction rate regime), Da is lower than unity. The CFD analysis showed that the average temperature in the gasifier was 1855 K, leading to Da > 1. Consequentially, the turbulent mixing rate was more dominant than the chemical reaction rate in the CFD analysis.
Figure 5. Effect of gas-phase chemical reactions on product yields.
Energies 08 04216 g005

5.1.3. Design Coal

For the SCGP gasifier in Korea, kinetic-based calculation was carried out by using ASPEN Plus and CFD analysis by using ANSYS FLUENT. The DO radiation model was used. The O2/coal ratio varied between 0.1 and 1.1, while the steam/coal and N2/coal ratios were 0.05 and 0.112, respectively. The amounts of O2 and N2 varied since the amount of coal was fixed in this study. The mole fractions of CO, CO2, H2, and H2O determined from both CFD analysis and kinetic-based calculation are shown in Figure 6. In the kinetic-based calculation, reaction temperatures were assumed to be 1200–2611 K, which were obtained from the CFD analysis of exit temperatures for O2/coal ratios of 0.1–1.1, respectively. The kinetic-based calculation results using APSEN Plus were in good agreement with those of the CFD analysis.
In Figure 6a, H2 mole fractions determined from both the kinetic-based calculation and CFD analysis decreased with increasing the O2/coal ratio from 0.1 to 0.5, while they did not change for O2/coal ratios higher than 0.5. In Figure 6b, H2O mole fractions for the kinetic-based calculation and CFD analysis were nearly zero (0.001 or so). The reason was that the injected amount of H2O used for the case of design coal was lower (steam/coal ratio: 0.05) than that used for the case of Illinois #6 coal (steam/coal ratio: 0.103). In the simulation, the following reactions were considered; CO + H2O → CO2 + H2, CH4 + H2O → CO + 3H2, C6H6 + 5H2O → 5CO + 6H2 + CH4, as well as C(s) + H2O → CO + H2. Therefore, the injected H2O was exhausted and thus the remaining H2O mole fraction was nearly zero.
Both the CFD analysis and kinetic-based calculation show that for O2/coal ratios of 0.1–0.5, the reaction of C(s) + 0.5O2 → CO mainly occurred because of insufficient O2, resulting in an increasing CO mole fraction with the O2/coal ratio. For O2/coal ratios higher than 0.5, however, the CO mole fraction decreased while the CO2 mole fraction increased (see Figure 6c,d) because the reaction of C(s) + O2 → CO2 occurred with increasing O2.
Figure 6. Comparison between CFD and ASPEN Plus results.
Energies 08 04216 g006

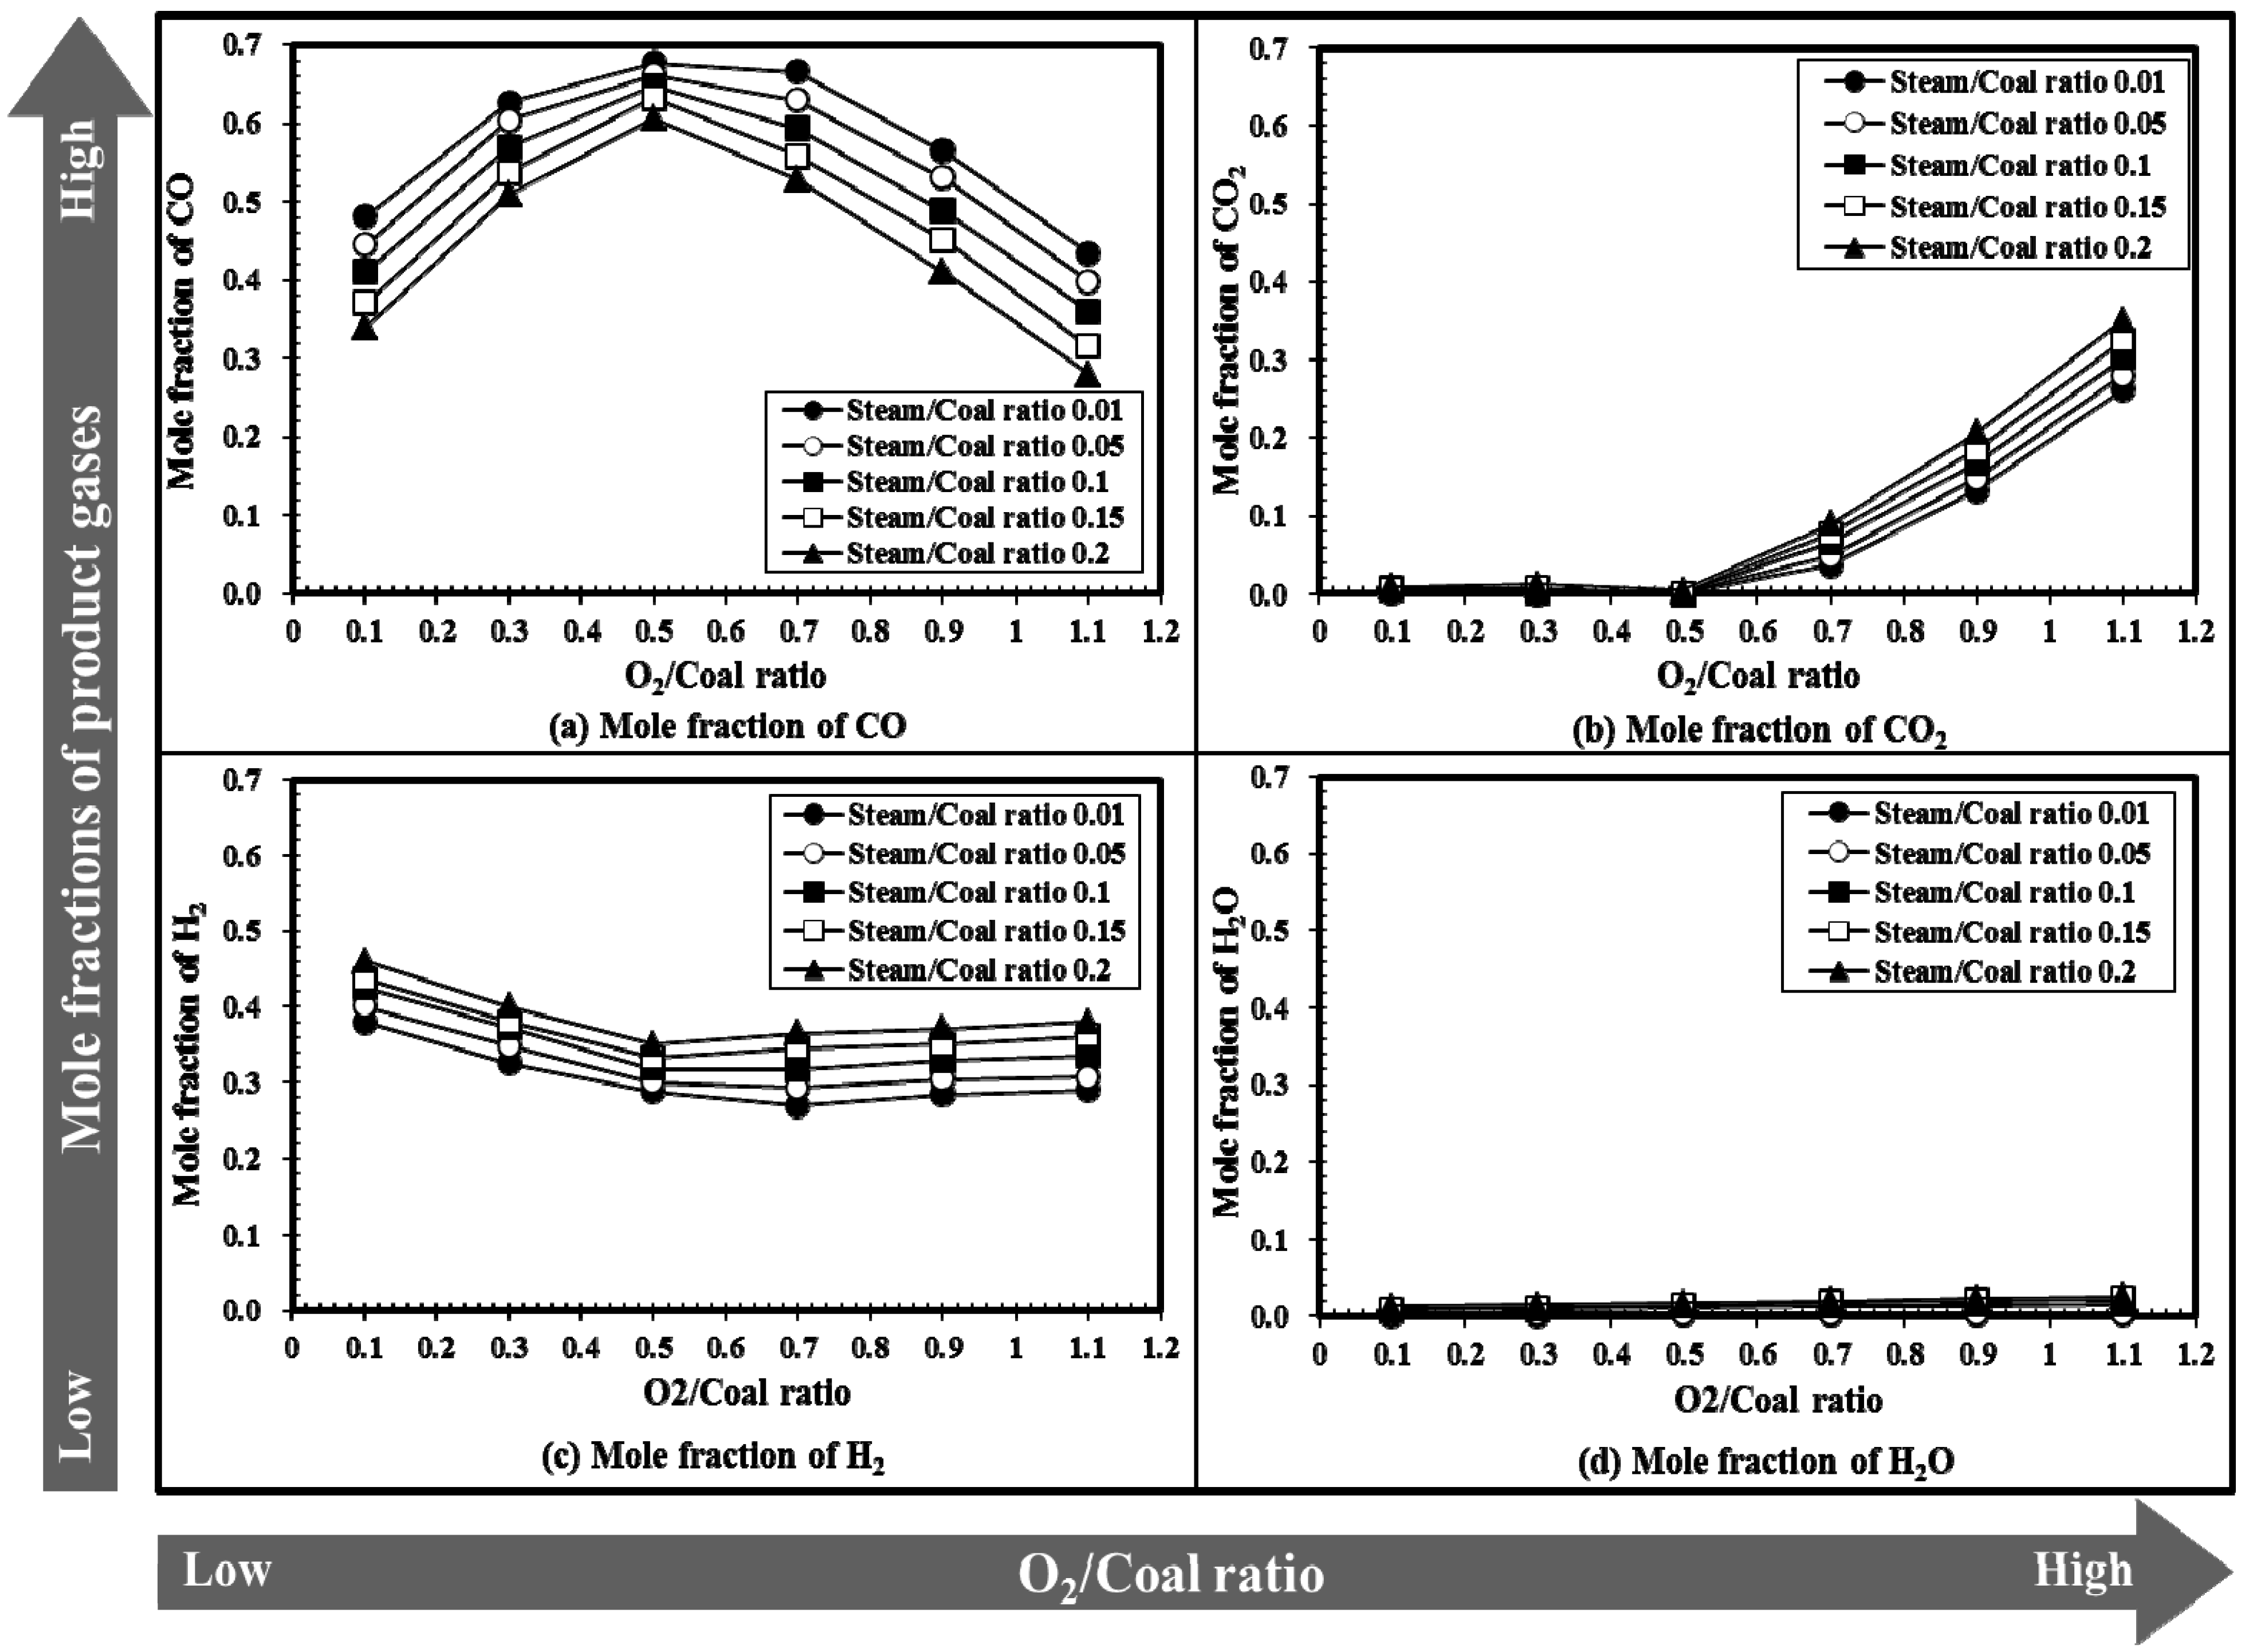
5.2. Effects of O2/Coal and Steam/Coal Ratios (Design Coal)

In the previous sections, the CFD analysis was validated with plant operating data (using Drayton coal) and a kinetic-based calculation (using Illinois #6 coal and design coal). In this section, a parametric study was carried out using design coal for the SCGP gasifier in Korea with various O2/coal ratios and steam/coal ratios and the results are discussed.
Figure 7 shows that the exit temperature of the gasifier increased with increasing O2/coal ratio since the increasing O2 increased the exothermic reaction. Elliott et al. reported that ash, which remains when coal is gasified via the IGCC process, can melt at 1673–1773 K [46]. Therefore, the exit temperature of a gasifier should be maintained at a temperature higher than ~1800 K. The exit temperature gradually decreased with increasing steam/coal ratio since the endothermic carbon-steam gasification reaction took place. This is confirmed by the fact that at high O2/coal, where hydrogasification plays a minor role, the temperature change decreased till collapsing at the same value for O2/coal >1.1.
Figure 7. Temperature at outlet with respect to O2/coal and steam/coal ratios.
Energies 08 04216 g007
Mole fractions of CO, CO2, and H2 with different O2/coal and steam/coal ratios are shown in Figure 8. For O2/coal ratios of 0.1–0.5, the reactions of C(s) + 0.5O2 → CO (oxygen gasification), C(s) + CO2 → 2CO (Bouduard reaction), and C(s) + H2O → CO + H2 (hydrogasification) occurred owing to insufficient O2, resulting in an increasing CO mole fraction with the increasing O2/coal ratio. For O2/coal ratios higher than 0.5, however, the CO mole fraction decreased while the CO2 mole fraction increased (see Figure 8a,b) due to the reaction of C(s) + O2 → CO2 with increasing O2. In Figure 8c, the H2 mole fraction decreased with increasing O2/coal ratio 0.1–0.5 by reaction of H2 + 0.5O2 → H2O, and then that gradually increased with O2/coal ratios higher than 0.5 by reactions of CO + H2O → CO2 + H2 and C(s) + H2O → CO + H2. In Figure 8d, the H2O mole fraction did not change for increasing O2/coal ratios. The CO mole fraction gradually decreased with increasing steam/coal ratio, while H2 and CO2 mole fractions gradually increased with increasing steam/coal ratio. This phenomenon can be explained by the forward water gas shift reaction (CO + H2O → H2 + CO2). The H2O mole fraction increased with increasing steam/coal ratio due to increasing amount of steam.
The effects of O2/coal and steam/coal ratios on CCE and CGE are shown in Figure 9. The CCE increased with increasing O2/coal ratio 0.1–0.7 and reached 99.0% at O2/coal ratios higher than 0.7 (see Figure 9a). On the other hand, the CGE increased with increasing O2/coal ratio 0.1–0.7, but decreased at O2/coal ratios higher than 0.7. This CGE result can be explained by the CO and CO2 mole fractions in Figure 8a,b. CCE did not change much with increasing steam/coal ratios while CGE gradually increased with increasing steam/coal ratio due to gradual increase in H2 mole fraction caused by water gas shift reaction as well as steam gasification reaction of char (C(s) + H2O → CO + H2). Considering temperature and CGE at gasifier exit, the optimal steam/coal ration in the SCGP gasifier in Korea is considered as 0.05 for O2/coal ratio 0.7.
Figure 8. Mole fractions of CO, CO2, H2, and H2O with the O2/coal and steam/coal ratios.
Energies 08 04216 g008
Figure 9. Efficiencies at outlet with respect to the O2/coal and steam/coal ratios. (a) Carbon conversion efficiency (CCE); (b) Cold gas efficiency (CGE).
Energies 08 04216 g009aEnergies 08 04216 g009b
Water tube membrane is used as the outside wall of the SCGP gasifier. Hence, the heat flux at the wall is an important parameter to determine stable operation of the SCGP gasifier. The effects of O2/coal and steam/coal ratios on wall heat flux are shown in Figure 10. The wall heat flux increased with increasing O2/coal ratio due to exothermic reaction with increasing O2 amount, while decreased with increasing steam/coal ratio due to cooling effect by injecting additional steam at a temperature of 423 K. Low or negative wall heat flux values for low O2/coal ratios imply endothermic reaction by insufficient O2 supply.
Figure 10. Wall heat flux of gasifier.
Energies 08 04216 g010

6. Conclusions

This paper disclosed, for the first time, three-dimensional CFD modeling results of gasification performance in a one-stage entrained-bed coal gasifier (SCGP gasifier), after careful verification and comparison with actual plant operating data and ASPEN Plus calculations, respectively. After the validation, design coal for the SCGP gasifier in Korea was used for parametric study with various O2/coal and steam/coal ratios. Carbon conversion efficiency, cold gas efficiency, temperature, and species mole fractions at the gasifier exit were calculated, as were spatial distributions of temperature and species concentrations. Optimal O2/coal and steam/coal ratios for the SCGP gasifier using design coal were found to be 0.7 and 0.05, respectively, for the selected operating conditions.

Acknowledgments

This work was supported by a grant from the Converged Energy Materials Research Center (CEMRC), funded by the Agency for Defense Development (NE-31).

Author Contributions

Sang Shin Park performed 3-D modeling for parametric study and Aspen Plus calculation; Hyo Jae Jeong advised and recommended appropriate model for 3-D modeling; Jungho Hwang conceived the project and obtained the financial support; Sang Shin Park and Jungho Hwang wrote the paper.

Supplementary Materials

Supplementary materials can be accessed at: https://www.mdpi.com/1996-1073/8/5/4216/s1.

Conflicts of Interest

The authors declare no conflict of interest.

References

  1. Yun, Y.S.; You, Y.D.; Chung, S.W. Selection of IGCC candidate coals by pilot scale gasifier. Fuel Process. Technol. 2007, 88, 107–116. [Google Scholar] [CrossRef]
  2. Shinada, O.; Yamada, A.; Koyama, Y. The development of advanced energy technologies in Japan IGCC: A key technology for the 21st century. Energy Convers. Manag. 2002, 43, 1221–1233. [Google Scholar] [CrossRef]
  3. Necille, A.; Holt, H. Operating experience and improvement opportunities for coal-based IGCC plants. Mater. High Temp. 2003, 20, 112–122. [Google Scholar]
  4. Liebner, W.; Hauser, N. Optimizing costing study for a 500 MW IGCC power plant based on Shell Gasification Gasification Process. In Proceedings of the Electric Power Research Institute (EPRI) Gasification Conference, San Francisco, CA, USA, 2–4 October 1996.
  5. Chen, C.J.; Hung, C.I.; Chen, W.H. Numerical investigation on performance of coal gasification under various. Appl. Energy 2012, 100, 218–228. [Google Scholar] [CrossRef]
  6. Zhang, G.; Yang, Y.; Jin, H.; Xu, G.; Zhang, K. Proposed combined-cycle power system based on oxygen-blown coal partial gasification. Appl. Energy 2012, 102, 735–745. [Google Scholar] [CrossRef]
  7. HM Associate Inc.; Princeton Energy Resources International LLC.; TFB Consulting. Assessment of the Commercial Potential for Small Gasification Combined Cycle and Fuel Cell Systems Phase II Final Draft Report; U.S. Department of Energy Office of Fossil Energy Office of Coal and Power Systems: Washington, DC, USA, 2003. [Google Scholar]
  8. U.S. Government Printing Office. Gasification Markets and Technologies—Present and Future: An Industry Perspective; U.S. Government Printing Office: Washington, DC, USA, 2002.
  9. Lee, H.; Choi, S.; Paek, M. A simple process modelling for a dry-feeding entrained bed coal gasifier. Proc. Inst. Mech. Eng. A J. Power Energy 2011, 225, 74–84. [Google Scholar] [CrossRef]
  10. Lee, H.H.; Lee, J.C.; Joo, Y.J.; Oh, M.; Lee, C.H. Dynamic modeling of Shell entrained flow gasifier in an integrated gasification combined cycle process. Appl. Energy 2014, 131, 425–440. [Google Scholar] [CrossRef]
  11. Gazzani, M.; Manzolini, G.; Macchi, E.; Ghoniem, A.F. Reduced order modeling of the Shell-Prenflo entrained flow gasifier. Fuel 2013, 104, 822–837. [Google Scholar] [CrossRef]
  12. Monaghan, R.F.D.; Ghoniem, A.F. A dynamic reduced order model for simulating entrained flow gasifiers. Part II: Model validation and sensitivity analysis. Fuel 2012, 94, 280–297. [Google Scholar] [CrossRef]
  13. Monaghan, R.F.D.; Ghoniem, A.F. A dynamic reduced order model for simulating entrained flow gasifiers. Part I: Model development and description. Fuel 2012, 91, 61–80. [Google Scholar] [CrossRef]
  14. Chen, C.X.; Horio, M.; Kojima, T. Numerical simulation of entrained flow coal gasifiers. Part I: Modeling of coal gasification in an entrained flow gasifier. Chem. Eng. Sci. 2000, 55, 3861–3874. [Google Scholar] [CrossRef]
  15. Watanabe, H.; Otaka, M. Numerical simulation of coal gasification in entrained flow coal gasifier. Fuel 2006, 85, 1935–1943. [Google Scholar] [CrossRef]
  16. Slezak, A.; Kuhlman, J.M.; Shadle, L.J.; Spenik, J.; Shi, S. CFD simulation of entrained-flow coal gasification: Coal particle density/size fraction effects. Powder Technol. 2010, 203, 98–108. [Google Scholar] [CrossRef]
  17. Sun, Z.; Dai, Z.; Zhou, Z.; Guo, Q.; Yu, G. Numerical simulation of industrial opposed multi-burner coal-water slurry entrained flow gasifier. Ind. Eng. Chem. Res. 2012, 51, 2560–2569. [Google Scholar] [CrossRef]
  18. Luan, Y.T.; Chyou, Y.P.; Wang, T. Numerical analysis of gasification performance via finite-rate model in a cross-type two-stage gasifier. Int. J. Heat Mass Transf. 2013, 57, 558–566. [Google Scholar] [CrossRef]
  19. Kumar, M.; Ghoniem, A.F. Multiphysics simulations of entrained flow gasification. Part I: Validating the nonreacting flow solver and the particle turbulent dispersion model. Energy Fuels 2012, 26, 451–463. [Google Scholar] [CrossRef]
  20. Kumar, M.; Ghoniem, A.F. Multiphysics simulations of entrained flow gasification. Part II: Constructing and validating the overall model. Energy Fuels 2012, 26, 464–479. [Google Scholar] [CrossRef]
  21. Abani, N.; Ghoniem, A.F. Large eddy simulations of coal gasification in an entrained flow gasifier. Fuel 2013, 104, 664–680. [Google Scholar] [CrossRef]
  22. Seggiani, M. Modelling and simulation of time varying slag flow in a Prenflo entrained-flow gasifier. Fuel 1998, 77, 1611–1621. [Google Scholar] [CrossRef]
  23. Ye, I.S.; Park, S.; Ryu, C.; Park, S.K. Flow and heat transfer characteristics in the syngas quench system of a 300 MWe IGCC process. Appl. Therm. Eng. 2013, 58, 11–21. [Google Scholar] [CrossRef]
  24. Hong, J.; Jeong, H.J.; Song, J.; Hwang, J. Numerical study on the 300 MW Shell-type one-stage entrained flow coal gasifier applied with 4-layer slagging model. Trans. Korean Soc. Combust. 2012, 17, 1–11. [Google Scholar]
  25. Hong, J.; Park, S.S.; Song, J.; Hwang, J. Numerical study on 300 MW Shell-type one-stage entrained flow bed gasifier: Effect of coal biomass blending ratio on CO2 gasification. Trans. Korean Hydrog. New Energy Soc. 2012, 23, 274–284. [Google Scholar] [CrossRef]
  26. Jeong, H.J.; Seo, D.K.; Hwang, J. CFD modeling for coal size effect on coal gasification in a two-stage commercial entrained-bed gasifier with an improved char gasification model. Appl. Energy 2014, 123, 29–36. [Google Scholar] [CrossRef]
  27. Ma, J.; Zitney, S.E. CFD modeling of entrained-flow gasifiers with improved physical and chemical submodels. Energy Fuels 2012, 26, 7195–7219. [Google Scholar] [CrossRef]
  28. National Energy Technology Laboratory, U.S. Government Printing Office. Cost and Performance Baseline for Fossil Energy Plants Volume 1: Bituminous Coal and Natural gas to Electricity; National Energy Technology Laboratory, U.S. Government Printing Office: Pittsburgh, PA, USA, 2010.
  29. ANSYS Inc. ANSYS FLUENT User’s Guide, Release 14.0; ANSYS Inc.: Canonsburg, PA, USA, 2011. [Google Scholar]
  30. Silaen, A.; Wang, T. Effects of fuel injection angles on performance of a two-stage coal gasifier. In Proceedings of the 23th Annual International Pittsburgh Coal Conference, Pittsburgh, PA, USA, 25–28 September 2006.
  31. Tomeczek, J. Coal Combustion; Krieger Publishing Company Inc.: Malabar, FL, USA, 1994. [Google Scholar]
  32. Gomez-Barea, A.; Leckner, B. Modeling of biomass gasification in fluidized bed. Prog. Energy Combust. Sci. 2010, 36, 444–509. [Google Scholar] [CrossRef]
  33. Westbrook, C.K.; Dryer, F.L. Simplified reaction mechanisms for the oxidation of hydrocarbon fuels in flames. Combust. Sci. Technol. 1981, 27, 31–43. [Google Scholar] [CrossRef]
  34. Jones, W.P.; Lindstedt, R.P. Global reaction schemes for hydrocarbon combustion. Combust. Flame 1988, 73, 233–249. [Google Scholar] [CrossRef]
  35. Bustanmante, F.; Enick, R.M.; Killmeyer, R.P.; Howard, B.H.; Rothenberger, K.S.; Cugini, A.V.; Morreale, B.D.; Ciocco, M.V. Uncatalyzed and wall-catalyzed forward water-gas shift reaction kinetics. AIChE J. 2005, 51, 1440–1454. [Google Scholar] [CrossRef]
  36. Jess, A. Mechanisms and kinetics of thermal reactions of aromatic hydrocarbons from pyrolysis of solid fuels. Fuel 1996, 75, 1441–1448. [Google Scholar] [CrossRef]
  37. Turns, S.R. An Introduction to Combustion, Concepts and Applications, 2nd ed.; McGraw-Hill: Singapore, 2006. [Google Scholar]
  38. Virks, P.S.; Chambers, L.E.; Woebcke, H.N. Thermal hydrogasification aromatic compounds. Adv. Chem. Ser. 1974, 131, 237–258. [Google Scholar]
  39. Petersen, I.; Werther, J. Experimental investigation and modeling of gasification of sewage sludge in the circulating fluidized bed. Chem. Eng. Process. 2005, 44, 717–736. [Google Scholar] [CrossRef]
  40. Freund, H. Gasification of carbon by CO2: A transient kinetics experiment. Fuel 1986, 65, 63–66. [Google Scholar] [CrossRef]
  41. Ni, J.; Liang, Q.; Zhou, Z.; Dai, Z.; Yu, G. Numerical and experimental investigations on gas-particle flow behaviors of the ppposed multi-burner gasifier. Energy Conver. Manag. 2009, 50, 3035–3044. [Google Scholar] [CrossRef]
  42. Eurlings, J.T.G.M.; Ploeg, J.E.G. Process performance of the SCGP at Buggenum IGCC. In Proceedings of the Gasification Technologies Conference, San Francisco, CA, USA, 18–20 October 1999.
  43. Choi, Y.C.; Park, T.J.; Kim, J.H.; Lee, J.G.; Hong, J.C.; Kim, Y.G. Experimental studies of 1 ton/day coal slurry feed type oxygen entrained-flow gasifier. Korean J. Chem. Eng. 2001, 18, 493–498. [Google Scholar] [CrossRef]
  44. Ash Fusion Temperatures. Available online: http://www.et.byu.edu/~larryb/Ash%20Fusion%20Temperatures_1.html (accessed on 10 March 2015).
  45. Bockelie, M.J.; Denison, M.K.; Chen, Z.; Linjewile, T.; Senior, C.L.; Sarofim, A.F. CFD modeling for entrained flow gasifiers in vision 21 systems. In Proceedings of the 19th Annual International Pittsburgh Coal Conference, Pittsburgh, PA, USA, 24–26 September 2002.
  46. Elliott, L.; Wang, S.M.; Wall, T.; Novak, F.; Lucas, J.; Hurst, H.; Patterson, J.; Happ, J. Dissolution of lime into synthetic coal ash slags. Fuel Process. Technol. 1998, 56, 45–53. [Google Scholar] [CrossRef]

