Abstract
The household sector consumes a large amount of goods and services and is therefore a major source of global carbon emissions. This study aims to analyze per person household carbon emission (HCEs) patterns of urban and rural China over the period from 1995 to 2011. Annual macroeconomic data for the study were obtained from authentic Chinese government sources. Direct HCE estimates for each fossil fuel were obtained using the IPCC’s reference approach, and indirect HCEs were calculated by input-output analysis. In 1995, per person HCEs from direct sources for urban and rural China were 0.50 tCO2 and 0.22 tCO2, respectively; by 2011, these values had increased to 0.60 tCO2 and 0.61 tCO2, an increase of 20% and 177.27%, respectively. Similarly, in 1995, per person HCEs from indirect sources for urban and rural China were 0.43 tCO2 and 0.16 tCO2, respectively; by 2011, these values had increased to 1.77 tCO2 and 0.53 tCO2, respectively, an increase of 306% and 235%. The reasons for these differences and the sets of policies required to rectify increasing emissions are discussed. If current trends and practices continue, with a RMB1000 increase in per capita income from 2011 levels, per person HCEs in urban and rural China will increase by 0.119 tCO2 and 0.197 tCO2, respectively. This result indicates that the sector of society which is most vulnerable will contribute most to China’s increasing HCEs. Therefore, while developing energy consumption and emissions reduction policies and programs, principles of fairness and equity need to be followed.
1. Introduction
The household sector consumes a large amount of goods and services [1,2], accounting for >70% of the final consumption expenditure, whereas the government sector accounts for only 30% [3]. Several studies have quantified household consumption patterns for various countries including The Netherlands [4], Denmark [5], India [6], 11 member states of European Union [7], USA [8], Brazil [9], South Korea [10], Japan [11], Spain [12], and China [1,2,13,14,15].
Some of these studies have also reported the ratio of household energy consumption to the national energy consumption. However, these figures have different meaning, in terms of direct or indirect energy consumption; therefore, it is improper to put them together for comparison. For example, in 11 Europe countries, the share of direct energy consumption (e.g., coal, gas, kerosene, and diesel) alone accounted for 34% to 64% [7]; if indirect energy consumption (e.g., food, clothing, medical services, transportation, etc.) was added, these values would amplify significantly.
Since 1979, China’s real gross domestic product (GDP) increased by about 10% per annum; this was mainly due to opening up to foreign trade and investment and implementation of a free market economy [16]. China is currently the world’s second largest economy, largest trading economy, second largest destination of foreign direct investment and the largest manufacturer. This rapid progress has come with costs, such as unprecedented environmental pollution, huge energy consumption, and carbon emissions [17]. China became the world’s largest CO2 emitting country in 2007 and the largest energy consuming country in 2010 [15]. The International Energy Agency [18] has projected that China will consume 70% more energy than the second largest energy consuming country, United States, by 2035. China has been under international pressure to reduce its energy consumption and carbon intensity. In response to the call of the UNFCCC conference in Copenhagen and Cancún, China has pledged to cut its carbon intensity by 40%–45% by 2020 from the 2005 level [17].
Although the household sector in China seems a minor contributor to total CO2 emissions [13], it is still significant as the total amount is massive. Moreover, due to rapidly increasing household incomes, modern lifestyles and altered consumption behaviors, household carbon emission (HCEs) is becoming a pressing issue in China [1,2,3,19]. In fact, China has been in a dilemma; on one hand, they have to encourage consumption for GDP growth and, on the other hand, they need to meet their emission intensity reduction obligations [3,20]. Developing policies and programs for promoting low carbon intensity fuels and changing the consumption behavior of people towards less carbon intensive goods and services will produce a win-win solution.
However, due to differences in incomes, lifestyles and access to different types of fuels [14,21,22], the patterns of consumption of goods and services, and therefore the related carbon emissions, could differ significantly between rural and urban households. Comparing the patterns of direct and indirect HCEs between the urban and rural areas will be very helpful in developing targeted policies and programs for these areas. Moreover, as in many other countries [23], household sizes are decreasing in China [3], although the rate of decrease could differ between urban and rural parts of China. Therefore, per person HCEs could be a more accurate metric for comparing emissions between these two regions.
In this context, this study aims to analyze per person HCEs patterns of urban and rural China over the 17 year period from 1995 to 2011. Urban population in this paper refers to all people residing in legally-defined cities and towns, while rural population refers to the population other than the urban population [24]. Of the total population of 1347.4 million in 2011, 690.8 million people live in urban areas and 565.6 million in rural areas [24]. Per capita building spaces of urban and rural households are 32.7 m2 and 36.2 m2, respectively [24].
2. A Brief Snapshot of China’s Emission Reduction Policy
In order to meet the 40%–45% carbon intensity reduction target by 2020, China has set an interim target of a 17% reduction in carbon intensities from 2011 to 2015, also called as 12th five-year plan target [17]. By the end of 2013, the overall carbon intensity of the Chinese economy has fallen about 10% from 2010 levels, indicating a slow progress towards its goal. Therefore, China has a daunting task ahead to meet its carbon intensity target.
Due to massive economic growth, energy demand in China has been increasing exponentially. China had 66 GW of installed electricity generation capacity in 1980; this had increased to 1100 GW by 2011 [25], an increase of 1575%. In order to reduce greenhouse gas emissions from energy consumption, China has adopted very aggressive policies on renewables and coals [26]. Currently, China is the world leader in hydro (45% of the world total), wind and solar power generation [27]. In 2012 alone, China invested >US$67 billion (>25% of the world total) in renewable energy [28]. The year 2013 was even more impressive; about 94 GW of new power capacity was added to the electric grid. As a result, for the first time, renewable energy expansion outpaced coal expansion in China [29]. In fact, China’s renewable energy addition (56.4 GW) in 2013 is equivalent to the 68.7% and 60.6% of the entire national electric capacity of South Korea (82 GW) and the United Kingdom (93 GW), respectively [30].
This is all because of the very effective Renewable Energy Law (2005). China subsidizes renewable energy by a fee, charged to all electricity users in China, of about 0.029 cents/kWh [25]. As a result of this policy: (1) installed wind power capacity gone from 0.567 GW in 2003 to 91 GW in 2013; (2) installed solar PV capacity rose from 0.14 GW in 2009 to 19 GW in 2013; and (3) installed hydropower capacity increased from 117 GW in 2005 to 200 GW in 2010. China has an even more aggressive target to increase its wind, solar, and hydropower capacity to 200 GW, 50 GW, and 380 GW, respectively, by 2020 [25].
Moreover, China is implementing annual non-binding caps on coal consumption and domestic coal production at 4 billion tonnes and 3.9 billion tonnes, respectively [31]. As a result, over the last decade, emissions intensity from electricity generation in China has reduced by 16%, while, by comparison, the reduction in Australia has been <4% [27]. China has also implemented fuel economy standards for passenger vehicles in its three largest cities, Shanghai, Guangzhou, and Beijing, and is planning to expand this to cover more cities [31]. In addition, in order to achieve carbon intensity reduction target in a cost effective way and achieve sustainable development, China has recently started national emission trading scheme (ETS).
3. Methodology
3.1. Data Sources
This study relies on macro-economic data for China between 1995 and 2011. Annual data for urban and rural areas such as household size, per capita income, population, and household consumption of different types of direct and indirect good and services were obtained from 17 volumes of: (1) China Statistical Yearbook from 1996 to 2012 [24,32,33,34,35,36,37,38,39,40,41,42,43,44,45,46,47]; and (2) China Population and Employment Statistical Yearbook from 1996 to 2012 [48,49,50,51,52,53,54,55,56,57,58,59,60,61,62,63,64].
Household goods and services which are related to direct and indirect HCEs are termed as direct and indirect goods and services, respectively [1]. Direct household goods and services considered in this study are: raw coal; washed coal; molded coal; cooking coal; coke oven gas; other gas; gasoline; kerosene; diesel; liquid petroleum gas (LPG); natural gas; and electric power, whereas indirect household goods and services considered are: food; clothing; residence; household equipment; transportation and communication; cultural and educational entertainment; and medical care. Emissions related to direct and indirect sources are referred to as direct and indirect HCEs, respectively.
Amounts of direct and indirect goods and services consumed for both urban and rural areas were converted into HCEs amounts using their emission factors (discussed below).
3.2. Estimation of Direct Household Carbon Emission (HCEs)
Direct HCEs are related to the consumption of different types of fossil fuels, as discussed in the previous section and provided in Table 1. Direct HCE estimates for each fossil fuel type were obtained using the IPCC’s reference approach as in Equation (1) [65]:
where “ED” is the amount of total direct C emission (tCO2), “i” is the number of fuel types, “fi” is the fuel consumption of the household (in tonne or m3), “ei” is the net calorific value (NCV) of the fuel “fi” (TJ/ten thousand t), “ci” is the C emission factor (CEF) of the fuel “fi” (tC/TJ), “oi” is the fraction of C oxidized (COF) for the fuel “fi”, and 44/12 is the ratio of the molecular weights of CO2/C. The coefficients of each fuel type are presented in Table 1.
The emission factor for electricity depends on the mix of energy sources as renewable sources are less carbon intensive than others. The China Statistical Yearbook regularly updates emission factors for China, because the energy mix and, thus, emission factors, may change over time. For this study, the latest weighted average emission factor of 0.9976 tCO2/MWh [66], based on the proportion of different electricity sources, is used.

Table 1.
Net calorific value (NCV), carbon emission factor (CEF) and fraction of oxidized carbon (COF) for different fossil fuels used in China.
| Fossil fuel type | NCV (ei) (TJ/1 × 104 t) | CEF (ci) (tC/TJ) | COF (oi) |
|---|---|---|---|
| Raw coal | 209.08 | 26.37 | 0.94 |
| Washed coal | 94.09 | 25.41 | 0.90 |
| Moulded coal | 147.60 | 33.60 | 0.90 |
| Cooking coal | 284.35 | 29.50 | 0.93 |
| Coke oven gas | 173.54 | 13.58 | 0.99 |
| Other gas | 182.74 | 12.20 | 0.99 |
| Gasoline * | 430.70 | 18.90 | 0.98 |
| Kerosene | 430.70 | 19.60 | 0.98 |
| Diesel | 426.52 | 20.20 | 0.98 |
| Liquid petroleum gas (LPG) | 501.79 | 17.20 | 0.98 |
| Natural gas | 389.31 | 15.30 | 0.98 |
Source: NDRC [67]; * Gasoline used for family cars and motorcycles are considered as direct consumption. Therefore, they are listed as a fossil fuel type. However, consumption of public transportation services is considered as indirect consumption.
3.3. Estimation of Indirect Household Carbon Emission (HCEs)
Indirect HCEs relate to the consumption of household goods and services including food, clothing, residence, household equipment, transportation and communication, cultural and educational entertainment, medical care, and other goods and services. Unlike in the USA [68,69,70], lifecycle analyses of indirect goods and services are not available in China. Therefore, indirect carbon emissions from household consumption were calculated using input-output analysis, following Qu et al. [1,2], Liu et al. [3], Vringer and Blok [4], Wang et al. [71] and Zhu et al. [72]. Required data were collated from the Chinese Input-Output Table 2007 [73] and China Energy Statistics Yearbook 2007 [74] and China Statistical Yearbook 2013 [75]. Carbon emission factors for different types of goods and services are presented in Table 2.
Table 2.
CO2 emission factors for different types of goods and services.
| Items/sectors | CO2 emission factors (kg CO2/RMB) |
|---|---|
| Food | 0.095 |
| Clothing | 0.126 |
| Residence * | 0.192 |
| Household equipment | 0.156 |
| Transportation & communication | 0.160 |
| Cultural & educational entertainment | 0.177 |
| Medical care | 0.159 |
| Others | 0.064 |
* Residence emissions are related to the consumption of cement, lime, brick, stone, glass and other building materials.
The emission factors of given goods and services were multiplied by consumption (in RMB) to provide estimates of individual and total indirect emissions (Equation (2)):
where EI is the total indirect HCEs (tCO2), “d” is the number of household consumption items, “Id” (RMB) is the consumption of household goods and services and “Cd” is the CO2 emissions (kg CO2/RMB) from the consumption of goods and services.
4. Results and Discussions
4.1. Comparison of Direct Household Carbon Emission (HCEs) from Different Sources between Urban and Rural People in China
Annual carbon emissions and percentage share of annual emissions from different direct household goods and services for the 17 year period are given in Table 3. From 1995 to 2011, direct HCEs in urban China more than doubled from 177 MtCO2 in 1995 to 411 MtCO2 in 2011. In 1995, “raw coal” represented the highest percentage of emissions (55.2%), followed by electric power (32.5%) and LPG (5.2%). By 2011, the percentage share of “raw coal” emissions had decreased significantly to 5.6%, whereas the share of “electric power” increased to 77.7%. In total, the combined share of these two sources remained almost the same both in 1995 (87.7%) and 2011 (83.3%). During the 17 year period, the share of emissions from all other sources remained almost the same, except in the case of gasoline and diesel where the share of emissions increased by over eight times and 57 times, respectively, while “washing coal” decreased by 72.9%. However, compared to raw coal and electric power, these sources collectively contribute less than 17% of total emissions.
Rural China followed similar trends in HCEs. During the last 17 years, direct HCEs in rural China increased by over 2.1 times, from 186 MtCO2 in 1995 to 398 MtCO2 in 2011. As in urban areas, raw coal and electric power in rural areas represent the bulk of emissions (about 93.2% of total emissions in 1995 and 89.9% in 2011). However, overall the reliance on “raw coal” and, therefore, related emissions was much higher in rural areas (70.0% in 1995 and 29.3% in 2011) than in urban areas (55.2% in 1995 and 5.6% in 2011). Rural China is heavily reliant on raw coal for cooking and heating, as: (1) in many rural areas, other substitute fuels are rarely available [14]; and (2) coal is cheap, easy to transport and store, and has higher calorific value than biomass [3,76,77,78].
4.2. Comparison of Indirect Household Carbon Emission (HCEs) from Different Sources between Urban and Rural China
Indirect HCEs are an emerging issue in both urban and rural China (Table 4). In 1995, urban China was responsible for only 153 MtCO2 of HCEs but in 2011 this had skyrocketed to 1221 MtCO2. Over the 17 year period investigated in this study, direct HCEs in urban China increased by about 132%, whereas indirect HCEs increased by some 698%. Food, clothing, residential housing, transportation and communication, and cultural and educational entertainment are major sources of indirect HCEs. However, the percentage shares of total HCEs from these sources are dynamic in nature. In 1995, food related emissions (38.6%) showed the highest percentage of indirect HCEs, followed by clothing, cultural and educational entertainment (both 13.7%) and residential housing (12.4%). However, in 2011, the share of food related HCEs decreased to 16.6% while the share of clothing remained almost the same (13.1%) and the share of cultural and educational entertainment increased marginally to 17.1%. During this period, the highest incremental change was observed in transportation and communication (over 332%).
Indirect HCEs also increased during this period in rural areas, but at a relatively minor rate (156%) compared to urban areas (698%). As in urban areas, in 1995, food related emissions showed the highest percentage of indirect HCEs in rural China (46.0%); however, by 2011 the share of food related emission decreased to 20.5%. During these 17 years, as in urban China, the highest incremental increase in the share of emissions for rural China was observed in transportation and communication (>600%).
The decreasing share of food-related emissions both in urban and rural areas could be explained by Engel’s Law (1857), i.e., when people are richer they give relatively less attention to food and more attention to quality lifestyle. The food-related results concur with many other studies such as Kerkhof et al. [79], Liu et al. [3] and Dai et al. [15]. Moreover, with rapid economic development and increasing awareness, people may also prefer those goods and services which are both financially and environmentally beneficial [15,80,81,82]. The result of this is that increasing numbers of people choose to purchase cleaner energy, energy efficient electronic products, and a comfortable living environment, while devoting a relatively smaller proportion of their income to food.
Table 3.
Percentage share of household carbon emission (HCEs) by different direct sources in rural and urban China, 1995–2011 (values in parentheses indicate decrease in percentage share).
| Year | Emission 100 million tCO2 | Raw coal | Washed coal | Moulded coal | Cooking coal | Coke oven gas | Other gas | Gasoline | Kerosene | Diesel | LPG | Natural gas | Electric power |
|---|---|---|---|---|---|---|---|---|---|---|---|---|---|
| A. Percentage share of direct HCEs in urban China | |||||||||||||
| 1995 | 1.77 | 55.20 | 4.84 | 0.25 | 0.66 | 0.23 | 0.33 | 0.53 | 0.07 | 0.05 | 5.21 | 0.20 | 32.45 |
| 1996 | 1.67 | 32.01 | 4.37 | 6.96 | 0.71 | 0.26 | 0.56 | 1.66 | 0.07 | 0.90 | 7.00 | 0.23 | 45.27 |
| 1997 | 1.67 | 27.94 | 4.15 | 6.74 | 0.73 | 0.44 | 0.75 | 1.77 | 0.05 | 0.94 | 7.47 | 0.23 | 48.77 |
| 1998 | 1.69 | 25.43 | 3.81 | 5.86 | 0.79 | 0.40 | 0.89 | 1.85 | 0.12 | 1.12 | 8.36 | 0.26 | 51.11 |
| 1999 | 1.68 | 24.01 | 3.88 | 5.96 | 0.76 | 0.38 | 0.87 | 1.96 | 0.07 | 1.30 | 8.24 | 0.28 | 52.30 |
| 2000 | 1.70 | 22.18 | 4.09 | 5.11 | 0.73 | 0.40 | 0.95 | 1.99 | 0.07 | 1.38 | 8.25 | 0.35 | 54.52 |
| 2001 | 1.77 | 21.07 | 4.11 | 4.90 | 0.70 | 0.36 | 0.85 | 2.05 | 0.07 | 1.45 | 7.89 | 0.43 | 56.11 |
| 2002 | 1.87 | 19.15 | 3.17 | 4.80 | 0.58 | 0.35 | 0.86 | 2.14 | 0.06 | 1.55 | 8.32 | 0.45 | 58.57 |
| 2003 | 2.11 | 17.97 | 2.85 | 4.50 | 0.49 | 0.34 | 0.79 | 2.27 | 0.05 | 1.58 | 8.35 | 0.45 | 60.36 |
| 2004 | 2.38 | 16.67 | 2.62 | 4.12 | 0.42 | 0.31 | 0.73 | 2.63 | 0.02 | 2.09 | 8.61 | 0.51 | 61.28 |
| 2005 | 2.71 | 14.38 | 2.43 | 3.43 | 0.34 | 0.30 | 0.67 | 2.62 | 0.01 | 2.02 | 7.17 | 0.53 | 66.12 |
| 2006 | 2.99 | 13.82 | 1.91 | 2.79 | 0.31 | 0.28 | 0.73 | 2.68 | 0.01 | 2.14 | 7.11 | 0.62 | 67.60 |
| 2007 | 3.39 | 11.48 | 1.89 | 2.22 | 0.26 | 0.22 | 0.77 | 2.95 | 0.01 | 2.16 | 6.92 | 0.77 | 70.35 |
| 2008 | 3.46 | 10.01 | 1.71 | 1.09 | 0.22 | 0.22 | 0.74 | 3.20 | 0.01 | 2.31 | 5.83 | 0.89 | 73.77 |
| 2009 | 3.71 | 8.09 | 1.57 | 0.91 | 0.15 | 0.19 | 0.62 | 3.45 | 0.01 | 2.41 | 5.60 | 0.87 | 76.13 |
| 2010 | 3.86 | 6.61 | 1.52 | 0.83 | 0.11 | 0.25 | 0.53 | 3.98 | 0.01 | 2.70 | 5.17 | 1.07 | 77.21 |
| 2011 | 4.11 | 5.59 | 1.31 | 0.81 | 0.10 | 0.17 | 0.48 | 4.38 | 0.01 | 2.87 | 5.43 | 1.17 | 77.68 |
| B. Percentage share of direct HCEs in rural China | |||||||||||||
| 1995 | 1.86 | 70.02 | 4.89 | 0.22 | 0.66 | 0.00 | 0.02 | 0.12 | 0.56 | 0.11 | 0.27 | 0.00 | 23.13 |
| 1996 | 1.47 | 66.13 | 5.06 | 4.61 | 0.80 | 0.00 | 0.02 | 0.34 | 0.72 | 0.33 | 0.88 | 0.00 | 21.12 |
| 1997 | 1.53 | 61.41 | 4.86 | 4.47 | 0.83 | 0.00 | 0.01 | 0.38 | 0.69 | 0.39 | 0.94 | 0.00 | 26.03 |
| 1998 | 1.54 | 60.12 | 4.47 | 4.15 | 0.90 | 0.00 | 0.01 | 0.42 | 0.73 | 0.49 | 0.98 | 0.00 | 27.73 |
| 1999 | 1.56 | 57.20 | 4.73 | 3.76 | 0.85 | 0.00 | 0.01 | 0.47 | 0.75 | 0.55 | 1.0 | 0.00 | 30.65 |
| 2000 | 1.59 | 55.43 | 4.99 | 2.97 | 0.80 | 0.00 | 0.01 | 0.48 | 0.75 | 0.57 | 1.03 | 0.00 | 32.98 |
| 2001 | 1.67 | 51.85 | 4.96 | 2.98 | 0.72 | 0.00 | 0.01 | 0.49 | 0.74 | 0.64 | 0.96 | 0.00 | 36.66 |
| 2002 | 1.75 | 50.51 | 4.79 | 3.14 | 0.58 | 0.00 | 0.01 | 0.56 | 0.36 | 0.57 | 1.17 | 0.00 | 38.32 |
| 2003 | 1.95 | 48.45 | 4.69 | 3.48 | 0.52 | 0.00 | 0.01 | 0.70 | 0.28 | 0.60 | 1.34 | 0.00 | 39.94 |
| 2004 | 2.23 | 46.55 | 4.53 | 3.56 | 0.41 | 0.00 | 0.01 | 0.92 | 0.21 | 0.82 | 1.82 | 0.00 | 41.17 |
| 2005 | 2.47 | 43.93 | 4.35 | 3.49 | 0.30 | 0.00 | 0.01 | 0.99 | 0.17 | 0.78 | 1.94 | 0.00 | 44.04 |
| 2006 | 2.71 | 40.07 | 3.84 | 2.99 | 0.27 | 0.00 | 0.01 | 1.18 | 0.14 | 0.80 | 1.94 | 0.00 | 48.76 |
| 2007 | 3.05 | 34.70 | 3.08 | 3.05 | 0.19 | 0.00 | 0.01 | 1.36 | 0.10 | 0.85 | 2.07 | 0.00 | 54.58 |
| 2008 | 3.20 | 32.45 | 3.32 | 2.41 | 0.13 | 0.00 | 0.01 | 1.40 | 0.06 | 0.87 | 1.99 | 0.00 | 57.35 |
| 2009 | 3.46 | 31.36 | 3.24 | 2.06 | 0.10 | 0.00 | 0.01 | 1.55 | 0.09 | 0.85 | 1.85 | 0.00 | 58.88 |
| 2010 | 3.63 | 31.18 | 3.18 | 2.05 | 0.10 | 0.00 | 0.00 | 1.85 | 0.09 | 0.99 | 1.80 | 0.00 | 58.76 |
| 2011 | 3.98 | 29.28 | 2.95 | 1.92 | 0.09 | 0.00 | 0.00 | 2.14 | 0.09 | 1.13 | 1.74 | 0.00 | 60.64 |
Table 4.
Percentage share of HCEs by different indirect sources in rural and urban China, 1995–2011 (values in parentheses indicate decrease in percentage share).
| Year | Emission 100 million tCO2 | Food | Clothing | Residence | Household equipment | Transportation & communication | Cultural & educational entertainment | Medical care | Others |
|---|---|---|---|---|---|---|---|---|---|
| Percentage share of indirect HCEs in urban China | |||||||||
| 1995 | 1.53 | 38.56 | 13.73 | 12.42 | 9.80 | 6.54 | 13.73 | 3.92 | 1.31 |
| 1996 | 1.66 | 37.95 | 13.86 | 10.84 | 10.24 | 7.23 | 13.25 | 4.82 | 1.81 |
| 1997 | 1.86 | 36.02 | 12.37 | 10.75 | 10.22 | 8.06 | 15.05 | 5.38 | 2.15 |
| 1998 | 2.10 | 34.76 | 10.95 | 10.95 | 10.95 | 9.05 | 16.19 | 5.71 | 1.43 |
| 1999 | 2.44 | 32.79 | 10.25 | 10.66 | 11.48 | 10.25 | 17.21 | 5.74 | 1.64 |
| 2000 | 2.92 | 30.48 | 9.25 | 10.96 | 9.59 | 13.36 | 18.49 | 6.85 | 1.03 |
| 2001 | 3.24 | 29.32 | 9.57 | 11.11 | 9.57 | 14.51 | 17.90 | 7.10 | 0.93 |
| 2002 | 3.93 | 28.50 | 9.41 | 9.67 | 8.65 | 16.28 | 18.83 | 7.63 | 1.02 |
| 2003 | 4.41 | 27.21 | 9.52 | 9.75 | 8.62 | 17.91 | 18.14 | 7.94 | 0.91 |
| 2004 | 4.96 | 25.81 | 9.68 | 9.27 | 8.06 | 19.76 | 18.35 | 8.27 | 0.81 |
| 2005 | 5.66 | 24.38 | 10.60 | 8.66 | 8.13 | 21.38 | 17.49 | 8.48 | 0.88 |
| 2006 | 6.41 | 23.24 | 10.92 | 8.42 | 8.11 | 22.78 | 17.47 | 8.11 | 0.94 |
| 2007 | 7.50 | 21.60 | 11.33 | 7.87 | 8.67 | 24.40 | 17.33 | 7.87 | 0.93 |
| 2008 | 8.23 | 20.78 | 12.03 | 8.14 | 8.99 | 24.18 | 16.77 | 8.14 | 0.97 |
| 2009 | 9.57 | 19.23 | 12.02 | 8.25 | 9.09 | 26.23 | 16.41 | 7.84 | 0.94 |
| 2010 | 10.92 | 17.58 | 12.55 | 7.69 | 9.52 | 28.30 | 16.39 | 7.05 | 0.92 |
| 2011 | 12.21 | 16.63 | 13.10 | 7.21 | 9.66 | 28.26 | 17.12 | 7.04 | 0.98 |
| Percentage share of indirect HCEs in rural China | |||||||||
| 1995 | 1.37 | 45.99 | 6.57 | 21.90 | 6.57 | 2.92 | 10.95 | 4.38 | 0.73 |
| 1996 | 1.55 | 42.58 | 7.10 | 21.29 | 7.10 | 4.52 | 11.61 | 4.52 | 1.29 |
| 1997 | 1.59 | 41.51 | 6.92 | 21.38 | 6.92 | 5.03 | 11.95 | 5.03 | 1.26 |
| 1998 | 1.57 | 41.40 | 5.73 | 22.29 | 6.37 | 5.10 | 14.01 | 4.46 | 0.64 |
| 1999 | 1.60 | 40.63 | 5.63 | 20.63 | 6.88 | 6.88 | 14.38 | 4.38 | 0.63 |
| 2000 | 1.74 | 37.36 | 5.75 | 20.69 | 5.75 | 8.62 | 14.94 | 5.75 | 1.15 |
| 2001 | 1.77 | 36.72 | 5.65 | 20.90 | 5.65 | 10.17 | 14.12 | 5.65 | 1.13 |
| 2002 | 1.84 | 35.87 | 5.43 | 21.20 | 5.43 | 10.87 | 14.67 | 5.43 | 1.09 |
| 2003 | 1.91 | 34.03 | 5.76 | 20.42 | 5.76 | 13.09 | 14.66 | 5.76 | 0.52 |
| 2004 | 2.01 | 33.33 | 5.47 | 19.40 | 5.47 | 14.93 | 14.43 | 5.97 | 1.00 |
| 2005 | 2.27 | 31.72 | 6.17 | 18.06 | 6.17 | 16.30 | 14.10 | 7.05 | 0.44 |
| 2006 | 2.48 | 29.44 | 6.45 | 19.76 | 6.05 | 16.94 | 13.71 | 7.26 | 0.40 |
| 2007 | 2.60 | 27.31 | 6.92 | 21.54 | 6.54 | 17.69 | 12.69 | 6.92 | 0.38 |
| 2008 | 2.75 | 25.82 | 6.91 | 22.18 | 6.91 | 18.18 | 12.36 | 7.27 | 0.36 |
| 2009 | 3.01 | 23.59 | 6.98 | 23.59 | 7.31 | 18.60 | 11.63 | 7.64 | 0.66 |
| 2010 | 3.14 | 22.61 | 7.32 | 21.97 | 7.96 | 19.75 | 11.78 | 7.96 | 0.64 |
| 2011 | 3.51 | 20.51 | 8.26 | 21.08 | 9.12 | 20.51 | 11.11 | 8.83 | 0.57 |
4.3. Comparison of Per Person Direct and Indirect Household Carbon Emission (HCEs) between Urban and Rural People in China
Trends in per person HCEs from direct and indirect sources for both the rural and urban China are given in Figure 1a,b. Scatter plots (rural vs. urban) of per person HCEs are given in Figure 1c (total emissions), Figure 1d (indirect emission) and Figure 1e (direct emissions), which indicate urban emission is larger than the rural.
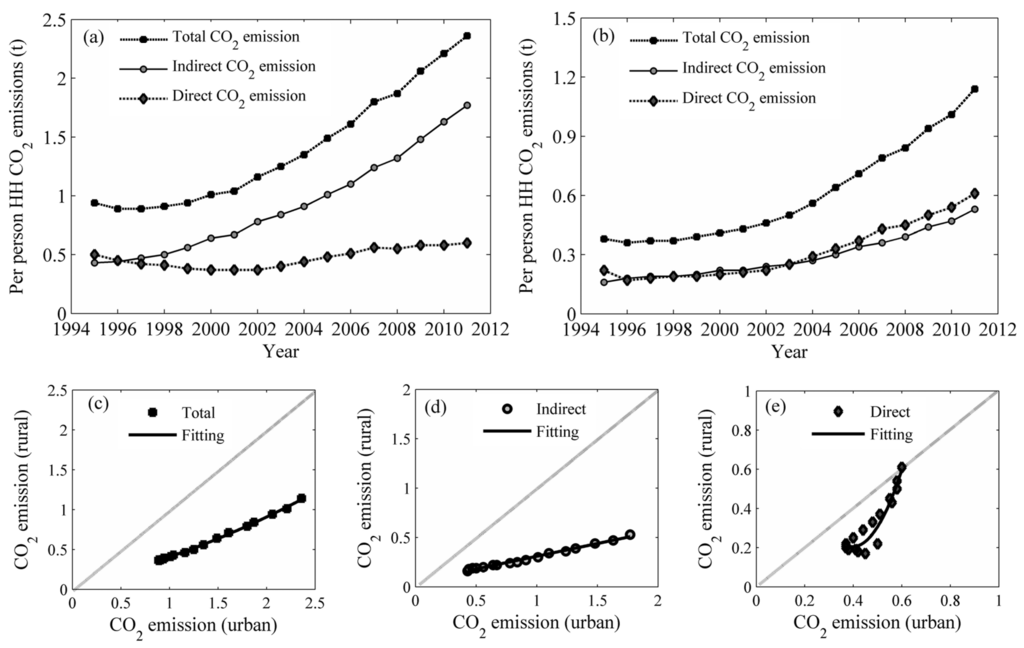
Figure 1.
Per person HCEs (tCO2/year) from urban and rural people in China: (a) urban; (b) rural; and (c–e): scatter plots of per person HCEs (tCO2/year), rural vs. urban.
Figure 1.
Per person HCEs (tCO2/year) from urban and rural people in China: (a) urban; (b) rural; and (c–e): scatter plots of per person HCEs (tCO2/year), rural vs. urban.

In 1995, per person direct HCEs for urban and rural China were 0.50 tCO2 and 0.22 tCO2, respectively. By 2011, these values had increased to 0.60 tCO2 and 0.61 tCO2, respectively. These results are surprising for two reasons: (1) over the period of 17 years, the per person direct HCEs incremental rate of change is lower in urban areas (20%) than in rural areas (177%); and (2) in 2011, per person direct HCEs in rural areas was even higher than that of urban areas. This is mainly because of higher reliability on carbon intense fuels (coal) in rural areas. In a large developing country like China, where rural communities are widely distributed and often far from regional centers, it is hard to expect similar accessibility to energy efficient fuels between rural and urban areas [22]. Very recently, China has moved to give top priority to renewable energy (solar power, small hydropower, wind power, and biomass energy) supply in rural areas; this may significantly alter traditional pathways for development which rely on fossil fuel consumption [83]. However, a rural-centric clean energy subsidy policy and extension activities to support clean energy goals in rural areas are still lacking.
Similarly, per person indirect HCEs for urban and rural households in China in 1995 were 0.43 tCO2 and 0.16 tCO2, respectively. In the year 2011, these values increased to 1.77 tCO2 (by 306%) and 0.53 tCO2 (by 235%), respectively. Therefore, the rate of per person indirect HCEs increased more rapidly in urban areas than in rural areas. This is because the per capita expenditure of urban people on indirect goods and services is many times higher than that of rural people, reflecting their higher incomes and better living standards [21,84].
In total, from 1995 to 2011, the average urban person’s HCEs (direct and indirect) increased by 152% while the average rural person’s emissions increased by 203%. Although the rate was much higher in rural areas, total per person HCEs were still higher in urban areas (2.36 tCO2) than in rural areas (1.14 tCO2).
Geographical location may also have some effects on HCEs. Areas which experience mild weather may have less HCEs than those where weather is cold or very hot. Glaeser and Matthew [85] reported that an average household in Memphis has 78% higher carbon emission than in San Diego. Therefore, households in the Northern (severe winter) and Southern (hot summer) China could have more carbon emissions than that of central China. Moreover, increasing temperature due to climate change may be more favorable for Northern China than Southern China; and even within the same area, a densely populated part of a city with better urban transport may have less HCEs than that of a sub-urban area where people are heavily dependent on private cars for transport [86]. Therefore, further research which addresses these issues is crucial.
4.4. Income Effect on Per Person Household Carbon Emission (HCEs) in Urban and Rural China
Per person direct and indirect HCEs by per capita incomes (PCIs) for urban and rural China are shown in Figure 2 and Figure 3, respectively.

Figure 2.
Relationship between per capita incomes (PCIs) (constant price for year 2000) and direct, indirect, and total per person HCEs in urban China.
Figure 2.
Relationship between per capita incomes (PCIs) (constant price for year 2000) and direct, indirect, and total per person HCEs in urban China.
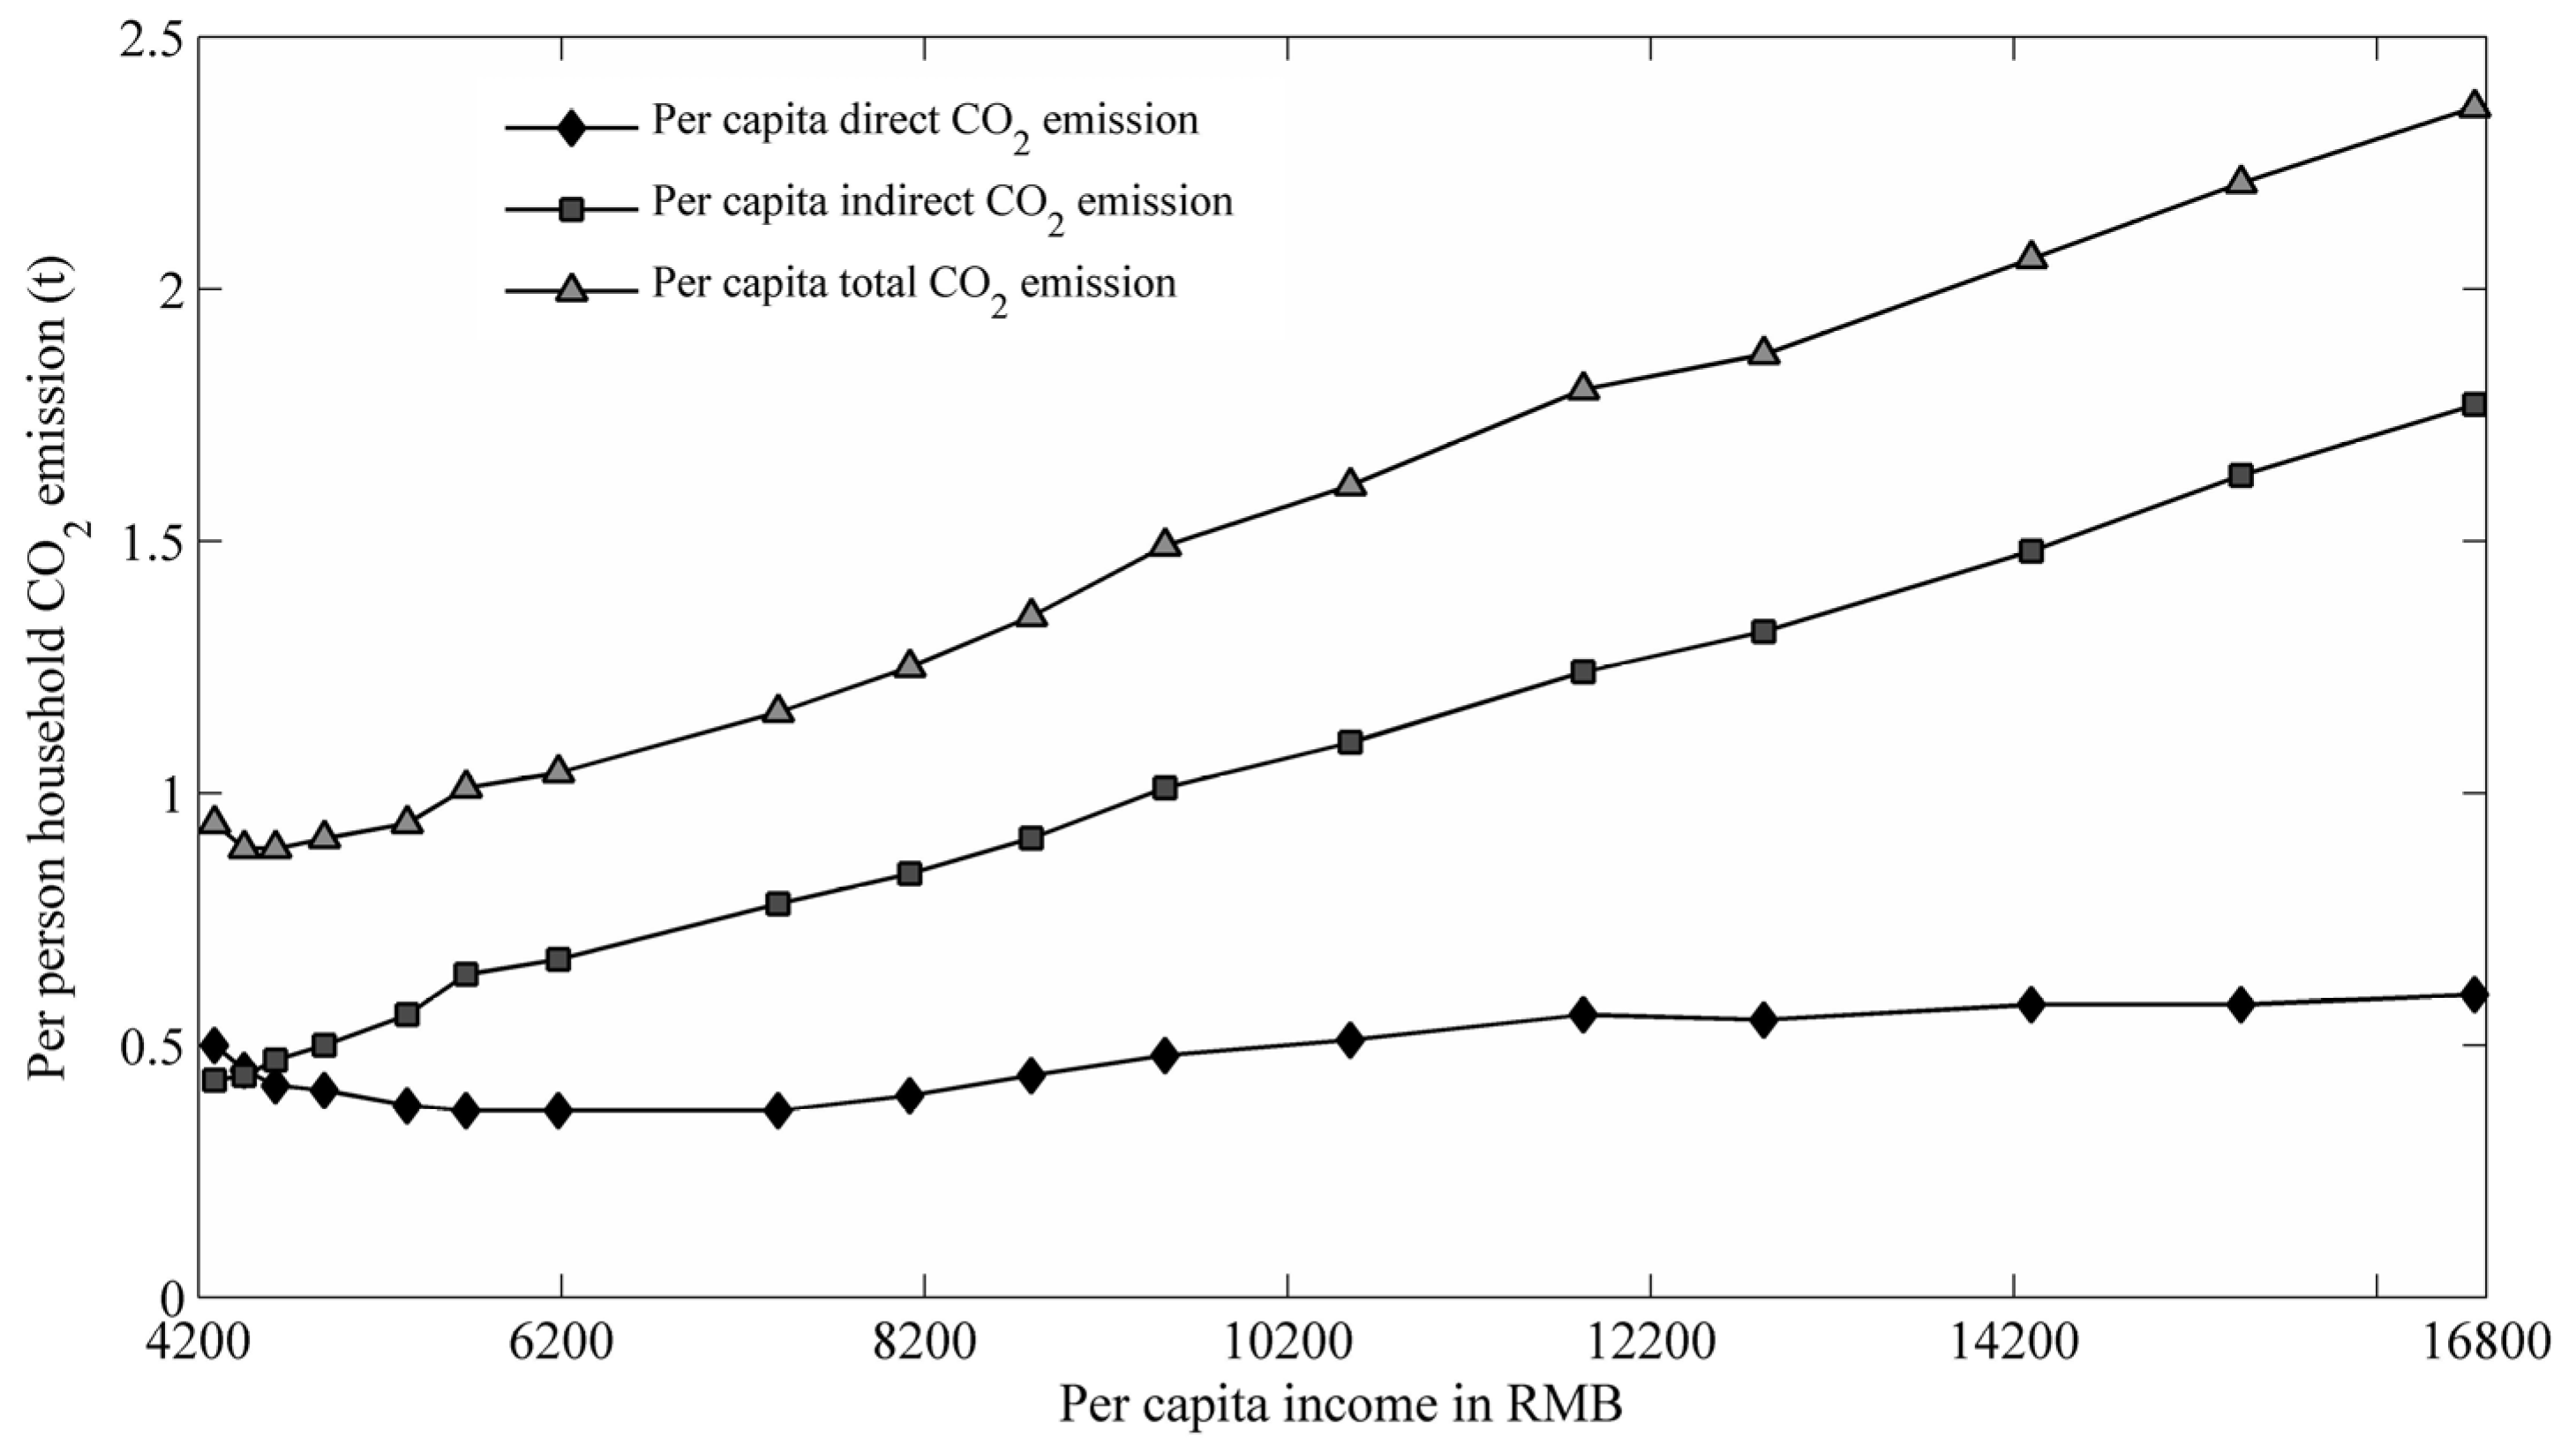
In rural China, average PCI of people ranged from 2338 RMB in 1995 to 6707 RMB in 2011, whereas in urban areas it ranged from 4288 RMB in 1995 to 16,736 RMB in 2011. In both areas, per capita indirect and total HCEs are highly correlated with PCIs, which explain over 97% of the total variations in per person HCEs.
In urban China, increase in PCI has less impact on direct HCEs but more influence on indirect HCEs, whereas in rural China the impact is more or less equal on both direct and indirect HCEs. This is because in urban China with higher incomes people can afford energy efficient fuels and appliances whereas, for various reasons, rural China is heavily reliant on coal and its derivatives [3,21,76,78,84].
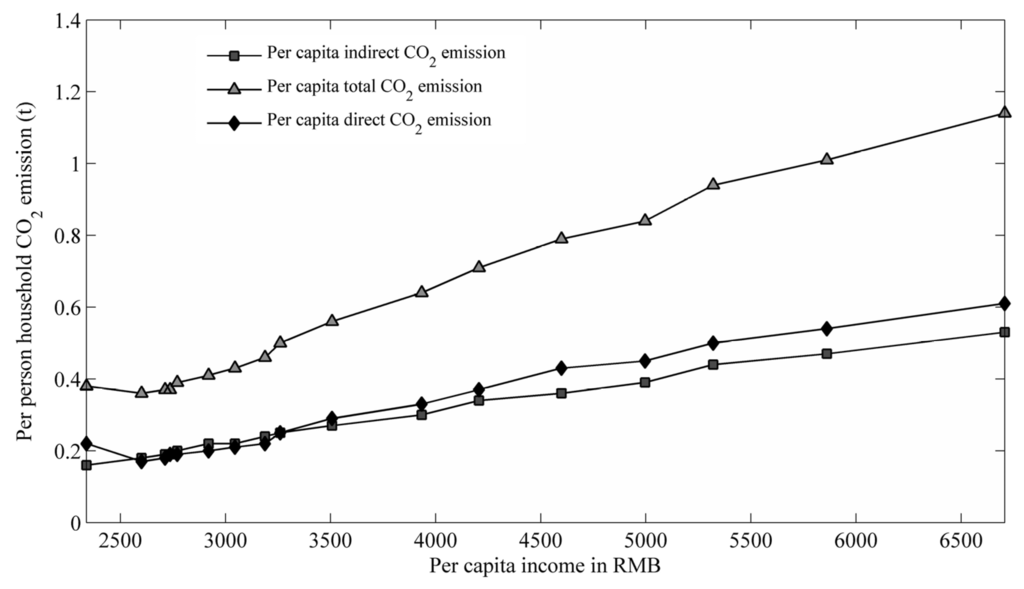
Figure 3.
Relationship between PCIs (constant price for year 2000) and direct, indirect, and total per person HCEs in rural China.
Figure 3.
Relationship between PCIs (constant price for year 2000) and direct, indirect, and total per person HCEs in rural China.

4.5. Urbanization Effect on Household Carbon Emission (HCEs)
Figure 4 presents a time series graph of the urban proportion (%) of the total population and their share of total HCEs for China.
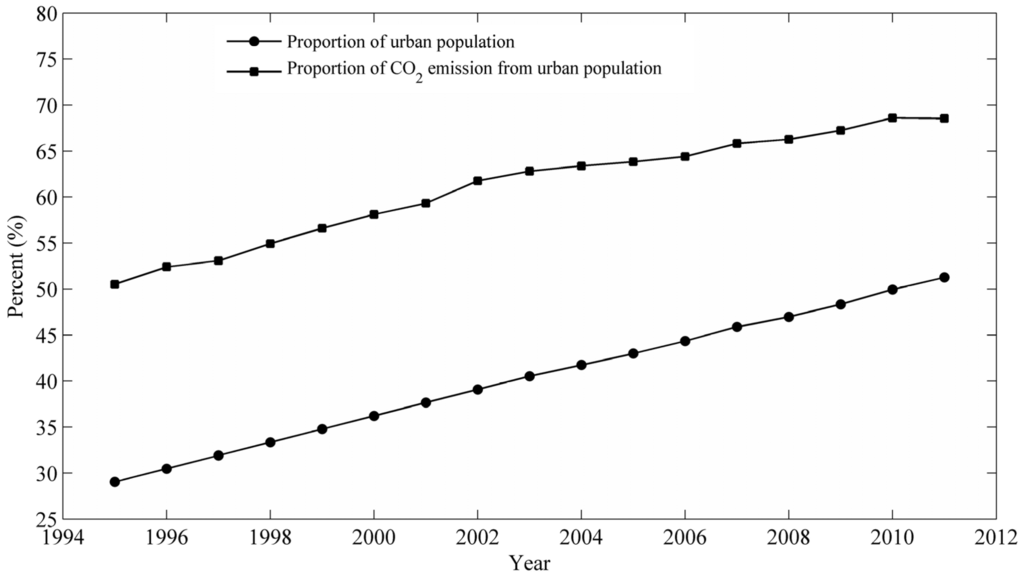
Figure 4.
Proportion of urban population and their share to the total HCEs (in percent).
Figure 4.
Proportion of urban population and their share to the total HCEs (in percent).

These two proportions are very strongly correlated (r = 0.9756). There is a small discrepancy between the two trends. The urbanized population in China is growing rapidly as is the urban share of CO2 emissions, but at a smaller rate compared to the former, especially towards the later years. This is obvious, as noted above from 1995 to 2011 the average urban person’s HCEs increased by 152% whereas in rural people it increased by 203%. It seems that the proportion of HCEs from urban people could be heading towards an asymptote, probably due to greater access of cleaner fuels [14]. However, it is hard to predict when that time will arrive. Moreover, this hypothetical asymptote point could be influenced by forthcoming policies and programs of the government.
4.6. Household Size Effect on Per Person Household Carbon Emission (HCEs) in Urban and Rural China
Household size could have some impact on per person HCEs. In China, for various reasons, the size of households in both urban and rural areas is decreasing every year. In 1995, urban and rural households averaged 3.2 and 4.5 people, respectively, whereas these values decreased to 2.9 and 3.9 in 2011 (Figure 5). Although the decreasing rates of average urban (11.2%) and rural (13.0%) household sizes over the period of 17 years were similar, average household size in rural areas in 2011 was still larger than that of urban households in 1995.
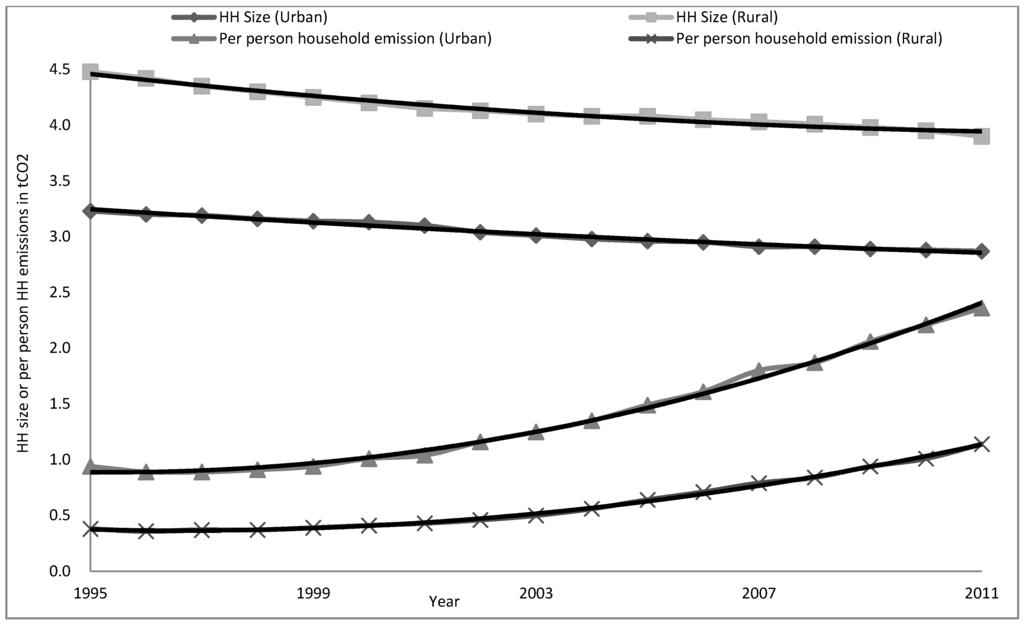
Figure 5.
Relationship between the household size and per person HCEs in urban and rural China.
Figure 5.
Relationship between the household size and per person HCEs in urban and rural China.

As expected, as household size goes down the per person HCEs increases; however, over the study period of 17 years, the increase in HCEs was greater (152% in urban area and 203% in rural area) than the rate of decrease in household sizes. These two variables were negatively correlated (−0.93 for urban areas and −0.86 in rural areas). This indicates that extended family households could be more carbon-friendly than the nuclear family. This observation is in agreement with Qu et al. [1], Underwood [70], Wang and Fend [87], and Intergovernmental Panel on Climate Change (IPCC) [88]. This is likely to be due to the economies of scale of energy use within the household [70].
4.7. Combined Effect of Per Capita Income (PCI) and Household Size on Per Person Household Carbon Emission (HCEs)
As discussed, neither household size nor per capita income (PCI) appears to be a sole driver of increasing “per person HCEs” (PCE). Both are likely to have influence on HCEs. We have developed regression models for individual and combined effects of these two drivers (Table 5). In both rural and urban China, the effect of household size is relatively small compared to that of PCI and the explanatory powers of PCI-based models did not improve by adding another driver “household size”. Therefore, the major driving force for PCE would appear to be PCI. Moreover, as urban people have both higher income levels and smaller household size (and vice versa in rural people) these two variables could be autocorrelated. Hence, if we want to forecast PCE, PCI could be used as a sole independent variable as it has over 98% explanatory power. The importance of PCI on HCEs is also reported in Qu et al. [1,2] and Golley and Meng [21].
Table 5.
Effect of household size (HHsize) and PCI on per person household carbon emission (PCE) in urban and rural China.
| Area | Effects of due to | Best fitted equations | R2 | AdjR2 |
|---|---|---|---|---|
| Urban | PCI | 0.995 | 0.985 | |
| HHsize | 0.870 | 0.862 | ||
| PCI plus HHsize | 0.997 | 0.996 | ||
| Rural | PCI | 0.989 | 0.988 | |
| HHsize | 0.738 | 0.720 | ||
| PCI plus HHsize | 0.989 | 0.988 |
In order to estimate potential future emission scenarios, we have used PCI as a sole explanatory variable. For example, if all the conditions remain the same and the current emissions trends in both urban and rural China continue, a one percent increase in PCIs from 2011 levels will lead to an increase in the PCEs in urban and rural China of 0.89% and 1.22%, respectively. Similarly, in absolute terms, a 1000 RMB increase in PCIs from 2011 levels is predicted to result in a 0.119 tCO2 and 0.197 tCO2 increase, respectively, in PCEs in urban and rural China. If PCEs continue to increase in line with these trends, demand for energy will increase in the future. As China does not have huge reserves of fossil fuels, a large amount of energy resources will need to be imported [89]. Considering this reality, China has put a cap on coal consumption, and is promoting energy efficient vehicles and appliances, and also planning to implement a national level emissions trading scheme after 2015 [27]. Such moves are transformational and are likely to mean that the increasing rate of emissions could decrease in the future; however, rural China may still have some issues partly due to its heavy reliance on carbon-intensive fuels.
China has been providing economic opportunities in rural China so that it is equally-benefitted and can contribute to domestic economic growth. They have been successful in this mission [90], but this has also increased the consumption of goods and services and related carbon emissions. Therefore, finding a win-win solution is crucial. This can be achieved by developing and implementing rural-centric policies and programs and providing incentives for producing and using low carbon fuels and renewable energy. This has huge public health and climate benefits. For example, it is estimated that the US Government’s plan to cut carbon pollution from power plants by 30% (730 million metric tonnes) by 2030 could have public health and climate benefits worth up to 93 billion per year in 2030, far outweighing the costs of 8.8 billion US$ [91]. From soot and smog reductions alone, up to 7 US$ in health benefits for every dollar invested will be realized through this plan [91].
5. Conclusions and Recommendations
Over the study period of 17 years (1995–2011) both urban and rural China have undergone massive transformations in HCEs. From 1995 to 2011, the average urban and rural person’s total HCEs increased by 152% and 203%, respectively, but per person HCEs in 2011 are still significantly higher in urban areas than in rural areas (2.36 tCO2 vs. 1.14 tCO2). Per person direct HCEs increased faster in rural areas (177% vs. 20%), whereas indirect HCEs increased faster in urban areas (306% vs. 235%).
Due to increasing awareness and accessibility of cleaner fuel, urban households perform better in terms of direct energy consumption and related emissions, but poorer in terms of indirect energy consumption and related emissions, probably due to their higher affluence and modernized lifestyle. In the case of rural areas, the opposite is apparent; they have greater access to carbon intensive raw coal and less capacity to afford indirect goods and services. These findings suggest two things: (1) a national level study does not provide a clear picture and therefore a segregated assessment of urban and rural China is necessary; and (2) direct HCEs do not provide a complete picture and therefore a comprehensive assessment of both direct and indirect sources of emissions is crucial.
Urbanization and PCI have strong positive correlations with per person HCEs, whereas household size is negatively correlated. Therefore, extended family arrangements are likely to be more carbon-friendly than the nuclear family, probably due to the economies of scale of the former arrangements. We also analyzed the individual and combined effects of household size and PCI on per person HCEs with the development of multiple regression models. In both rural and urban China, the effect of household size is relatively smaller compared to the effect of PCI. In fact, the explanatory powers of PCI-based models were not improved by adding household size. Therefore, regression models solely based on PCI can be used for the estimation and forecasting of per person HCEs. If all conditions remain the same and the current emissions trends in both urban and rural China continue, a one percent increase in PCI from 2011 levels is predicted to result in increases in PCEs in urban and rural China of 0.89% and 1.22%, respectively. Therefore, in order to meet 40%–45% carbon intensity reduction target China may need more aggressive action on low carbon-intensity fuels, energy efficiency, renewables, and demand side management by using energy efficient appliances and vehicles, with particular attention on rural areas.
In this research per capita income is used as an independent variable for forecasting per person HCEs. However, while climate is changing, the changing patterns are different in various parts of China. As a result, there could be a huge variation in HCEs in the future. Therefore, a further research, involving spatial and temporal modeling using IPCC greenhouse gas emission scenarios and forecasting impacts of changing temperatures on HCEs, is highly recommended.
Acknowledgments
This study was co-funded by ‘‘Strategic Priority Research Program—Climate Change: Carbon Budget and Related Issues’’ of the Chinese Academy of Sciences (Grant No. XDA05140100) and the National Natural Sciences Foundation of China (Grant No. 41371537). We would like to thank them for their financial support. We would also like to extend our profound gratitude to Kathryn Reardon-Smith for her extensive editing work. Finally, we cordially thank anonymous referees for their highly valuable suggestions, which were gratefully acknowledged.
Author Contributions
Jiansheng Qu, Tek Maraseni designed research and wrote the paper; Jiansheng Qu and Lina Liu analyzed the data and contributed to the conceptual framework of the methodology; Zhiqiang Zhang and Talal Yusaf modified this paper; and all authors revised the manuscript and approved the final version.
Conflicts of Interest
The authors declare no conflict of interest.
References
- Qu, J.S.; Zeng, J.J.; Li, Y.; Wang, Q.; Maraseni, T.; Zhang, L.H.; Zhang, Z.Q.; Clarke-Sather, A. Household carbon dioxide emissions from peasants and herdsmen in northwestern arid-alpine regions, China. Energy Policy 2011, 57, 133–140. [Google Scholar] [CrossRef]
- Qu, J.S.; Zhang, Z.Q.; Zeng, J.J.; Li, Y.; Wang, Q.H.; Qiu, J.L.; Liu, L.N.; Dong, L.P.; Tang, X. Household carbon emission differences and their driving factors in north-western China. Sci. Bull. 2013, 58, 260–266. (In Chinese) [Google Scholar]
- Liu, L.C.; Wu, G.; Wang, J.N.; Wei, Y.M. China’s carbon emissions from urban and rural households during 1992–2007. J. Clean. Prod. 2011, 19, 1754–1762. [Google Scholar] [CrossRef]
- Vringer, K.; Blok, K. The direct and indirect energy requirements of households in the Netherlands. Energy Policy 1995, 23, 893–910. [Google Scholar] [CrossRef]
- Munksgaard, J.; Pedersen, K.A.; Wier, M. Impact of household consumption on CO2 emissions. Energy Econ. 2000, 22, 423–440. [Google Scholar] [CrossRef]
- Pachauri, S.; Spreng, D. Direct and indirect energy requirements of households in India. Energy Policy 2002, 30, 511–523. [Google Scholar] [CrossRef]
- Reinders, A.H.M.E.; Vringer, K.; Blok, K. The direct and indirect energy requirement of households in the European Union. Energy Policy 2003, 31, 139–153. [Google Scholar] [CrossRef]
- Bin, S.; Dowlatabadi, H. Consumer lifestyle approach to US energy use and the related CO2 emissions. Energy Policy 2005, 33, 197–208. [Google Scholar] [CrossRef]
- Cohen, C.; Lenzen, M.; Schaeffer, R. Energy requirements of households in Brazil. Energy Policy 2005, 33, 555–562. [Google Scholar] [CrossRef]
- Park, H.C.; Heo, E. The direct and indirect household energy requirements in the Republic of Korea from 1980 to 2000—An input-output analysis. Energy Policy 2007, 35, 2839–2851. [Google Scholar] [CrossRef]
- Nansai, K.; Inaba, R.; Kagawa, S.; Moriguchi, Y. Identifying common features among household consumption patterns optimized to minimize specific environmental burdens. J. Clean. Prod. 2008, 16, 538–548. [Google Scholar]
- Sánchez-Chóliz, J.; Duarte, R.; Mainar, A. Environmental impact of household activity in Spain. Ecol. Econ. 2007, 62, 308–318. [Google Scholar] [CrossRef]
- Wei, Y.M.; Fan, Y.; Wang, Y. Suggestions and solutions to carbon emissions in China. Adv. Clim. Change Res. 2006, 2, 15–20. [Google Scholar]
- Feng, Z.H.; Zou, L.L.; Wei, Y.M. The impact of household consumption on energy use and CO2 emissions in China. Energy 2011, 36, 656–670. [Google Scholar] [CrossRef]
- Dai, H.; Masui, T.; Matsuoka, Y.; Fujimori, S. The impacts of China’s household consumption expenditure patterns on energy demand and carbon emissions towards 2050. Energy Policy 2012, 50, 736–750. [Google Scholar] [CrossRef]
- China’s Economic Rise: History, Trends, Challenges, and Implications for the United States. Available online: http://www.crs.gov (accessed on 12 June 2015).
- Zhang, Z.X. China in the transition to a low-carbon economy. Energy Policy 2010, 38, 6638–6653. [Google Scholar] [CrossRef]
- World Energy Outlook 2012. Available online: http://www.iea.org (accessed on 25 January 2015).
- Liao, H.; Cao, H.S. How does carbon dioxide emission change with the economic development? Statistical experiences from 132 countries. Glob. Environ. Chang. 2013, 23, 1073–1082. [Google Scholar] [CrossRef]
- Wang, Z.; Yang, L. Indirect carbon emissions in household consumption: evidence from the urban and rural area in China. J. Clean. Prod. 2014, 78, 94–103. [Google Scholar] [CrossRef]
- Golley, J.; Meng, X. Income inequality and carbon dioxide emissions: The case of Chinese urban households. Energy Econ. 2012, 34, 1864–1872. [Google Scholar] [CrossRef]
- Maraseni, T.N. Selecting a CDM investor in China: A critical analysis. Energy Policy 2013, 53, 484–489. [Google Scholar] [CrossRef]
- Human Activity and the Environment, Catalogue (16-201-X). Available online: http://www.statcan.gc.ca (accessed on 12 February 2015).
- National Bureau of Statistics of China (NBSC). China Statistical Yearbook; China Statistics Press: Beijing, China, 2011.
- Campbell, R.J. China and the United States—A Comparison of Green Energy Programs and Policies. Congressional Research Service. Available online: https://www.fas.org/sgp/crs/row/RL33534.pdf (accessed on 12 June 2015).
- Maraseni, T.N.; Gao, X. An analysis of Chinese perceptions on unilateral Clean Development Mechanism (uCDM) projects. Environ. Sci. Policy 2011, 14, 339–346. [Google Scholar] [CrossRef]
- Australia’s Energy Sector: Aging, Inefficient and Unprepared. Available online: http://www.climatecouncil.org.au (accessed on 15 June 2015).
- Renewable Energy Network. Available online: http://www.ren21.net/ (accessed on 12 June 2014).
- China’s Power Capacity up 94 m kw in 2013. Available online: http://www.chinadaily.com.cn/business/2014-02/11/content_17276118.htm (accessed on 12 June 2014).
- Hart, M. Primer on Beijing’s Slice-and-Dice Approach to Energy and Climate Reform; Center for American Progress. Available online: https://www.americanprogress.org/issues/security/report/2014/07/07/93278/primer-on-beijings-slice-and-dice-approach-to-energy-and-climate-reform/ (accessed on 12 June 2015).
- Reducing Australia’s Greenhouse Gas Emissions—Targets and Progress Review; Australian Government Climate Change Authority: Canberra, Australia, 2014; p. 401.
- National Bureau of Statistics of China (NBSC). China Statistical Yearbook; China Statistics Press: Beijing, China, 1996.
- National Bureau of Statistics of China (NBSC). China Statistical Yearbook; China Statistics Press: Beijing, China, 1997.
- National Bureau of Statistics of China (NBSC). China Statistical Yearbook; China Statistics Press: Beijing, China, 1998.
- National Bureau of Statistics of China (NBSC). China Statistical Yearbook; China Statistics Press: Beijing, China, 1999.
- National Bureau of Statistics of China (NBSC). China Statistical Yearbook; China Statistics Press: Beijing, China, 2000.
- National Bureau of Statistics of China (NBSC). China Statistical Yearbook; China Statistics Press: Beijing, China, 2001.
- National Bureau of Statistics of China (NBSC). China Statistical Yearbook; China Statistics Press: Beijing, China, 2002.
- National Bureau of Statistics of China (NBSC). China Statistical Yearbook; China Statistics Press: Beijing, China, 2003.
- National Bureau of Statistics of China (NBSC). China Statistical Yearbook; China Statistics Press: Beijing, China, 2004.
- National Bureau of Statistics of China (NBSC). China Statistical Yearbook; China Statistics Press: Beijing, China, 2005.
- National Bureau of Statistics of China (NBSC). China Statistical Yearbook; China Statistics Press: Beijing, China, 2006.
- National Bureau of Statistics of China (NBSC). China Statistical Yearbook; China Statistics Press: Beijing, China, 2007.
- National Bureau of Statistics of China (NBSC). China Statistical Yearbook; China Statistics Press: Beijing, China, 2008.
- National Bureau of Statistics of China (NBSC). China Statistical Yearbook; China Statistics Press: Beijing, China, 2009.
- National Bureau of Statistics of China (NBSC). China Statistical Yearbook; China Statistics Press: Beijing, China, 2010.
- National Bureau of Statistics of China (NBSC). China Statistical Yearbook; China Statistics Press: Beijing, China, 2012.
- National Bureau of Statistics of China (NBSC). China Population & Employment Statistical Yearbook; China Statistics Press: Beijing, China, 1996.
- National Bureau of Statistics of China (NBSC). China Population & Employment Statistical Yearbook; China Statistics Press: Beijing, China, 1997.
- National Bureau of Statistics of China (NBSC). China Population & Employment Statistical Yearbook; China Statistics Press: Beijing, China, 1998.
- National Bureau of Statistics of China (NBSC). China Population & Employment Statistical Yearbook; China Statistics Press: Beijing, China, 1999.
- National Bureau of Statistics of China (NBSC). China Population & Employment Statistical Yearbook; China Statistics Press: Beijing, China, 2000.
- National Bureau of Statistics of China (NBSC). China Population & Employment Statistical Yearbook; China Statistics Press: Beijing, China, 2001.
- National Bureau of Statistics of China (NBSC). China Population & Employment Statistical Yearbook; China Statistics Press: Beijing, China, 2002.
- National Bureau of Statistics of China (NBSC). China Population & Employment Statistical Yearbook; China Statistics Press: Beijing, China, 2003.
- National Bureau of Statistics of China (NBSC). China Population & Employment Statistical Yearbook; China Statistics Press: Beijing, China, 2004.
- National Bureau of Statistics of China (NBSC). China Population & Employment Statistical Yearbook; China Statistics Press: Beijing, China, 2005.
- National Bureau of Statistics of China (NBSC). China Population & Employment Statistical Yearbook; China Statistics Press: Beijing, China, 2006.
- National Bureau of Statistics of China (NBSC). China Population & Employment Statistical Yearbook; China Statistics Press: Beijing, China, 2007.
- National Bureau of Statistics of China (NBSC). China Population & Employment Statistical Yearbook; China Statistics Press: Beijing, China, 2008.
- National Bureau of Statistics of China (NBSC). China Population & Employment Statistical Yearbook; China Statistics Press: Beijing, China, 2009.
- National Bureau of Statistics of China (NBSC). China Population & Employment Statistical Yearbook; China Statistics Press: Beijing, China, 2010.
- National Bureau of Statistics of China (NBSC). China Population & Employment Statistical Yearbook; China Statistics Press: Beijing, China, 2011.
- National Bureau of Statistics of China (NBSC). China Population & Employment Statistical Yearbook; China Statistics Press: Beijing, China, 2012.
- IPCC Guide Lines for National Greenhouse Gas Inventories; Intergovernmental Panel on Climate Change (IPCC): Hayama, Japan, 2006.
- Announcement on 2009 Baseline Emission Factor of China Regional Power Grid; China National Development and Reform Commission (NDRC): Beijing, China, 2009.
- Development and Reform Commission (NDRC). China National Greenhouse Gas Inventory; China Environmental Science Press: Beijing, China, 2007.
- Weber, C.L. Trade, Consumption, and Climate change: An Input-Output Study of the United States. Ph.D. Thesis, Carnegie Mellon University, Pittsburgh, PA, USA, 2008. [Google Scholar]
- Weber, C.L.; Matthews, H.S. Quantifying the global and distributional aspects of American household carbon footprint. Ecol. Econ. 2008, 66, 379–391. [Google Scholar] [CrossRef]
- Underwood, A.J. Household Carbon Dioxide Emissions in the United States: The Role of Demographic Change. Ph.D. Thesis, Colorado State University, Fort Collins, CO, USA, 2014. [Google Scholar]
- Wang, D.; Nie, R.R.; Wang, S.Z. Study on the evaluation and decomposition of China’s per capita carbon dioxide emissions inequality based on the perspective of intergenerational equity. Stud. Sci. Sci. 2012, 30, 1662–1670. (In Chinese) [Google Scholar]
- Zhu, Q.; Peng, X.Z.; Wu, K.Y. Calculation and decomposition of indirect carbon emissions from residential consumption in China based on the input-output model. Energy Policy 2012, 48, 618–626. [Google Scholar] [CrossRef]
- National Bureau of Statistics of China (NBSC). Input-Output Tables of China; China Statistics Press: Beijing, China, 2008.
- National Bureau of Statistics of China (NBSC). China Energy Statistics Yearbook 2007; NBSC: Beijing, China, 2008.
- National Bureau of Statistics of China (NBSC). China Statistical Yearbook; China Statistics Press: Beijing, China, 2013.
- Liu, W.L.; Spaargaren, G.; Heerink, N.; Mol, A.P.; Wang, C. Energy consumption practices of rural households in north China: Basic characteristics and potential for low carbon development. Energy Policy 2013, 55, 128–138. [Google Scholar] [CrossRef]
- Cai, B.F.; Zhang, L.X. Urban CO2 emissions in China: Spatial boundary and performance comparison. Energy Policy 2014, 66, 557–567. [Google Scholar] [CrossRef]
- Ren, H.; Wu, Q.; Ren, J.X.; Gao, W.J. Cost-effectiveness analysis of local energy management based on urbanerural cooperation in China. Appl. Therm. Eng. 2014, 64, 224–232. [Google Scholar] [CrossRef]
- Kerkhof, A.C.; Benders, R.M.J.; Moll, H.C. Determinants of variation in household CO2 emissions between and within countries. Energy Policy 2009, 37, 1509–1517. [Google Scholar] [CrossRef]
- Glicksman, L.R.; Norford, L.K.; Greden, L.V. Energy conservation in Chinese residential buildings: Progress and opportunities in design and policy. Annu. Rev. Energy Environ. 2001, 26, 83–115. [Google Scholar] [CrossRef]
- Deng, X. Private car ownership in China: How important is the effect of income? Available online: http://ura.unisa.edu.au/R/?func=dbin-jump-full&object_id=unisa35333 (accessed on 10 June 2014).
- Wang, Q.H.; Zhang, Z.Q.; Qu, J.S. A review of the research on household carbon emission. Adv. Earth Sci. 2013, 28, 1305–1312. (In Chinese) [Google Scholar]
- Yao, C.S.; Chen, C.Y.; Li, M. Analysis of rural residential energy consumption and corresponding carbon emissions in China. Energy Policy 2014, 41, 445–450. [Google Scholar] [CrossRef]
- Zhang, X.H.; Han, J.; Zhao, H.; Deng, S.H.; Xiao, H.; Peng, H.; Li, Y.W.; Yang, G.; Shen, F.; Zhang, Y.Z. Evaluating the interplays among economic growth and energy consumption and CO2 emission of China during 1990–2007. Renew. Sustain. Energy Rew. 2012, 16, 65–72. [Google Scholar] [CrossRef]
- Glaeser, E.L.; Matthew, E.K. The Greenness of Cities: Carbon Dioxide Emissions and Urban Development. J. Urban Econ. 2010, 67, 404–418. [Google Scholar] [CrossRef]
- Jones, C.; Kammen, D.M. Spatial distribution of U.S. household carbon footprints reveals suburbanization undermines greenhouse gas benefits of urban population density. Environ. Sci. Technol. 2014, 48, 895–902. [Google Scholar] [CrossRef] [PubMed]
- Wang, X.H.; Fend, Z.M. Survey of rural household energy consumption in China. Energy 1996, 21, 703–705. [Google Scholar]
- Climate Change 2014: Mitigation of Climate Change; Intergovernmental Panel on Climate Change: New York, NY, USA, 2014.
- Jiang, B.; Sun, Z.Q.; Liu, M.Q. China’s energy development strategy under the low-carbon economy. Energy 2010, 35, 4257–4264. [Google Scholar] [CrossRef]
- Treiman, D.J. The “difference between heaven and earth”: Urban–rural disparities in well-being in China. Res. Soc. Stratif. Mobil. 2012, 30, 33–47. [Google Scholar] [CrossRef]
- Carbon Pollution Emission Guidelines for Existing Stationary Sources: Electric Utility Generating Units; Environment Protection Agency (EPA): Washington, DC, USA, 2014; p. 645.
© 2015 by the authors; licensee MDPI, Basel, Switzerland. This article is an open access article distributed under the terms and conditions of the Creative Commons Attribution license (http://creativecommons.org/licenses/by/4.0/).