1. Introduction
It is considered that global warming and its subsequent effects, the most serious climate threat to human existence, is due to greenhouse gas (GHG) emissions, with 90% probability [
1]. According to trend analysis, the concentration of GHGs will increase from the present 430 ppm to over 550 ppm in 2050, which will continue to cause a temperature increase of over 2 °C, with a likelihood of 99% [
2]. Current research shows that energy-related CO
2 emissions have caused over two-thirds of greenhouse effects and will continue to increase in the future [
3,
4]. The electric power industry is a significant energy-related CO
2 emitter. Its global emissions share has increased from 36% in 1990 to 41% in 2009, and is projected to increase to 45% in 2030 [
1,
5].
In China, the situation is even more serious. Since the beginning of reform and opening-up policy in the late 1970s, China has experienced unprecedented economic development with an average annual growth rate of 10% [
6]. The installed capacity and electricity generation needed to increase quickly to catch up with the booming economic growth. From 1980 to 2014, the yearly installed capacity had increased from 65.9 million kilowatts (kW) to 1360.19 million kW, while the electricity net generation had increased from 285.5 billion kilowatt hours (kWh) to 5649.58 billion kWh [
7]. For a long time, because of the neglect of environmental protection and the dependence on energy resource endowments, China’s power generation sector relies heavily on coal and its products, the most carbon-intensive fossil fuels [
8]. In 2014, China’s coal-fired power plants consumed 1760.98 million tons of coal, accounting for 42.78% of the country’s total, and generated 4268.65 billion kWh electricity, accounting for 75.56% of the country’s total [
9,
10]. Due to the considerable coal consumption, the electric power industry has become the largest CO
2 emitter of all the industrial sectors, contributing to over 40% of China’s total [
11].
When the Kyoto Protocol was adopted in 1997, as a developing country and also because of the inconspicuous emissions share, China was not listed in “Annex I”—those who should take the responsibility of CO
2 emissions control [
12]. However, over the subsequent dozen years, China’s GDP output and CO
2 emissions have increased greatly. Since 2007, China has become the largest CO
2 emitter in the world, accounting for as much as 28% of the world’s total in 2013 [
13]. Many “Annex I” emitters felt the situation unfair and a few of them even withdrew from the Kyoto Protocol. As a remedial measure, the Doha amendment to the Kyoto Protocol clearly specified that “developing countries contribute adequately according to their responsibilities and respective capabilities” as one of the premises for many “Annex I” emitters to continue to fulfill their commitments [
14]. Therefore, China’s CO
2 emissions control has become one of the key factors to further maintain the global CO
2 mitigation system. As introduced before, controlling the CO
2 emissions from the electric power industry is the key issue.
Quantitatively analyzing the relationship between CO
2 emissions from the electric power industry and its driving force factors is one of the important bases for adjusting the relevant policies. The Log-mean Divasia index (LMDI) [
5,
15] and Laspeyres index [
16] decomposition models can quantitatively decompose the change of CO
2 emissions from the electric power industry into the contributions of each driving-force factor. These two models have similar functions, but each has its own merits. The former is better than the latter in theoretical foundation, adaptability, and result interpretation; whereas the latter is better for easy comparison between different decomposed objects [
17]. However, these models all need an identity with multiple forms at the beginning of decomposition. Limited by this unique identity structure, the considered influence factors are difficult to add.
In 1970s, Ehrlich and Holdren [
18,
19] were the first to advance the IPAT (Impact, Population, Affluence and Technology) model, known as
I =
PAT to quantitatively decompose the impact (
I) on environment of human activities to population (
P), affluence (
A), and technology (
T). As a follow-up study, Waggoner and Ausubel [
20] further decomposed technology (
T) in IPAT into different forms in different research fields. Their model was hence written as
I =
PACT and named ImPACT. IPAT and ImPACT, with no essential difference, have been widely used in analyzing the influencing factors of CO
2 emissions [
21,
22,
23]. However, as a common premise, the aforementioned models assume that each factor has the same influence to the decomposed impact. This premise has been considered as the fatal limitation of these models [
24,
25]. To overcome this, Dietz and Rosa [
24] advanced the Stochastic Impacts by Regression on Population, Affluence and Technology (STIRPAT) model which is written as
I =
aPbAcTd. This model has been successfully utilized to statistically model non-proportionate impacts of variables on the environment. Not only that, the equation structure of the STIRPAT model also makes it easy to add explanatory variables. That is, more influencing factors of CO
2 emissions from the electric power industry can possibly be considered to build the extended STIRPAT model.
In practical applications, to estimate the parameters by ordinary least squares (OLS) algorithm, the STIRPAT model is usually rewritten as a linear form by taking the logarithm. The CO
2 emissions from the electric power industry are usually influenced by many social and economic factors, named independent variables. When simulating the relationship between power-generation CO
2 emissions and the influencing factors, the independent variables in linear STIRPAT model often exhibit extreme multicollinearity. This will directly cause the instability of regression parameters and indirectly lead to many inevitable consequences. To solve this problem, Wold et al. [
26] advanced the partial least squares (PLS) method. Many literatures have proved that the PLS algorithm has the ability to find the stable regression parameters using few observations with multicollinearity [
4,
27]. The PLS algorithm can also be used to estimate the parameters of the linear log equation form of the extended STIRPAT model.
The remainder of this paper is organized as follows.
Section 2 describes the methodologies used: the extended STIRPAT model, the PLS theory, the outlier test, and the data sources.
Section 3 tests the extent of multicollinearity, examines China’s power industry historical data from 1997 to 2014 to obtain the log linear model, and demonstrates model validity. The tested outliers may reveal two reasonable areas for the power industry’s emissions reduction.
Section 4 designs possible scenarios for the power industry during the period of the 13th Five-Year Plan and estimates the future CO
2 emissions for different scenarios so as to measure the mitigation potential in the power sector.
Section 5 provides the summary and conclusions based on the results of the previous analysis.
2. Methodologies and Data
2.1. Influencing Factors and the Extended STIRPAT Model
According to the idea of the IPAT theory, the potential factors influencing CO2 emissions from the power industry are grouped into three categories. The first is population and urbanization level. The urbanization level is quantified as the proportion of urban population to the total population. The second is affluence, which is typically operationalized as per capita gross domestic product (GDP). The third is technology, represented by industrial structure, electricity intensity, generation structure, and energy (fuel) intensity of power generation. In our work, the proportion of the second industry output to total GDP is used to indicate the industrial structure. The electricity intensity is defined as electricity generation required per unit of GDP. The generation structure is quantified by the electricity generation share of thermal power plants to the gross generation. The energy (fuel) intensity means the energy consumption per kWh. We chose the net equivalent coal consumption rate of power supply electricity, instead of the net equivalent coal consumption rate of power generation electricity, to demonstrate the energy intensity indicator. The reason is as follows.
In power plants, various auxiliary equipment (pumps, fans, dust collectors, coal mills, etc.) consume a certain proportion of electricity. The actual on-grid electricity energy should deduct the electricity consumption for auxiliary equipment, which is called “power supply electricity”. Thus the auxiliary power ratio can also reflect the economy of the generation process. We herein adopt the net equivalent coal consumption rate of power supply electricity as a comprehensive indicator since it shows the combined effect of the net equivalent coal consumption rate of thermal power generation and the auxiliary power ratio together. The definitions of all influential factors are shown in
Table 1.
Accordingly, the STIRPAT model can be further rewritten as follows after extension.
where the subscript
t represents
t year,
It is the CO
2 emissions from the power industry,
Pt is the population,
Ut is the urbanization level,
At is GDP per capita,
SIt is the industrial structure,
EIt is the electricity intensity,
GSt is the generation structure, and
FIt is the energy (fuel) intensity.
2.2. Multicollinearity Test
Multicollinearity is a statistical phenomenon in which two or more variables in a multiple regression model are highly correlated. Affected by common social and economic environment, variables in Equation (1) usually change with similar regularities. That is to say, multicollinearity is common in this kind of model. Correlation coefficient is a simple method to test the multicollinearity between independent variables, but it is only suitable for two vectors. The
F test is another effective method to measure the linear relationship between dependent and independent variables. If we select a variable as the dependent one and other variables as independent ones, the
F statistic has the ability to test the multicollinearity. The equation of
F test is written as follows.
where ESS is the explained sum of squares; RSS is the residual sum of squares;
p is the number of independent variables in Equation (1), and here it is 7; and
n is the number of samples.
2.3. Partial Least Squares (PLS)
PLS is a widely used regression technique in many fields. It constructs new predictor variables, known as components, as linear combinations of the original predictor variables. PLS constructs these components while considering the observed response values, leading to a parsimonious model with reliable predictive power. One advantage of the PLS is that it can avoid the effect of multicollinearity in the estimation of regression parameters. The other advantage is that the PLS can solve the regression modeling issue under the condition where the number of sample points is less than that of variables. Due to one dependent variable in our work, a brief mathematical description of the PLS is provided.
The standardization process for original data X(Y) is required, and then the first component (t1) is extracted. Let t1 be a variable that explains X(Y). If the result of regression equation shows satisfactory accuracy, the extraction process terminates; otherwise, the procedure extends iteratively in a natural way to give components t1, t2, …, th, where each component is determined from the residuals of regressions on the preceding component until the termination criterion is met. In the following section, we will establish the extended STIRPAT model with CO2 emissions from the power industry and estimate the regression parameters based on the aforementioned PLS method.
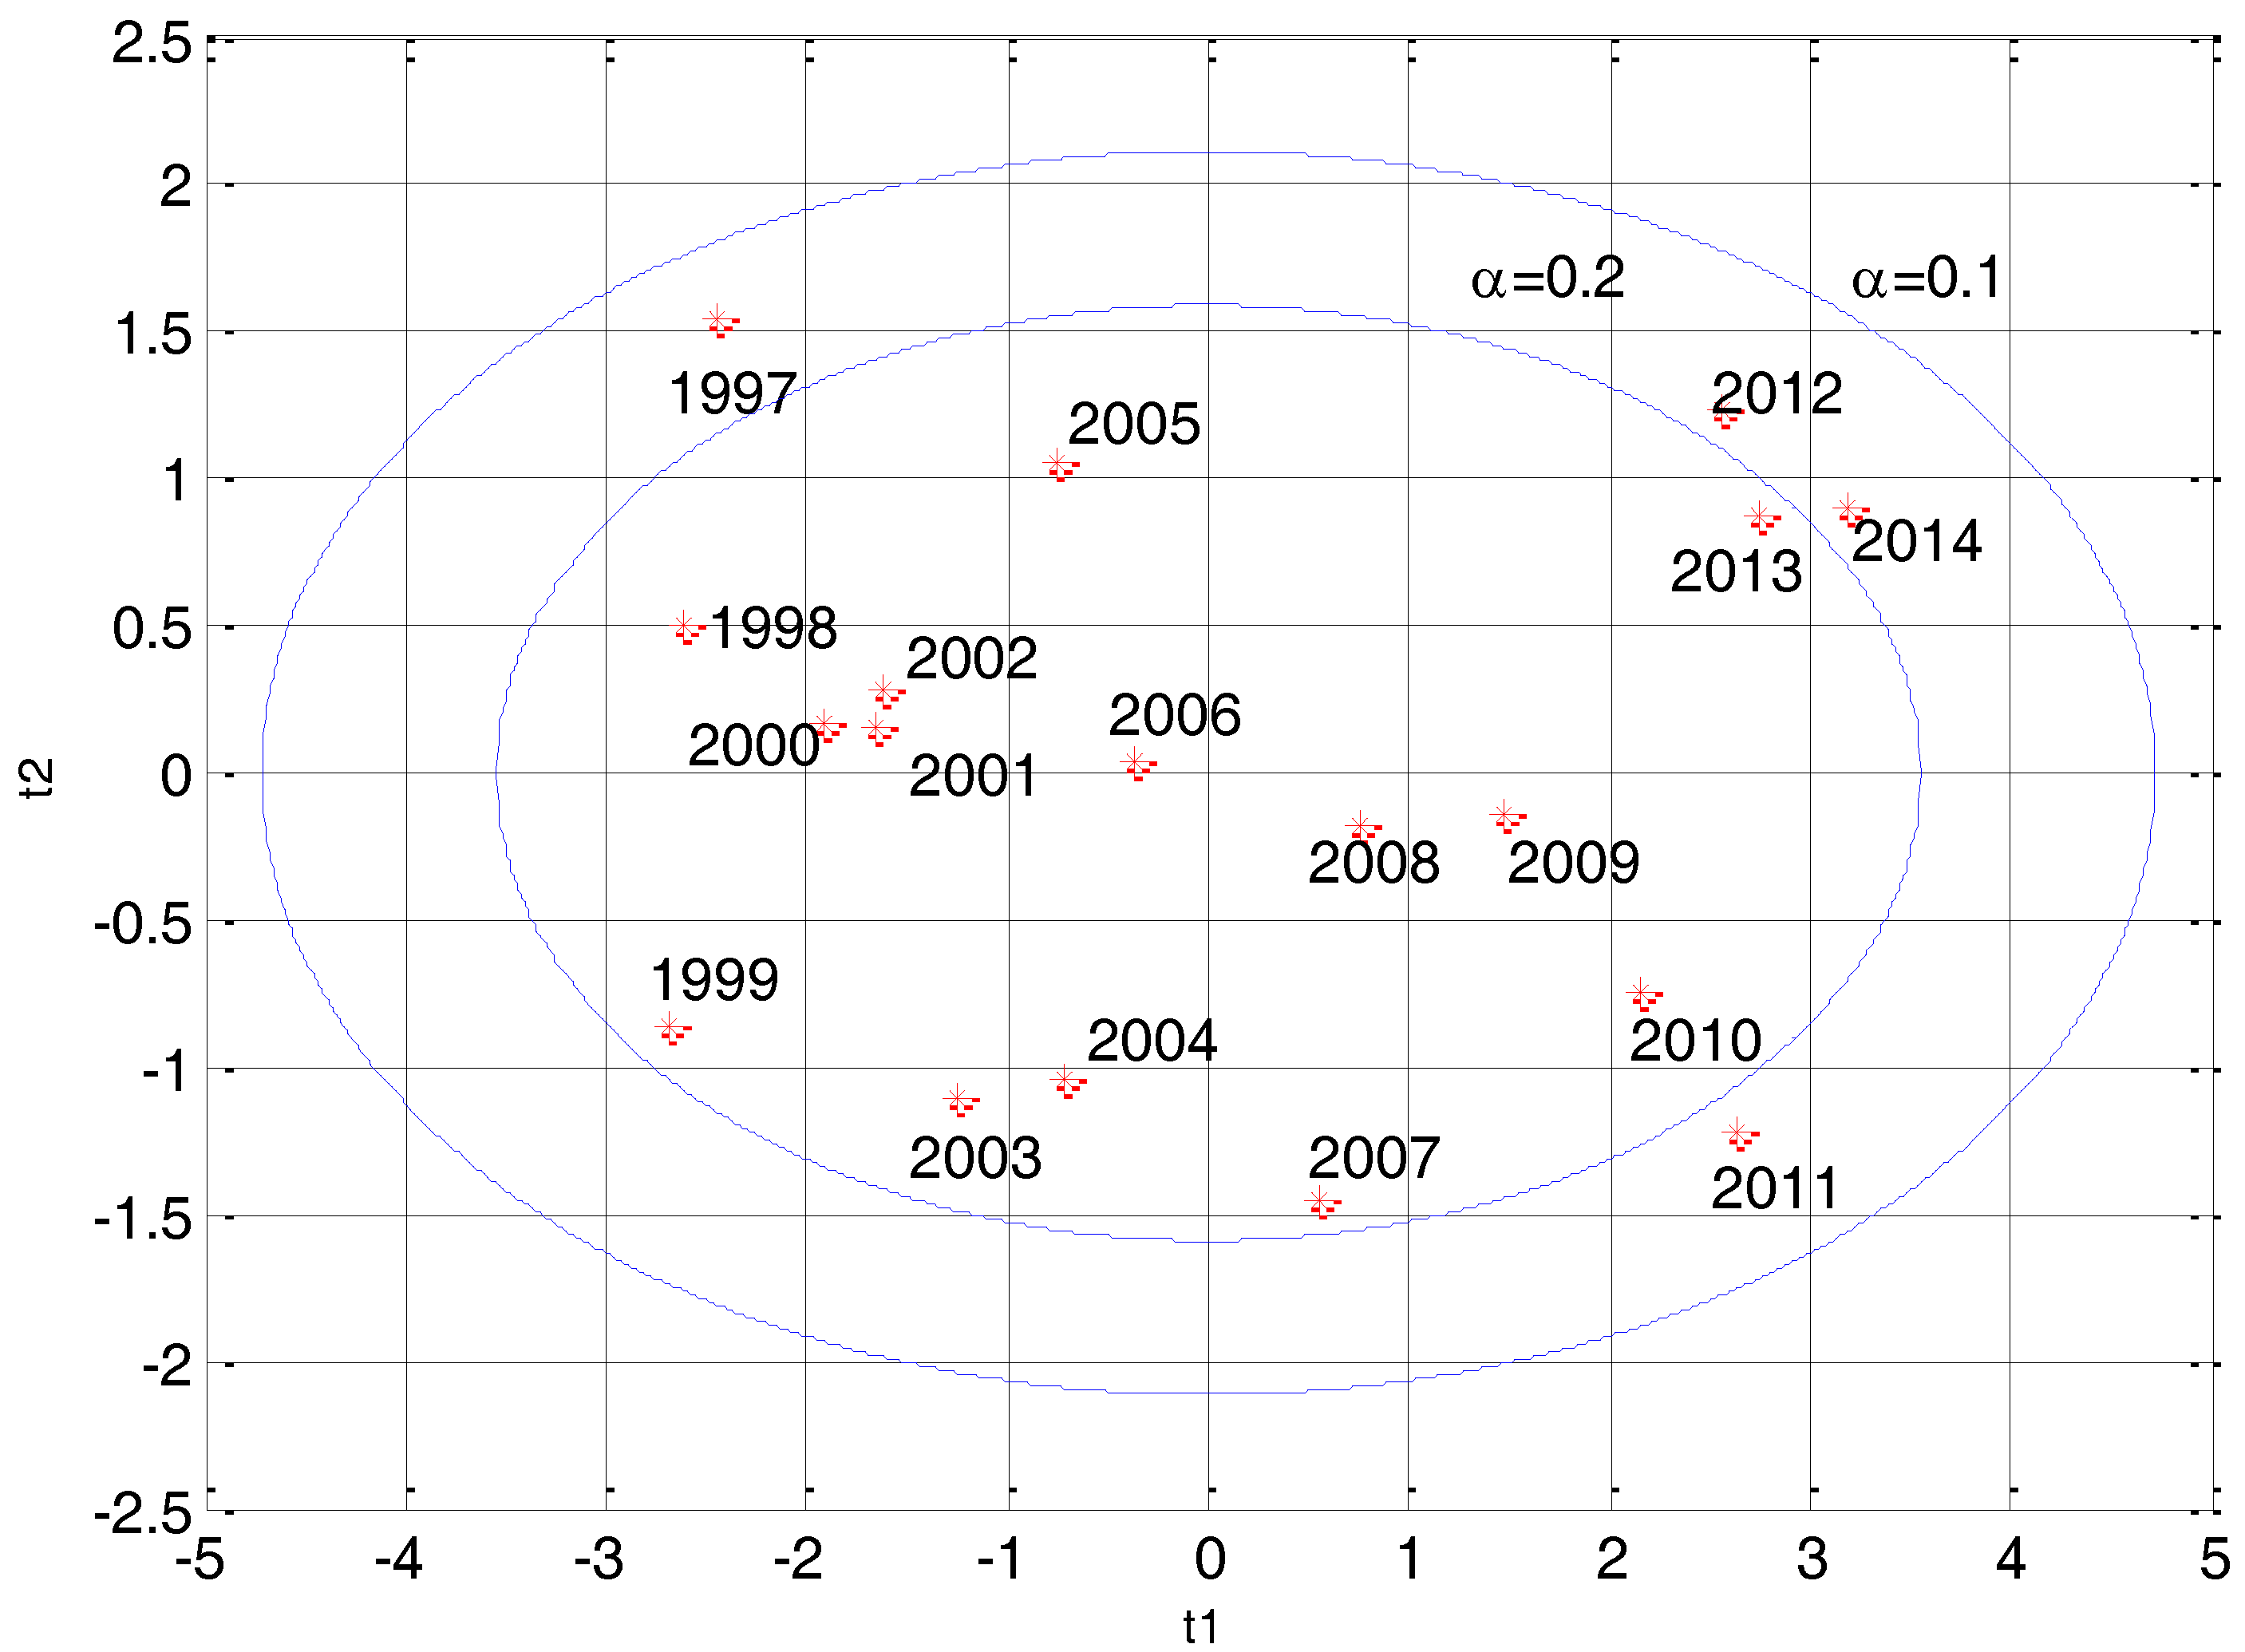
2.4. Outlier Test Algorithm
The regression line which is obtained by PLS is determined by historical data. If the influence of a data point is greater than others, it will be considered as an outlier. In other words, the outlier data point is considered as something unusual that must have happened in that year. Analysis of the outliers will offer many useful possibilities for controlling China’s CO2 emissions from the power industry.
The contribution rate of the
ith sample to all components is written as:
where
thi is the
ith value in the
hth extracted component (vector) in PLS modeling;
m is the number of extracted components; and
n is the number of samples.
The value reflects the influence of the ith sample. If it is bigger than the threshold, the impact of the ith sample on the regression curve is considerable, and the ith sample is then called an outlier.
To test the outliers by statistics, Tracy et al. [
28] constructed an
F test statistic:
If
then the
ith sample is considered an outlier at a confidence level of (1 −
α). If there are two components (
m = 2), Equation (3) is further written as follows:
And Equation (5) is written as:
If the equal sign in Equation (7) holds true, the boundary line of the outliers is an ellipse. Using t1 and t2 as axes, we draw the ellipse and points for each sample on a two-dimensional surface. According to Equation (7), samples outside the ellipse are considered outliers.
2.5. Data Sources
CO
2 emissions from the power industry can be calculated through Equation (8).
where
It is the CO
2 emissions from the power generation sector in
t year;
Et is the electricity generation in
t year,
Ft is the standard coal consumption per kWh in
t year. The CO
2 emission coefficient per unit of standard coal adopted in our work is 2.6308 ton-CO
2/tce, which is recommended by Energy Research Institute (ERI) of the National Development and Reform Commission (NDRC). The data on electricity generation were obtained from China Electric Power Yearbook [
29]. The data on GDP (1995 constant price), population, urbanization, and secondary industry output value were collected from various issues of China Statistical Yearbook [
6]. The electricity intensity data were extracted from China Energy Statistical Yearbook [
9]. The energy (fuel) intensity of power generation data (only considering power plants with more than 6 MW capacity) and the generation structure data also came from China Electric Power Yearbook [
29]. In our work, the time span covered by the samples is from 1997 to 2014.
4. Scenarios of Emissions from Power Sector during 2016–2020
Next, possible development scenarios for the electricity industry development in China for the period 2016–2020 are designed and the associated emissions are calculated for each development mode. There are some reasonable facts considered in our work.
- (A)
Since the adoption of reform and opening-up policy in 1978, China’s economy has experienced a period of remarkable development with annual growth rate of almost 10% over 20 years. It is no doubt that such supernormal development is based on a large amount of the energy consumption, especially electricity consumption. Electricity is considered the backbone for Chinese economy’s prosperity and progress, which plays a crucial role in socioeconomic development. The electricity consumption increased from 14,723.46 ten million kWh in 2001 to 56,383.69 ten million kWh in 2014, with an average annual growth rate of 10.88%.
- (B)
Coal combustion is generally more carbon-intensive than burning any other kind of energy. In China, half of the coal resources are used for electricity generation, making the power industry the largest source of greenhouse emissions. The CO2 emissions from the power industry, accounting for more than 40% of the total national emissions, are larger than that of the world (37% of energy-related CO2 emissions and 27% of all CO2 emissions). From 2001 to 2014, its average annual increase rate was 8.65%, and the CO2 emissions from China’s power sector surpassed that of the total U.S. power industry to become the largest emitter of the world.
- (C)
The period of 2016–2020 covers China’s 13th Five-Year Plan. The coordinated development of the power industry and environmental system will be one of the most important goals. China will reduce CO2 emissions from major pollutants in the power sector by 60% by 2020, and annual CO2 emissions from coal-fired power generation by 180 million tonnes by 2020. The designed scenarios may provide reasonable future development modes applied to China’s power industry.
There has been no sign in recent years that the Chinese government will significantly change its population policy. Therefore, China’s population will increase in accordance with its past trend. In our work, a grey forecasting model is adopted for future yearly population data prediction, which is shown as Equation (12).
Let
k = 19–23, the predicted results of Equation (12) for the period of 2016–2020 can be obtained, which are shown in
Table 5.
Observing the data of China’s urbanization change since the policy of reform and opening up to the outside world, China’s urbanization development can be treated as a nonlinear process. According to the growth curve theory provided by Ray M. Northam in 1975, an American urban geographer, the logistic growth (Verhulst) model is suitable to describe the track of the urbanization process in the countries of the world. Therefore, we applied the Verhulst model to forecasting China’s urbanization trend during the period of 2016–2020. Using the historical urbanization data and Verhulst model, we can obtain the urbanization forecasting equation shown as Equation (13); the corresponding predicted results are shown in
Table 5.
4.1. Business as Usual Scenario (BAU)
The BAU scenario takes place in our nation to maintain open economic relations. That means all the driving factors in Equation (1) keep at a constant change rate in the research period. In this scenario, Chinese government will keep relatively steady economic development with constant annual growth rate during the period of 2016–2020. At the same time, other factors SI, EI, GS, and FI are considered to maintain a steady average annual decrease rate as before.
4.2. Single-Aspect Driving Scenarios Design
In this part, we select A, macro structure aspect (SI and EI) and electric energy efficiency aspect (GS and FI) as driving factors, respectively, to design the next scenarios, shown as follows.
4.2.1. Economy-Driven Scenarios (ED)
In this kind of scenario, the economic factor, represented by GDP per capita, is designed as the main driving force. Since China is not bound by any international treaty to reduce its emissions, the Chinese government can keep the increasing speed of GDP per capita. SI and EI maintain their average annual decrease rate in 1997–2014; GS and FI maintain 80% of their average annual decrease rate in 1997–2014. This scenario is abbreviated as ED1. In ED2, SI and EI maintain 80% of their average annual decrease rate, and GS and FI maintain the average annual decrease rate in the research period.
In ED3 and ED4 scenarios, the Chinese government tries to lower the increasing speed of annual per-unit GDP with 80% growth rate as before because of increased attention paid to the environmental pressure and pursuit of high-quality economy development mode. The design of other factors is similar to ED1 and ED2, shown in
Table 6.
4.2.2. Economic Structure-Driven Scenarios (ESD)
In our work, EI and SI are considered to have manifest relevance. To a large extent, EI could directly reflect the degree of industrial development of a country. The greater the decrease in electricity consumption in industrial sectors in comparison to total electricity consumption, the more pronounced the shift that occurs from the highly electricity-intensive industrial sector to the sector with less electricity intensity, and therefore the less the electricity intensity of GDP. Therefore, these two factors are put together, called macroeconomic structure-driven (short for ESD). In ESD scenarios, the EI and SI maintain 120% of their average annual decrease rate in 1997–2014. At the same time, GDP per capita maintains 100% and 80% of its average annual growth rate in ESD1 and ESD2, respectively; GS and FI maintain 80% and 100% of their average annual decrease rate in 1997–2014.
4.2.3. Energy Efficiency-Driven Scenarios (EED)
Energy efficiency-driven scenarios include the design of GS and FI. These two indicators reflect the power generation structure adjustment and technology improvement in power industry. China is under increasing pressure from the power industry, the largest source of CO2 emissions sector in the country. As a result, the Chinese government will pursue a series of programs to lower the increase of the power sector’s emissions. In EED scenarios, GS and FI are designed together to maintain 120% of their average annual decrease rate in 1997–2014. In EED1, GDP per capita maintains its average annual growth rate; EI and GS keep 80% of their average annual decrease rate. While in EED2, GDP per capita maintains 80% of its average annual growth rate; EI and GS keep 100% of their average annual decrease rate.
4.3. Double-Aspects Driven Scenarios Design
Next, we consider two kinds of aspects to design power industry development scenarios.
4.3.1. Economy and Economic Structure-driven scenarios (EESD)
In EESD scenarios, GDP per capita, SI and EI are combined to act as driving factors. GDP per capita maintains its average annual growth rate in 1997–2014; SI and EI maintain 120% of their average annual decrease rate. GS and FI maintain 80% and 100% of their average annual decrease rate in EESD1 and EESD2, respectively.
4.3.2. Economy and Energy Efficiency-Driven Scenarios (EEED)
In EEED scenarios, GDP per capita, GS, and FI are the main driving factors. GDP per capita maintains its average annual growth rate in 1997–2014; GS and FI maintain 120% of their average annual decrease rate. SI and EI maintain 80% and 100% of their average annual decrease rate in EEED1 and EEED2, respectively.
4.3.3. Economic Structure and Energy Efficiency-Driven Scenarios (ESEED)
The Chinese government will pay more attention to the national emissions, especially the emissions from the power industry. The government will take sterner measures to adjust industrial structure, to improve industrial electric productivity, to develop large and high-efficiency units, to develop renewable generation, and so forth. Therefore, SI, EI, GS, and FI maintain 120% of their average annual decrease rate; meanwhile, GDP per capita maintains 80% and 100% of its annual growth rate in ESEED1 and ESEED2 scenarios, respectively.
The detailed settings of parameters, including the relative change rate and the absolute change values, are shown in
Table 6. According to the parameters’ settings in different scenarios, the CO
2 emissions from China’s power industry under different scenarios can be obtained according to Equation (9), shown in
Table 7.
4.4. Carbon Mitigation Potential in Power Industry
The designed possible scenarios in
Table 7 show that the CO
2 emissions from China’s power industry will increase during the 13th Five-Year period. In the BAU scenario, the CO
2 emissions will increase to 4315.70 Mt in 2016 and 6960.32 Mt in 2020, respectively. Taking the emissions of BAU scenario as the baseline, the relative change rate of emissions for the other scenarios can be calculated according to Equation (14).
where
represents the emissions for
tth period (
t = 2016–2020) in
ith scenario (
i = 1–14), and
is the emissions for
tth period in BAU scenario. The values of relative change rate from 2016 to 2020 for the designed scenarios are listed in
Table 8.
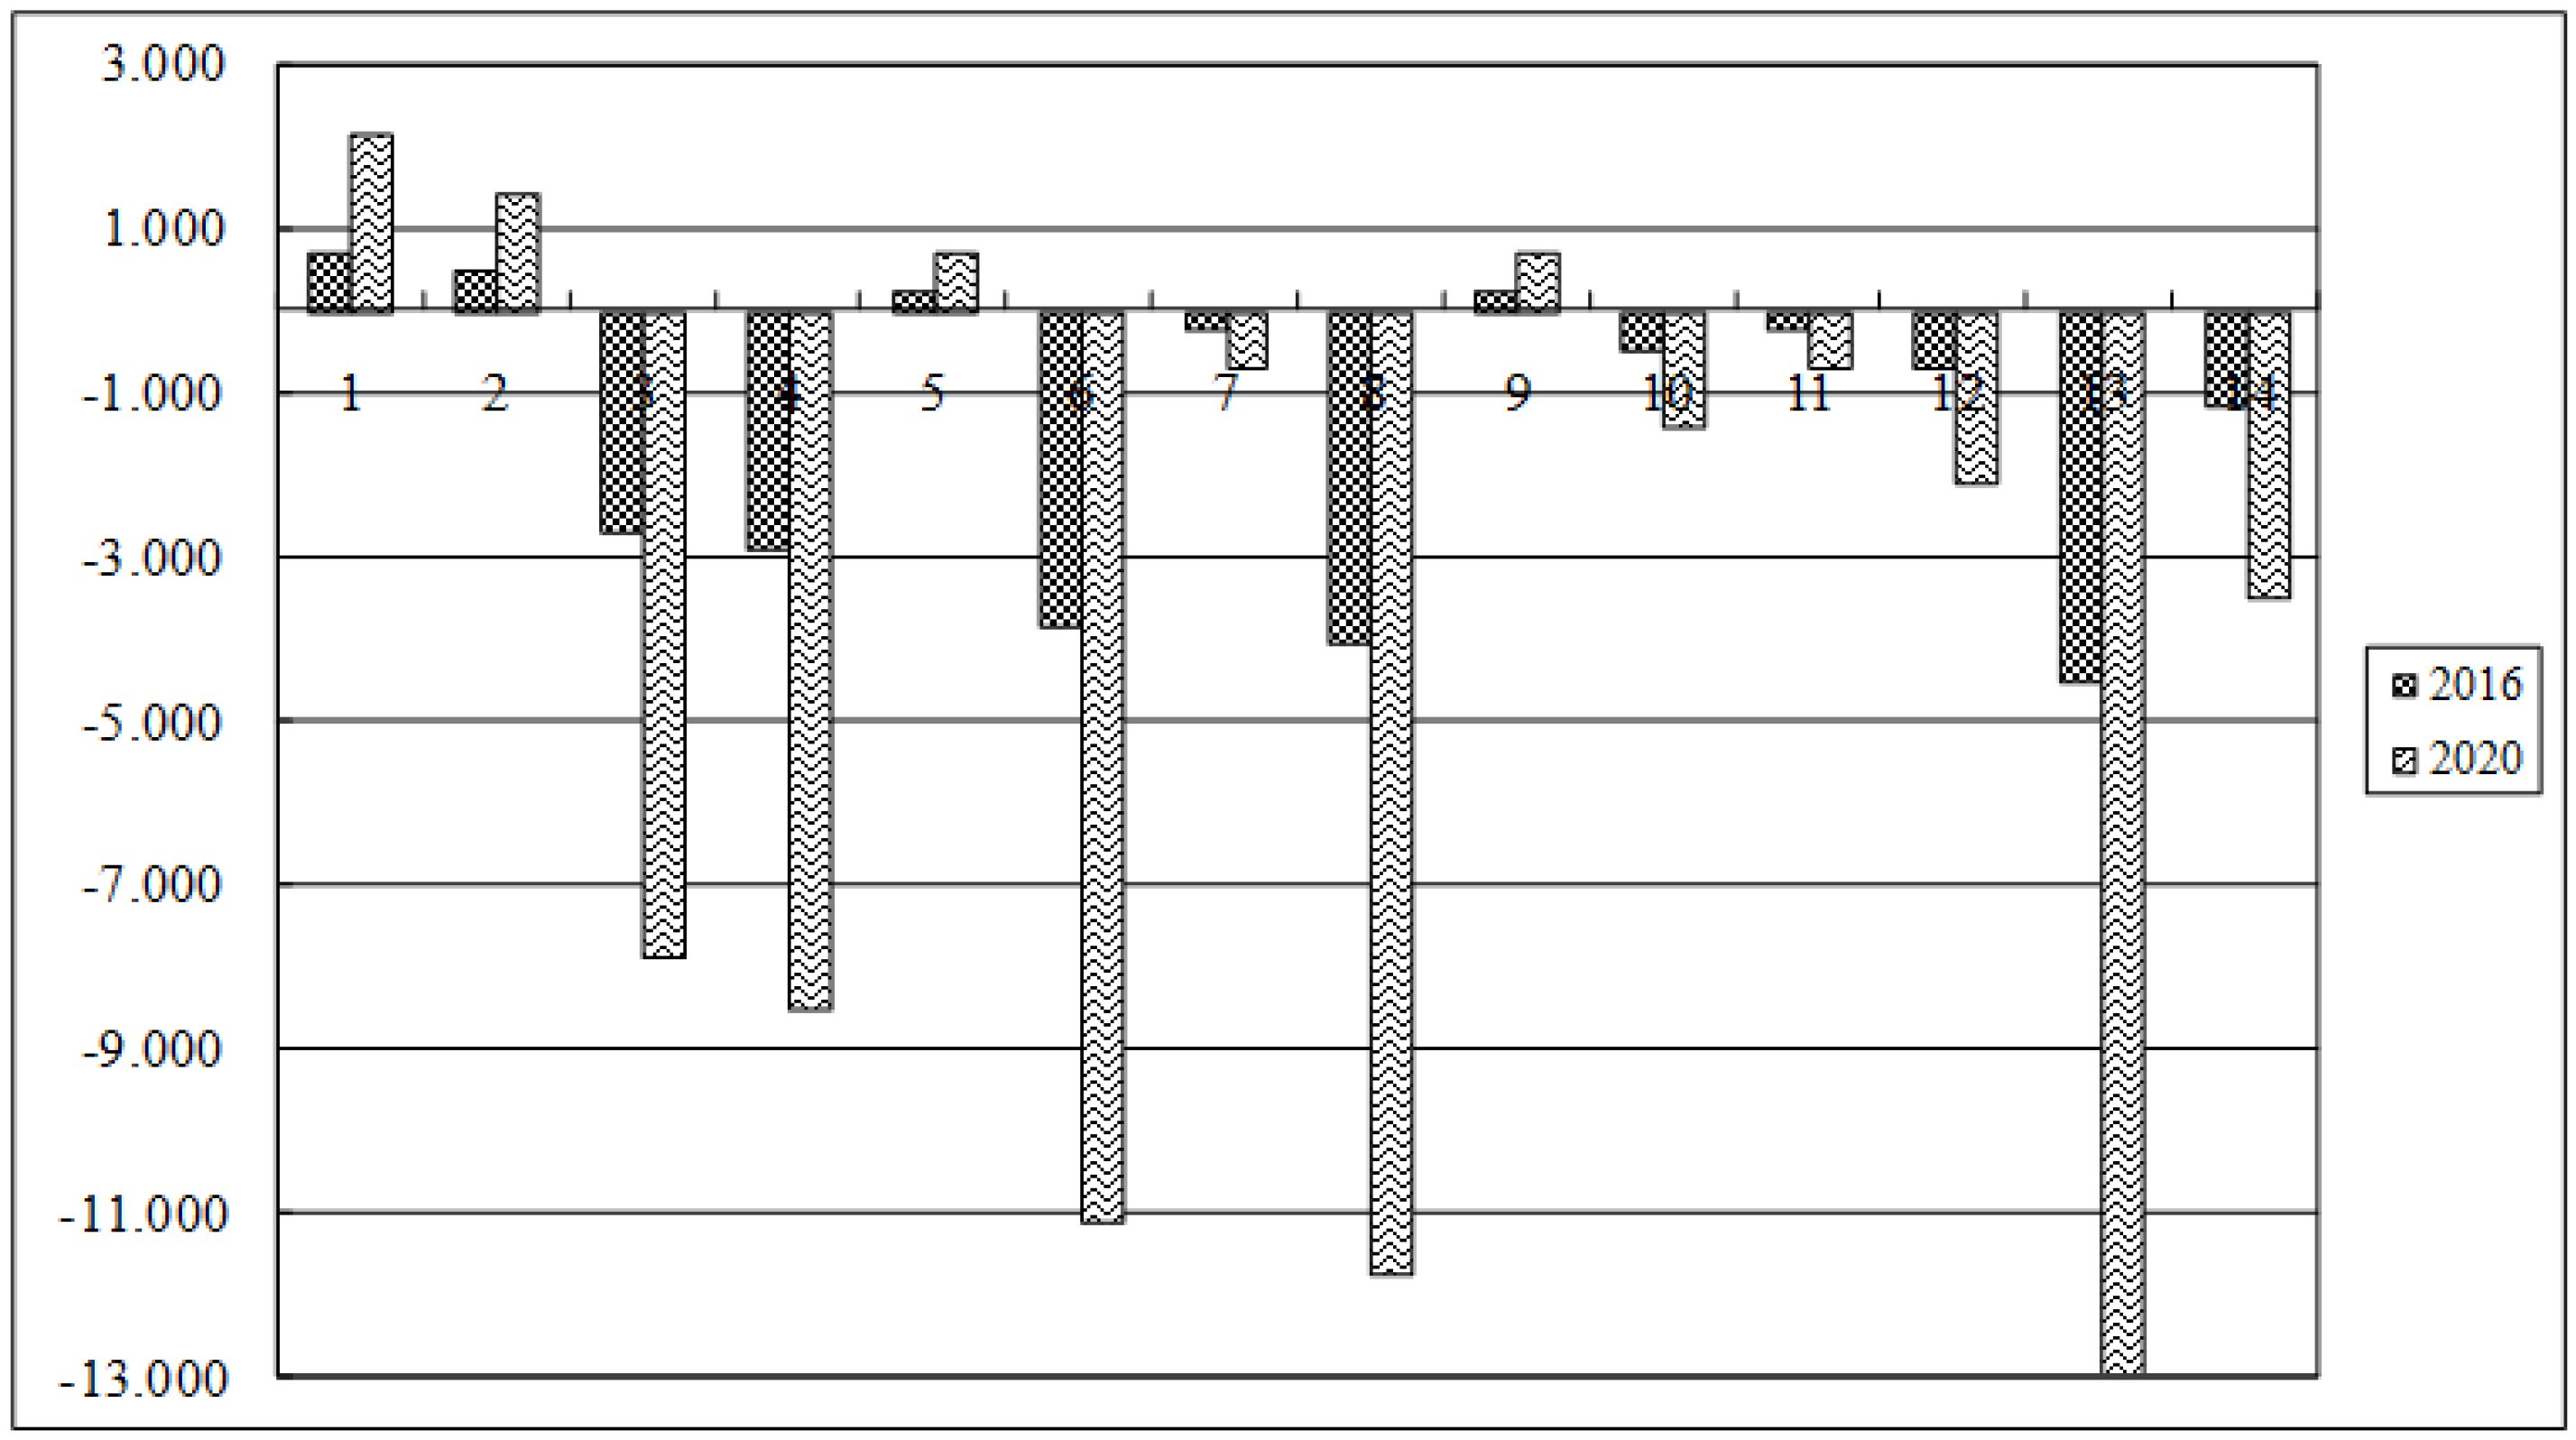
To display the results more clearly and analyze reasonably, the relative reduction rates for all the scenarios in 2016 and 2020 are plotted in histogram, shown in
Figure 2. From the emissions reduction rates shown in
Table 8 and the histogram in
Figure 2, several facts are concluded as follows.
- (1)
It is found that the most significant factor is the economic activity (
A), as shown in the above results. The top five scenarios with the highest emissions reduction rates are the ones in which the GDP per capita is designed with 80% of its average annual growth rate in 1997–2015 (see ESEED1, EED2, ESD2, ED4, and ED3). Even though the other factors (
SI,
EI,
GS,
FI) keep the same change rate, the emissions reduction of the scenarios with higher economic development rate is lower than the ones with lower economic development rate. For example, the reduction rate of scenario ESEED2 with 100% of economic average annual growth rate is 1.184% for year 2016 and 3.51% for year 2020; yet the reduction rate of scenario ESEED1 with 80% of economic average annual growth rate is 4.534% for year 2016 and 12.663% for year 2020. This conclusive result is consistent with China’s present development situation and the previous research [
15,
31,
32]. The changes of CO
2 emissions from power sector stem from the sheer magnitude of China’s economic growth since electricity, the backbone for Chinese economy’s prosperity and progress, which plays a crucial role in socioeconomic development. This means that the massive increment of emissions from the power industry is mainly due to the high growth rate of electricity consumption promoted by economic development. Therefore, to develop a low-carbon power industry, it is necessary to control the economic growth rate and develop a low-carbon economy mode to cope with the emissions.
- (2)
With the same economic development rate, the changes of GS and FI have more effect on the emissions reduction than SI and EI do. In EED2 and ESD2 scenarios, the GDP per capita maintains 80% of its average annual growth rate; SI and EI maintain 100% and 120% of their average annual decrease rate, respectively; and GS and FI maintain 120% and 100% of their average annual decrease rate for the same period. The emissions reduction rates for EED2 are 4.077% and 11.740% for year 2016 and 2020, respectively, while the reduction rates for ESD2 are 3.851% and 11.113% for the same year. Therefore, generation structure optimization and fuel intensity improvement are the sustainable ways for power industry to control its emissions continuously.
- (3)
The decrease in SI, EI, GS, and FI plays a long-term effect on emissions in the power industry. Taking ESEEDD1 scenario as an example, the emissions reduction percentage for year 2016 is 4.534% and 12.96% for year 2020. That means the Chinese government should take long-term measures not only in industry structure adjustment but also in low-carbon power industry enforcement.
- (4)
If the economy maintains the past average annual growth rate, any technological factor (SI, EI, GS, and FI) with 80% of their average annual decrease rate will result in higher emissions than BAU scenario.
The predictive results of scenarios analysis show that the CO2 mitigation potential in the power industry exists in the following aspects.
First, it is necessary to control the economic growth rate and improve the carbon productivity. The Chinese government has changed the economic growth pattern in order to reduce energy and electricity consumption to pursue a more efficient economic mode with higher carbon productivity. In addition, the Chinese government needs to further adjust industrial structure and decrease the electricity intensity, which means shifting away from electricity-intensive and low-added industrial subsectors to electricity-efficient and high-added sectors, improving electricity efficiency in industries.
Second, China will take the most effective measures to improve the carbon efficiency of China's coal-fired power plants. ① Continue to phase out small thermal power plants. It is reported that China would cut at least 90 million tons of raw coal consumption, 220 million tons of CO
2, and 1.8 million tons of SO
2 discharge, if the existing small coal-fired power plants are replaced by large, energy-efficient thermal power plants; ② Construct supercritical (SC) units and ultra-supercritical (USC) units while phasing out small thermal power plants. The Chinese government should continue to replace small units with large ones. Small-scale thermal power-generating units with capacity of 1000 megawatts (MW) and units up to 2000 MW that are coming to the end of their design life have been eliminated during the 12th Five-Year Plan. In the fossil fuel-dominated power industry, supercritical/ultra-supercritical power plants with higher cycle efficiency offer the best opportunity for CO
2 mitigation and combating climate change. In short, China’s future growth in generation capacity is centered on evolving from 300 MW and 600 MW subcritical boilers to larger and more efficient SC and USC boilers ranging in size from 600 MW to 1000 MW. The high-efficient units with 600 MW or (and) 1000 MW will become the backbone of the electricity industry in the future; ③ Optimize the development of coal-based generation plants, which includes implementing integrated gasification combined cycle (IGCC), combined heat and power (CHP), and carbon capture and storage (CCS), speeding up the construction of large-scale coal bases, promoting clean coal power generation technology; ④ Lower auxiliary power rate (APR). A recent study has tested that the generation structure, power plant size, and annual utilization hours of power equipment are important factors affecting APR [
33]. It is regarded that the APR of thermal power plants is higher than any other form of power plants, and the larger the installed capacity for power plants, the lower APR is. Therefore, to phase out small thermal power units and promote large-capacity and high-parameter units are the two effective measures to lower the APR, thus decreasing the energy intensity, and hence the CO
2 emissions, from power plants.
Third, it is sustainable to optimize the generation structure, including developing wind-, solar-, biomass-, and geothermal-power generation, and especially developing hydropower and nuclear power. China has a strong commitment to renewable energy development, shown in the 2006 Renewable Energy Law, which provides economic incentives for renewable energy generation. China’s hydropower resource is abundant but underutilized. After the construction during the 12th and 13th Five-Year Plan, the installed capacity of hydropower generation will reach 3300 GW, utilizing 82% of national hydropower resources. Nuclear power is one of the important green resources with better economic feasibility and large-scale development. The installed capacity of nuclear power generation will reach 90 GW at the end of 2020.
Finally, to utilize substitutable energy can also effectively control the emissions from the power industry. Developing distributed generation (DG) and natural gas generation according to practical situations can manifest effect. In the “New Energy Industry Develop Plan” of the State Council, DG is a key development direction. In April 2010, the Energy Bureau of the NDRC released an instruction for developing DG. The instruction indicates that 1000 DG plants will be built in China during the 13th Five-Year Plan period, and DG capacity in China will increase to 50 GW by 2020.


