1. Introduction
An increasing number of mines are being closed or abandoned worldwide due to depletion. In Korea, 90% of all mines are closed or abandoned, most of them left unattended [
1]. Areas adjacent to abandoned mine sites are exposed to many safety and health hazards due to ground subsidence and toxic minerals dissolved into soil and groundwater. This results in a local economic slump and aggravation of it by the phenomenon known as the “doughnut effect” (inhabitants move from the contaminated areas). This has become a serious social problem impeding balanced development of the unused land. To address these issues, various promotion policies and projects have been launched to implement abandoned mine land reclamation and environmental restoration.
In many countries, recent years have seen increasing cases of installing and operating renewable energy generation systems in abandoned mine sites to promote the reuse and revitalization of abandoned mine lands. Representative U.S. cases are the wind farms constructed at the former coal mine sites of Dave Johnston in Wyoming (capacity: 237 MW, electricity supply: 66,000 households), Somerset in Pennsylvania (34.5 MW, 10,000 households), and Buffalo Mountain in Tennessee (29 MW) [
2]. The largest PV power station in Germany (166 MW) was installed at Meuro, an abandoned mine site near Leipzig [
3]. In Korea, a small-scale photovoltaic (PV) system (85 kW) was installed at the acid mine drainage (AMD) passive treatment facility at the Hambaek coal mine (Jeongseon-gun, Gangwon-do) and another 80-kW PV system at the AMD physicochemical treatment facility at the Hamtae coal mine (Taebaek-si, Gangwon-do).
In addition to the aforementioned cases, many studies have been carried out to find out the renewable energy source best-suited for abandoned mine sites and to assess the feasibility of renewable energy projects prior to the installation and operation of renewable energy generation systems. In the United States, the Environmental Protection Agency (EPA) and National Renewable Energy Laboratory (NREL) jointly run the RE-Powering America’s Land program and operate renewable energy generation facilities at abandoned mine sites (e.g., wind farms and PV systems) [
4]. As a result, a PV power plant is currently under construction at the Chino abandoned mine site in New Mexico [
5], and a PV power plant project is currently underway to reuse the VAG mine site [
6]. In Korea, studies have been conducted to analyze the potential of terrestrial PV systems [
7] and wind power systems [
8] at seven abandoned mine-promotion districts at regional scale. Moreover, the feasibility of PV systems at AMD passive treatment facilities in abandoned mine sites was assessed at local scale [
9].
Many studies have been conducted in relation to planning, designing, installing, and operating renewable energy generation systems at abandoned mine sites. However, there is no known study on the potential for use of PV systems in open-pit mines during the closure-planning process. Open-pit mines are considered inadequate as sites for installing PV systems because their topographic characteristics do not allow space for large-scale PV systems. Moreover, the slopes around them produce large surface shadows on the array of PV panels, thus limiting their efficiency. However, because many countries have resorted to filling deep concave open pits with water to form pit lakes as an eco-friendly method for mine closure [
10], PV system installation and operation may become feasible if we use the pit lake surface.
Recently, many floating PV systems have evolved in varying degrees for use in ponds, reservoirs, canals, rivers and oceans. The floating PV systems include conventional PV arrays as well as concentrated PV arrays that benefit from the surrounding water body to prevent overheating of the solar cells [
11]. Trapani and Redón Santafé [
11] reviewed the various floating PV projects that have been realized in throughout the years. The main motivation for the floating PV systems was the land premium especially for agricultural sites. In abandoned mine sites, the floating PV systems on mine pit lakes may be an efficient reuse option for the land. To assess its feasibility, it is necessary to quantitatively analyze the potential of floating PV systems at water-filled open pits.
Against this background, this study aims to analyze the expected effects of a 1-MW floating PV system to be installed on the pit lake surface of an open-pit mine currently being prepared for closure. As the study site, we selected the Ssangyong limestone mine, one of the largest open-pit mines in Korea. After a solar site-assessment of the pit lake to be formed using a geographic information system (GIS) and a fish-eye lens camera, a 1-MW floating PV system will be designed taking into account the voltage relationship between PV modules and inverters, optimal tilt angle and array spacing. In addition, power generation, reduction of greenhouse gas (GHG) emissions, and economic effects that are expected to be achieved by installing the floating PV system on the pit lake, will be calculated using the System Advisor Model (SAM) developed by NREL. The economic effects will be assessed by comparing the calculated results with those of terrestrial PV systems analyzed at other abandoned mine sites in Korea, thereby applying the economic analysis parameter values suggested by Song
et al. [
7]. Based on the study results, effects of forest restoration and floating PV system installation on the pit lake, two methods of restoring abandoned open-pit mines, will be compared for reducing GHG emissions and initial investment cost.
2. Study Area
The study site is an open-pit limestone mine (Ssangyong Resources Development Co., Ltd.) located in Donghae City, Gangwon Province, Korea. It covers a surface area of 9.58 km
2 and currently produces limestone for cement production at the rate of 1.4 million ton/year from three open-pits. Of the three pits, depletion has caused Pit 1 to be prepared for mine closure. As shown in
Figure 1a, the plan is to fill the concave part of the pit with water to form a pit lake. At its center, there is already a naturally formed pit lake (
Figure 1b).
Table 1 presents the meteorological characteristics of the study site. The average cumulative global solar irradiation is 1275.6 kWh/m
2/year, and the average annual temperature is 13 °C. The pit lake in the study site is a self-contained water environment with the average wind speed of 2.5 m/s. Therefore, the requirements for the structure and mooring are relatively lower than those in a marine environment which would endure additional loading from the tides, high winds and waves [
11,
12].
Figure 1.
Study area: (a) Boundary of the pit lake planned in Pit 1; (b) View of the current pit lake naturally established in Pit 1.
Figure 1.
Study area: (a) Boundary of the pit lake planned in Pit 1; (b) View of the current pit lake naturally established in Pit 1.
Table 1.
Meteorological characteristics of the study site.
Table 1.
Meteorological characteristics of the study site.
| Item | Value | Item | Value |
|---|
| Latitude (deg) | 37.75 | Direct normal irradiation (kWh/m2/year) | 1046.3 |
| Longitude (deg) | 128.9 | Global horizontal irradiation (kWh/m2/year) | 1275.6 |
| Dry-bulb temperature (°C) | 13.0 | Wind speed (m/s) | 2.5 |
3. Methods
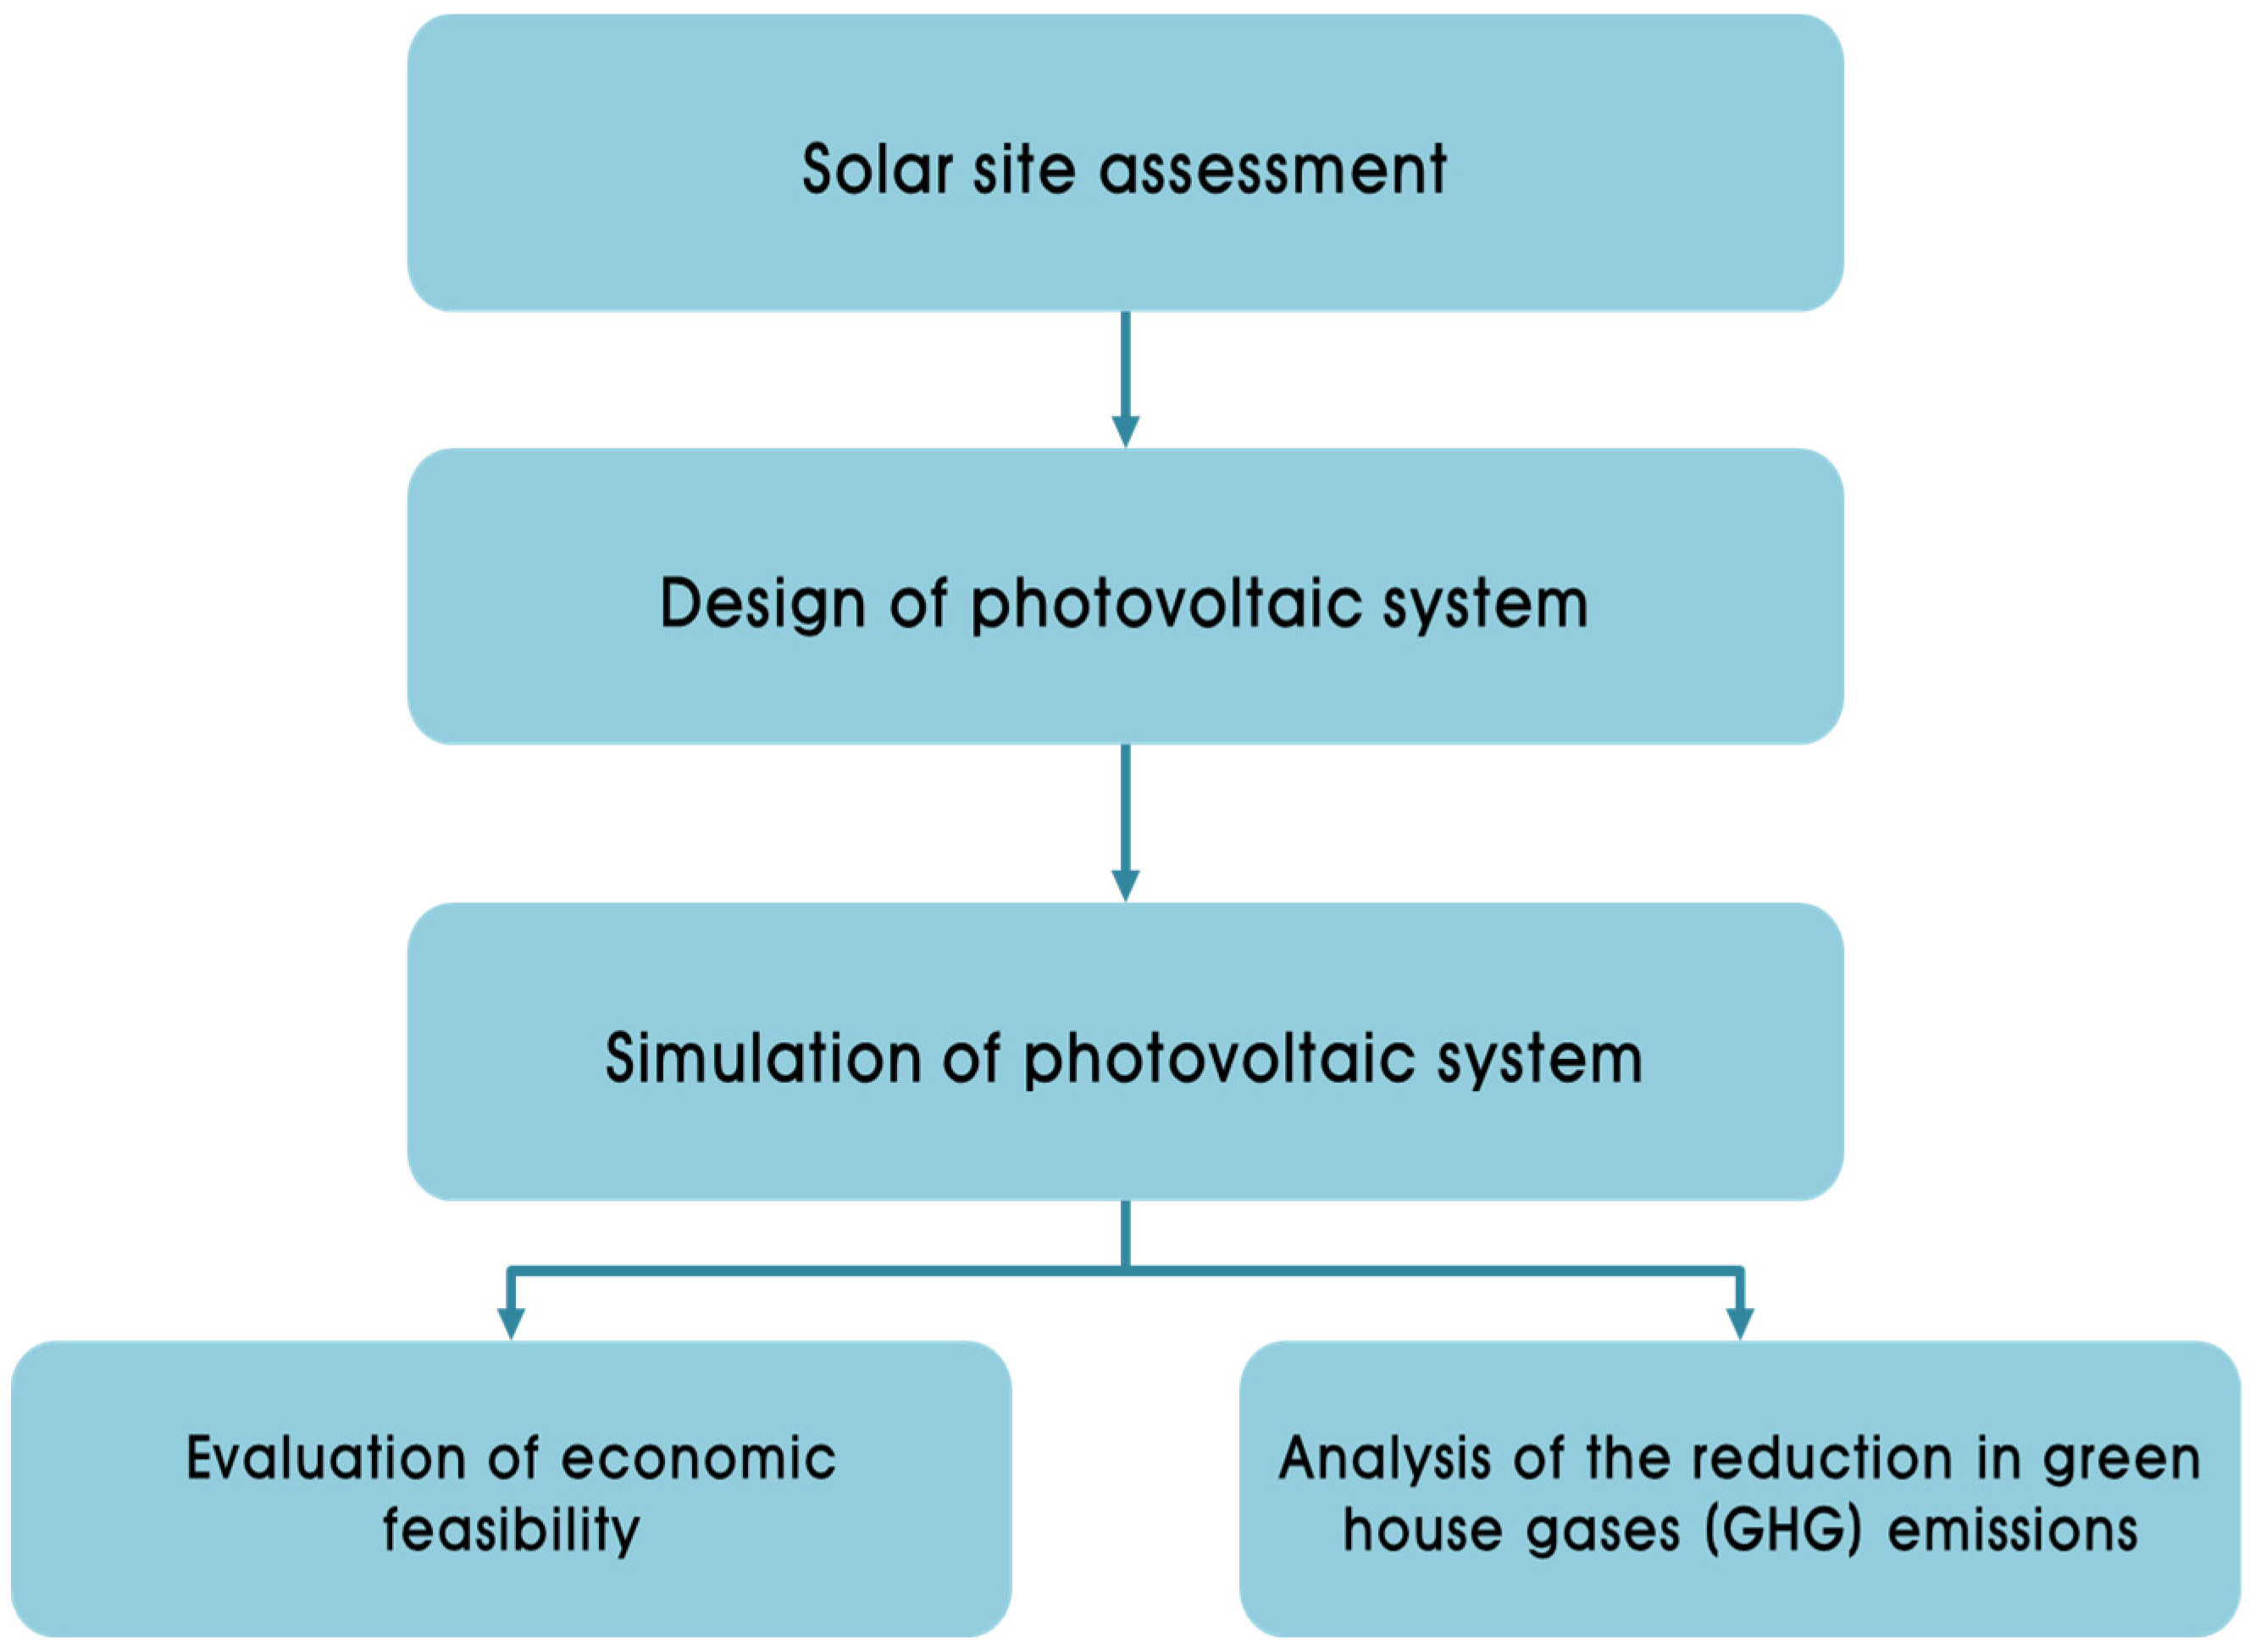
Figure 2 shows the 5-step study process used to assess the expected effects from the 1-MW floating PV system on the pit lake to be formed in Pit 1. The study process can be summarized as follows. In the first step, a field survey was performed using GIS software [
13] and a fish-eye lens camera [
14] to assess the pit lake area suitable for installation of the floating PV system. In the second step, the location for the floating PV system was selected and the 1-MW power generation system was designed taking into account the voltage relationship between PV modules and inverters. In the third step, the possible power production capacity of the floating PV system was estimated by entering the meteorological data and system design parameters into the SAM software. Based on the estimated power production, the economic feasibility and reduction in GHG emissions were assessed in the fourth and fifth steps, respectively.
Figure 2.
Overall procedure to assess the potential of a 1-MW floating photovoltaic system in the study site.
Figure 2.
Overall procedure to assess the potential of a 1-MW floating photovoltaic system in the study site.
3.1. Solar Site Assessment
For the solar site assessment of the pit lake at the study site, a digital elevation model (DEM) with spatial resolution of 5 m was created using ArcGIS and a digital topographic map with a map scale of 1:5000, produced in 2014 by the National Geographic Information Institute of Korea [
15]. The DEM was used to assess the effects of the cast shadows on the pit lake surface by the surrounding topography. In order to assess the effects of shadows on the PV system with a conservative evaluation method, we analyzed the daily sunshine hours on the pit lake surface using the solar radiation analysis tool in ArcGIS and DEM on the winter solstice, the day when the sun is at its lowest noon altitude.
To measure the shadow effects caused by small obstacles that cannot be captured with DEM, such as vegetation, the skyline was recorded and analyzed using a fish-eye lens camera (SunEye210). This enabled field analysis of the skyline at the solar site. The results of shadow-effect analysis were stored in the form of a shading matrix consisting of month-by-hour shading data for shading elements surrounding the solar site, as expressed by values between “0.0” (complete shielding of direct radiation reaching the PV system) and “1.0” (no shading effects) [
16].
3.2. Design of the Photovoltaic System
For the purpose of the study, it was hypothesized that solar PV panels constitute a fixed-tilt array, and the 1-MW floating PV system to be installed the highest energy output on the pit lake surface was designed with the following parameters: number of modules per string, installation angle of the solar array, and array spacing. The number of modules was determined by considering the Maximum Power Point Tracking (MPPT) voltage in the inverter and the open circuit voltage in the module. The total number of modules was calculated by module per string (
) and strings in parallel (
) [
17].
Module per string (
) was calculated using Equation (1):
is the maximum MPPT voltage, and
is the minimum MPPT voltage in the inverter. Here,
represents the maximum power voltage of the module. The strings in parallel (
) was calculated using Equation (2),
is the module max power, and Equation (3) was used to calculate the total number of inverters required (
).
is the module maximum power. represents the DC-to-AC ratio, and was given a value of 1.0. is the maximum AC power of the inverter.
The installation angle of the fixed-tilt solar array was varied among 25°, 30°, 35°, 40°, and 45°. The spacing between arrays was calculated with Equation (4).
where
X1 is the array spacing (m),
Tilt is the tilt angle (°) of the installed array,
L is the length (m) of the module, and
Lat is the latitude of the solar site.
Once the array spacing and tilt angle of each string is determined, the total area of the solar site required was calculated using Equation (5).
where
,
X1, and
denote the number of modules per string, width (in meters) of a module, array spacing (in meters), and string in parallel, respectively.
Table 2 lists the product parameters of the PV module and inverter employed for the floating PV system in this study.
Table 2.
Parameters of photovoltaic module and inverter.
Table 2.
Parameters of photovoltaic module and inverter.
| Photovoltaic module | Model | BLK-210 |
| Module’s maximum power | 215.25 W |
| Module width | 1 m |
| Max power voltage (Vmp) | 41 V |
| Max power current (Imp) | 5.3 Adc |
| Open circuit voltage (Voc) | 47.7 V |
| Short circuit current (Isc) | 5.8 Adc |
| Inverter | Model | SB4000US 240V |
| Maximum AC power | 4000 Wac |
| Maximum DC power | 4186 Wdc |
| Maximum DC current | 18 Adc |
| Maximum DC voltage | 600 Vdc |
| Minimum MPPT voltage | 250 V |
| Maximum MPPT voltage | 480 V |
There is a possibility that birds build nests and breed at the floating PV system [
18]. This study assumed that regular monitoring and maintenance will be done to prevent animals from conquering the facility.
3.3. Simulation of the Photovoltaic System
The SAM software, developed by NREL (USA) was used for design and financial analysis of the renewable energy systems. It enables complex analyses of how to install a PV system, given the inverter and the module characteristics, and the irradiance conditions. For an explanation of the use of SAM refer to Song and Choi [
19]. In this study, the electricity production of a 1-MW floating PV system was calculated by entering the meteorological data of the study site provided by the Korea Meteorological Administration [
20], the shading-matrix data obtained by onsite solar assessment, and the five system-design variations according to the tilt angle of the fixed-tilt solar array, into the SAM software.
The current version of SAM has no separate feature for floating PV systems. Therefore, relying on the experimental results of a study by Choi [
21], according to which a floating PV system yielded 11% greater power output than a terrestrial counterpart, we added 11% to the SAM output value.
3.4. Evaluation of Economic Feasibility
The initial cost and annual operating cost of the newly designed floating PV system was estimated in accordance with the initial investment cost standards of PV system in Korea, proposed by Lee
et al. [
12]. In order to estimate the revenue from power generation and sales, the renewable portfolio standard (RPS) system in Korea, which began in 2012, and system marginal price (SMP) [
22] were used. The RPS system mandates that power production businesses supply a certain proportion of their total production from renewable energy sources, and allows trades among suppliers in the renewable energy certificates (REC) market. A REC weight of 1.5 was applied in this study. SMP is the revenue from selling electricity through the Korea Power Exchange.
The NPV of the PV system was calculated as in Equation (6).
here, NPV means net present value (USD), N means system operating period (year), E
t means annual electricity sales revenue (USD), C
t means annual operating cost (USD), r means discount rate, and C
0 means initial cost (USD). The present study applied the social discount rate of 5.5% proposed by the Korea Development Institute in 2013 [
23] to the discount rate (r), and the project period (N) was estimated as 20 years considering the reported durability of the solar modules [
24]. The electricity sales revenue was calculated by multiplying the electricity output by the sales price. These economic parameters are identical to those used by Song
et al. [
7].
The years to payback were estimated by calculating N when NPV becomes zero in Equation (6). The internal rate of return (IRR) that discounts the sum of converting cash revenue flow into present value to investment spending, can be obtained by calculating the value that makes NPV zero.
3.5. Analysis of Greenhouse Gas Reduction
Reduction of GHG emissions refers to the amount of greenhouse gases generated when a fossil-fuel energy system is used to generate the same amount of electricity produced by a renewable energy system. This was calculated using Equation (7):
is the amount of GHG reduced annually (tCO
2/year), E
s is the annual electricity production from the PV system (MWh/year), G is the standard value of GHG emission of each country (tCO
2/MWh), and β is the average loss rate of power transmission and distribution. In this study, the Korean standard value of GHG emission (0.467 tCO
2/MWh) and average loss rate of power transmission and distribution (0.369), provided by the Korea Electric Power Corporation [
25], were used to analyze the reduction of GHG emissions gained through installation of the floating PV systems.
4. Results
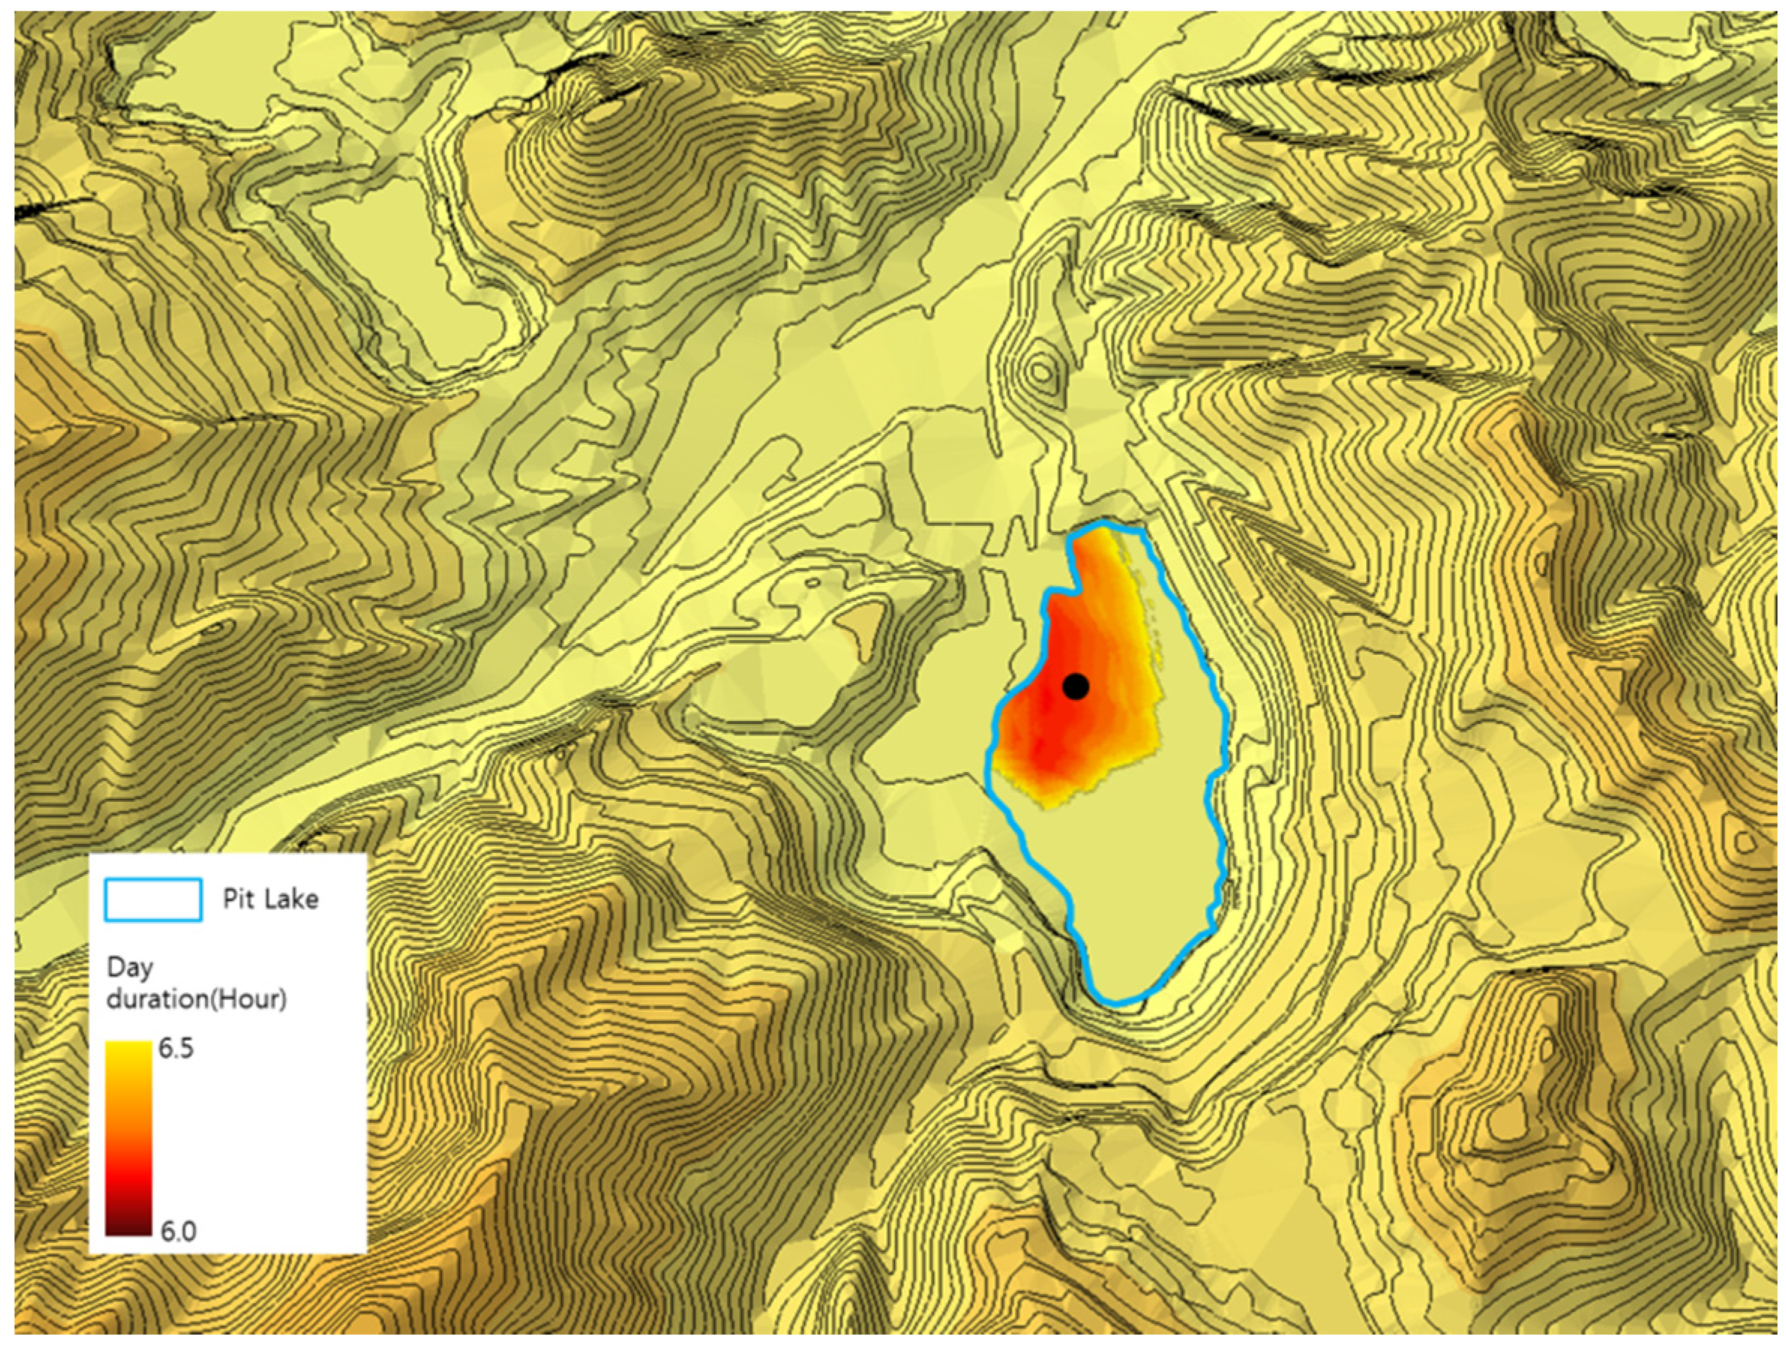
Figure 3 depicts the sunshine hours on the pit lake surface at the winter solstice as analyzed using the 5-m-resolution DEM to determine the effects of the cast shadows of the surrounding topography on the pit lake surface. The maximum number of sunshine hours was 6.5 hour/day. The portion of the pit lake surface with at least six sunshine hours per day was found to be 87,650 m
2, accounting for 38.9% of the total surface area (225,450 m
2), and was located mainly in the northwestern part.
Figure 3.
Daylight duration of 6.0–6.5 hour/day in the study area. The black spot represents the location from which the skyline was recorded by SunEye210.
Figure 3.
Daylight duration of 6.0–6.5 hour/day in the study area. The black spot represents the location from which the skyline was recorded by SunEye210.
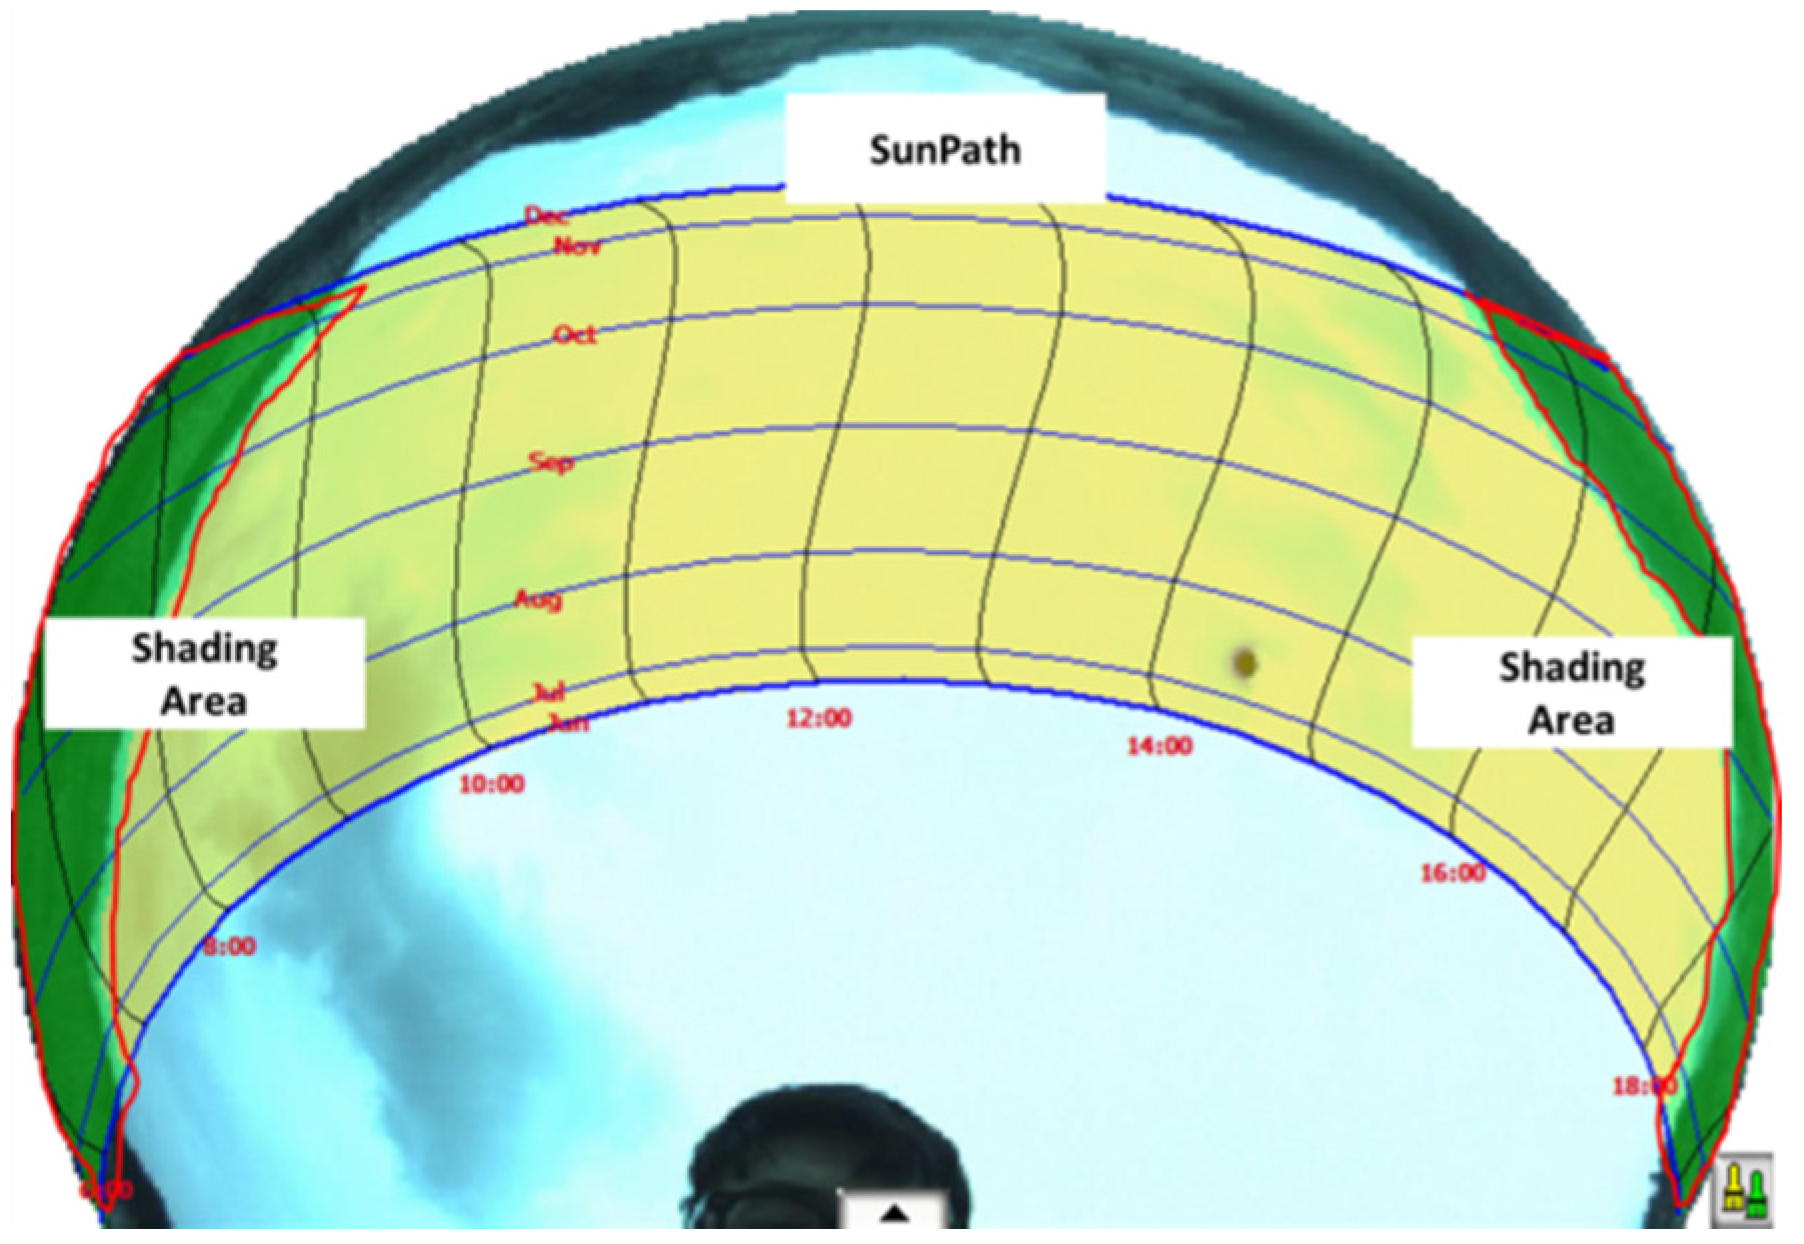
Small obstructions around the pit lake were analyzed using skyline images captured from the center of the pit lake surface areas with at least 6 hour/day of sunshine in winter. As shown in
Figure 4, the obstructions of interest were to the east and west of the center point of the image. The shading analysis was performed by checking the obstruction distribution against the sun path chart drawn based on the latitude of the study site. This revealed that their shading effect was greater in winter.
Table 3 presents the shading matrix averaging the skyline analysis in triplicate, from the same observation points.
Figure 4.
Result of shading analysis using SunEye210.
Figure 4.
Result of shading analysis using SunEye210.
Table 3.
Month-by-hour shading matrix generated from the results of shading analysis using SunEye210.
Table 3.
Month-by-hour shading matrix generated from the results of shading analysis using SunEye210.
| | 6 | 7 | 8 | 9 | 10 | 11 | 12 | 13 | 14 | 15 | 16 | 17 | 18 |
|---|
| January | 0.00 | 0.00 | 0.00 | 0.00 | 0.51 | 1.00 | 1.00 | 1.00 | 1.00 | 1.00 | 0.61 | 0.00 | 0.00 |
| February | 0.00 | 0.00 | 0.00 | 0.05 | 0.89 | 1.00 | 1.00 | 1.00 | 1.00 | 1.00 | 0.97 | 0.14 | 0.00 |
| March | 0.00 | 0.00 | 0.00 | 0.55 | 1.00 | 1.00 | 1.00 | 1.00 | 1.00 | 1.00 | 1.00 | 0.91 | 0.00 |
| April | 0.00 | 0.00 | 0.38 | 1.00 | 1.00 | 1.00 | 1.00 | 1.00 | 1.00 | 1.00 | 1.00 | 1.00 | 0.00 |
| May | 0.00 | 0.21 | 0.99 | 1.00 | 1.00 | 1.00 | 1.00 | 1.00 | 1.00 | 1.00 | 1.00 | 1.00 | 0.00 |
| June | 0.00 | 0.48 | 0.00 | 1.00 | 1.00 | 1.00 | 1.00 | 1.00 | 1.00 | 1.00 | 1.00 | 1.00 | 0.00 |
| July | 0.00 | 0.27 | 0.00 | 1.00 | 1.00 | 1.00 | 1.00 | 1.00 | 1.00 | 1.00 | 1.00 | 1.00 | 0.00 |
| August | 0.00 | 0.01 | 0.75 | 1.00 | 1.00 | 1.00 | 1.00 | 1.00 | 1.00 | 1.00 | 1.00 | 1.00 | 0.00 |
| September | 0.00 | 0.00 | 0.14 | 0.98 | 1.00 | 1.00 | 1.00 | 1.00 | 1.00 | 1.00 | 1.00 | 1.00 | 0.00 |
| October | 0.00 | 0.00 | 0.00 | 0.67 | 1.00 | 1.00 | 1.00 | 1.00 | 1.00 | 1.00 | 0.91 | 0.24 | 0.00 |
| November | 0.00 | 0.00 | 0.00 | 0.15 | 0.99 | 1.00 | 1.00 | 1.00 | 1.00 | 1.00 | 0.33 | 0.00 | 0.00 |
| December | 0.00 | 0.00 | 0.00 | 0.00 | 0.70 | 1.00 | 1.00 | 1.00 | 1.00 | 1.00 | 0.27 | 0.00 | 0.00 |
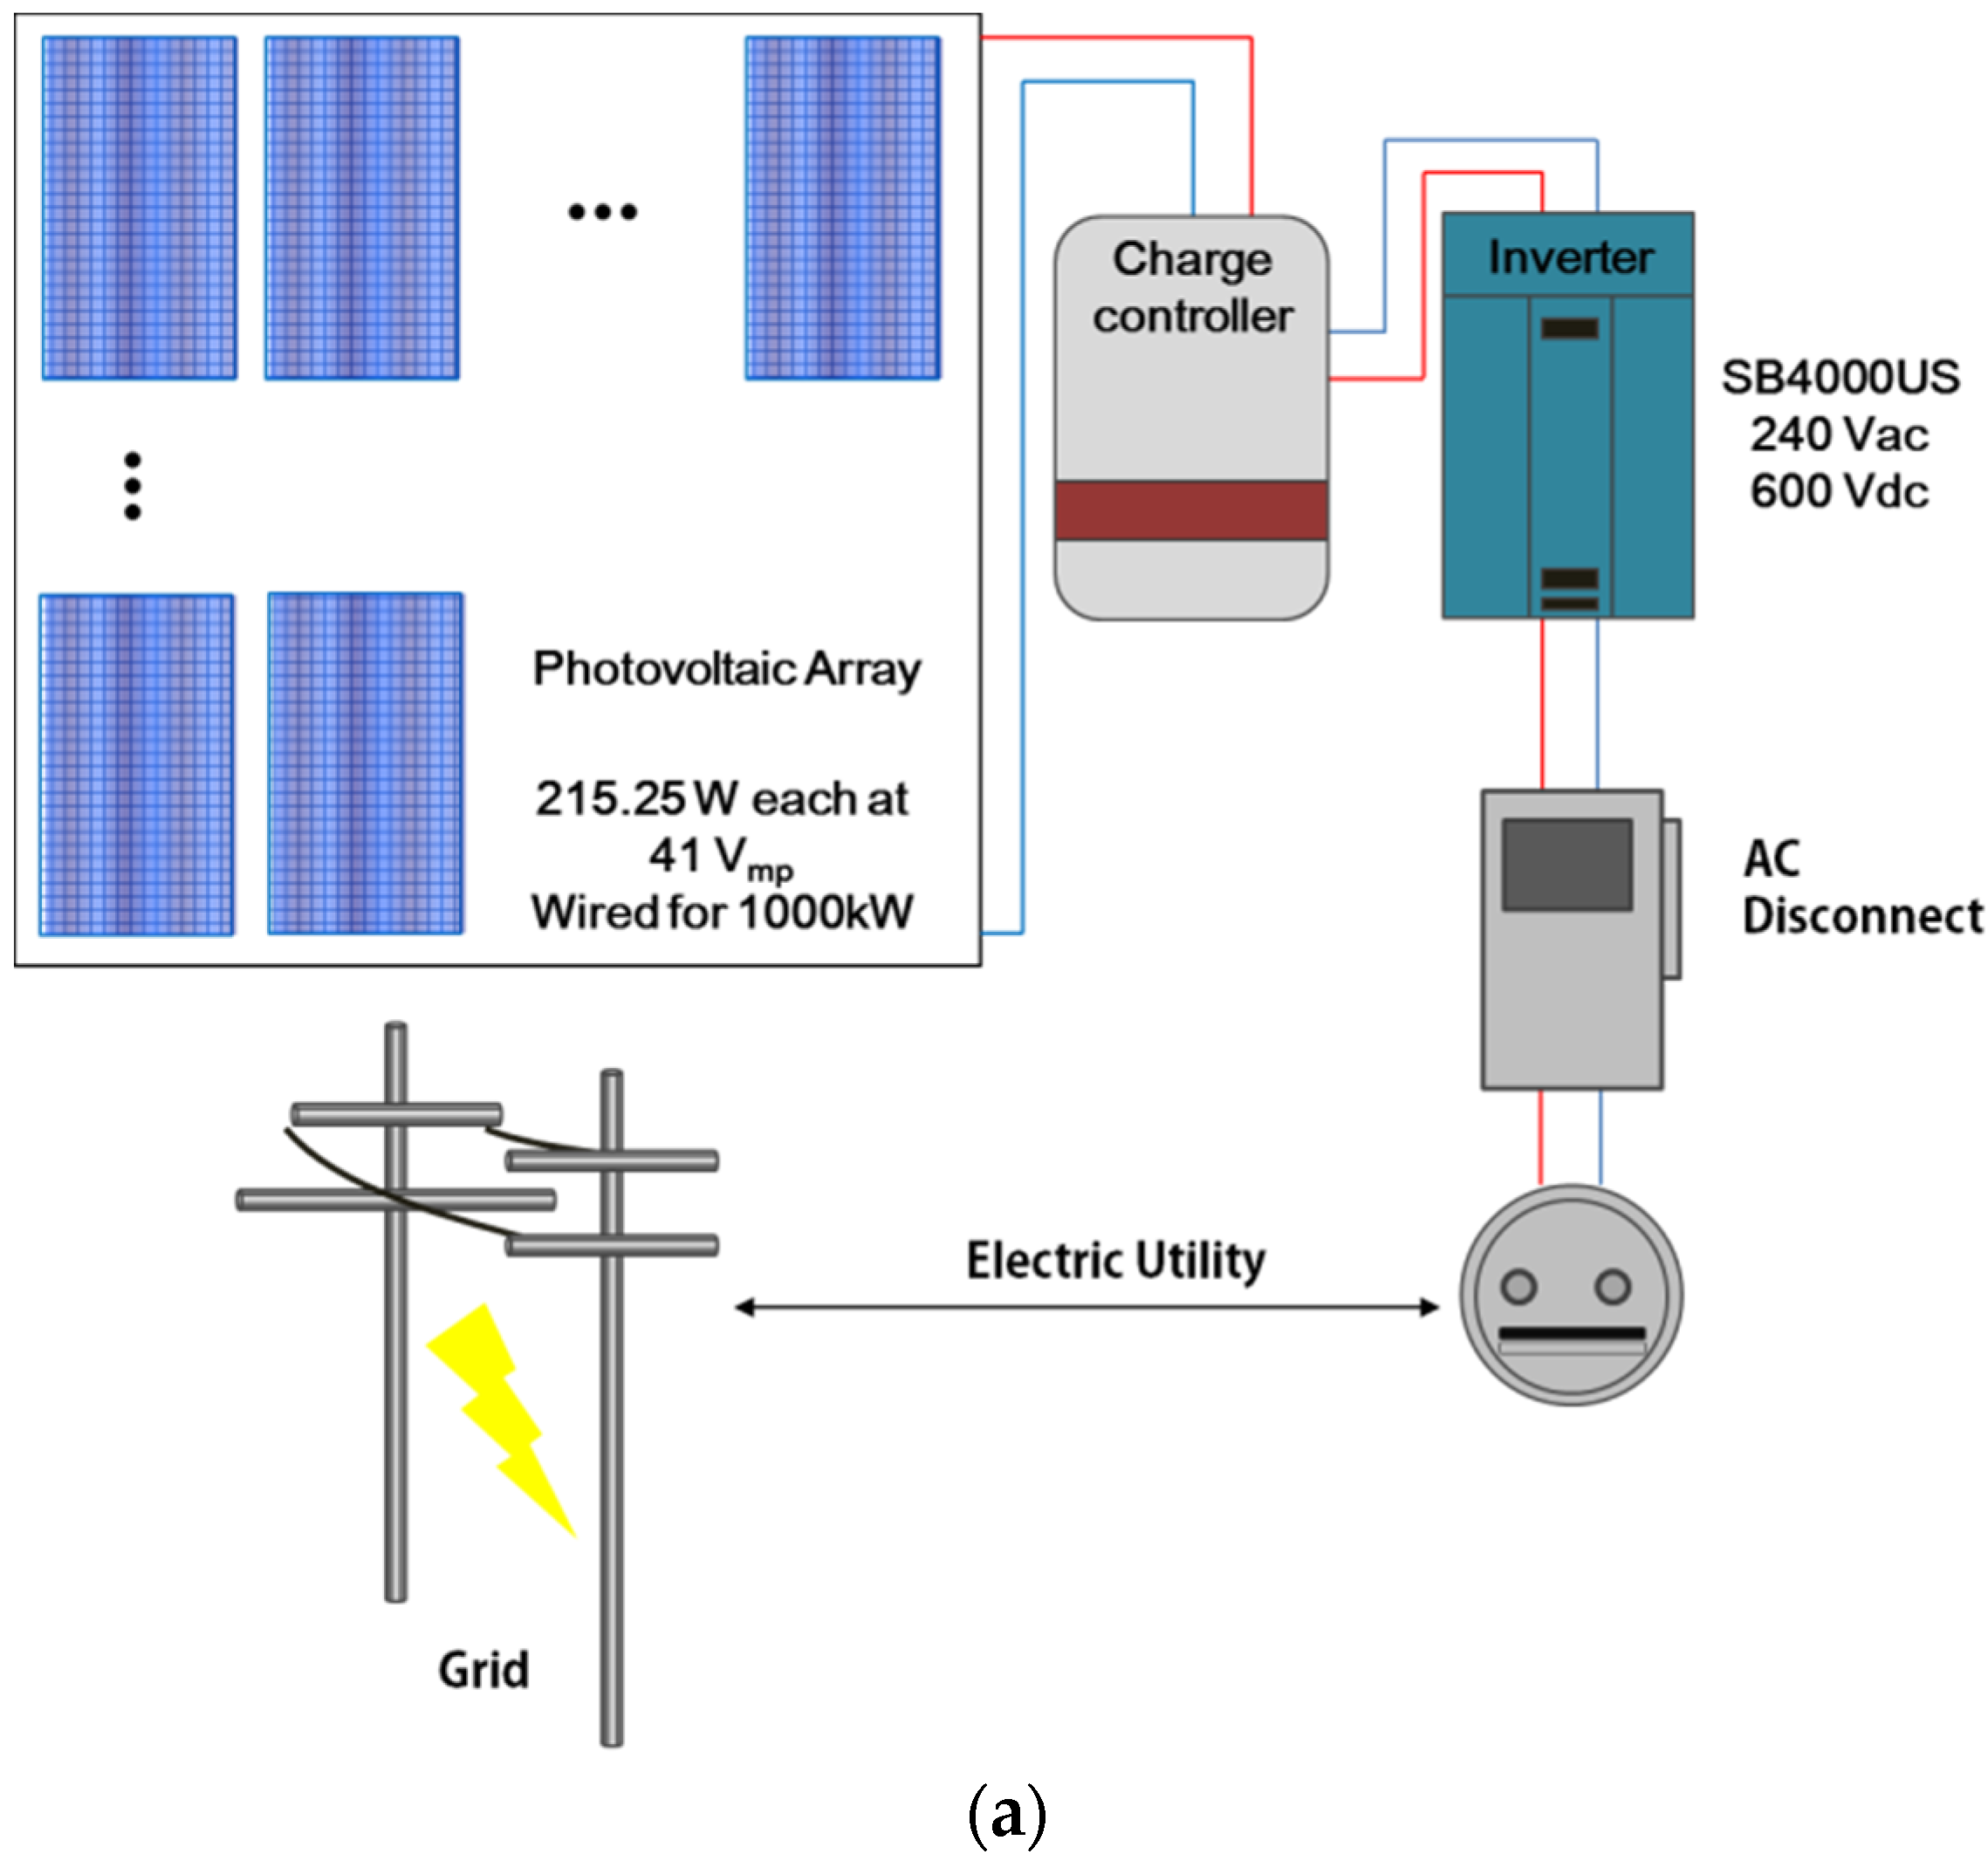
Figure 5 shows the design of the floating PV system to be installed at the study site. Applying the PV modules and inverters to be used in this study (
Table 2), the number of modules per string of the solar array was determined to be eight (using Equation (1)), from which the number of strings in parallel, number of inverters required, and the total capacity of the PV system were calculated (
Table 4).
Table 5 shows the installation areas of the calculated PV system resulting from 25°, 30°, 35°, 40°, and 45° tilt angles. Therefore, we learned that the area of the pit lake surface with at least 6 hour/day of sunshine in winter (87,650 m
2) was larger than the area required to install a 1-MW floating PV system using any of the tilt angles.
Table 4.
Design details of PV modules, inverters and capacity.
Table 4.
Design details of PV modules, inverters and capacity.
| Design Parameter | Value |
|---|
| Modules per string | 8 |
| Strings in parallel | 580 |
| Total number of inverters | 250 |
| Total capacity (kW) | 998 |
Table 5.
Area required for installing the floating PV system according to different angles of array tilt.
Table 5.
Area required for installing the floating PV system according to different angles of array tilt.
| Item | Value |
|---|
| Angle of array tilt | 25° | 30° | 35° | 40° | 45° |
| Total area (m2) | 9646 | 10,226 | 10,728 | 11,148 | 11,484 |
Figure 5.
System design: (a) Schematic diagram of the photovoltaic system showing the connections among the PV modules, inverters, and charge controller; (b) aerial view of the system layout.
Figure 5.
System design: (a) Schematic diagram of the photovoltaic system showing the connections among the PV modules, inverters, and charge controller; (b) aerial view of the system layout.
Table 6 outlines the monthly and annual electricity production simulated after entering the meteorological data of the solar site, shading matrix (
Table 3), and PV-system design parameters (
Table 4) into the SAM software. The highest monthly electricity output was in April at all tilt angles, and the lowest was in July due to meteorological characteristics of study site. The highest annual electricity production (971.57 MWh/year) resulted from a tilt angle of 40°. Based on this result, 40° was selected as the optimal tilt angle of the PV array, and the electricity production at the 40° tilt angle was used for the economic and GHG reduction analyses.
Table 6.
Variation of monthly PV output according to different angles of array tilt.
Table 6.
Variation of monthly PV output according to different angles of array tilt.
| | January | February | March | April | May | June | July | August | September | October | November | December | Sum |
|---|
| 25° | 80.90 | 76.87 | 85.07 | 99.26 | 86.70 | 70.65 | 65.37 | 77.44 | 79.19 | 85.25 | 71.88 | 72.47 | 951.06 |
| 30° | 84.76 | 79.23 | 85.91 | 99.21 | 85.59 | 69.43 | 64.35 | 76.87 | 79.66 | 87.37 | 74.60 | 76.00 | 963.00 |
| 35° | 88.02 | 81.09 | 86.26 | 98.59 | 84.00 | 67.83 | 62.99 | 75.86 | 79.70 | 88.94 | 76.83 | 79.00 | 969.11 |
| 40° | 90.89 | 82.61 | 86.30 | 97.57 | 82.11 | 66.00 | 61.43 | 74.58 | 79.45 | 90.17 | 78.75 | 81.65 | 971.57 |
| 45° | 92.75 | 83.27 | 85.47 | 95.59 | 79.39 | 63.51 | 59.24 | 72.55 | 78.43 | 90.47 | 79.82 | 83.39 | 963.87 |
Based on the annual electricity production expected from the floating PV system installed on the pit lake, an economic analysis for a 20-year project lifetime was performed. Setting the initial investment cost at $2,730,000 USD according to the standard value established by Lee
et al. [
12], the first year sales profit was calculated to be $348,000 USD.
Figure 6 shows the simulated NPV for each year over the 20-year lifespan. Considering the cash flows generated during the operating lifespan, the payback period was calculated to be about 12 years. The NPV calculated over 20 years stood at $897,000 USD, with an IRR of 9.37%. Additionally, the annual reduction of GHG emissions was calculated to be 471.21 tCO
2/year (
Table 7).
Table 7.
Results of economic and greenhouse gas reduction analyses for the floating photovoltaic system in the study site.
Table 7.
Results of economic and greenhouse gas reduction analyses for the floating photovoltaic system in the study site.
| Item | Value |
|---|
| Installation cost (USD) | 2,730,000 |
| Operation cost (USD/year) | 19,040 |
| Net present value (USD) | 897,000 |
| First year sales profit (USD) | 348,000 |
| Internal rate of return (%) | 9.37 |
| Payback (year) | 12.3 |
| Greenhouse gas reduction (tCO2/year) | 471.21 |
Figure 6.
Net present values of the floating photovoltaic system.
Figure 6.
Net present values of the floating photovoltaic system.
5. Discussion
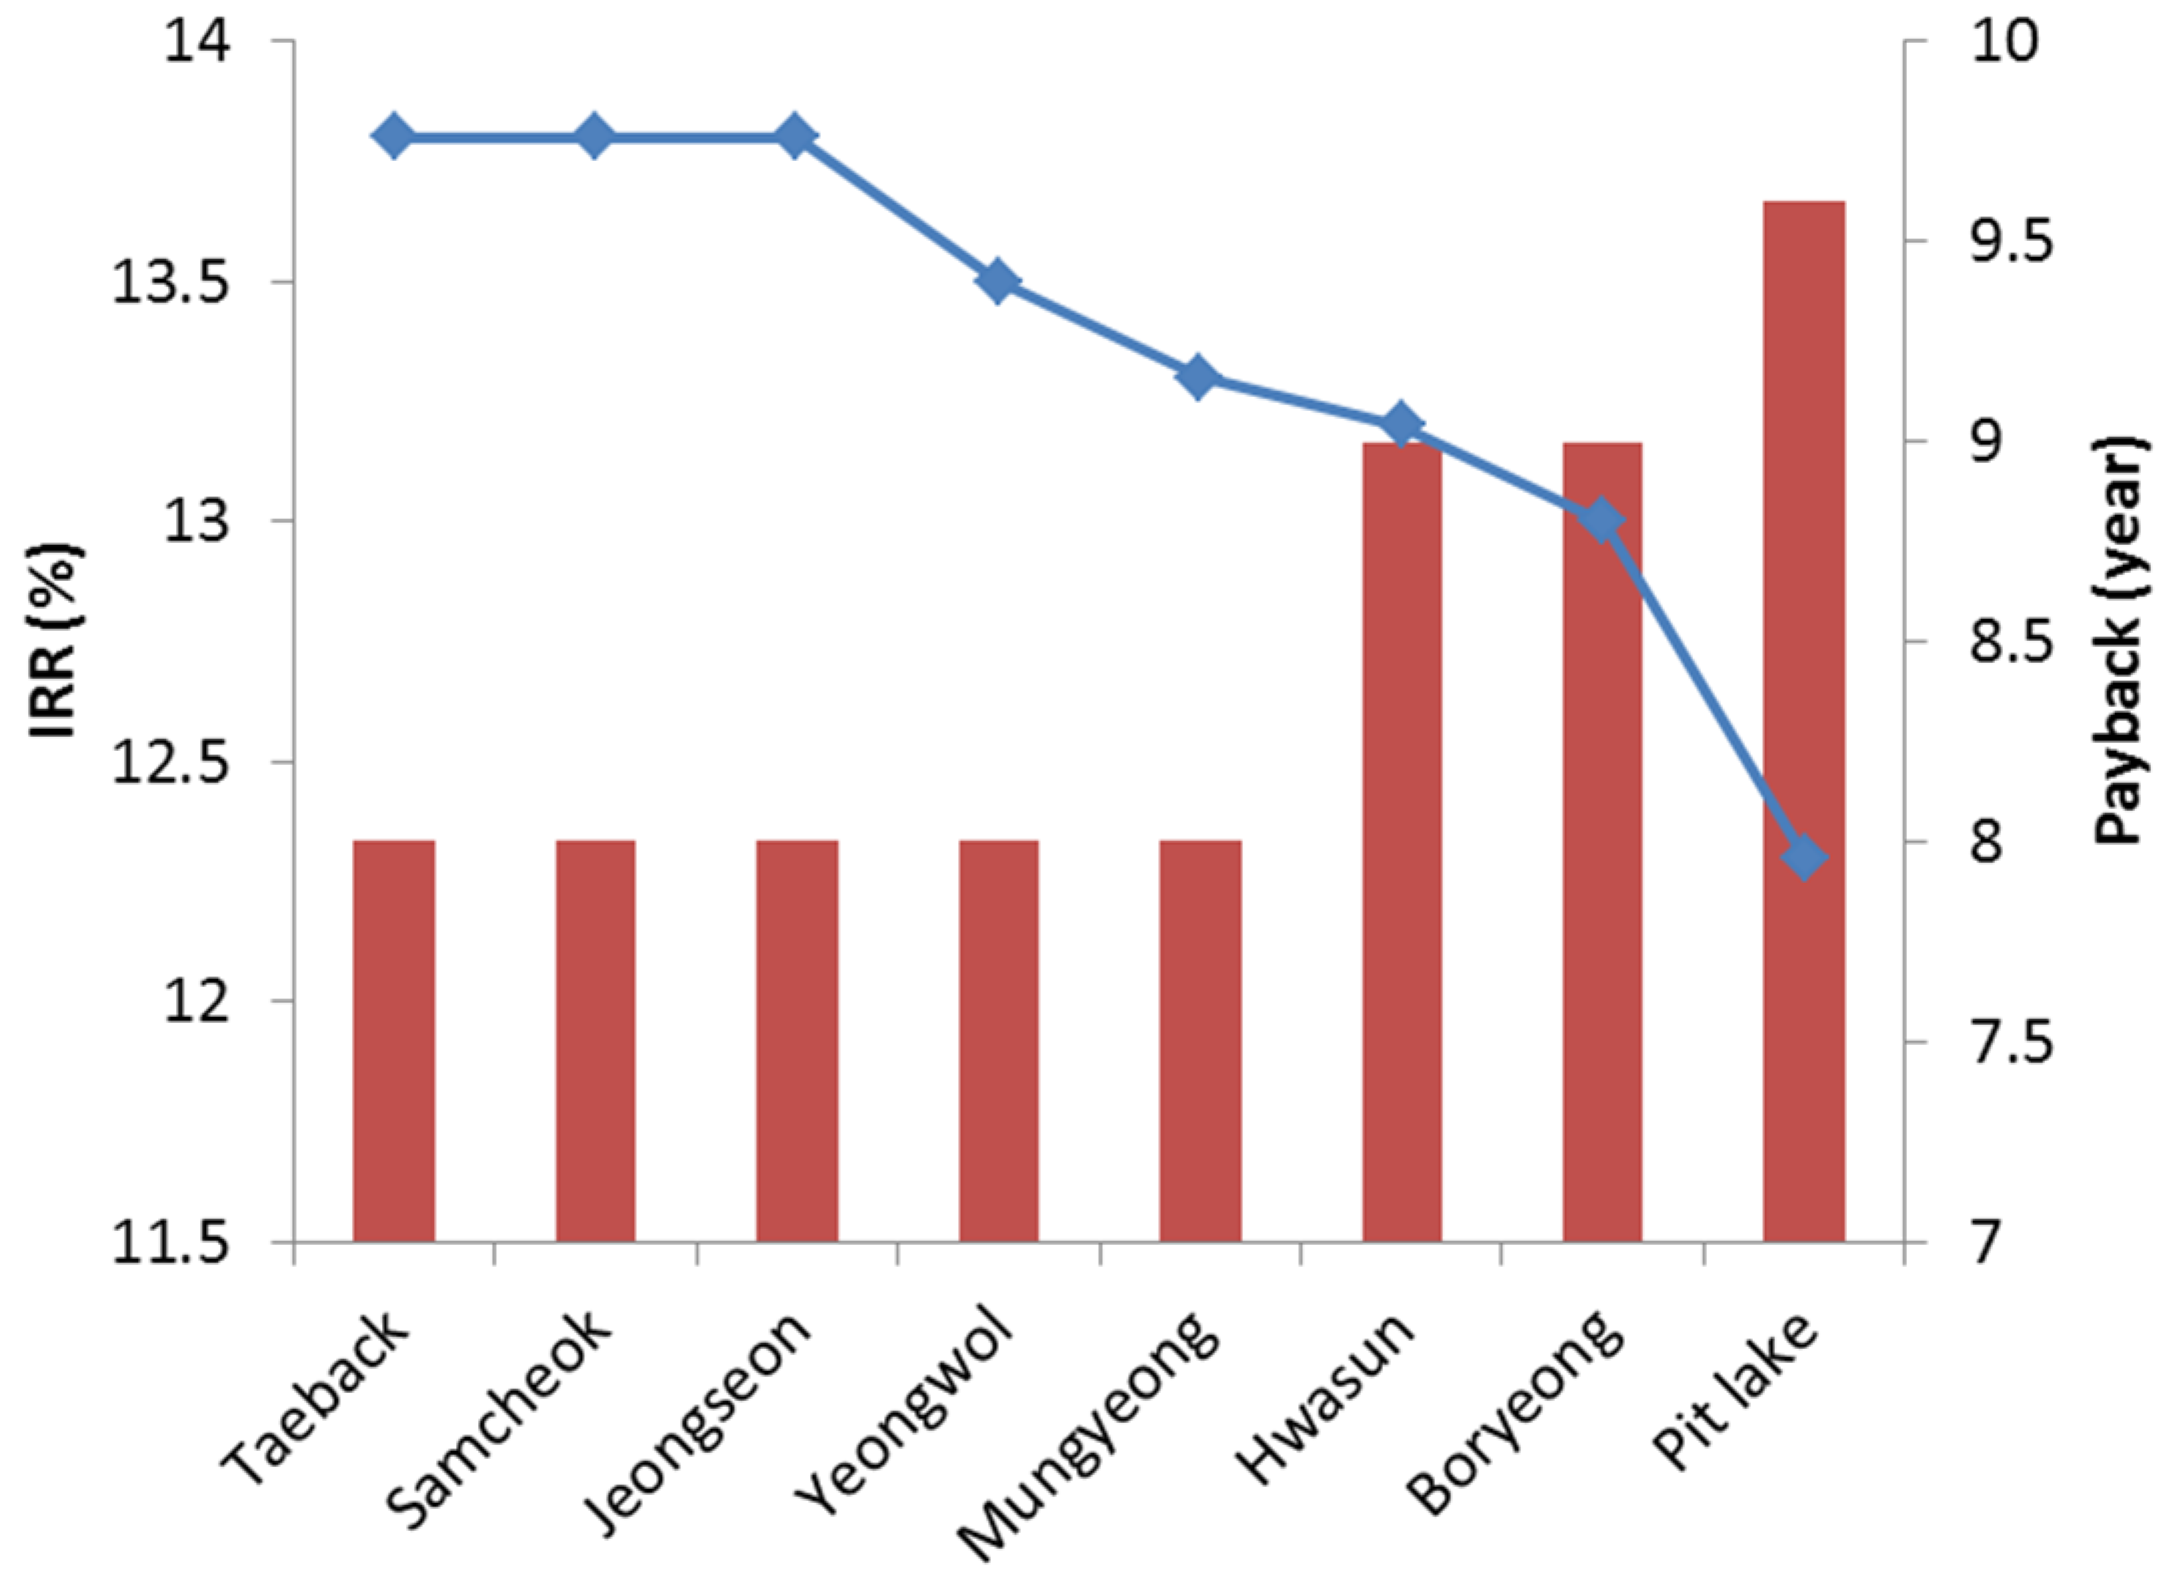
Figure 7 depicts the IRR and payback period calculations for a 99-kW terrestrial PV system at seven abandoned-mine promotion districts calculated by Song
et al. [
7] and those for the 1-MW floating PV system designed for the pit lake in this study. Although the initial investment cost for installing the floating PV system on the pit lake was more expensive than for the terrestrial PV system, the payback period of the floating PV system was shorter. Moreover, the IRR value was also higher than for the terrestrial PV systems in the previous study.
Figure 7.
Internal rate of return (IRR) and payback year from photovoltaic systems at seven abandoned districts in Korea and the pit lake. Blue line with diamond points indicate payback year. The bar graph is of IRR values.
Figure 7.
Internal rate of return (IRR) and payback year from photovoltaic systems at seven abandoned districts in Korea and the pit lake. Blue line with diamond points indicate payback year. The bar graph is of IRR values.
In addition to conversion of open pits to lakes, there is another eco-friendly method for restoring an abandoned open-pit mine: forest restoration. The economic and environmental effects of these two methods were compared by calculating the GHG reductions and investment costs for the floating PV system operation on the pit lake and forest restoration of the mine site without creating a pit lake (
Table 8). The annual per-hectare reduction of GHG emissions and costs for forest restoration were set at 10.8 tCO
2/ha/year and 6.9 × 10
3 USD/ha, respectively, as presented by Korea Forest Service [
26].
Table 8.
Comparison of costs and greenhouse gas reductions of floating photovoltaic system and tree planting.
Table 8.
Comparison of costs and greenhouse gas reductions of floating photovoltaic system and tree planting.
| Remediation Approach | Initial Cost (USD) | GHG Reduction (tCO2/year) | GHG Reduction per Cost (tCO2/year/106 USD) |
|---|
| Floating PV system | 2,730,000 | 471.21 | 172.60 |
| Tree planting | 1,578,000 | 243.48 | 154.30 |
The analysis revealed that while installing a floating PV system on the pit lake requires 1.7 times higher initial cost than forest restoration, the annual reduction of GHG emissions is twice as high. For GHG reduction per unit price as well, the floating PV system on the pit lake was found to be better than forest restoration. Additionally, considering the revenue generated by sale of electricity, installation of a floating PV system was considered more cost-effective than forest restoration.
6. Conclusions
In this study, the effects of installing a 1-MW floating PV system on the surface of a pit lake were estimated for an open-pit limestone mine in Korea currently in the process of mine closure. The surface area ensuring at least 6 hour/day of sunshine in winter, without any shadow effect, was estimated to amount to 87,650 m2. This was sufficient for installing a 1-MW floating PV system accommodating 4641 solar modules. After inputting the meteorological data of the solar site and PV system design parameters, the SAM simulation revealed a PV-array tilt-angle of 40° to be optimal for the floating PV system and computed the annual electricity generation to be 971.57 MWh. In the economic analysis over a 20-year lifespan, the payback period (capital recovery) for the 1-MW facility was calculated to be 12.3 years, with the net present value at $897,000 USD. This demonstrates that the economic benefit of the floating PV system on the pit lake is greater than that of terrestrial PV systems previously analyzed in abandoned-mine-promotion districts in Korea. The annual reduction of greenhouse gas emissions was estimated at 471.21 tCO2/year, which is twice as high as the reduction effect achievable through forest restoration of an abandoned mine.
This study considered the installation angle of the fixed-tilt PV array between 25°–45° and selected 40° as the optimal tilt angle because the highest annual electricity production resulted from a tilt angle of 40°. However, the cost for structural configuration of the system can be different for different tilt angles. Although for 40° the maximum PV output is achieved, the structural needs can be greater than others. With minor angles, a better relationship between investment and revenues can be obtained although they do not provide the maximum PV output. In future work, it would be interesting to investigate this issue because it can slightly change the results of economic analysis.
Until recently, installation of a large-scale PV system in an abandoned open-pit mine has been considered inappropriate due to its topographic characteristics. According to this analysis, however, creating a pit lake in an open-pit mine and using it for a large-scale floating PV system is economically beneficial and could significantly reduce greenhouse gas emissions. Considering the environmental and economic gains from greenhouse gas reduction and electricity sales, a floating PV system on a pit lake of an abandoned mine site is considered an efficient reuse option for abandoned mines. The analysis methods employed in this study are applicable to other regions and countries such that they are expected to be efficiently used to determine the environmental and economic effects of floating PV systems on mine pit lakes.


