Impact of Urban Morphology on Infiltration-Induced Building Energy Consumption
Abstract
:1. Introduction
2. Results
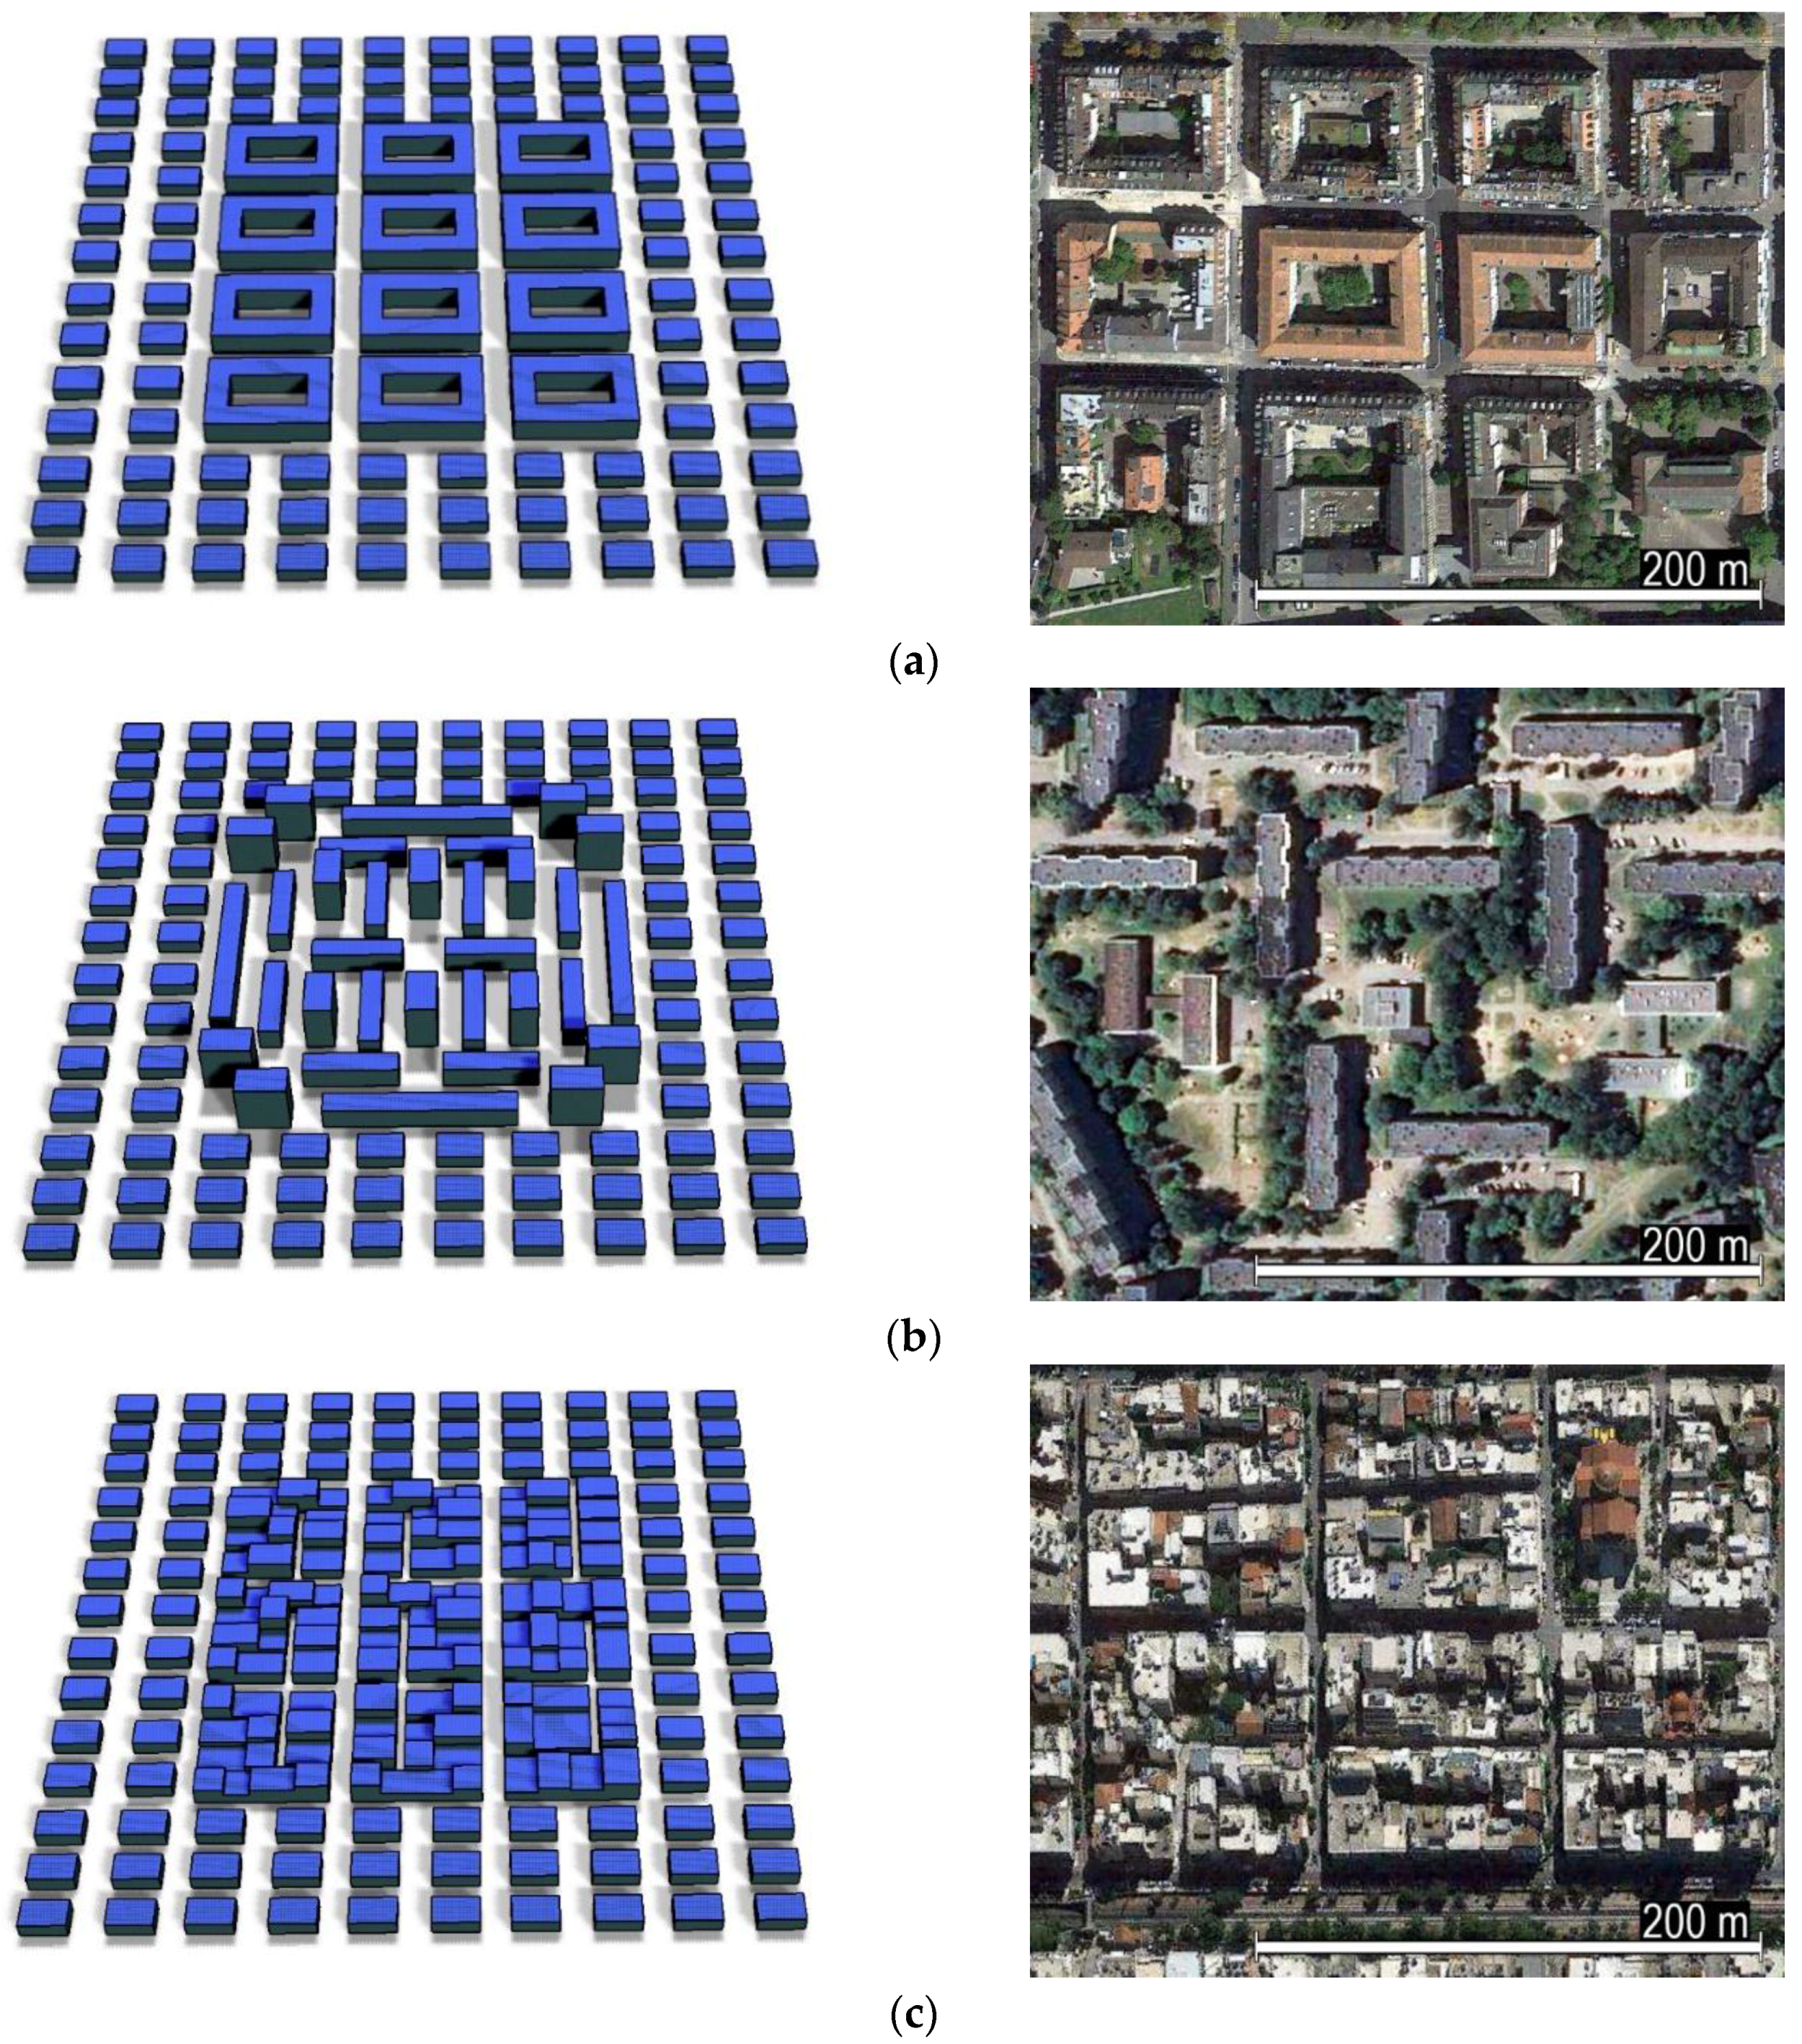
2.1. Urban Morphologies Selected for the Study
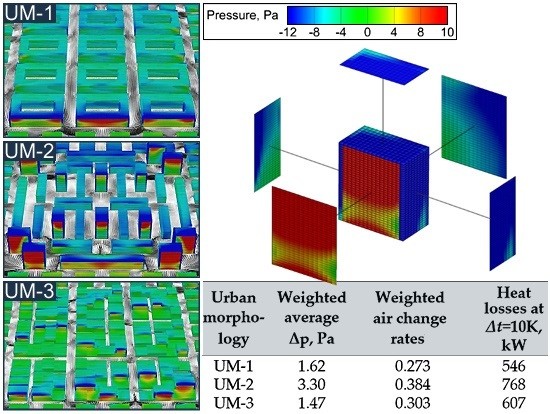
2.2. CFD Prediction Results for Air Speed and Building Surface Pressure Distribution
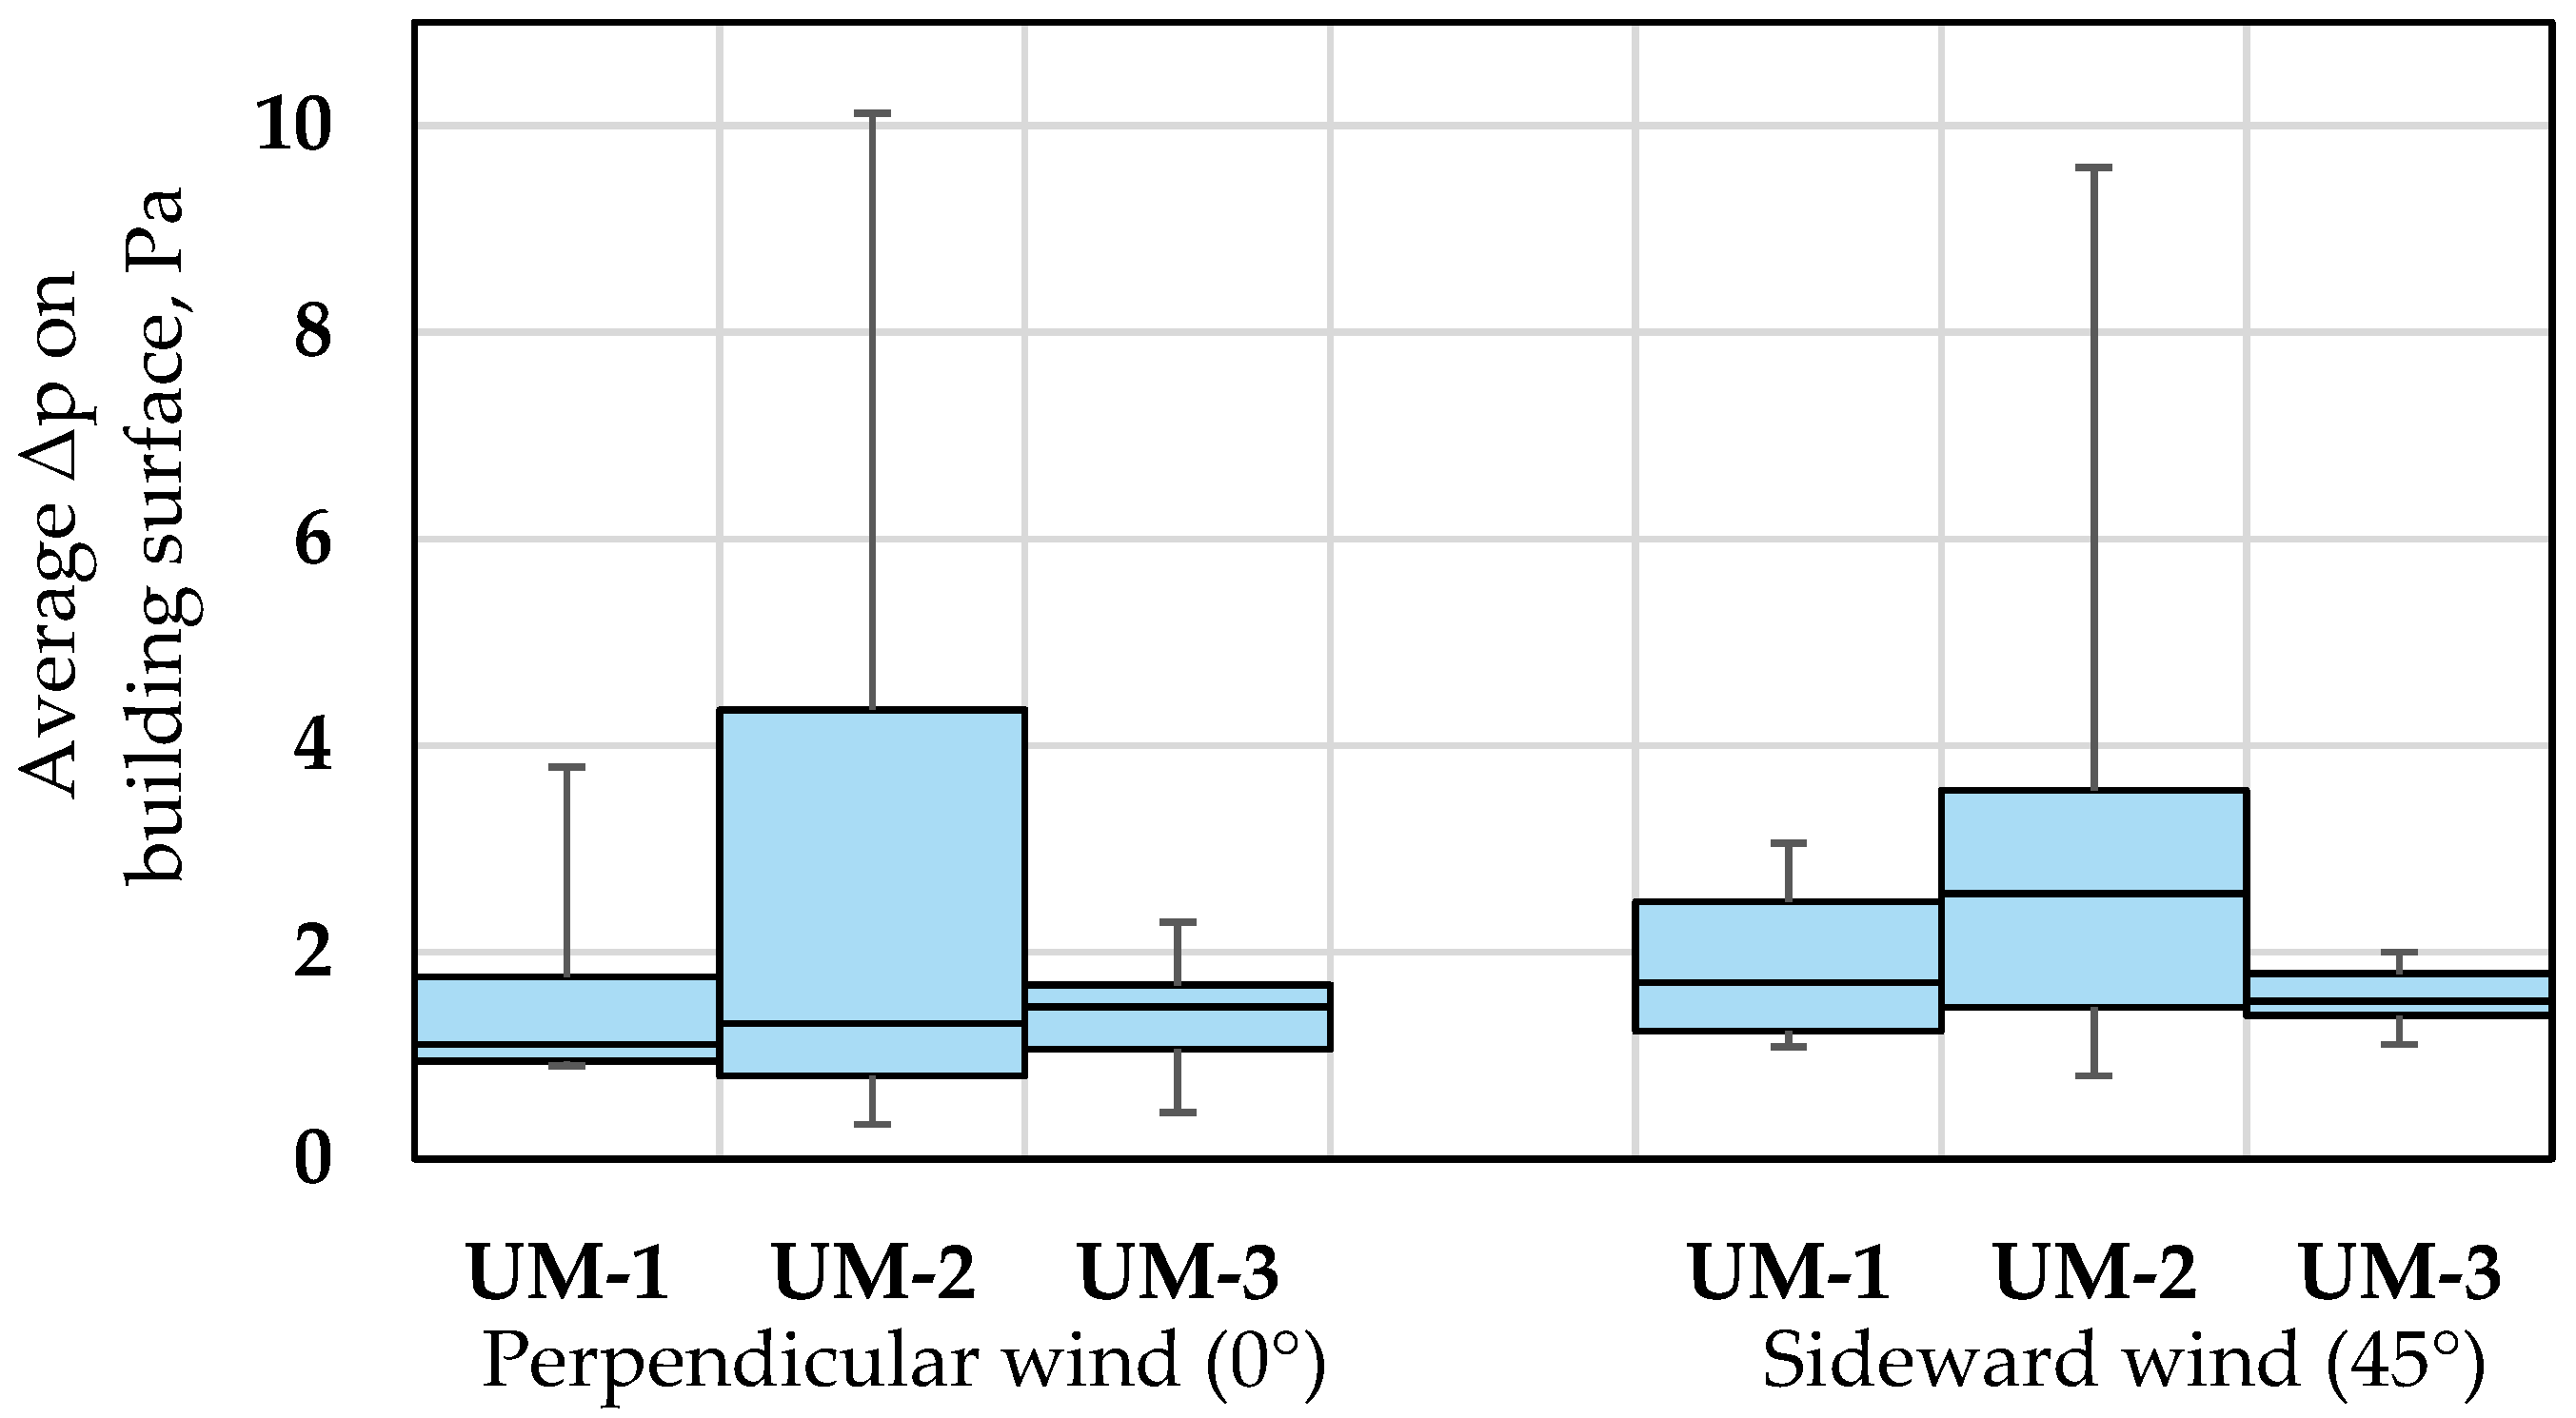
2.3. Results of Air Infiltration and Expected Impact on Energy Consumption Calculations
- The highest values of average speed and the lowest for turbulent kinetic energy within street cavities were observed in the case of urban morphology UM-1. However, it seems that this layout exhibits better aerodynamic properties that allow a reduction of wind induced energy consumption by approx. 41% compared to urban morphology UM-2. Therefore, designing built neighborhoods according to this overall spatial shape should be considered to achieve lower energy consumption of smart cities.
- The highest wind induced air change rates and pressure differences on building surfaces were observed for urban morphology UM-2. Mixed building height and highest average building height and street width ratio resulted in a significant increase of the estimated heat load required to cover the heat losses despite the wind direction.
- A relatively small difference between the results of the layouts UM-1 and UM-3 was found. These models however, were similar in that buildings were joined into blocks in both cases. This leads to overall lower values of air leakage areas as, in this study, air leakage areas were calculated from specific leakage area (AL, cm2/m2) according to the exposed surface areas of the buildings.
3. Discussion
4. Methods
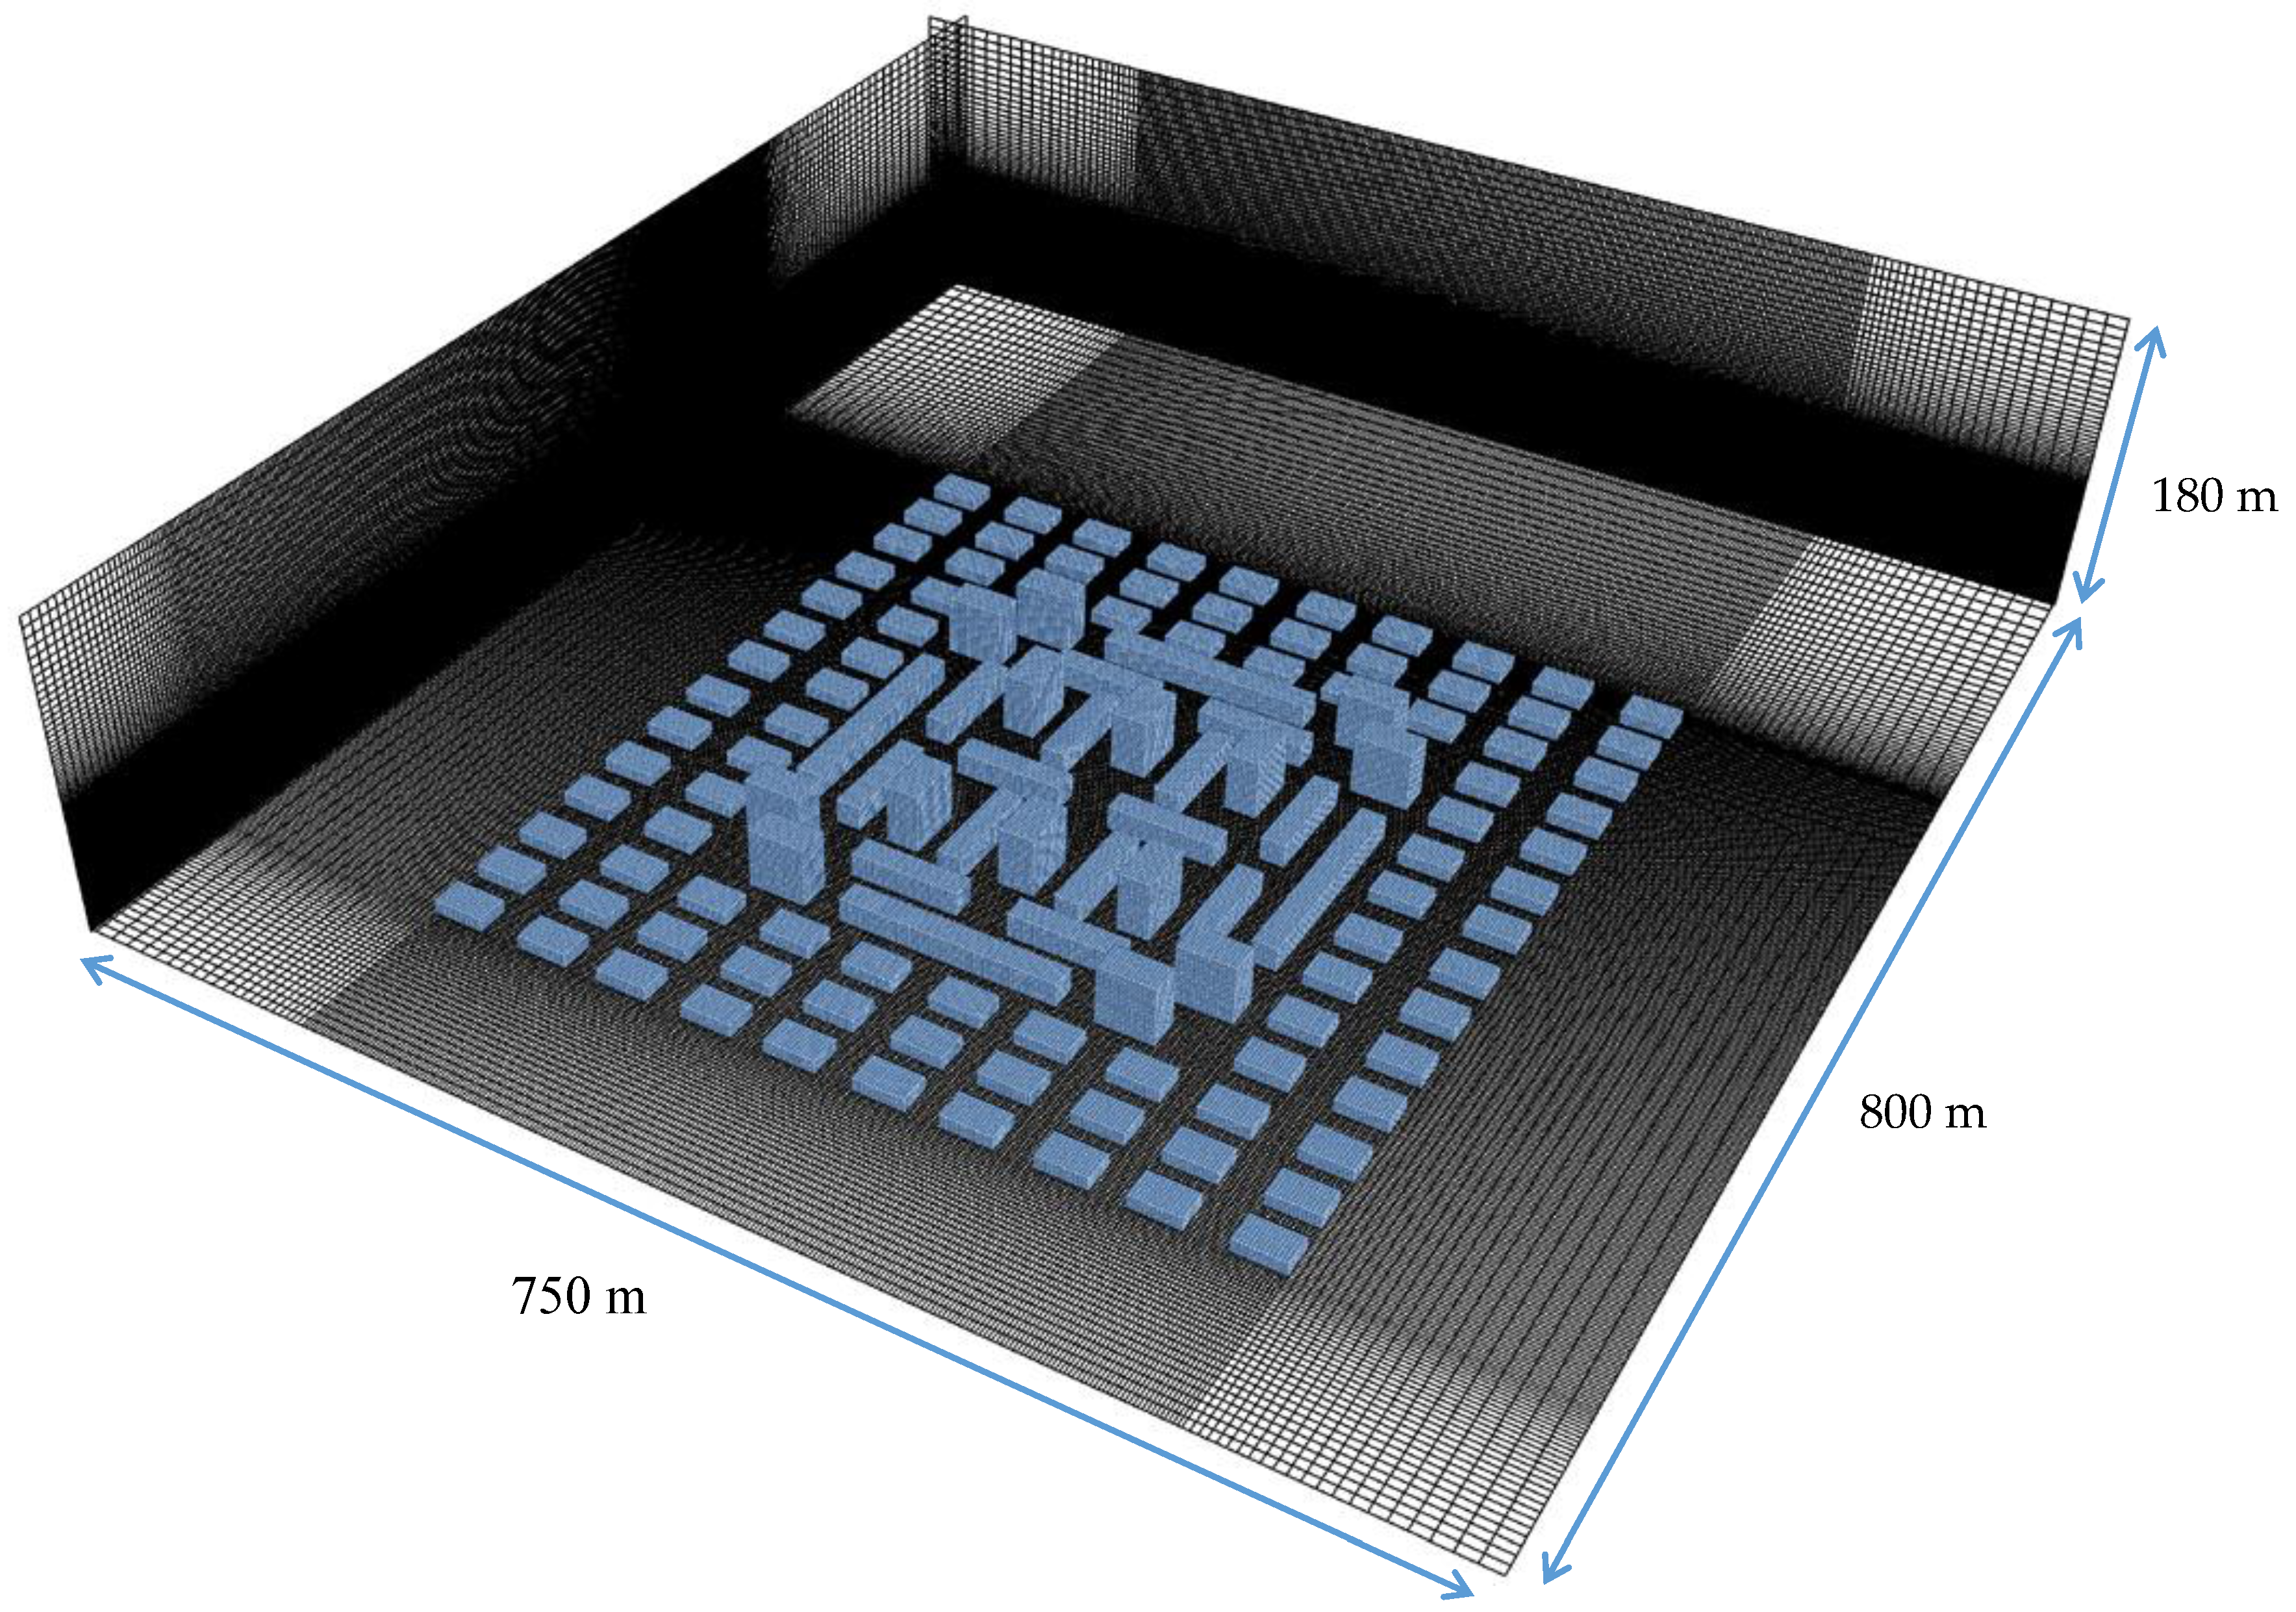
4.1. Urban Morphologies and Boundary Conditions
4.2. Tools and Procedures Used for CFD Simulations
4.3. Validation of the CFD model
4.4. Air Infiltration Estimation
- Reading the pressure values for each grid cell of the building’s exposed surfaces obtained by CFD, and calculating the surface weighted mean external pressure. This defines the building’s inner pressure.
- Determining overall pressure difference by using the difference between the sum of the values which are higher than the inner pressure on the building surface, indicating air infiltration and the sum of the values which are lower than the inner pressure, indicating exfiltration.
- The pressure difference thus obtained was used for calculating the air flow rate by applying the ELA equation [22]:where: Q—air flow rate, m³/h; Cd—the discharge coefficient (0.6 value was used in this study), A—equivalent leakage area, m²; Δp—pressure difference across building surface, Pa (obtained within the step 2); ρ—air density. In this study the values were used as follows:
- Discharge coefficient—0.6 (i.e., the discharge coefficient for a sharp-edged orifice) [13];
- Equivalent leakage area was calculated by using the specific leakage area i.e., the ratio of (AL) and exposed surface area of the building. This ratio was considered 4 cm² per 1 m² of the building surface area [23];
- Air density—1.16 kg/m³.
- Building air change rate was calculated as follows:where: Q—air flow rate, m³/h (obtained within the step 3), volume of the building, m³.
- The total energy consumption of the built neighborhood was estimated by calculating total air flow rates using the average built volume between the simulated cases and air change rates of each particular case. Heating load required to cover air infiltration heat losses was calculated as follows [13]:where: q—sensible heat load, W; Q—air flow rate, m³/s; ρ—air density, kg/m³; cp—specific heat of air, J/kgK; Δt—temperature difference between indoors and outdoors, K.q = ΣQ·ρ·cp·Δt
Supplementary Materials
Acknowledgments
Author Contributions
Conflicts of Interest
Abbreviations
| CFD | Computational fluid dynamics |
| ELA | Equivalent Leakage Area |
| IAQ | Indoor air quality |
| UM | Urban morphology |
Appendix A

| Step | Description and Known Values | Values Obtained | ||
|---|---|---|---|---|
| 1-2 | Calculating the mean pressure on building surfaces and determining the pressure difference | (p-pavg) > 0 = 6.88 Pa (p-pavg) < 0 = –3.24 Pa | Δp = 10.12 Pa | |
| 3 | Air flow rate calculation | Building volume—20979 m³ Air leakage area—1.69 m² | Q = 15222 m³/h | |
| 4 | Building air change rate calculation | ACH = 0.726 | ||
| 5 | Heating load required to cover air infiltration heat losses at Δt = 10 K | q = 40.3 kW | ||
References
- Srebric, J.; Heidarinejad, M.; Liu, J. Building neighborhood emerging properties and their impacts on multi-scale modeling of building energy and airflows. Build Env. 2015, 91, 246–262. [Google Scholar] [CrossRef]
- Rasheed, A.; Robinson, D.; Clappier, A.; Narayanan, C.; Lakehal, D. Representing complex urban geometries in mesoscale modeling. Int.J. Climatol. 2011, 31, 289–301. [Google Scholar] [CrossRef]
- Yaghoobian, N.; Kleissl, J. An indoor–outdoor building energy simulator to study urban modification effects on building energy use—Model description and validation. Energy Build 2012, 54, 407–417. [Google Scholar] [CrossRef]
- Yang, X.; Zhao, L.; Bruse, M.; Meng, Q. An integrated simulation method for building energy performance assessment in urban environments. Energy Build 2012, 54, 243–251. [Google Scholar] [CrossRef]
- Cóstola, D.; Blocken, B.; Ohba, M.; Hensen, J.L.M. Uncertainty in airflow rate calculations due to the use of surface-averaged pressure coefficients. Energy Build 2010, 42, 881–888. [Google Scholar] [CrossRef]
- EUROPEAN STANDARD STORE. Ventilation for Buildings—Calculation Methods for the Determination of Air Flow Rates in Buildings Including Infiltration; EUROPEAN STANDARD STORE: Pilsen, Czech Republic, 2007. [Google Scholar]
- Van Hooff, T.; Blocken, B. On the effect of wind direction and urban surroundings on natural ventilation of a large semi-enclosed stadium. Comput. Fluid. 2010, 39, 1146–1155. [Google Scholar] [CrossRef]
- Van Moeseke, G.; Gratia, E.; Reiter, S.; De Herde, A. Wind pressure distribution influence on natural ventilation for different incidences and environment densities. Energy Build 2005, 37, 878–889. [Google Scholar] [CrossRef]
- Ramponi, R.; Blocken, B.; de Coo, L.B.; Janssen, W.D. CFD simulation of outdoor ventilation of generic urban configurations with different urban densities and equal and unequal street widths. Build Env. 2015, 92, 152–166. [Google Scholar] [CrossRef]
- Toparlar, Y.; Blocken, B.; Vos, P.; van Heijst, G.J.F.; Janssen, W.D.; van Hooff, T.; Montazeri, H.; Timmermans, H.J.P. CFD simulation and validation of urban microclimate: A case study for Bergpolder Zuid, Rotterdam. Build Env. 2015, 83, 79–90. [Google Scholar] [CrossRef]
- Hang, J.; Sandberg, M.; Li, Y. Effect of urban morphology on wind condition in idealized city models. Atmos Env. 2009, 43, 869–878. [Google Scholar] [CrossRef]
- Syrios, K.; Hunt, G.R. Passive air exchanges between building and urban canyon via openings in a single façade. Int. J. Heat Fluid Flow 2008, 29, 364–373. [Google Scholar] [CrossRef]
- ASHRAE TC 4.3. Ventilation and infiltration. In ASHRAE Handbook-Fundamentals; American Society of Heating, Refrigerating and Air-Conditioning Engineers, Inc. (ASHRAE): Atlanta, GA, USA, 2013.
- Patankar, S.; Spalding, D. A calculation procedure for heat, mass and momentum transfer in three dimensional parabolic flows. Int. J. Heat Mass Transf. 1972, 15, 1787–1806. [Google Scholar] [CrossRef]
- Rhie, C.; Chow, W. Numerical study of the turbulent flow past an airfoil with trailing edge separation. AIAA J. 1983, 21, 1525–1532. [Google Scholar] [CrossRef]
- Launder, B.E.; Spalding, D.B. The numerical computation of turbulent flows. Comput. Method. Appl. Mech. Eng. 1974, 3, 269–289. [Google Scholar] [CrossRef]
- Blocken, B.; Stathopoulos, T.; Carmeliet, J. CFD simulation of the atmospheric boundary layer: Wall function problems. Atmos Env. 2007, 41, 238–252. [Google Scholar] [CrossRef]
- Franke, J.; Hellsten, A.; Schlünzen, H.; Carissimo, B. Best Practice Guideline for the CFD Simulation of Flows in the Urban Environment, COST Action 732 Quality Assurance and Improvement of Microscale Meteorological Models; Meteorological Institute: Hamburg, Germany, 2007. [Google Scholar]
- Barmpas, F.; Bouris, D.; Moussiopoulos, N. 3D Numerical simulation of the transient thermal behaviour of a simplified building envelope under external flow. J. Sol. Energy Eng. 2009, 131. [Google Scholar] [CrossRef]
- Petridou, M.; Bouris, D. Experimental and numerical study of the effect of openings on the surface pressure distribution of a hollow cube. WSEAS Trans. Fluid Mech. 2006, 1, 655–662. [Google Scholar]
- Davidson, M.J.; Snyder, W.H.; Lawson Jr, R.E.; Hunt, J.C.R. Wind tunnel simulations of plume dispersion through groups of obstacles. Atmos. Env. 1996, 30, 3715–3731. [Google Scholar] [CrossRef]
- ATTMA. Technical standard 1. Measuring Air Permeability of Building Envelopes, Air Tightness Testing and Measurement Association. Available online: http://www.attma.org (accessed on 1 October 2015).
- Urquhart, R.; Richman, R.; Finch, G. The effect of an enclosure retrofit on air leakage rates for a multi-unit residential case-study building. Energy Build 2015, 86, 35–44. [Google Scholar] [CrossRef]


 wind tunnel experiment results,
  CFD prediction results).
 wind tunnel experiment results,
  CFD prediction results).
| Urban Morphology | Height of Buildings, m | Hb/W 1 |
|---|---|---|
| UM-1 | 18 m | 1.00 |
| UM-2 | 16 and 36 m | 1.73 |
| UM-3 | 8 to 16 m | 0.76 |
| Wind Direction | Urban Morphology | Average Speed in Street Cavities at 2 m, m/s | Weighted Average Δp, Pa | Weighted Air Change Rates 1 | Heat Losses at Δt=10K, kW | Percentile Increase Compared to Lowest Result |
|---|---|---|---|---|---|---|
| 0° | UM-1 | 2.30 | 1.62 | 0.273 | 546 | 0% |
| UM-2 | 1.60 | 3.30 | 0.384 | 768 | 40.7% | |
| UM-3 | 1.40 | 1.47 | 0.303 | 607 | 11.1% | |
| 45° | UM-1 | 2.52 | 1.87 | 0.300 | 601 | 0% |
| UM-2 | 2.11 | 3.55 | 0.424 | 848 | 41.0% | |
| UM-3 | 2.05 | 1.55 | 0.314 | 628 | 4.5% |
© 2016 by the authors; licensee MDPI, Basel, Switzerland. This article is an open access article distributed under the terms and conditions of the Creative Commons by Attribution (CC-BY) license (http://creativecommons.org/licenses/by/4.0/).
Share and Cite
Jurelionis, A.; Bouris, D.G. Impact of Urban Morphology on Infiltration-Induced Building Energy Consumption. Energies 2016, 9, 177. https://doi.org/10.3390/en9030177
Jurelionis A, Bouris DG. Impact of Urban Morphology on Infiltration-Induced Building Energy Consumption. Energies. 2016; 9(3):177. https://doi.org/10.3390/en9030177
Chicago/Turabian StyleJurelionis, Andrius, and Demetri G. Bouris. 2016. "Impact of Urban Morphology on Infiltration-Induced Building Energy Consumption" Energies 9, no. 3: 177. https://doi.org/10.3390/en9030177
APA StyleJurelionis, A., & Bouris, D. G. (2016). Impact of Urban Morphology on Infiltration-Induced Building Energy Consumption. Energies, 9(3), 177. https://doi.org/10.3390/en9030177


