
Multi-Train Energy Saving for Maximum Usage of Regenerative Energy by Dwell Time Optimization in Urban Rail Transit Using Genetic Algorithm


Abstract
:1. Introduction
2. Multi-Train System for Urban Rail Transit
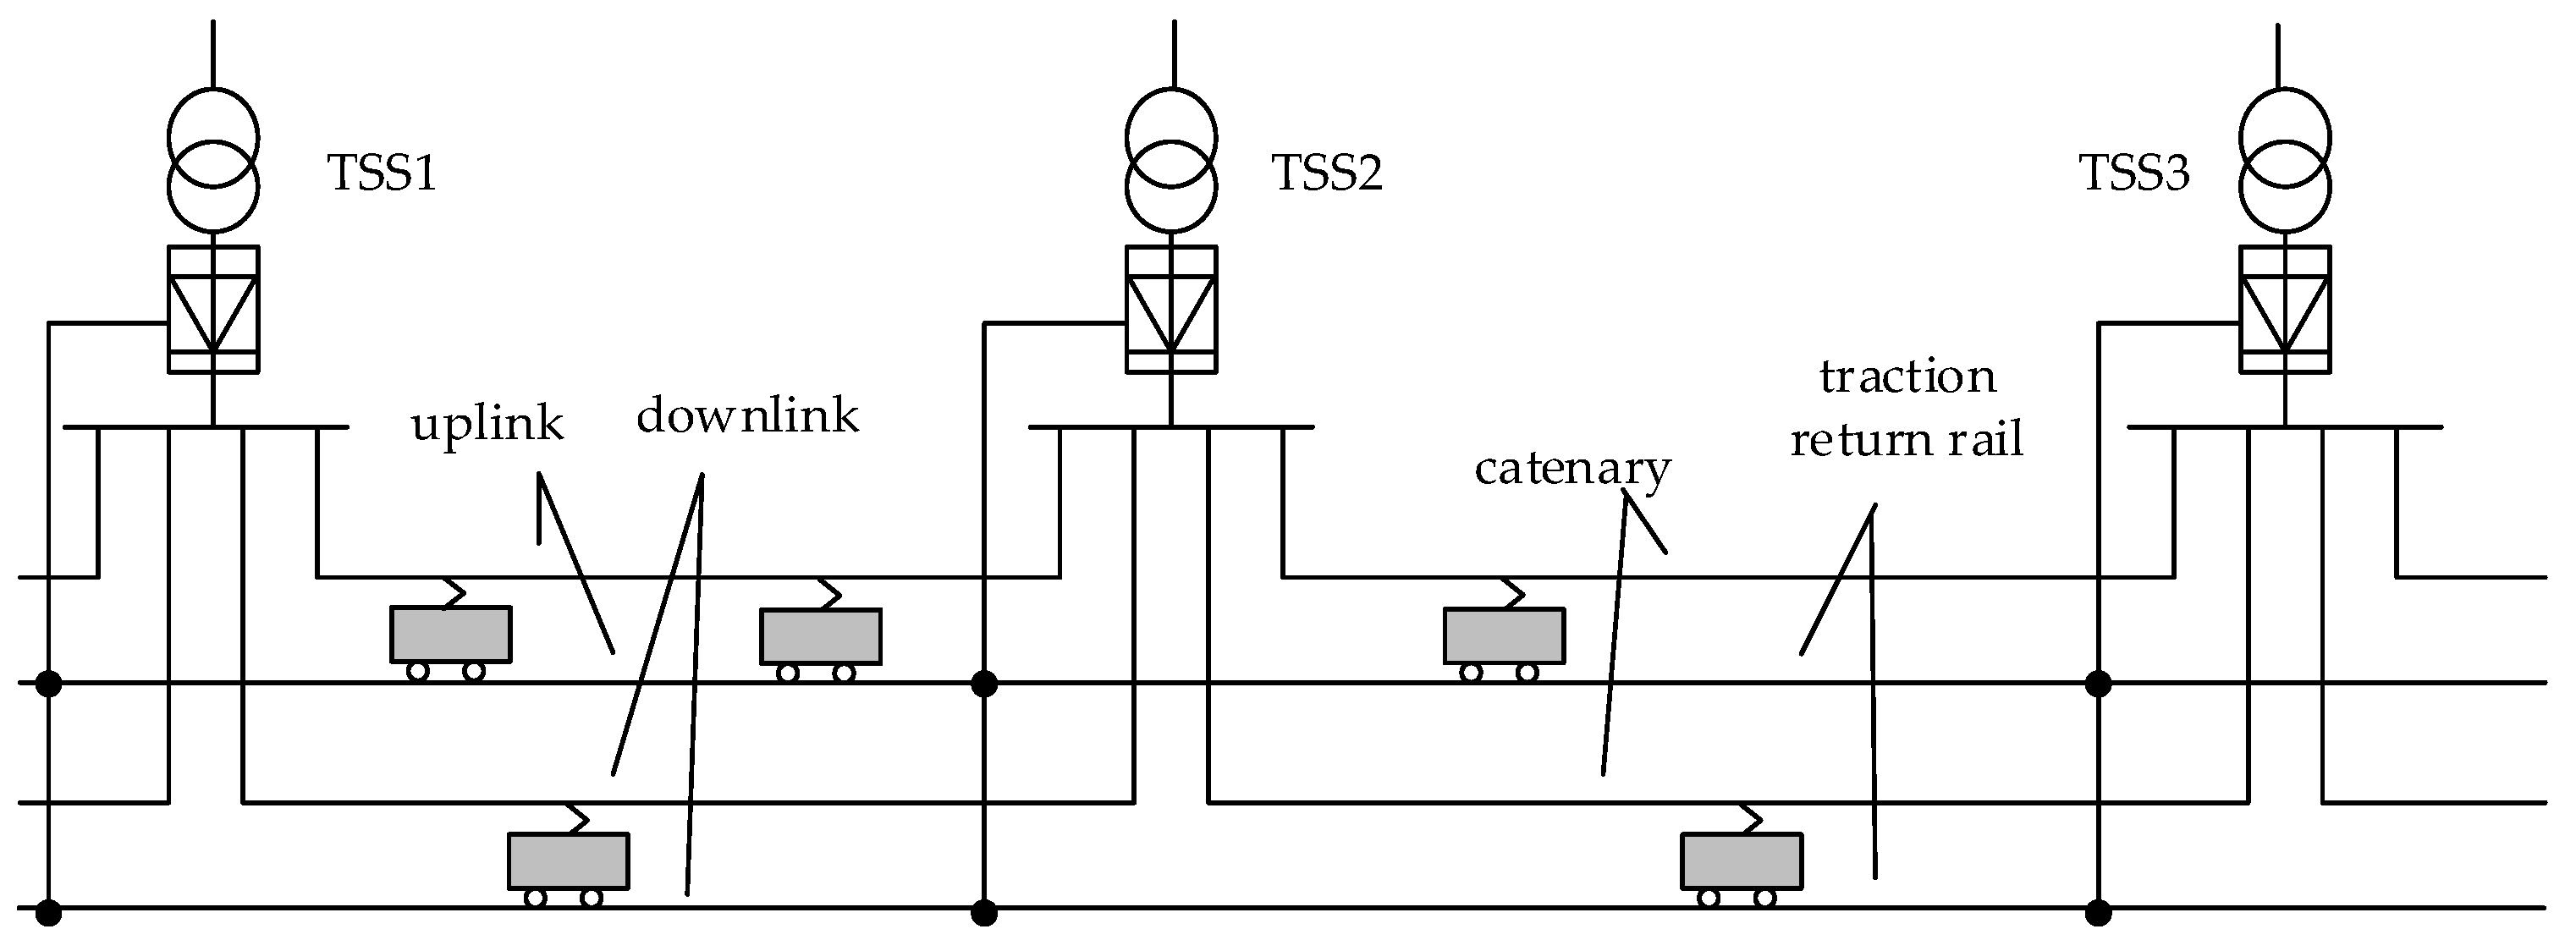
2.1. Multi-Train System for Urban Rail Transit
2.2. The Constraints of the Traction Power Supply System
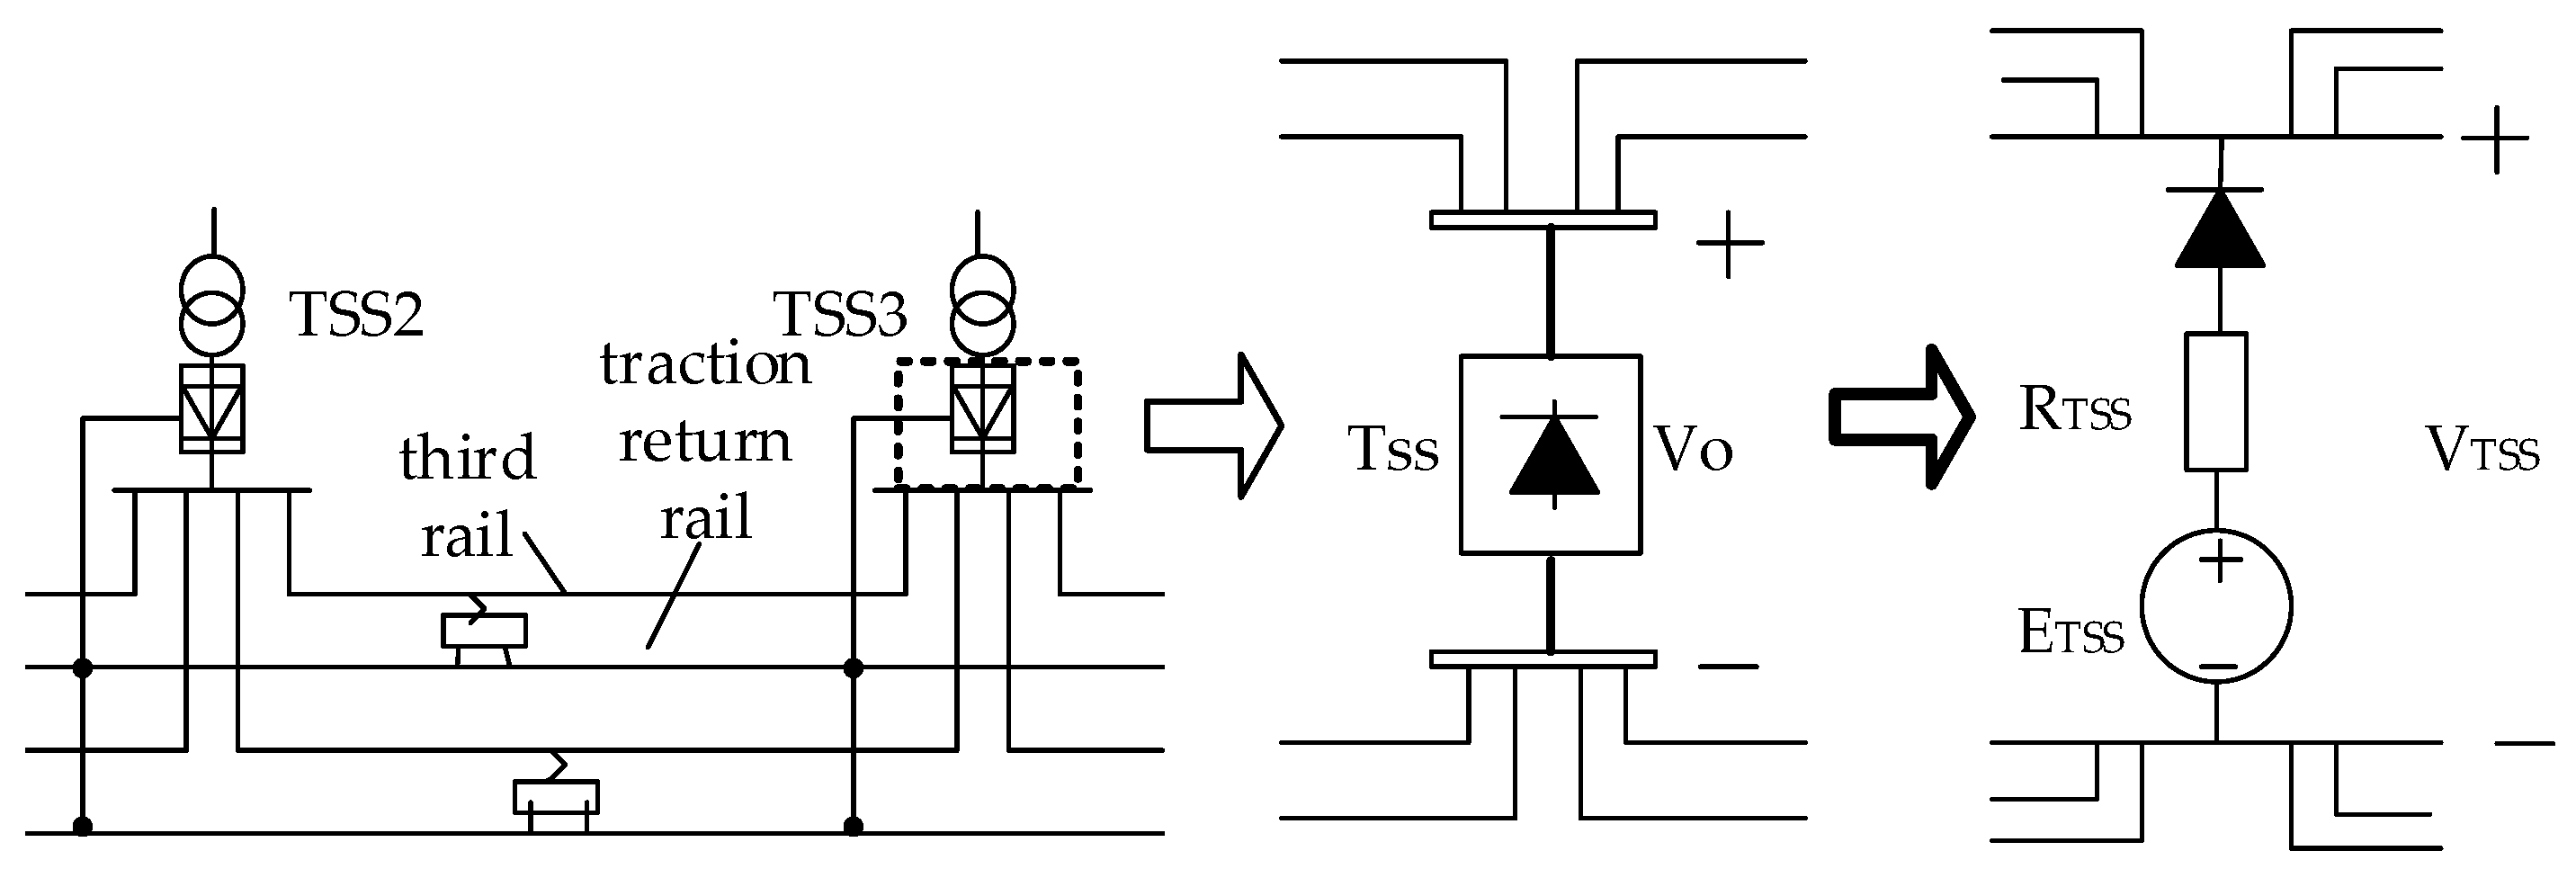
- For urban rail transit traction power supply systems, due to the fact that the DC traction substation adopts the diode rectifier, the energy has unidirectional liquidity, and regenerative braking energy cannot flow from the substation to the power supply network.
- Feeder loss. Due to the resistance of the traction network, line loss is inevitable, and the line resistance changes with the change of the train operation position.
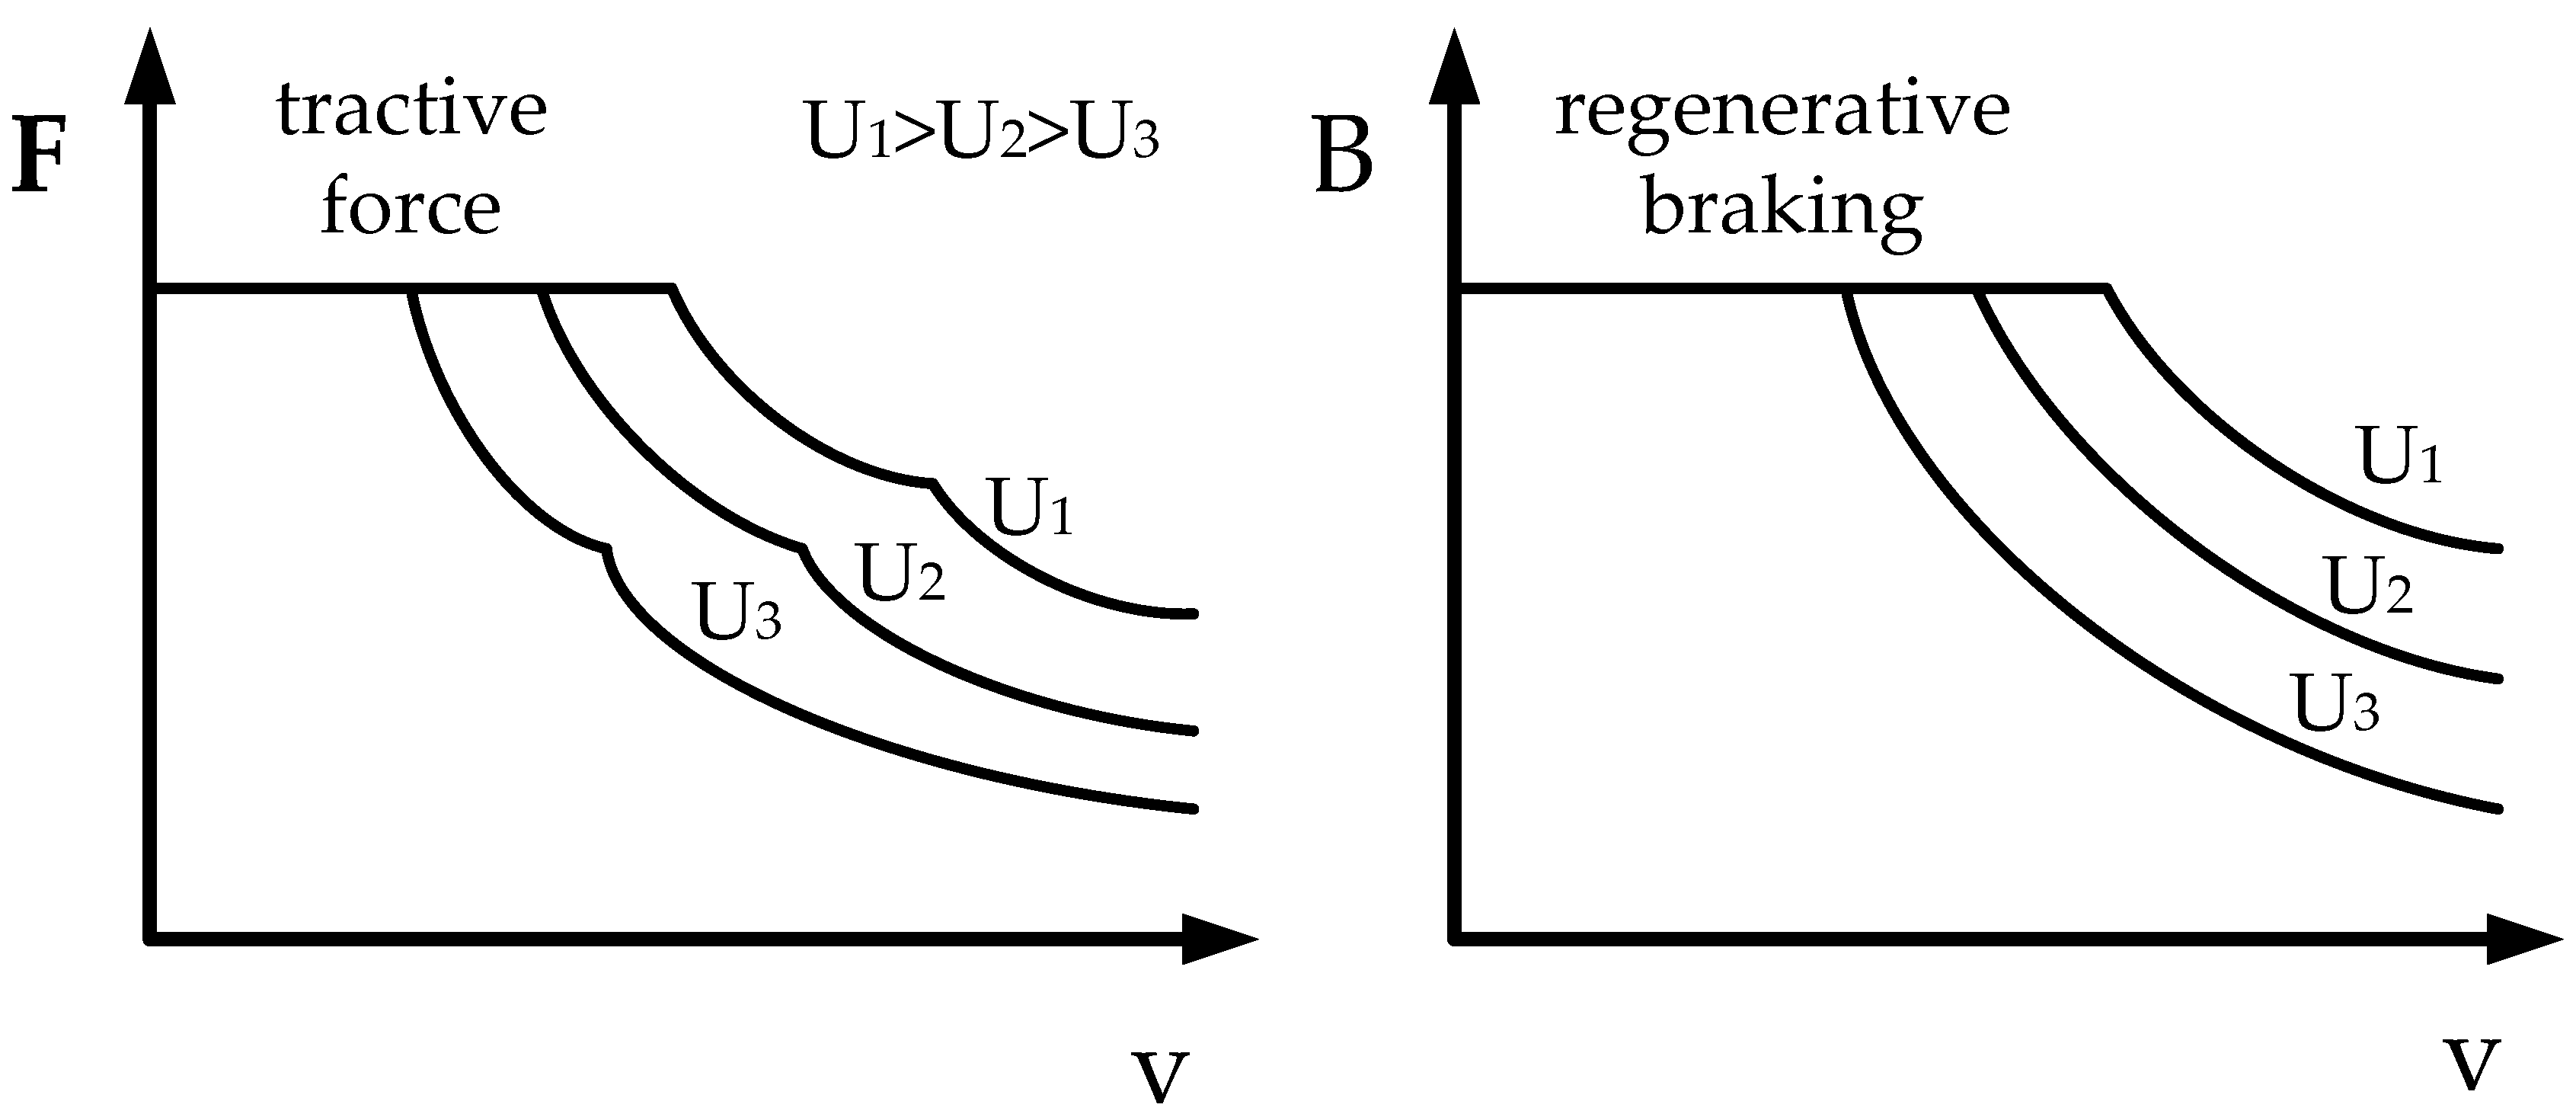
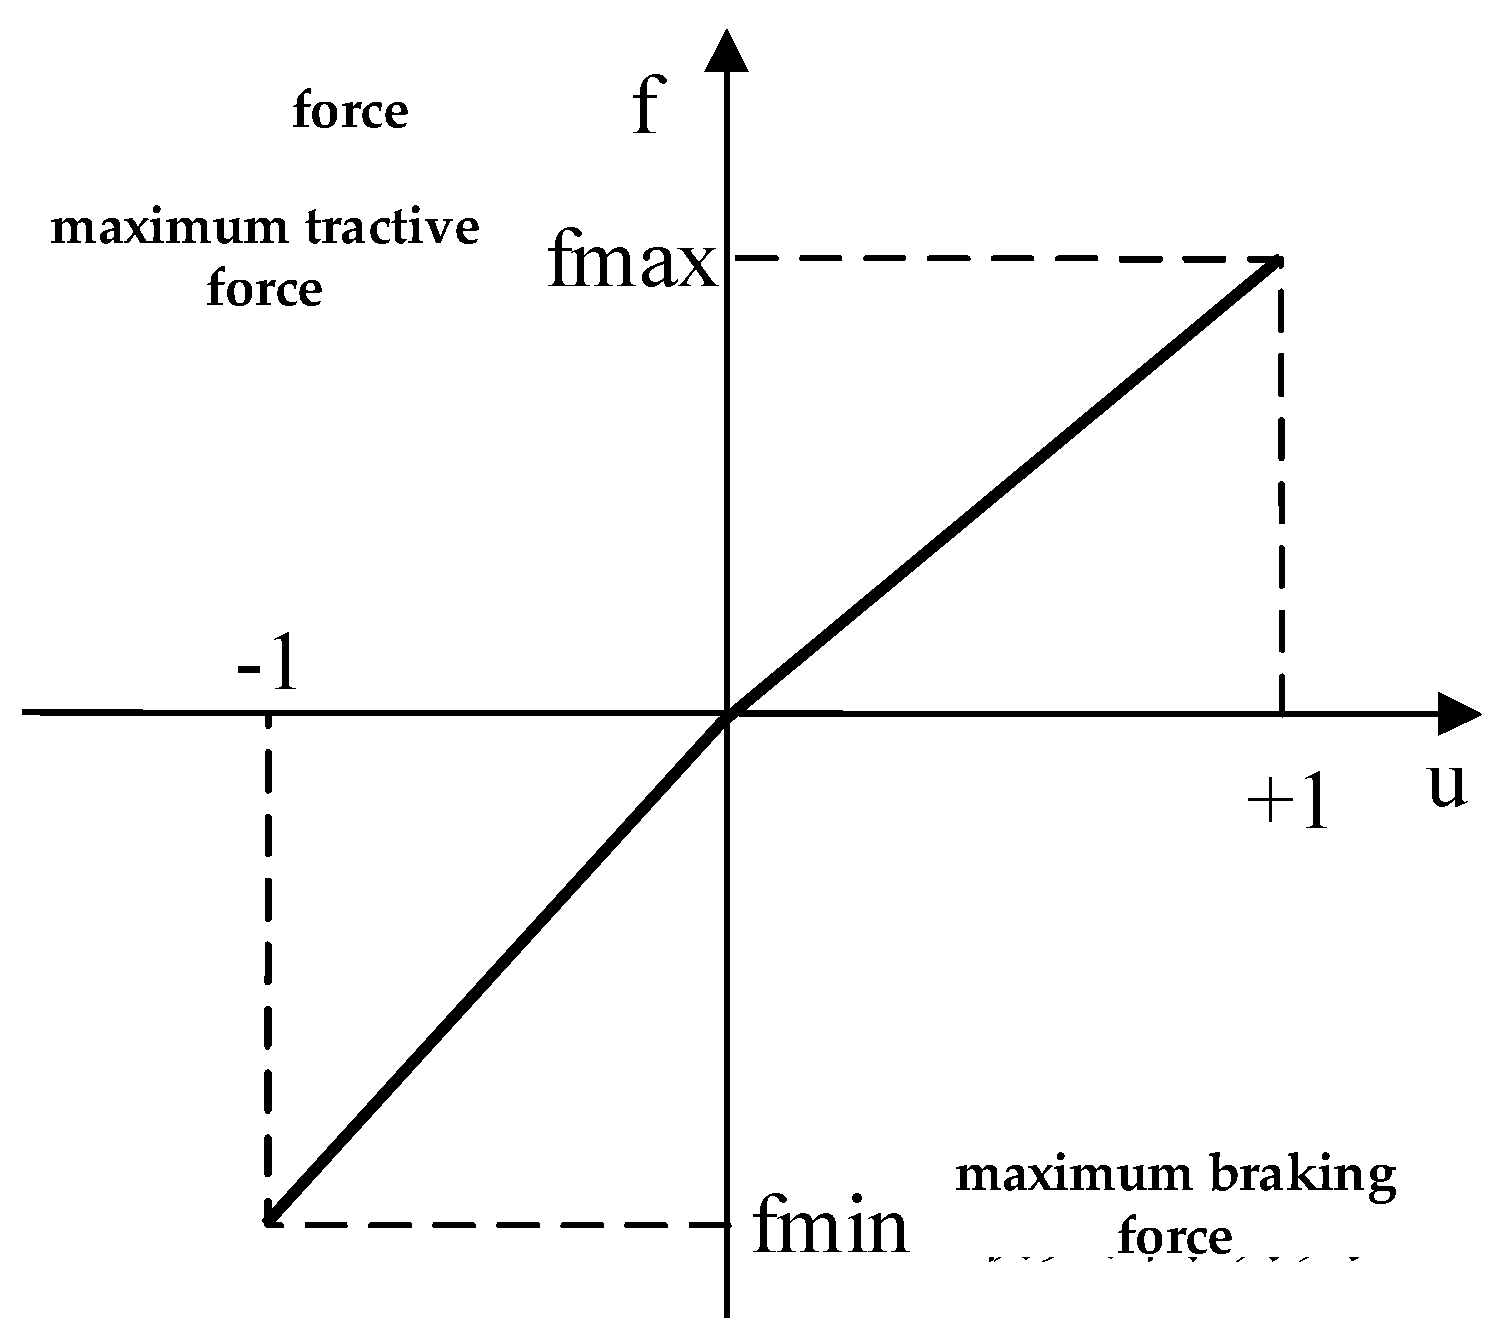
- The train’s traction and regenerative braking curve are constrained by the traction network voltage, as shown in Figure 2, and the drop of traction network voltage, train tractive and regenerative braking capacity will be limited.
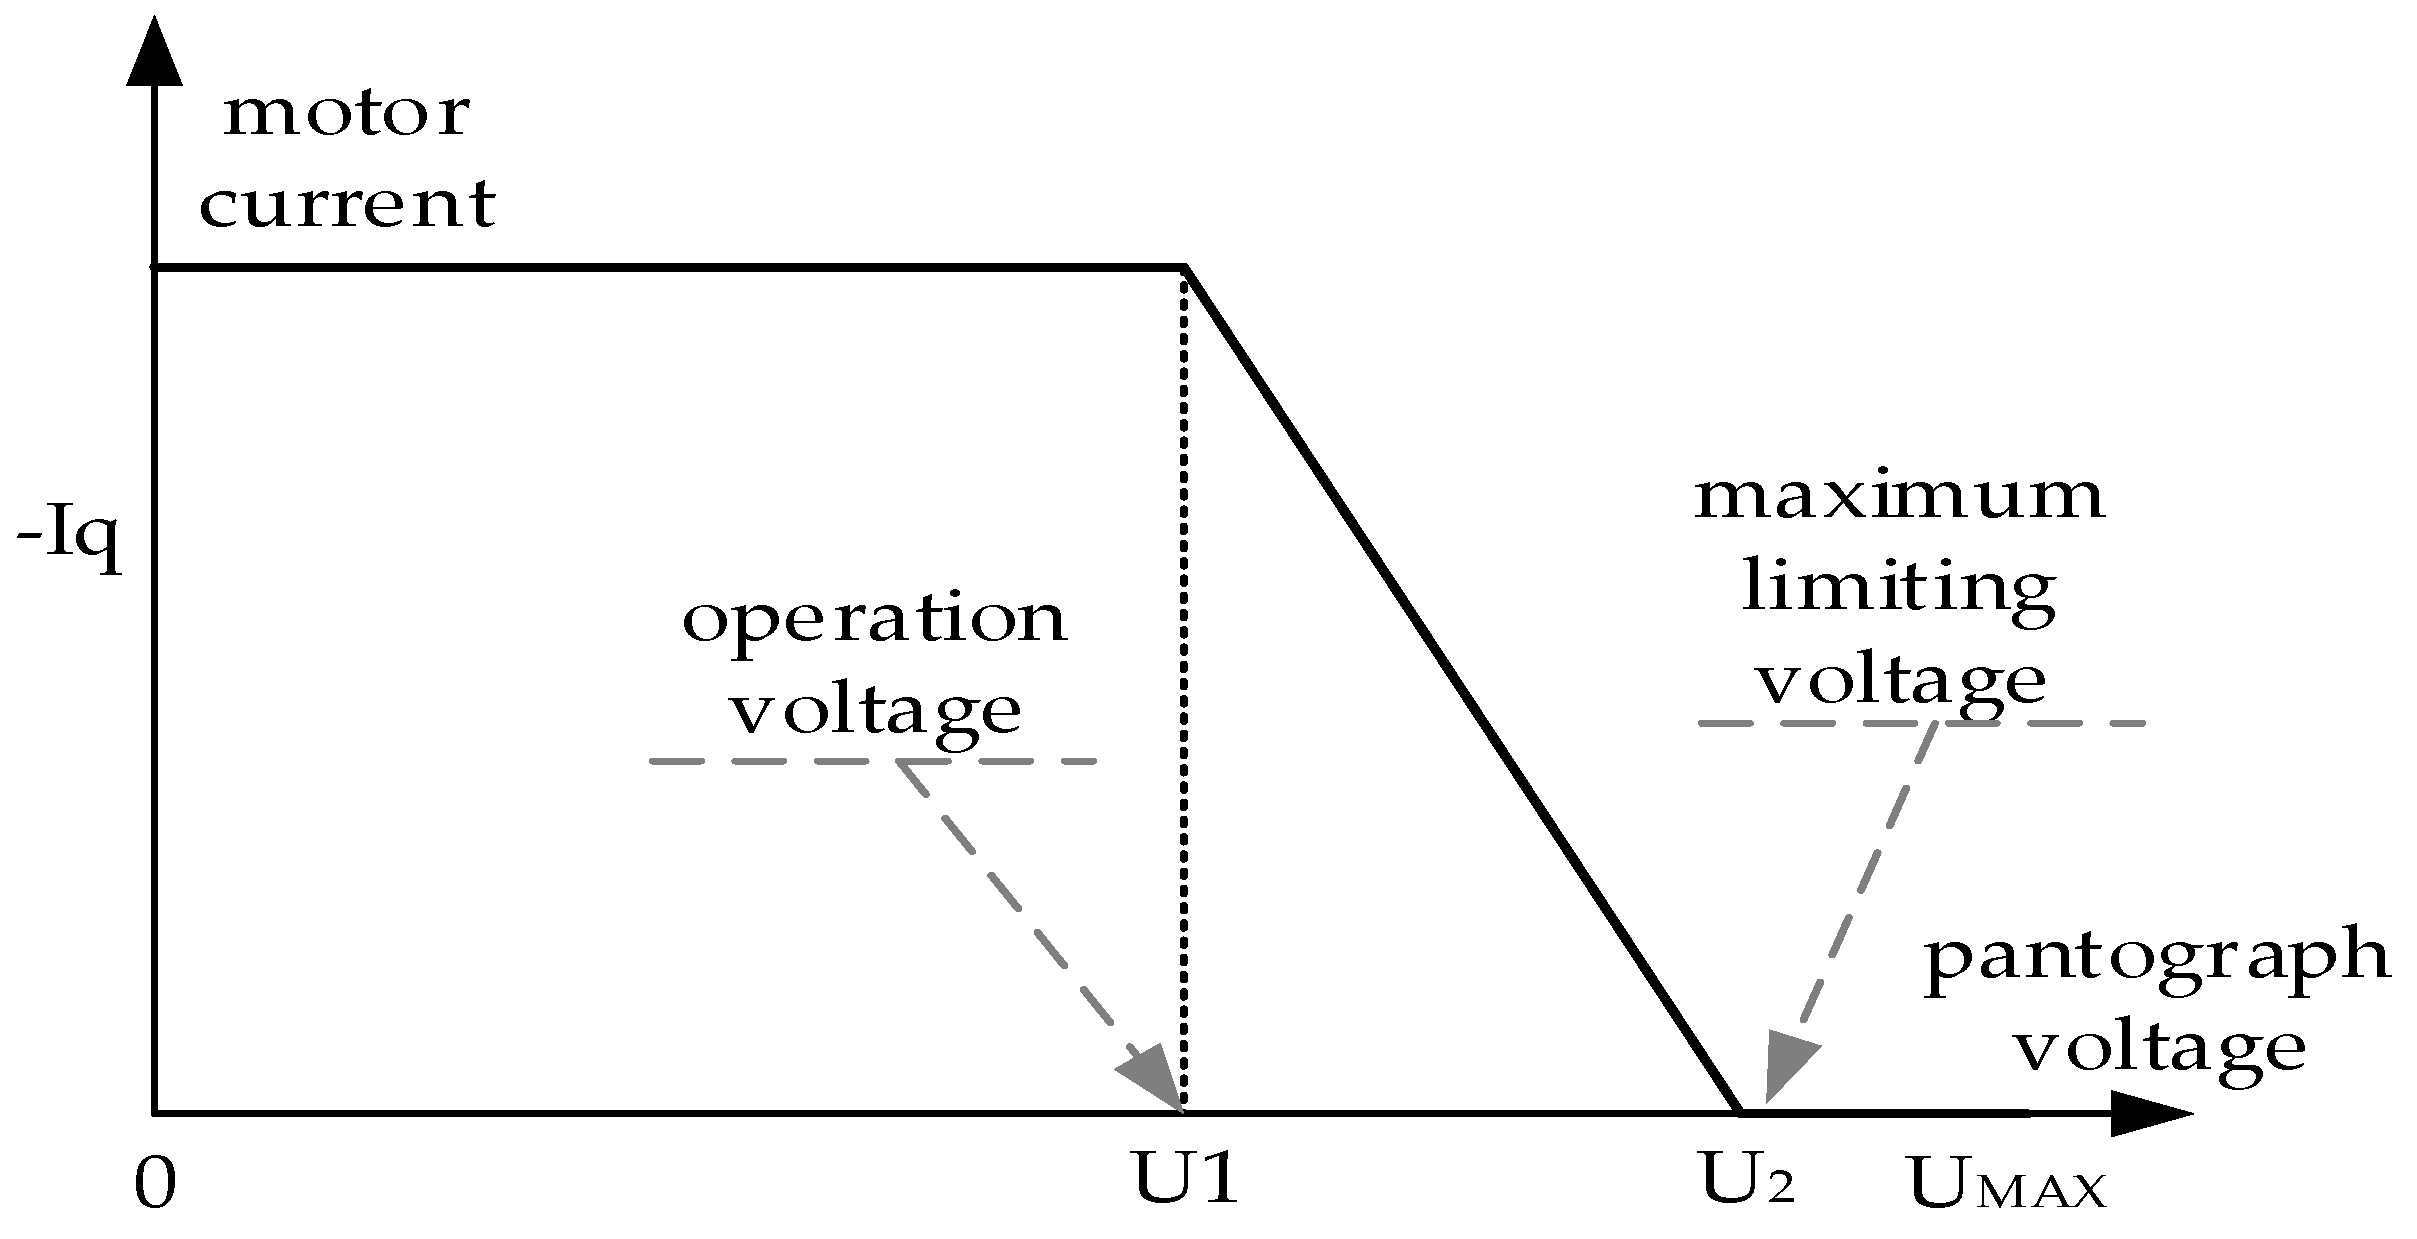
- The regenerative braking is restricted by the traction network voltage. With the increase of traction network voltage, the regenerative braking power is limited. As shown in Figure 3, when the network voltage rises to U1, the train limit motor current reduces the output of the regenerative braking power; when the network voltage reaches the maximum limit voltage U2, then the regenerative braking is removed, and the motor current is zero.
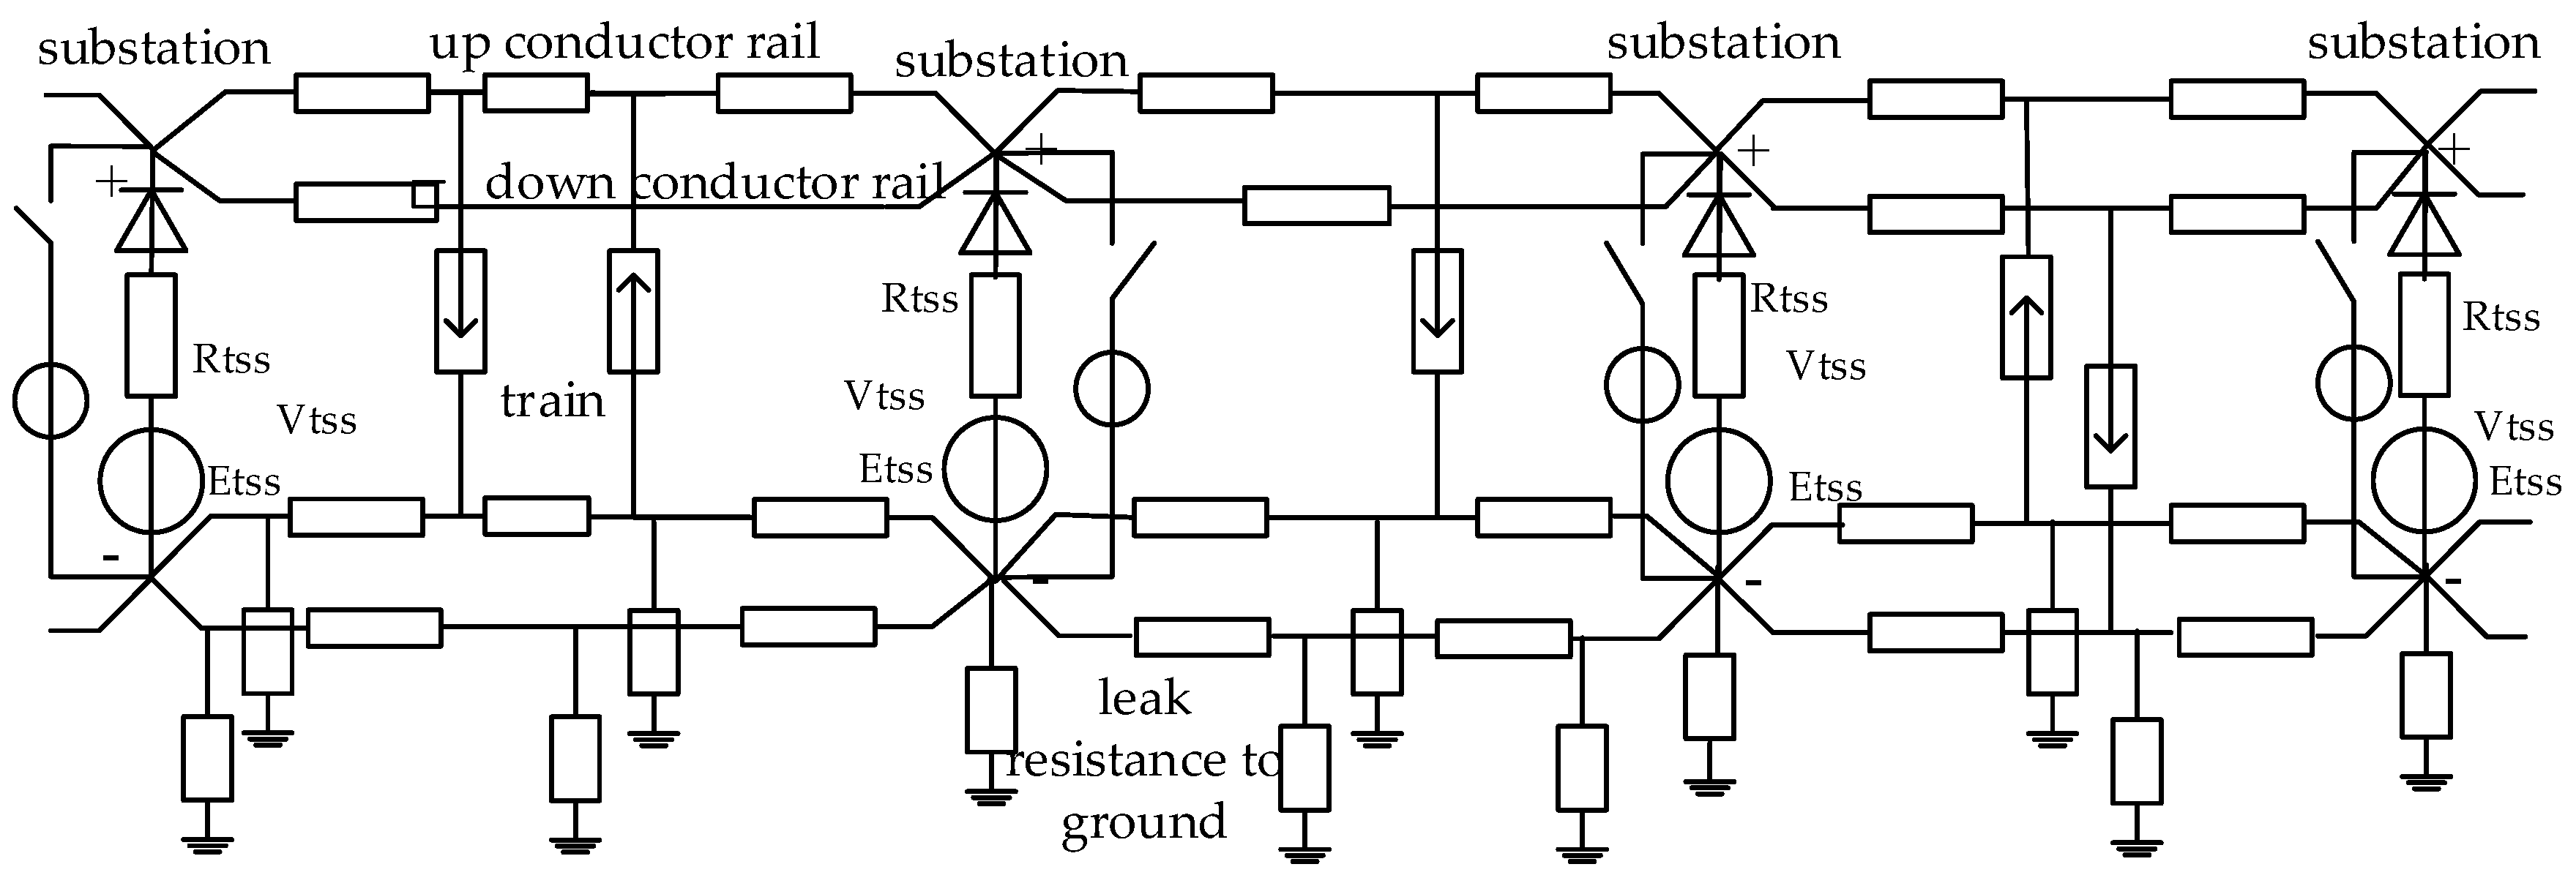
- If there are energy storage devices (such as a super capacitor) in the line, they will affect the charging state of the energy storage device. For multi-train operation, to accurately calculate the energy consumption of the system and the utilization of the regenerative braking energy, a complete simulation model of the train and traction power supply system is required. The model of the traction power supply system includes the model of the substation, the model of the rectifier unit, the resistance model of the line, the model of the train, the model of the braking resistance, etc.
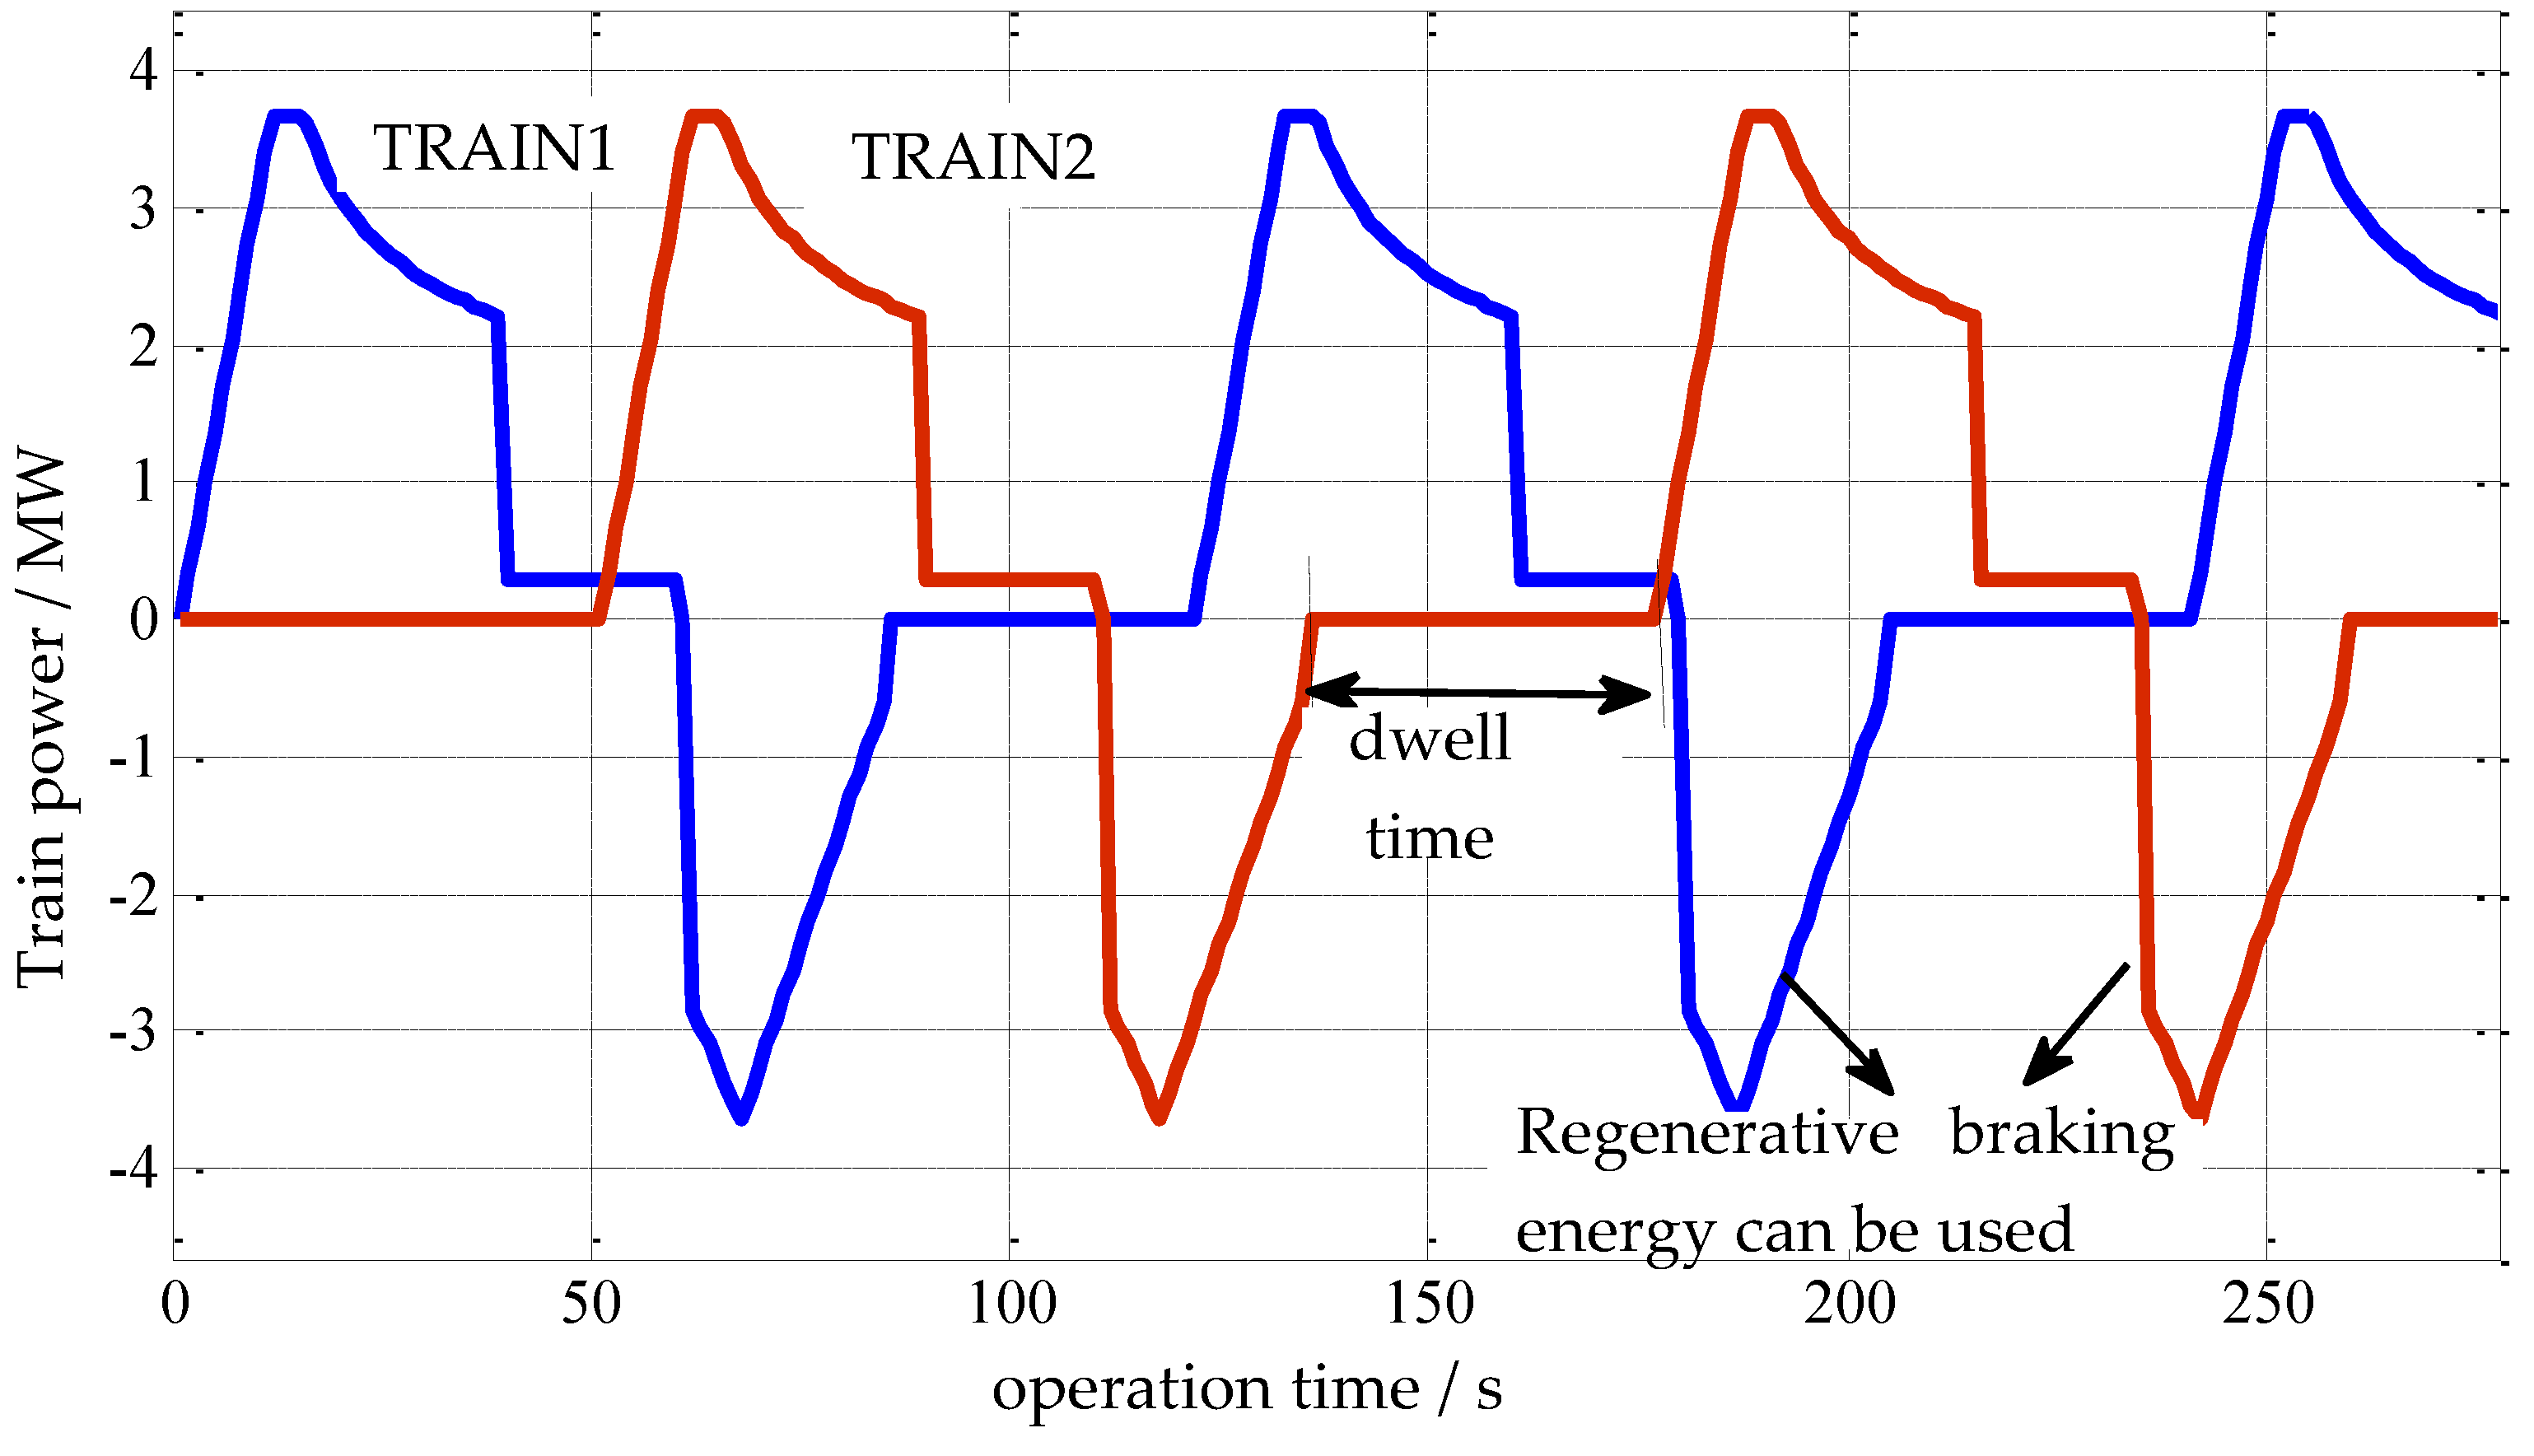
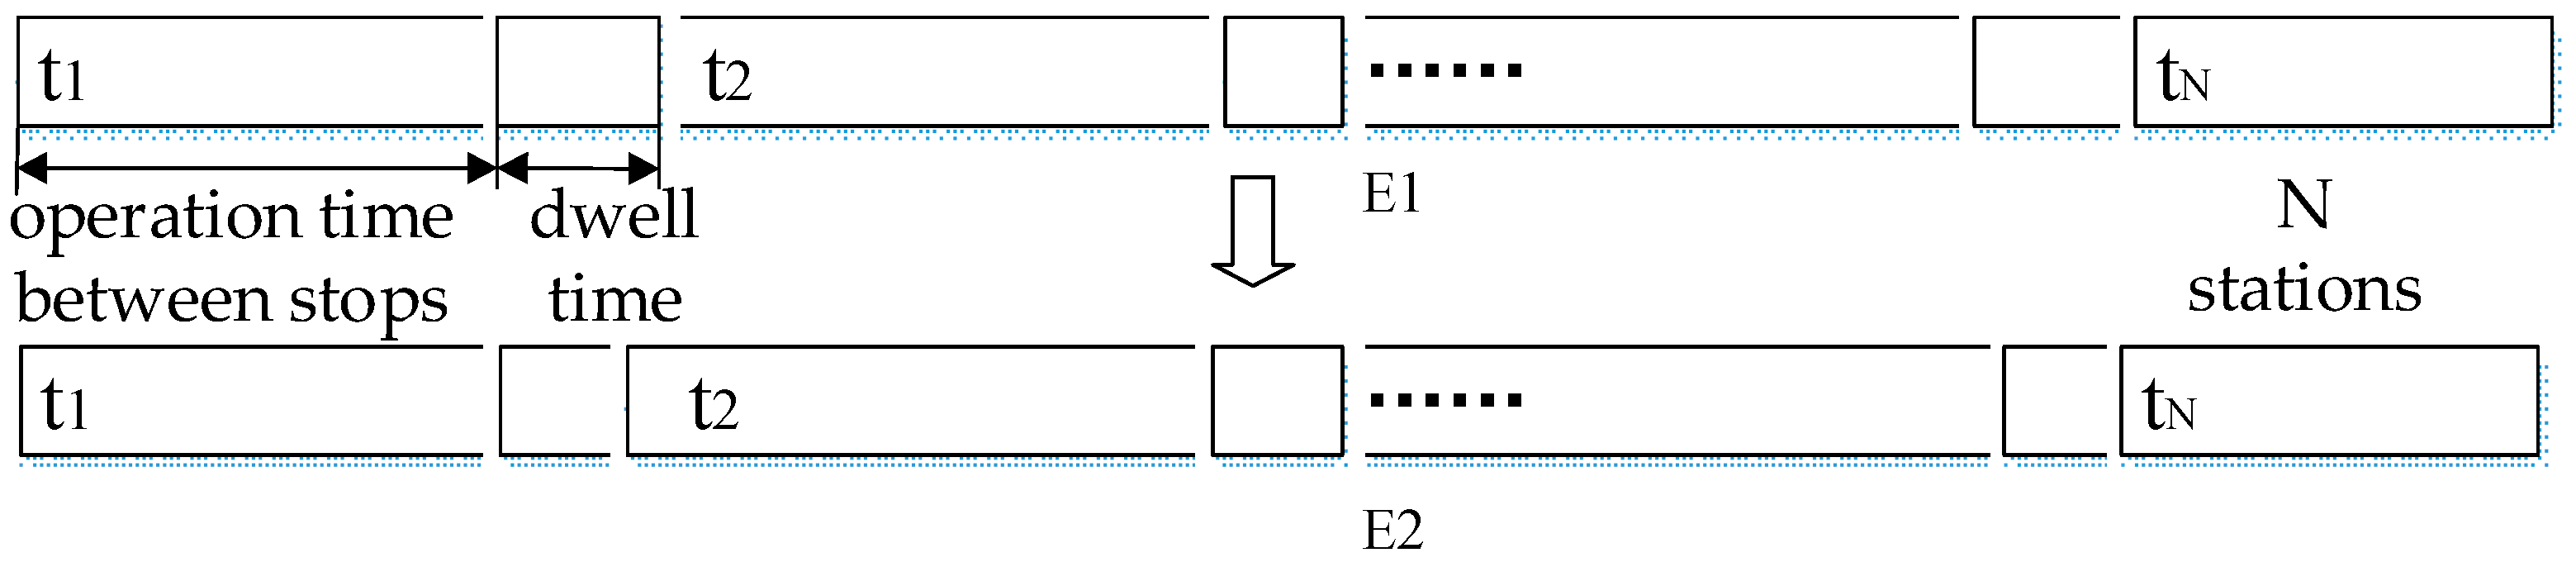
2.3. Principles of Dwell Time Optimization
3. Train Operation and Power Supply System Modeling
3.1. Train Operation Model
3.2. Traction Power Supply System Model
3.2.1. Power Substation Model with Rectifier Units
3.2.2. Train Model
3.2.3. Traction Network Model
3.3. Optimization Goal of Multi-Train Energy Saving Operation
3.3.1. Calculation of Energy Consumption Parameters
3.3.2. Optimization Goal of Multi-Train Operation
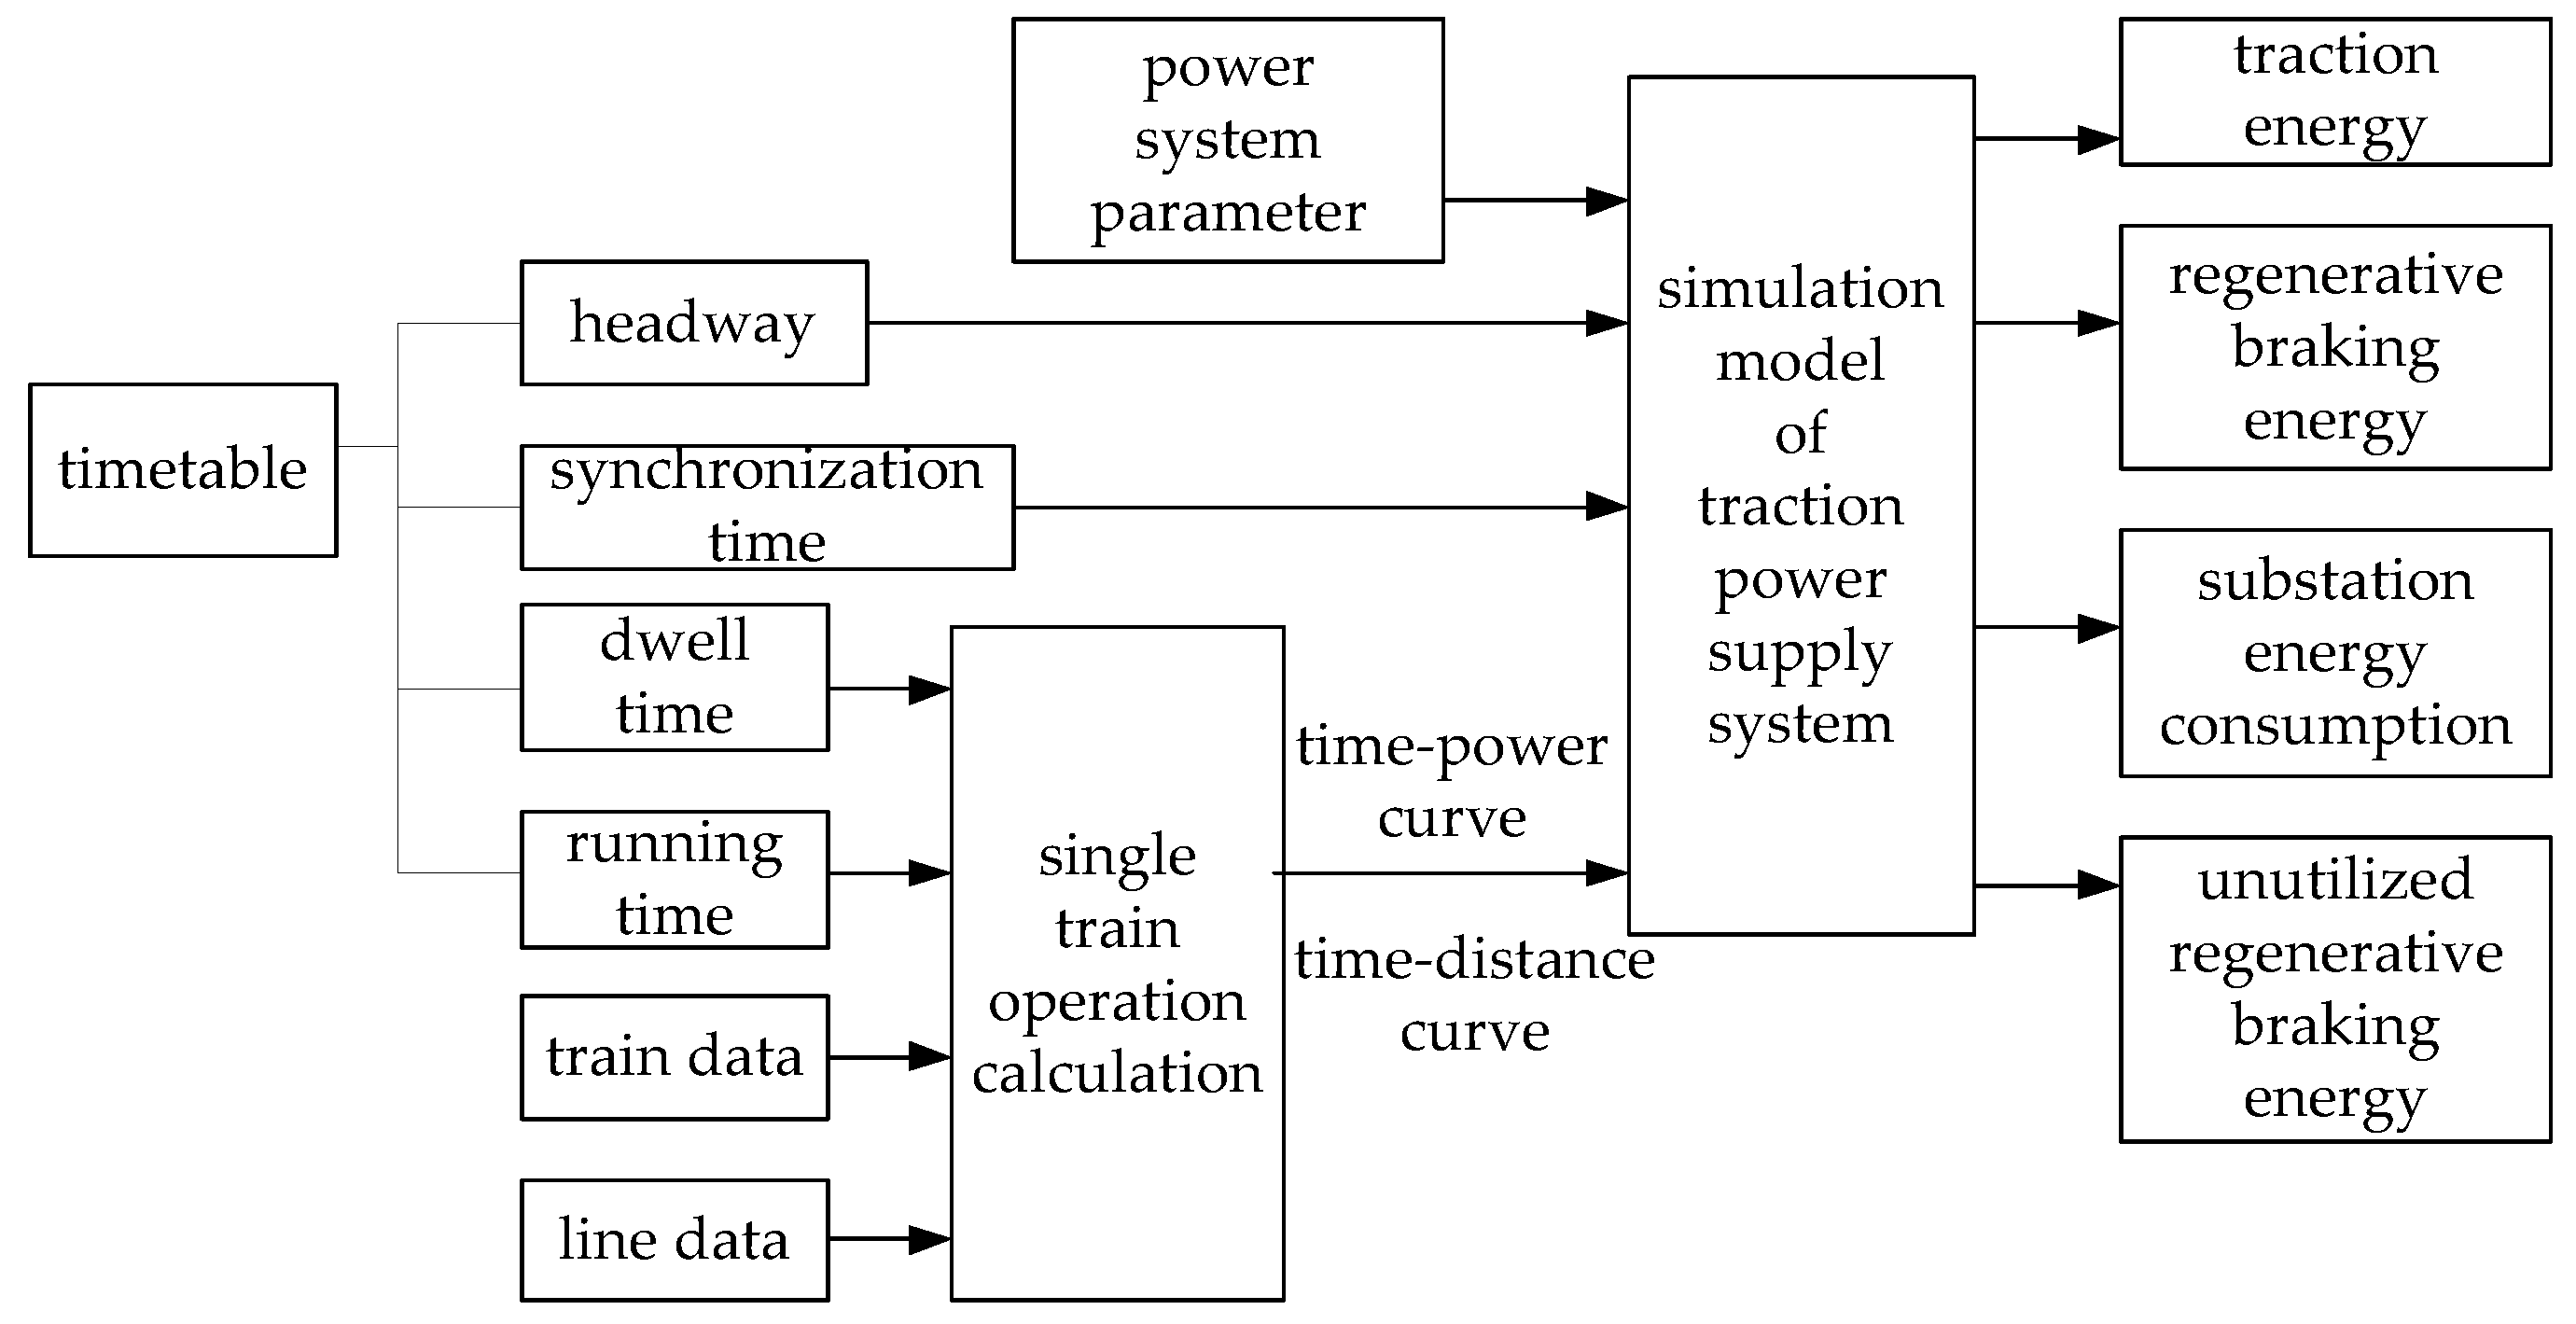
3.4. Calculation Flow of Multi-Train Operation
3.4.1. Calculation of Train Operation
3.4.2. Multi-Train Operation Simulation
3.4.3. Overall Process of Calculation
4. Genetic Algorithm Optimization
4.1. Mathematical Model
4.2. Introduction of Genetic Algorithm
4.3. Optimization Method
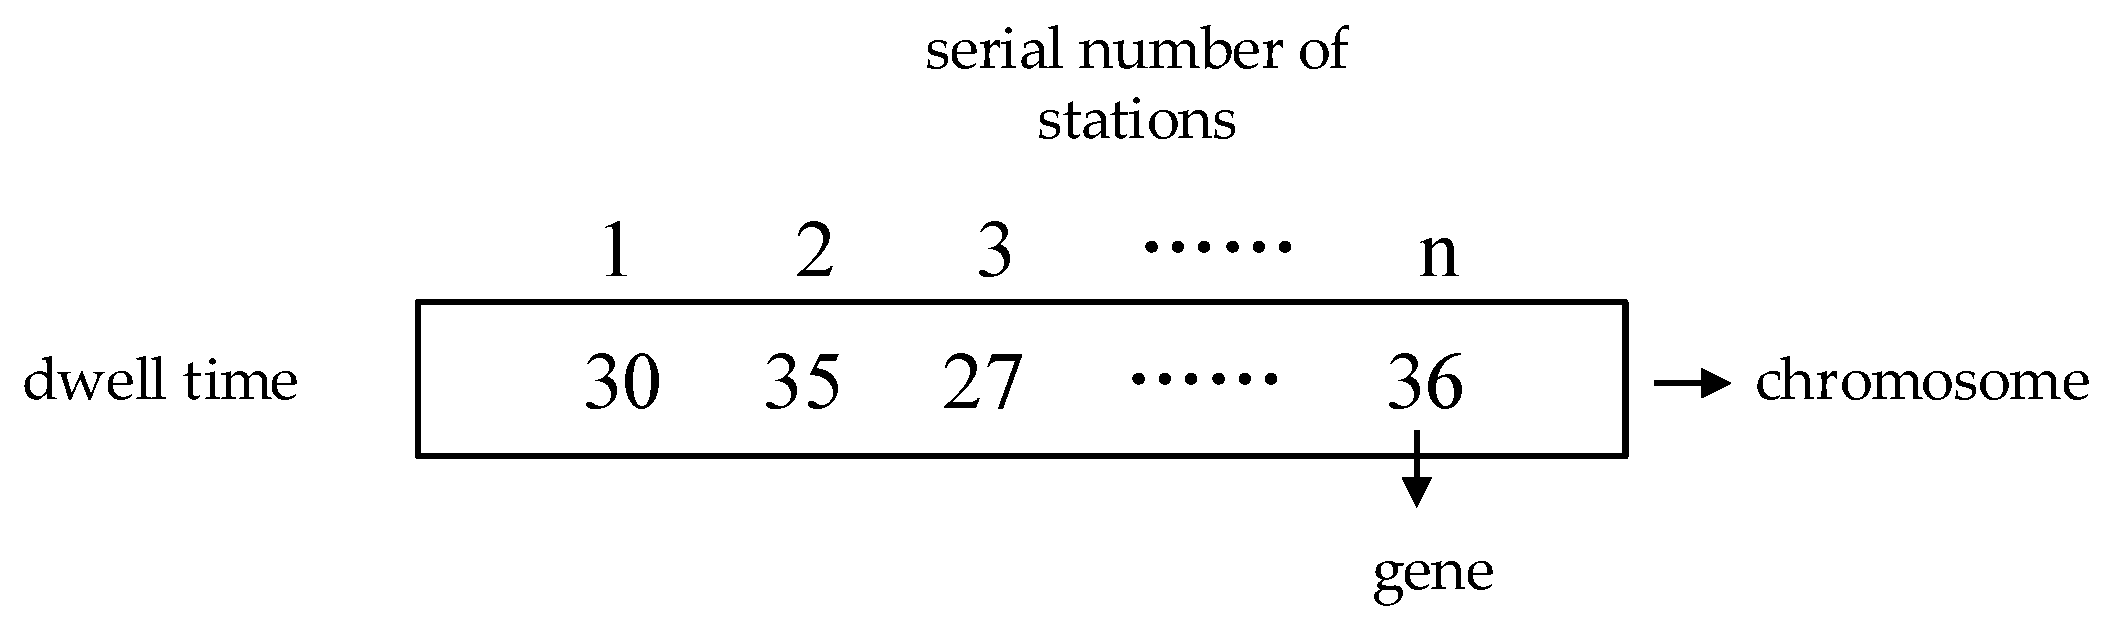
4.3.1. Encoding
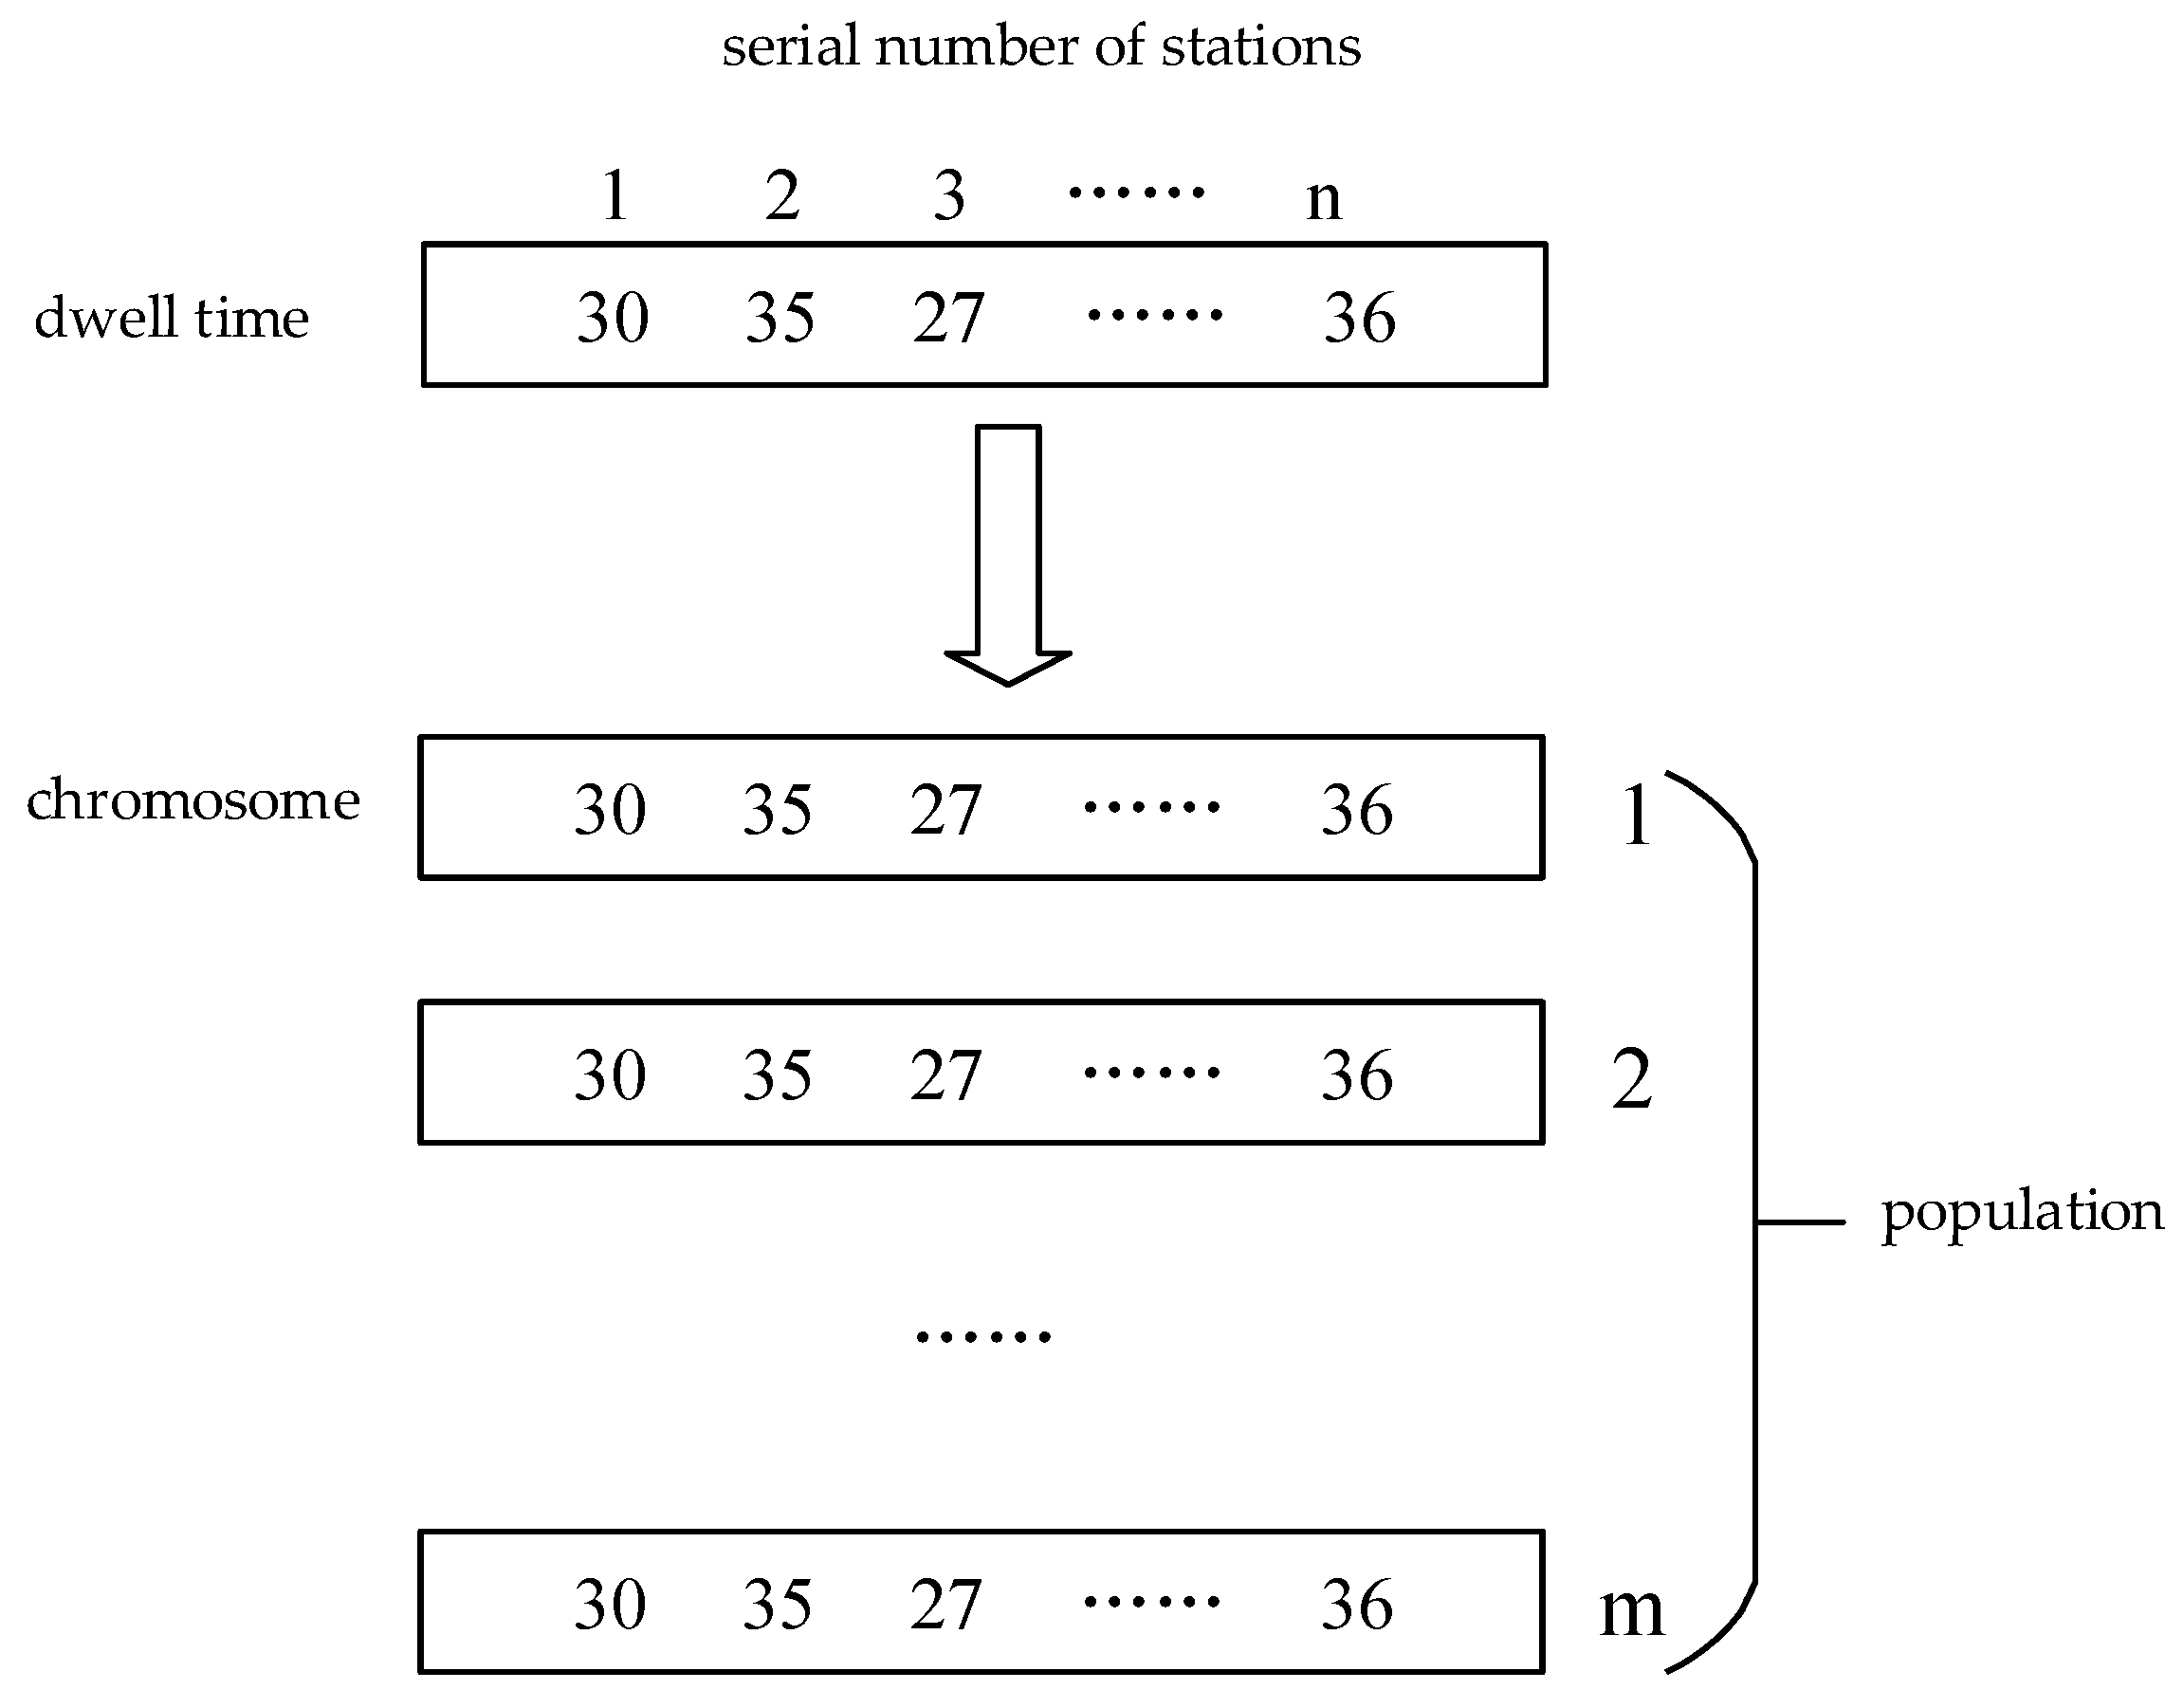
4.3.2. Generating the Initial Population
4.3.3. Fitness Function
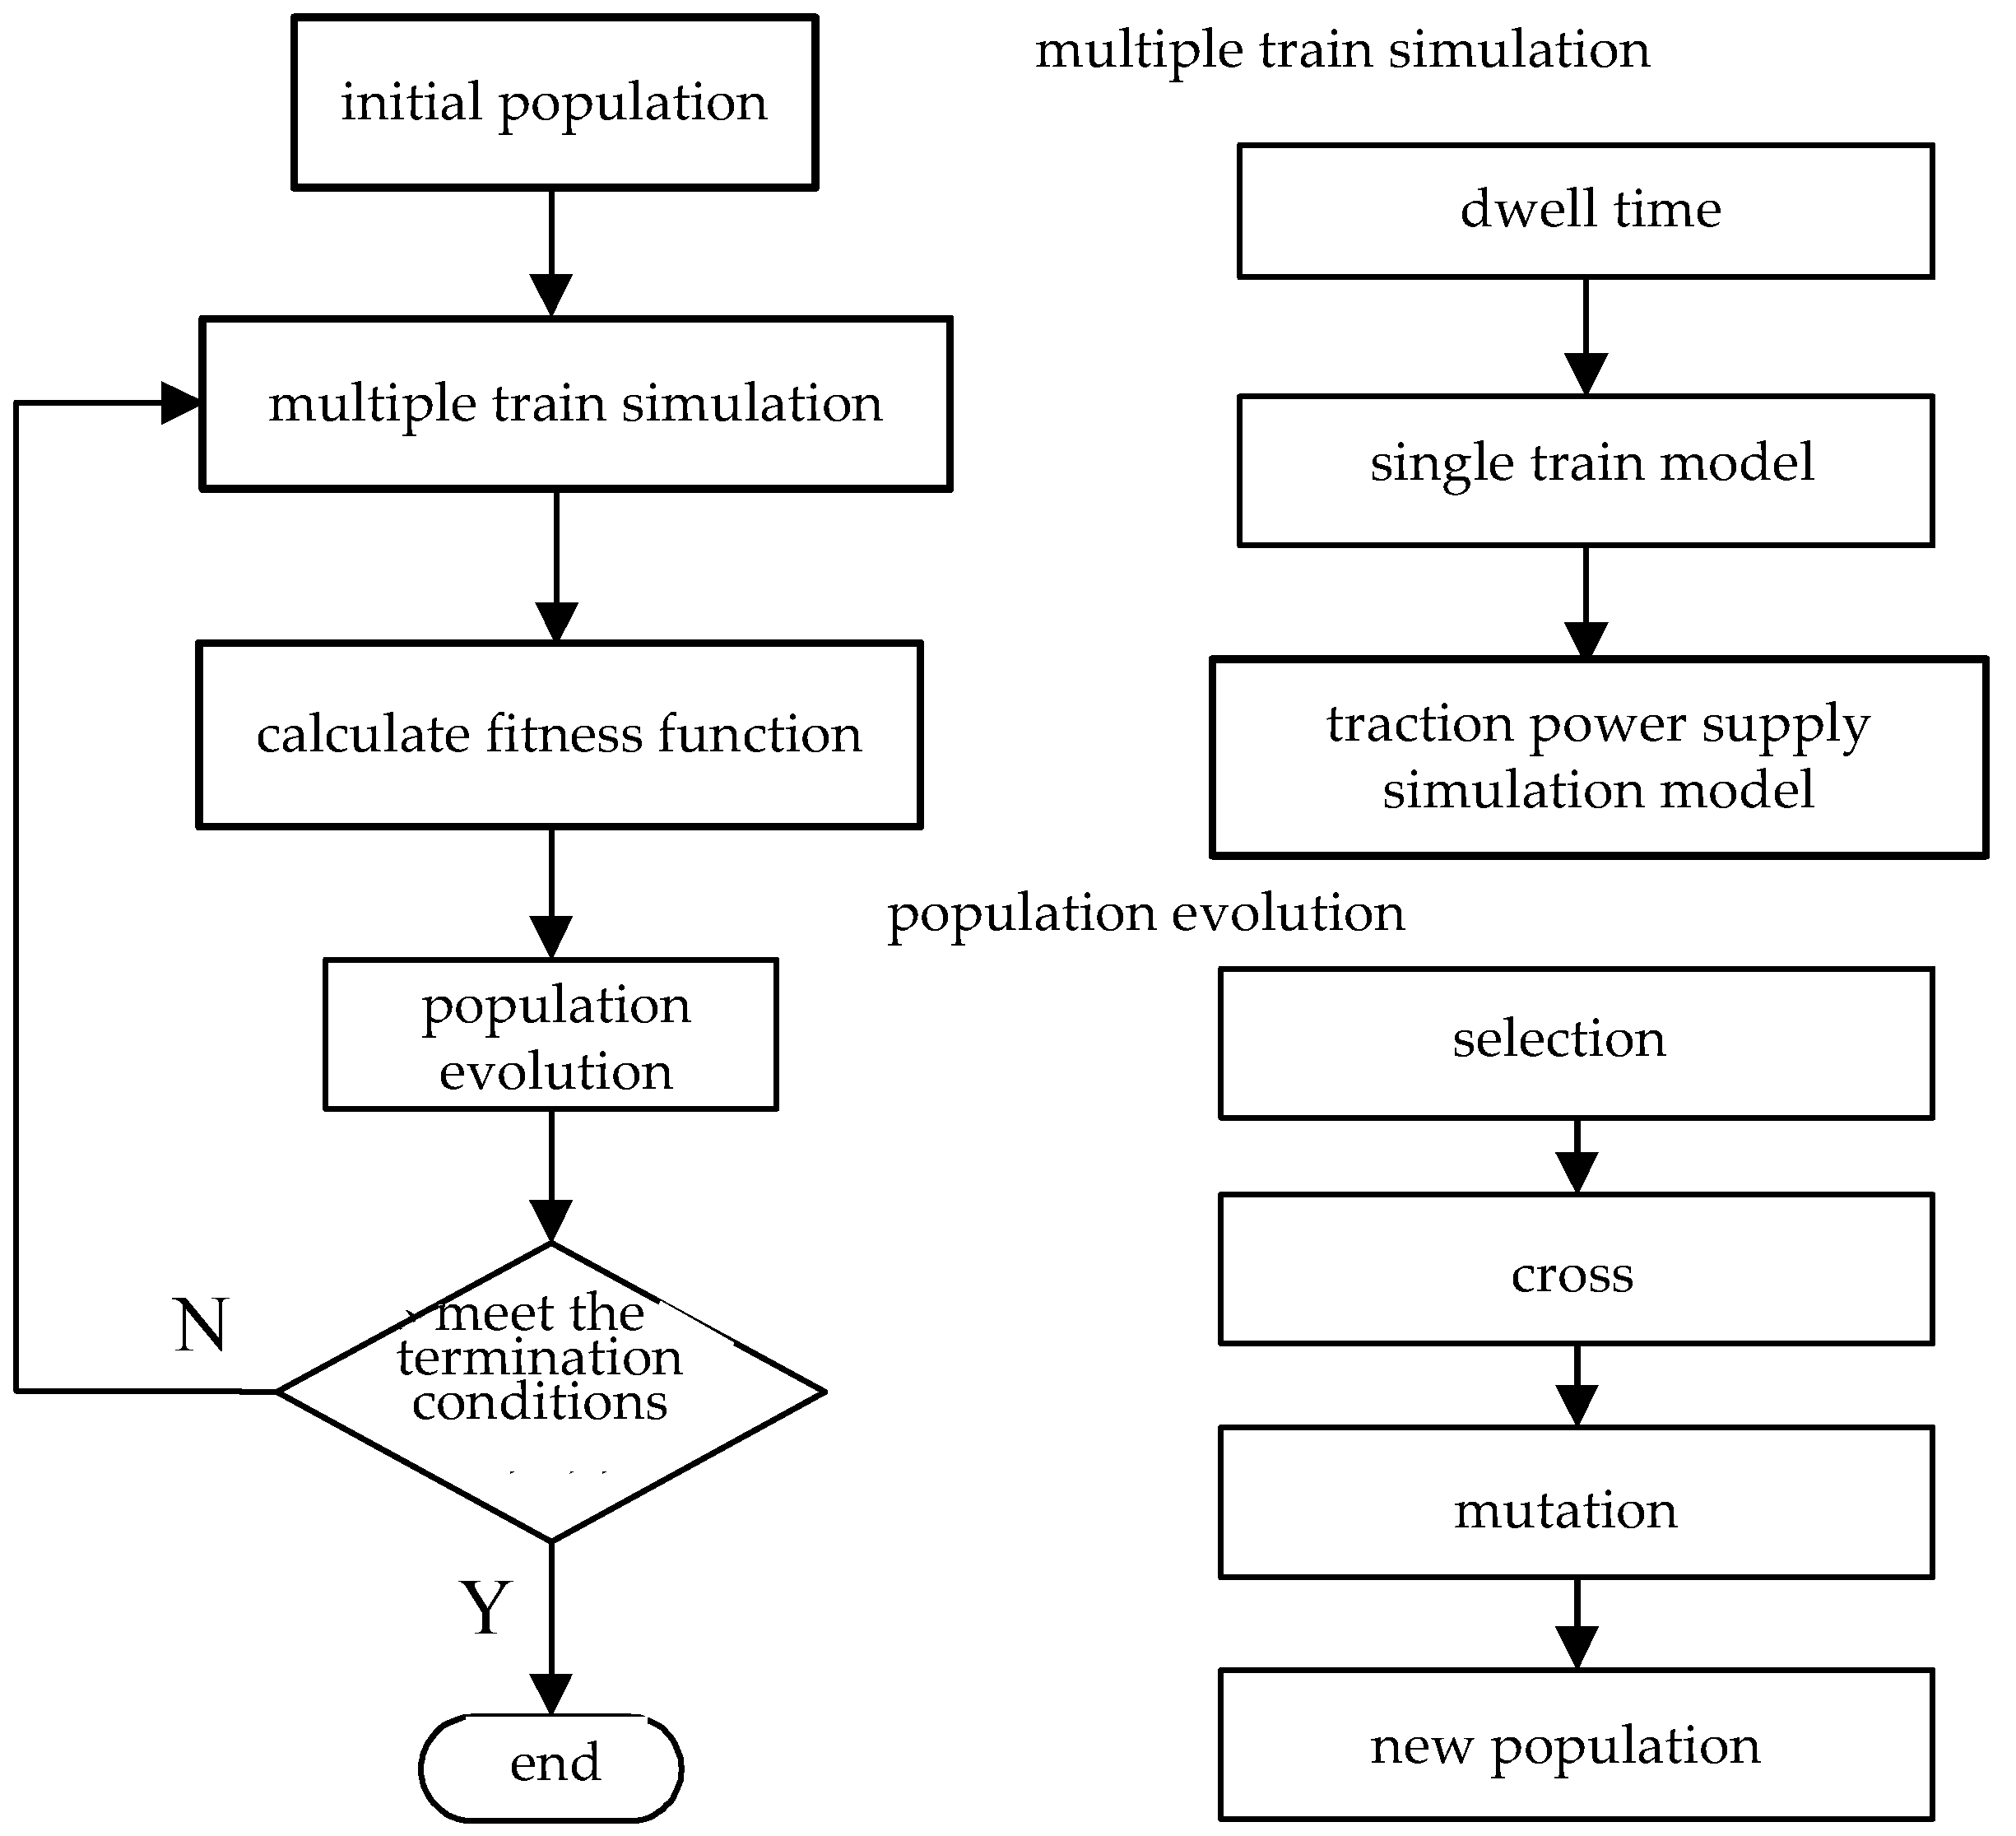
4.4. Calculation Flowchart
- The first generation of the population is generated randomly, and the m individuals generated correspond to the collection of dwell time, where m is the population quantity.
- Combining the dwell time in Step 1 and train operation data, the input direct current supply model is used to establish the corresponding circuits to calculate the electric and energy consumption data of the trains and power substation.
- According to the fitness function, Equation (20) is used calculate the fitness value of each individual.
- According to the fitness value calculated in Step 3, we perform genetic manipulation, such as selection, cross, mutation, and so on, to generate a new population.
- We determine whether the termination conditions are met, and if they are not satisfied, the new generation of population data will be input into Step 2 to continue the calculation; if they are satisfied, then the calculation and output results are terminated.
5. Dwell Time Optimization Based on Yizhuang Subway Line
6. Conclusions
Acknowledgments
Author Contributions
Conflicts of Interest
References
- Barrero, R.; Van Mierlo, J.; Tackoen, X. Energy savings in public transport. IEEE Veh. Technol. Mag. 2008, 3, 26–36. [Google Scholar] [CrossRef]
- Beijing Subway. Available online: http://www.bjsubway.com/news/qyxw/yyzd/2016-01-04/42043.html (accessed on 25 June 2016).
- González-Gil, A.; Palacin, R.; Batty, P.; Powell, J. A systems approach to reduce urban rail energy consumption. Energy Convers. Manag. 2014, 80, 509–524. [Google Scholar] [CrossRef]
- Chevrier, R. An evolutionary multi-objective approach for speed tuning optimization with energy saving in railway management. In Proceedings of the 13th IEEE International Conference on Intelligent Transportation Systems, Funchal, Portugal, 19–22 September 2010; pp. 279–284.
- Chevrier, R.; Pellegrini, P.; Rodriguez, J. Energy saving in railway timetabling: A bi-objective evolutionary approach for computing alternative running times. Transp. Res. C Emerg. Technol. 2013, 37, 20–41. [Google Scholar] [CrossRef]
- Bocharnikov, Y.; Tobias, A.; Roberts, C.; Hillmansen, S.; Goodman, C. Optimal driving strategy for traction energy saving on DC suburban railways. IET Electr. Power Appl. 2007, 1, 675–682. [Google Scholar] [CrossRef]
- Domínguez, M.; Fernández-Cardador, A.; Cucala, A.P.; Gonsalves, T.; Fernández, A. Multi objective particle swarm optimization algorithm for the design of efficient ATO speed profiles in metro lines. Eng. Appl. Artif. Intell. 2014, 29, 43–53. [Google Scholar] [CrossRef]
- Domínguez, M.; Fernández-Cardador, A.; Cucala, A.P.; Pecharromán, R.R. Energy savings in metropolitan railway substations through regenerative energy recovery and optimal design of ato speed profiles. IEEE Trans. Autom. Sci. Eng. 2012, 9, 496–504. [Google Scholar] [CrossRef]
- Domínguez, M.; Fernández, A.; Cucala, A.; Lukaszewicz, P. Optimal design of metro automatic train operation speed profiles for reducing energy consumption. Proc. Inst. Mech. Eng. F J. Rail Rapid Transit 2011, 225, 463–474. [Google Scholar] [CrossRef]
- Adinolfi, A.; Lamedica, R.; Modesto, C.; Prudenzi, A.; Vimercati, S. Experimental assessment of energy saving due to trains regenerative braking in an electrified subway line. IEEE Trans. Power Deliv. 1998, 13, 1536–1542. [Google Scholar] [CrossRef]
- Liu, H.; Jiang, J. Flywheel energy storage—An upswing technology for energy sustainability. Energy Build. 2007, 39, 599–604. [Google Scholar] [CrossRef]
- Suzuki, Y.; Koyanagi, A.; Kobayashi, M.; Shimada, R. Novel applications of the flywheel energy storage system. Energy 2005, 30, 2128–2143. [Google Scholar] [CrossRef]
- Tzeng, J.; Emerson, R.; Moy, P. Composite flywheels for energy storage. Compos. Sci. Technol. 2006, 66, 2520–2527. [Google Scholar] [CrossRef]
- Bolund, B.; Bernhoff, H.; Leijon, M. Flywheel energy and power storage systems. Renew. Sustain. Energy Rev. 2007, 11, 235–258. [Google Scholar] [CrossRef]
- Wang, G.; Zhang, L.; Zhang, J. A review of electrode materials for electrochemical supercapacitors. Chem. Soc. Rev. 2012, 41, 797–828. [Google Scholar] [CrossRef] [PubMed]
- Burke, A.; Miller, M. The power capability of ultracapacitors and lithium batteries for electric and hybrid vehicle applications. J. Power Sources 2011, 196, 514–522. [Google Scholar] [CrossRef]
- Hammar, A.; Venet, P.; Lallemand, R.; Coquery, G.; Rojat, G. Study of accelerated aging of supercapacitors for transport applications. IEEE Trans. Ind. Electron. 2010, 57, 3972–3979. [Google Scholar] [CrossRef]
- Sharma, P.; Bhatti, T.S. A review on electrochemical double-layer capacitors. Energy Convers. Manag. 2010, 51, 2901–2912. [Google Scholar] [CrossRef]
- Iannuzzi, D.; Tricoli, P. Metro trains equipped onboard with supercapacitors: A control technique for energy saving. In Proceedings of the IEEE International Symposium on Power Electronics Electrical Drives Automation and Motion (SPEEDAM), Pisa, Italy, 14–16 June 2010; pp. 750–756.
- Wang, B.; Yang, Z.; Lin, F.; Zhao, W. An Improved Genetic Algorithm for Optimal Stationary Energy Storage System Locating and Sizing. Energies 2014, 7, 6434–6458. [Google Scholar] [CrossRef]
- Xia, H.; Chen, H.; Yang, Z.; Lin, F.; Wang, B. Optimal Energy Management, Location and Size for Stationary Energy Storage System in a Metro Line Based on Genetic Algorithm. Energies 2015, 8, 11618–11640. [Google Scholar] [CrossRef]
- Kraytsberg, A.; Ein-Eli, Y. Review on Li-air batteries—Opportunities, limitations and perspective. J. Power Sources 2011, 196, 886–893. [Google Scholar] [CrossRef]
- Ellis, B.L.; Nazar, L.F. Sodium and sodium-ion energy storage batteries. Curr. Opin. Solid State Mater. Sci. 2012, 16, 168–177. [Google Scholar] [CrossRef]
- Mukherjee, R.; Krishnan, R.; Lu, T.M.; Koratkar, N. Nanostructured electrodes for high-power lithium ion batteries. Nano Energy 2012, 1, 518–533. [Google Scholar] [CrossRef]
- Czerwiński, A.; Obrębowski, S.; Rogulski, Z. New high-energy lead-acid battery with reticulated vitreous carbon as a carrier and current collector. J. Power Sources 2012, 198, 378–382. [Google Scholar] [CrossRef]
- Chen, J.F.; Lin, R.L.; Liu, Y.C. Optimization of an mrt train schedule: Reducing maximum traction power by using genetic algorithms. IEEE Trans. Power Syst. 2005, 20, 1366–1372. [Google Scholar] [CrossRef]
- Kim, K.M.; Oh, S.M. A model and approaches for smoothing peaks of traction energy in timetabling. J. Korean Soc. Railw. 2009, 12, 1018–1023. [Google Scholar]
- Kim, K.M.; Oh, S.M.; Han, M. A mathematical approach for reducing the maximum traction energy: The case of Korean MRT trains. In Proceedings of the International MultiConference of Engineers and Computer Scientists, Hong Kong, China, 17–19 March 2010; pp. 2169–2173.
- Gordon, S.P.; Lehrer, D.G. Coordinated train control and energy management control strategies. In Proceedings of the 1998 ASME/IEEE Joint Railroad Conference, Philadelphia, PA, USA, 15–16 April 1998; pp. 165–176.
- Galán, A.R.; Alcaraz, M.T.P.; Morales, A.F.; Cucala, P. Mathematical Programming Approach to Underground Timetabling Problem for Maximizing Time Synchronization; XI Congreso de Ingeniería de Organización: Madrid, Italy, 5–7 September 2007; pp. 1395–1405. [Google Scholar]
- Yang, X.; Ning, B.; Li, X.; Tang, T. A two-objective timetable optimization model in subway systems. IEEE Trans. Intel-Light Transp. Syst. 2014, 15, 1–9. [Google Scholar] [CrossRef]
- Zhao, L.; Li, K.; Su, S. A Multi-objective Timetable Optimization Model for Subway Systems. EITRT2013 2014, 1, 557–565. [Google Scholar]
- Nasri, A.; Moghadam, M.F.; Mokhtari, H. Timetable optimization for maximum usage of regenerative energy of braking in electrical railway systems. In Proceedings of IEEE International Symposium on Power Electronics Electrical Drives Automation and Motion (SPEEDAM), Pisa, Italy, 14–16 June 2010; pp. 1218–1221.
- Albrecht, T.; Oettich, S. A new integrated approach to dynamic schedule synchronization and energy-saving train control. In Computers in Railways VIII; WIT Press: Southampton, UK, 2002; pp. 847–856. [Google Scholar]
- Albrecht, T. Reducing power peaks and energy consumption in rail transit systems by simultaneous train running time control. In Computers in Railways IX; WIT Press: Southampton, UK, 2004; pp. 885–894. [Google Scholar]
- Gong, C.; Zhang, S.; Zhang, F.; Jiang, J.; Wang, X. An integrated energy-efficient operation methodology for metro systems based on a real case of Shanghai metro line one. Energies 2014, 7, 7305–7329. [Google Scholar] [CrossRef]
- Su, S.; Li, X.; Tang, T. A subway train timetable optimization approach based on energy-efficient operation strategy. IEEE Trans. Intel-Light Transp. Syst. 2013, 14, 883–893. [Google Scholar] [CrossRef]
- Su, S.; Tang, T.; Li, X.; Gao, Z. Optimization of multi-train operations in a subway system. IEEE Trans. Intell. Transp. Syst. 2014, 15, 673–684. [Google Scholar]
- Miyatake, M.; Matsuda, K. Energy Saving Speed and Charge/Discharge Control of a Railway Vehicle with On-board Energy Storage by Means of an Optimization Model. IEEJ Trans. Electr. Electron. Eng. 2009, 4, 771–778. [Google Scholar] [CrossRef]
- Guo, D. Research on the Solution of Simulation for Urban Traction Power Including Regenerative Braking. Master’s Thesis, Southwest Jiaotong University, Chengdu, China, 2005. [Google Scholar]
- Liu, W.; Li, Q.; Li, L. Steady-state short-circuit salculation of DC traction supply system based on polygonal external characteristic. Electr. Drive Locomot. 2008, 1, 61–64. [Google Scholar]
- Shen, N. Model of Inverter for Regenarative Energy Feedback and Process Simulation in DC Traction Power Supply System. Master’s Thesis, Southwest Jiaotong University, Chengdu, China, 2009. [Google Scholar]
- Liu, X.; Yu, S.; Liu, X. Model and algorithm for traction power system simulation of urban rail-line. Comput. Simul. 2004, 12, 213–218. [Google Scholar]
- Liu, W.; Li, Q.; Chen, M. Study of unified AC/DC power flow in DC traction power supply system. Power Syst. Prot. Control 2010, 38, 128–133. [Google Scholar]
- Zheng, L.; Song, R.; Wei, H.S.; Dong, L.H. Optimization Model and Algorithm of Skip-stop Strategy for Urban Rail Transit. J. China Railw. Soc. 2009, 31, 1–8. [Google Scholar]


| Train Equivalent Mass (t) | Tc1 | M1 | T | M3 | M2 | Tc2 |
|---|---|---|---|---|---|---|
| AW0 | 33 | 35 | 28 | 35 | 35 | 33 |
| AW2 | 46.56 | 50.24 | 43.24 | 50.24 | 50.24 | 46.56 |
| AW3 | 50.4 | 54.5 | 47.5 | 54.5 | 54.5 | 50.4 |
| Parameters | Value | Parameters | Value |
|---|---|---|---|
| Nominal voltage | 750 V | Efficiency of inverter | 0.93 |
| Maximum voltage | 900 V | Efficiency of motor | 0.915 |
| Minimum voltage | 680 V | Efficiency of gear | 0.975 |
| Power-factor of load | 0.85 | Motor rated power | 180 kW*4 |
| Regeneration limit voltage U1/U2 | 900 V/950 V | Maximum acceleration | 1 m/s2 |
| Maximum speed | 80 km/h | Maximum deceleration | 1 m/s2 |
| Resistance of traction network | 50.007 Ω/km | Resistance of rail | 0.009 Ω/km |
| Serial Number | Station Name | Dwell Time (s) | Station Name | Dwell Time (s) |
|---|---|---|---|---|
| 1 | Songjiazhuang | / | Yizhuang Railway Station | / |
| 2 | Xiaocun | 30 | Ciqu | 35 |
| 3 | Xiaohongmen | 30 | Ciqu South | 35 |
| 4 | Jiugong | 30 | Jinghailu | 30 |
| 5 | Yizhuangqiao | 35 | Tongjinanlu | 30 |
| 6 | Yizhuang Culture Park | 30 | Rongchandongjie | 30 |
| 7 | Wanyuanjie | 30 | Rongjingdongjie | 30 |
| 8 | Rongjingdongjie | 30 | Wanyuanjie | 30 |
| 9 | Rongchandongjie | 30 | Yizhuang Culture Park | 30 |
| 10 | Tongjinanlu | 30 | Yizhuangqiao | 35 |
| 11 | Jinghailu | 30 | Jiugong | 30 |
| 12 | Ciqu South | 35 | Xiaohongmen | 30 |
| 13 | Ciqu | 35 | Xiaocun | 30 |
| 14 | Yizhuang Railway Station | / | Songjiazhuang | / |
| Simulation Parameters | Value |
|---|---|
| Population size | 40 |
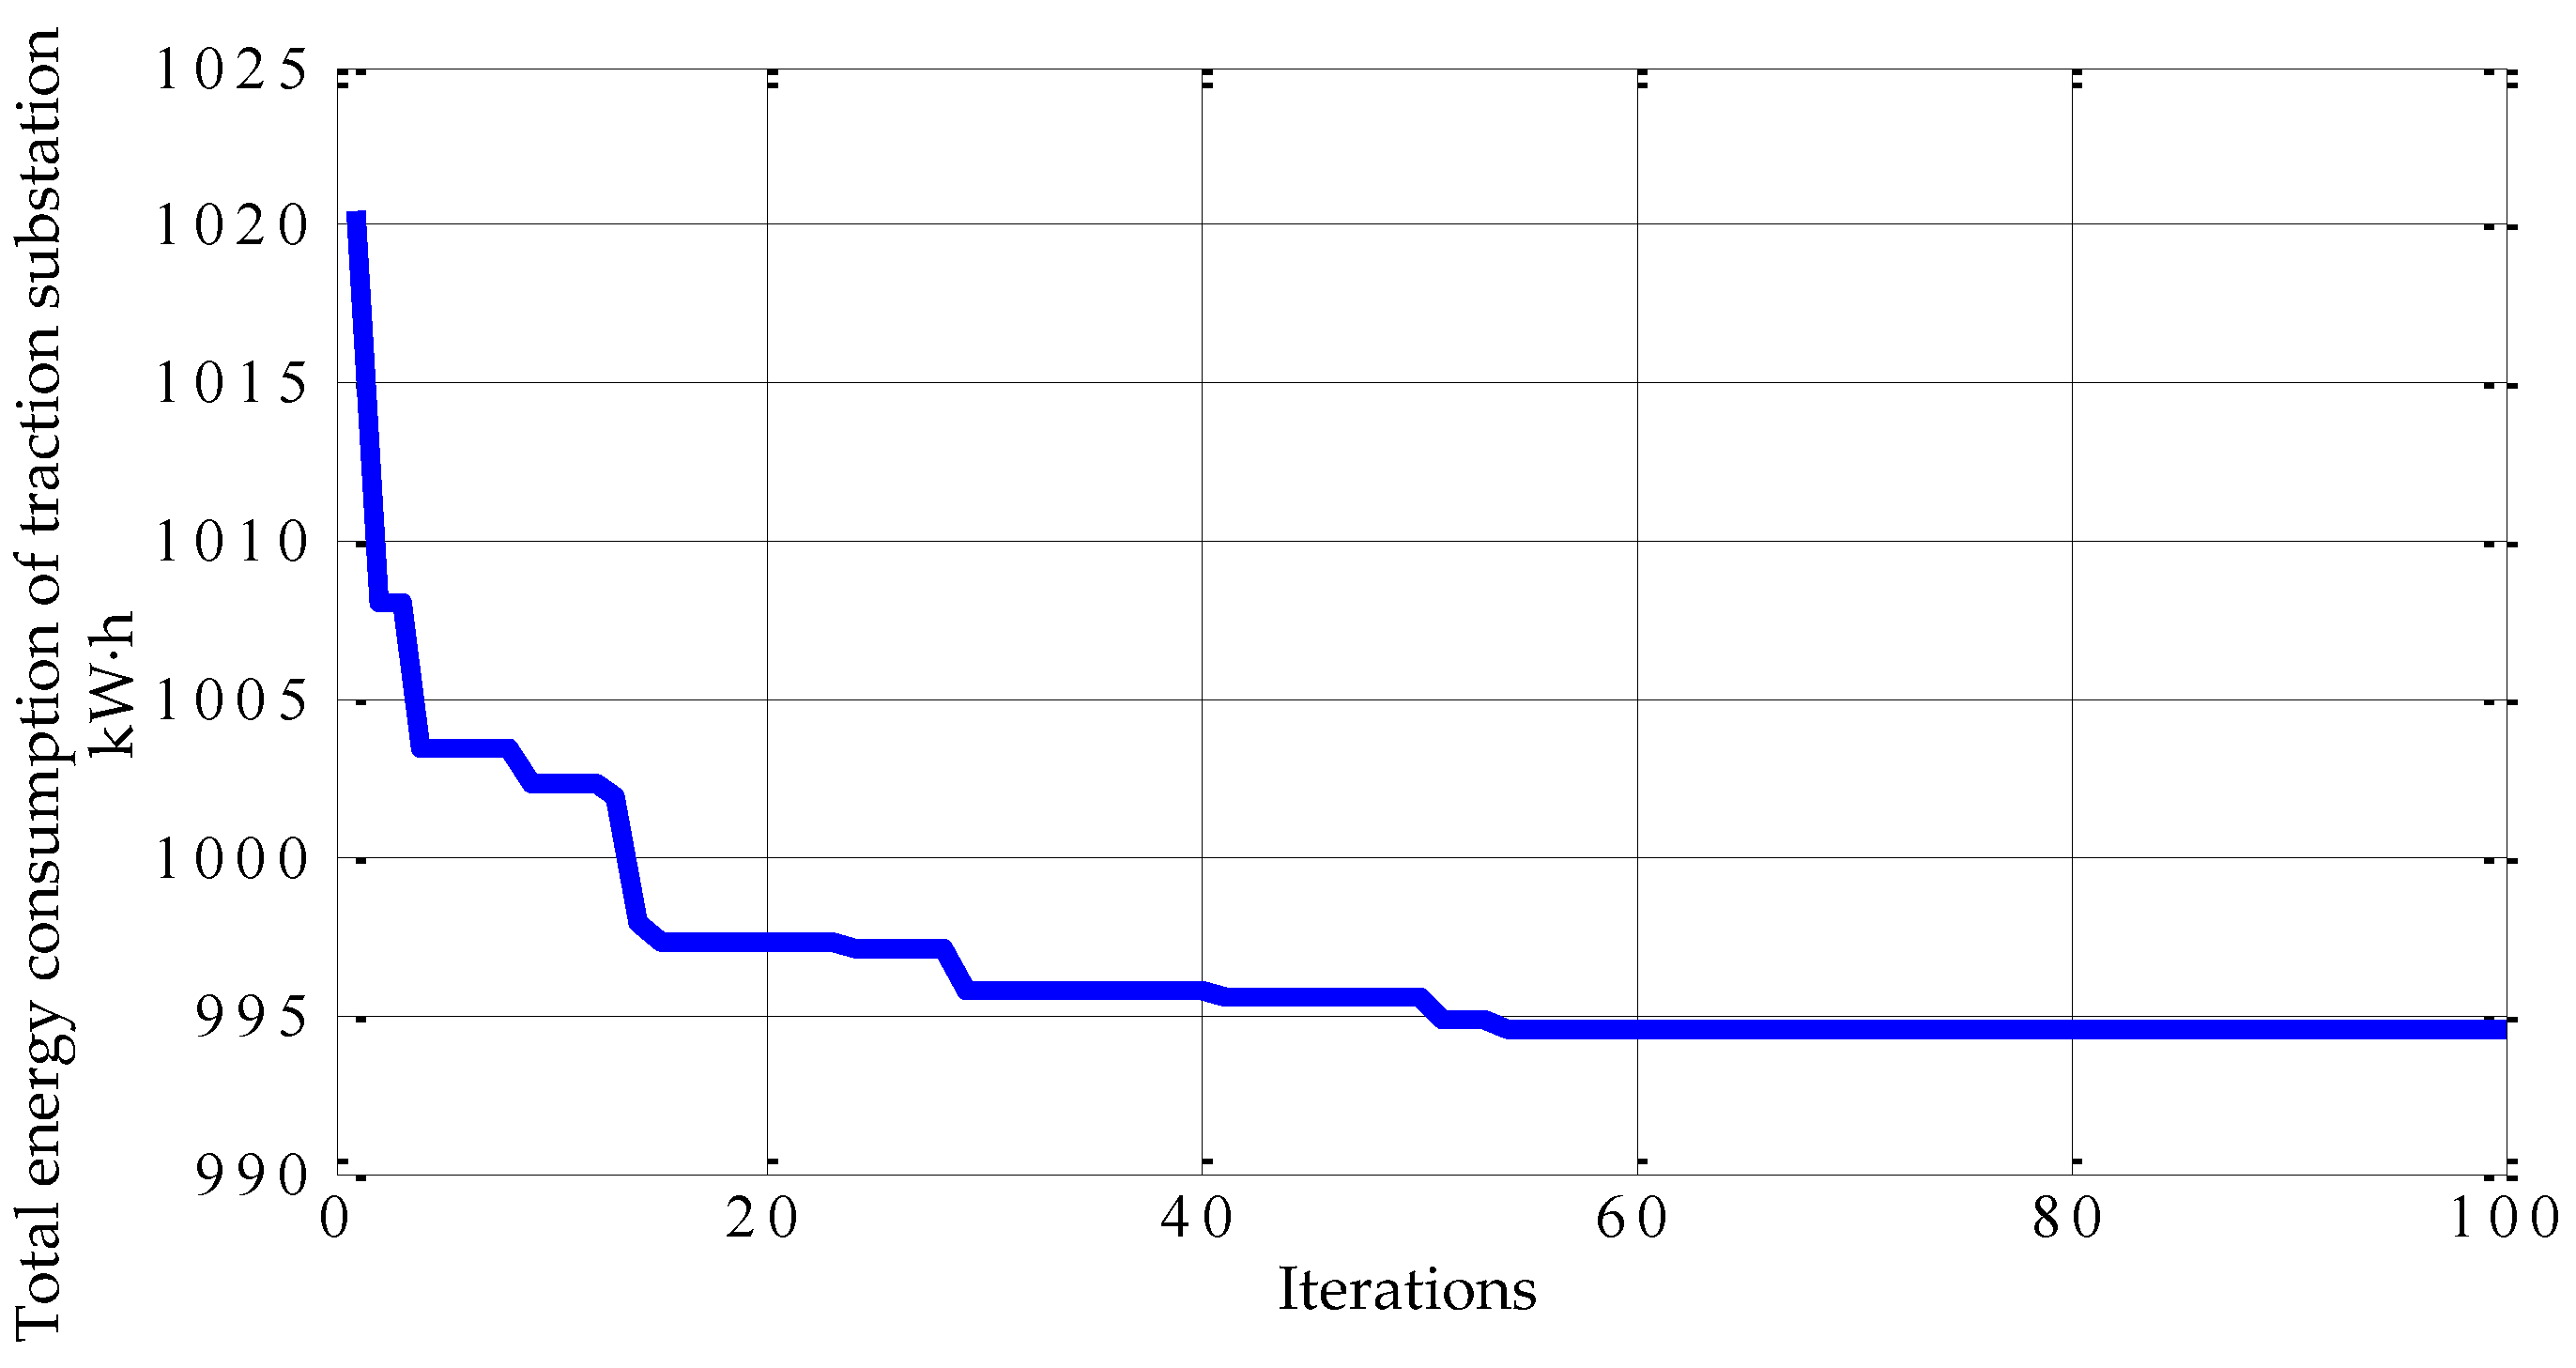
| Maximum number of generations | 100 |
| Generation gap | 0.95 |
| Crossover probability | 0.7 |
| Mutation probability | 0.01 |
| Serial Number | Station Name | Dwell Time (s) | Optimization Scope (s) | Post-Optimization Time (s) | Difference before and after Optimization | |
|---|---|---|---|---|---|---|
| Lower Limit | Upper Limit | |||||
| 1 | Songjiazhuang | / | / | / | / | / |
| 2 | Xiaocun | 30 | 25 | 40 | 35 | 5 |
| 3 | Xiaohongmen | 30 | 25 | 40 | 35 | 5 |
| 4 | Jiugong | 30 | 25 | 40 | 32 | 2 |
| 5 | Yizhuangqiao | 35 | 30 | 45 | 36 | 1 |
| 6 | Yizhuang Culture Park | 30 | 25 | 40 | 34 | 4 |
| 7 | Wanyuanjie | 30 | 25 | 40 | 35 | 5 |
| 8 | Rongjingdongjie | 30 | 25 | 40 | 33 | 3 |
| 9 | Rongchandongjie | 30 | 25 | 40 | 34 | 4 |
| 10 | Tongjinanlu | 30 | 25 | 40 | 34 | 4 |
| 11 | Jinghailu | 30 | 25 | 40 | 35 | 5 |
| 12 | Ciqu South | 35 | 30 | 45 | 31 | −4 |
| 13 | Ciqu | 35 | 30 | 45 | 30 | −5 |
| 14 | Yizhuang Railway Station | / | / | / | / | / |
| The total time | 375 | 404 | 29 | |||
| Energy Consumption (kW·h) | Before Optimization | After Optimization | Rate of Change |
|---|---|---|---|
| Train traction energy consumption | 1674 | 1655 | |
| Train regenerative braking energy | 930 | 922 | |
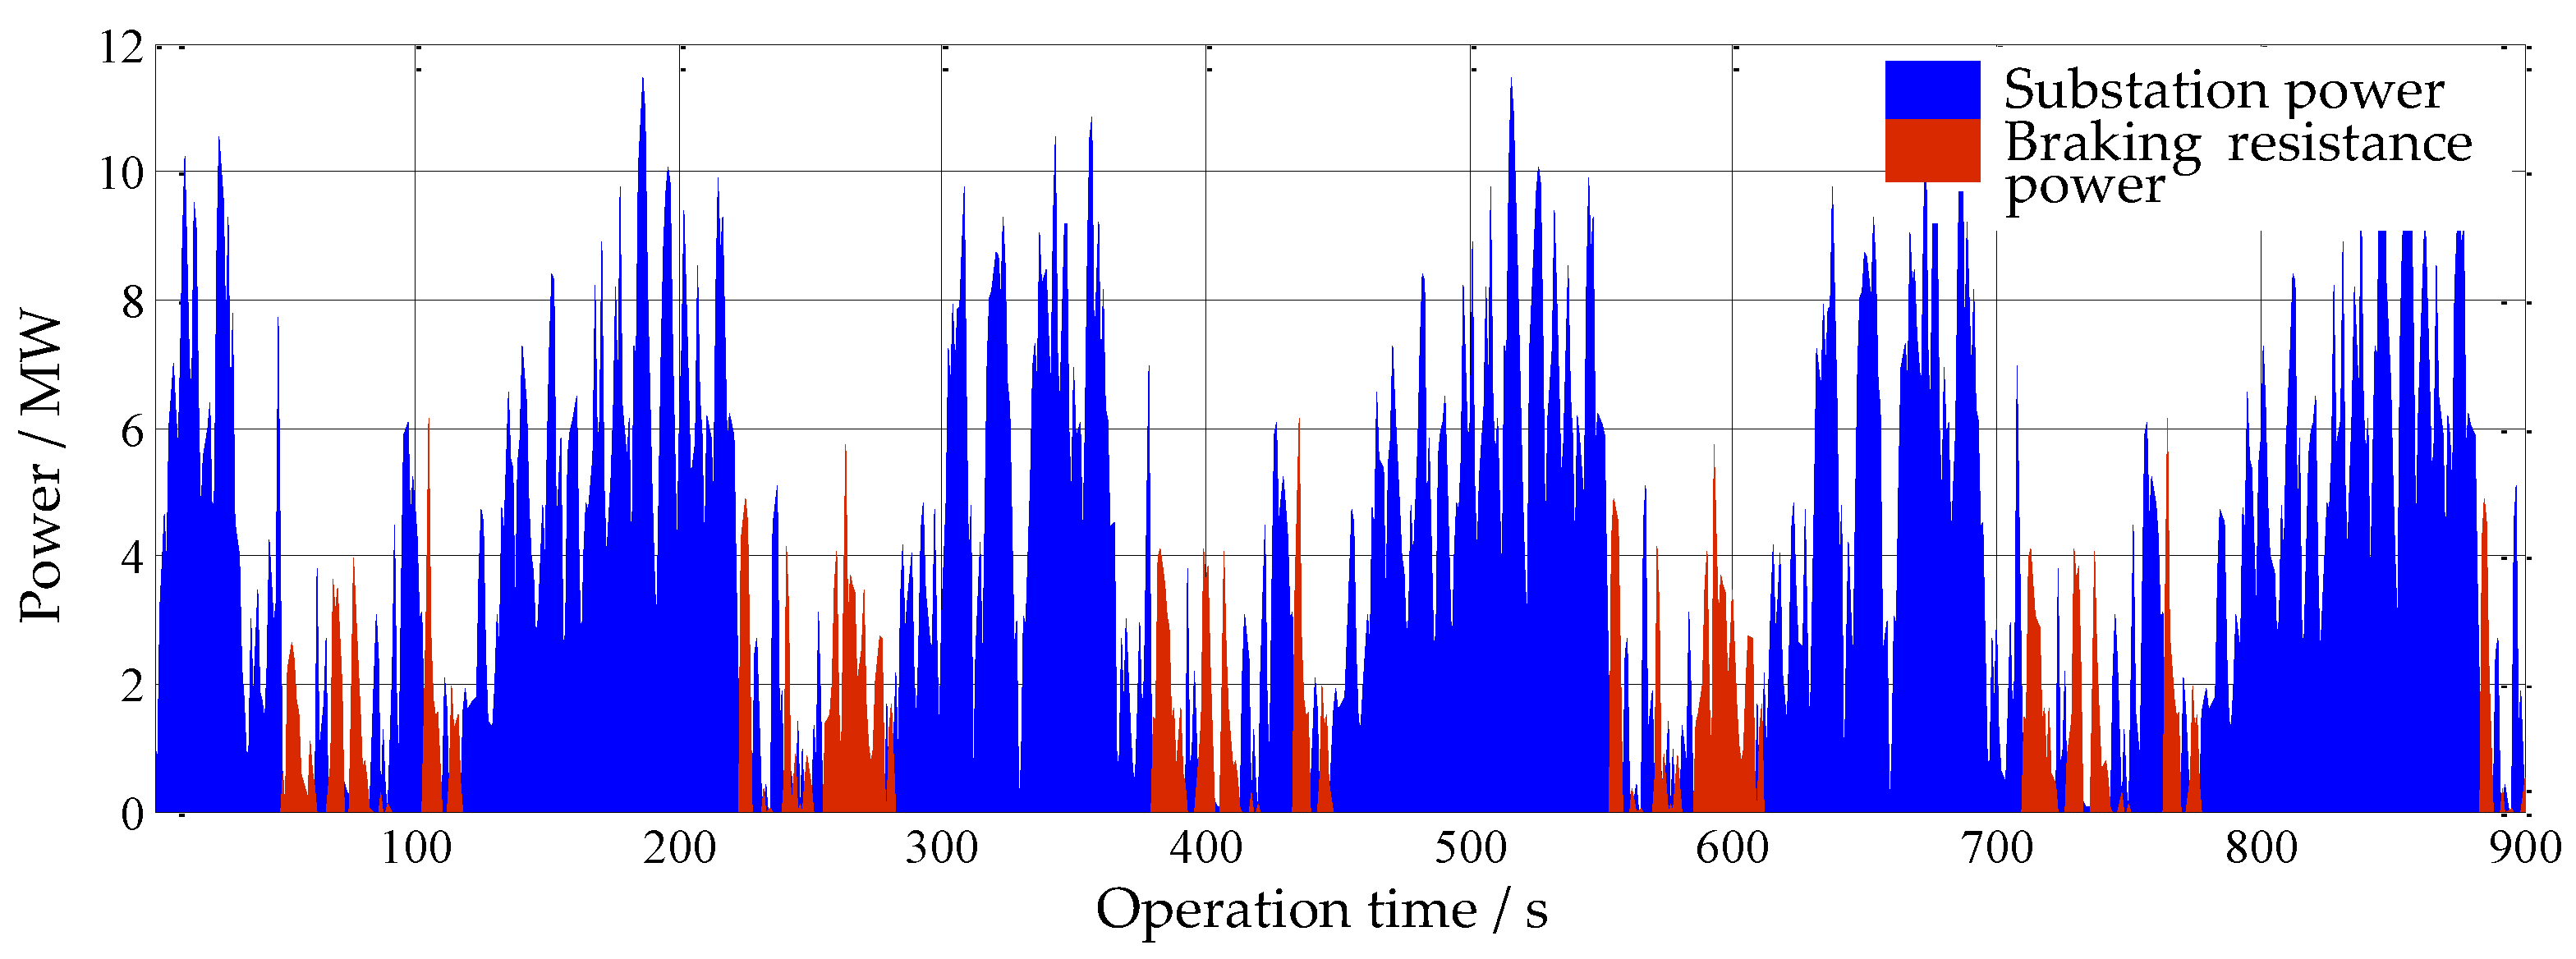
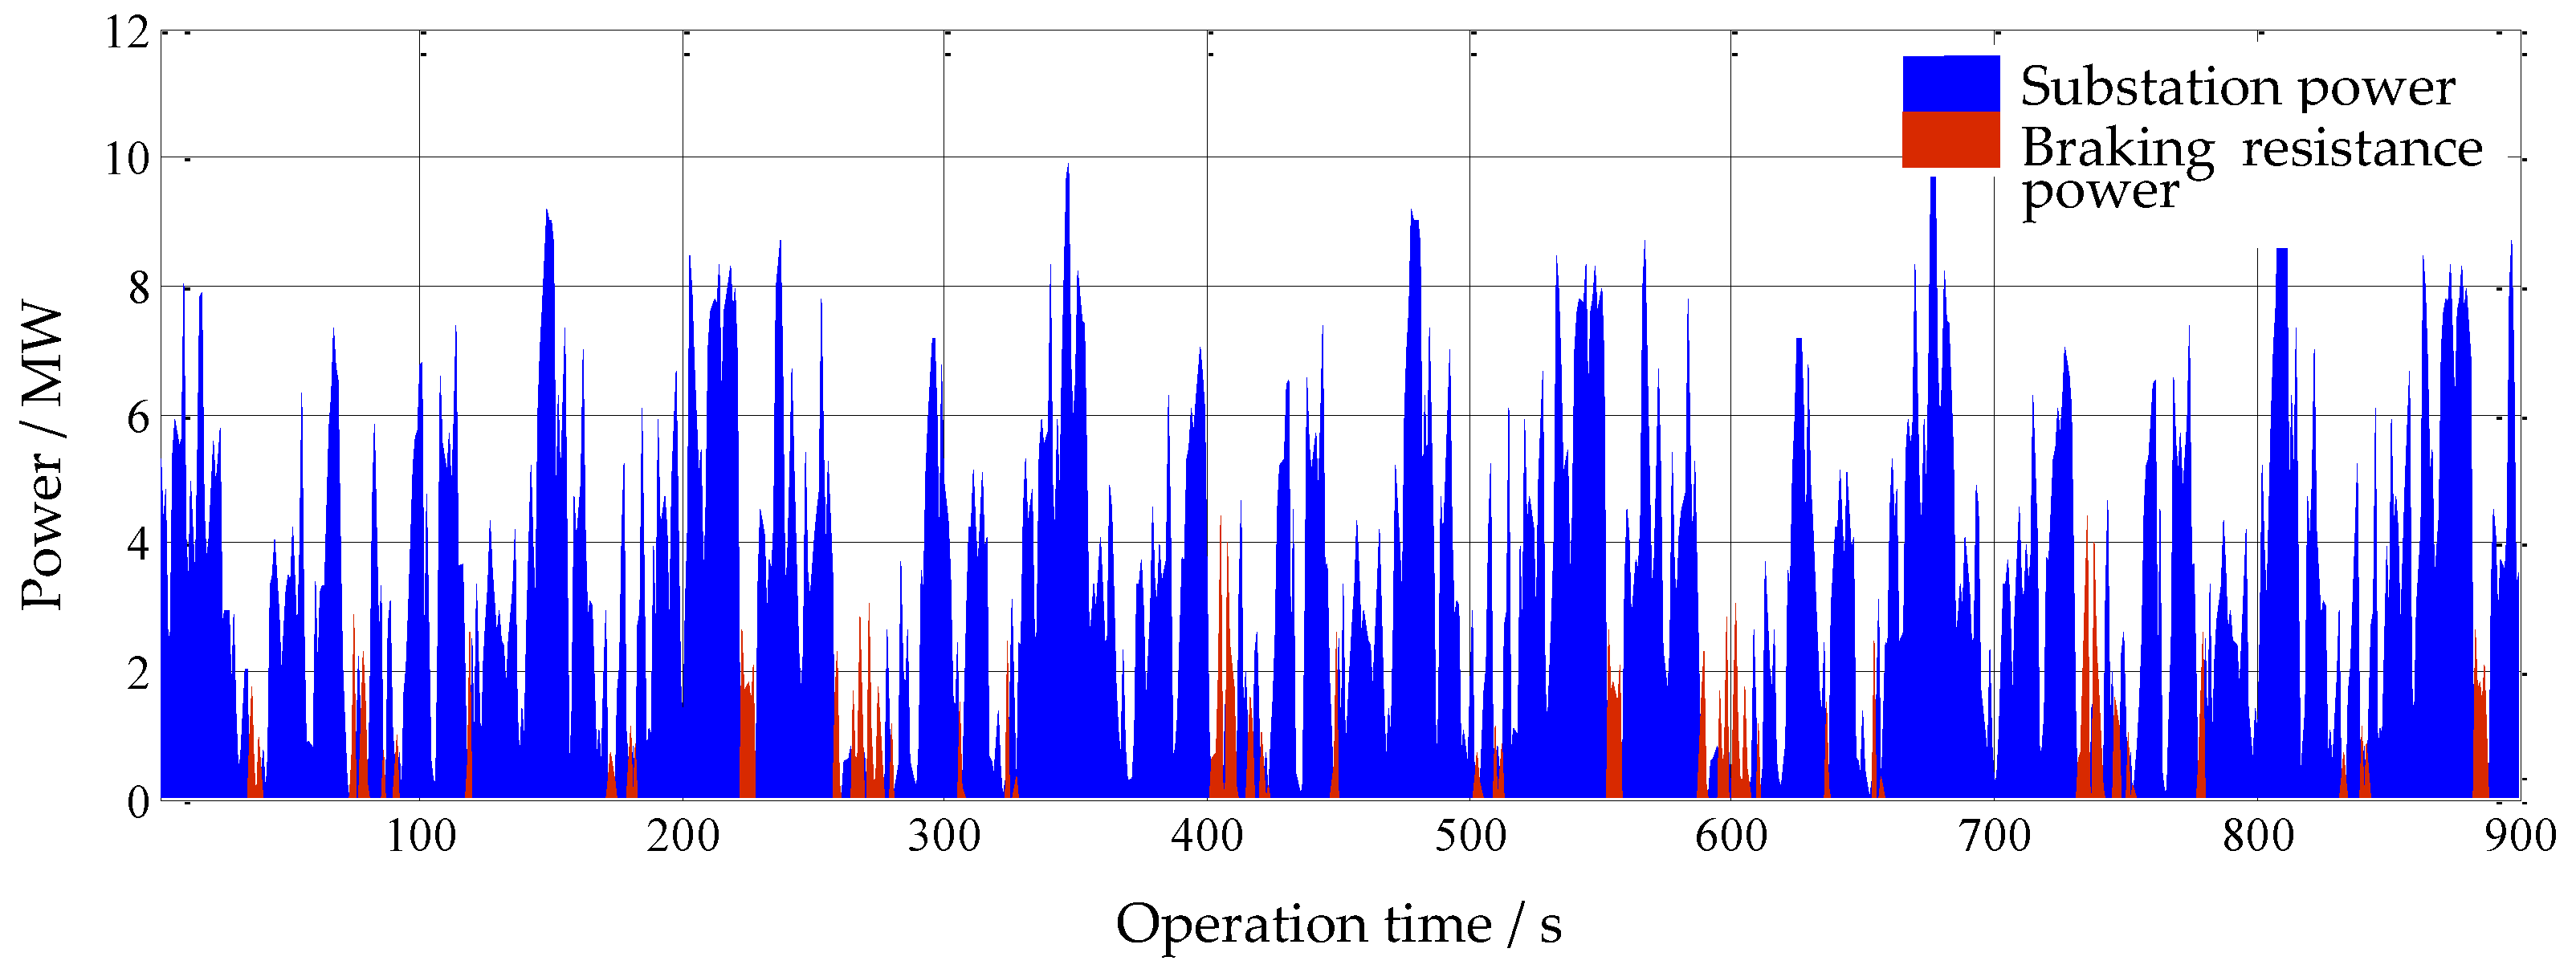
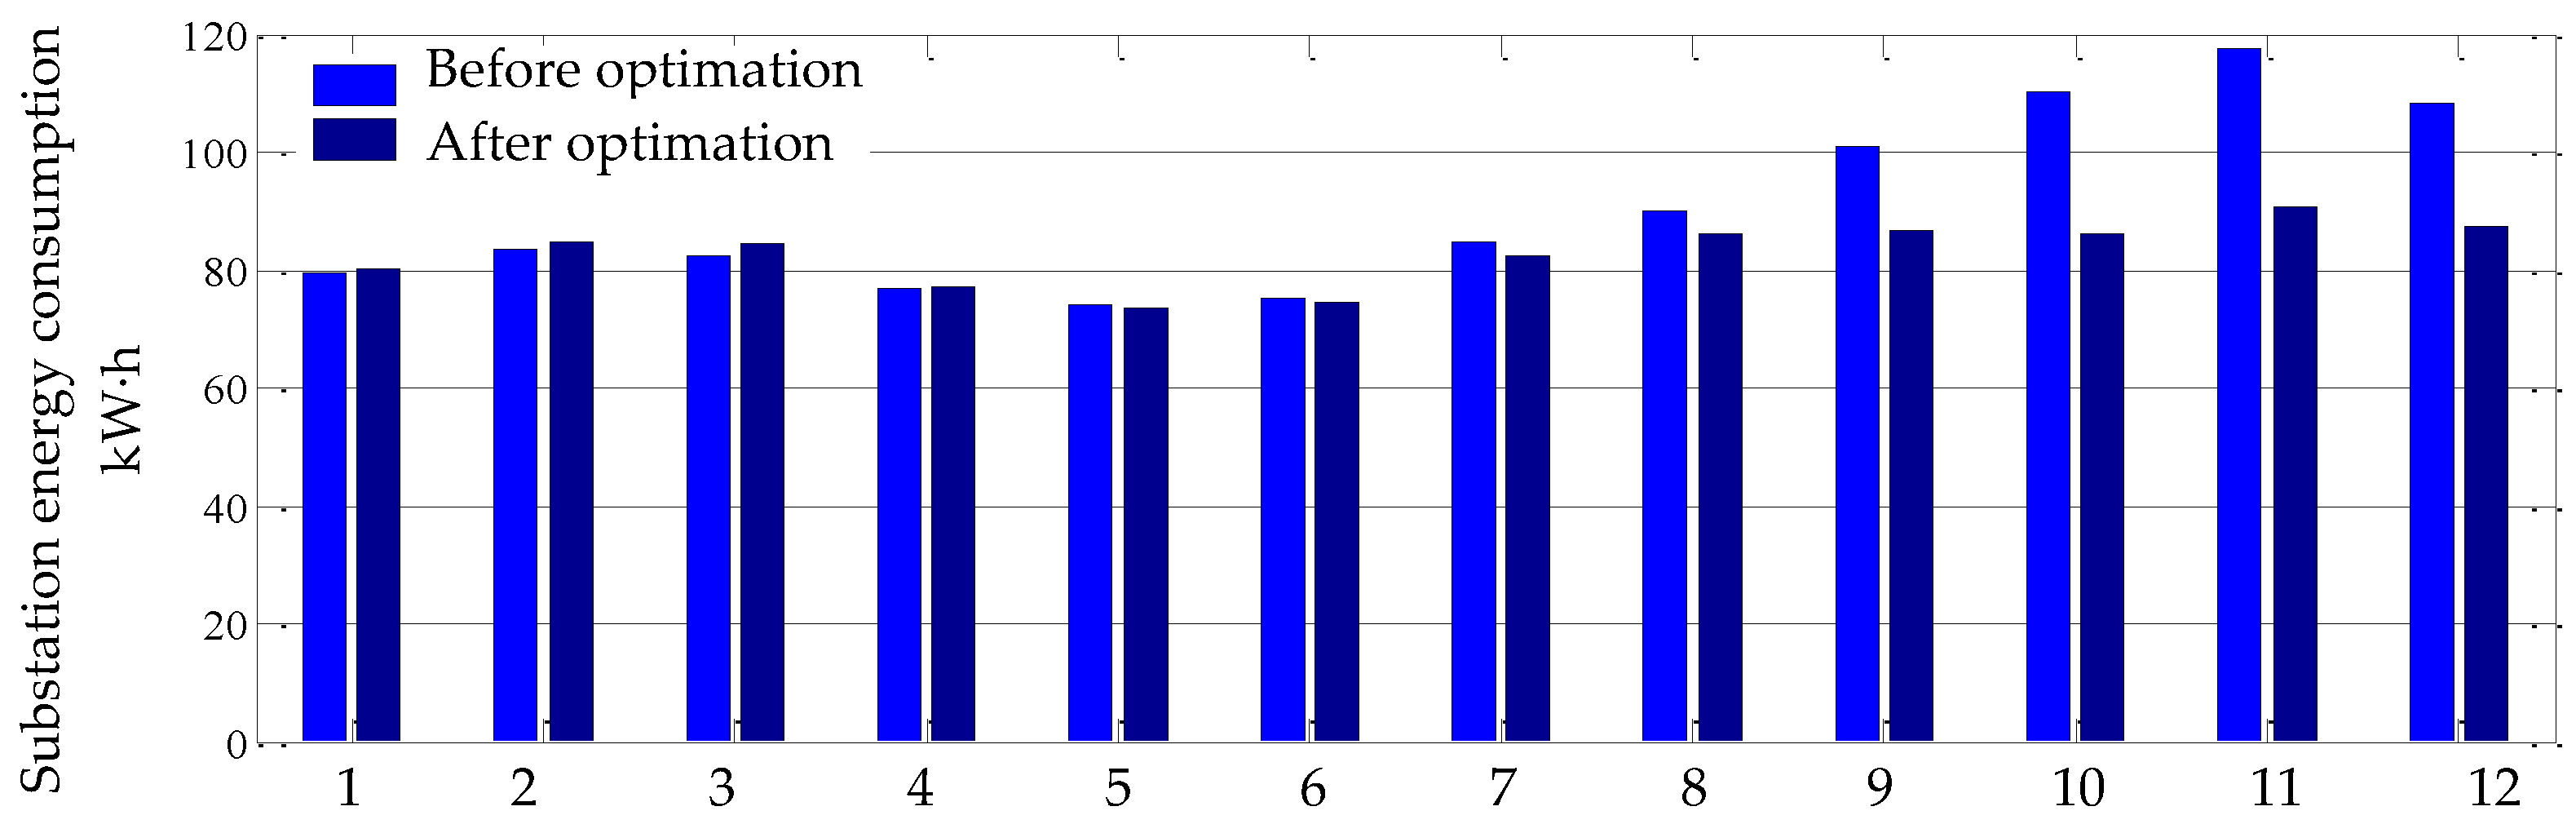
| Substation total energy consumption | 1084 | 995 | −8% |
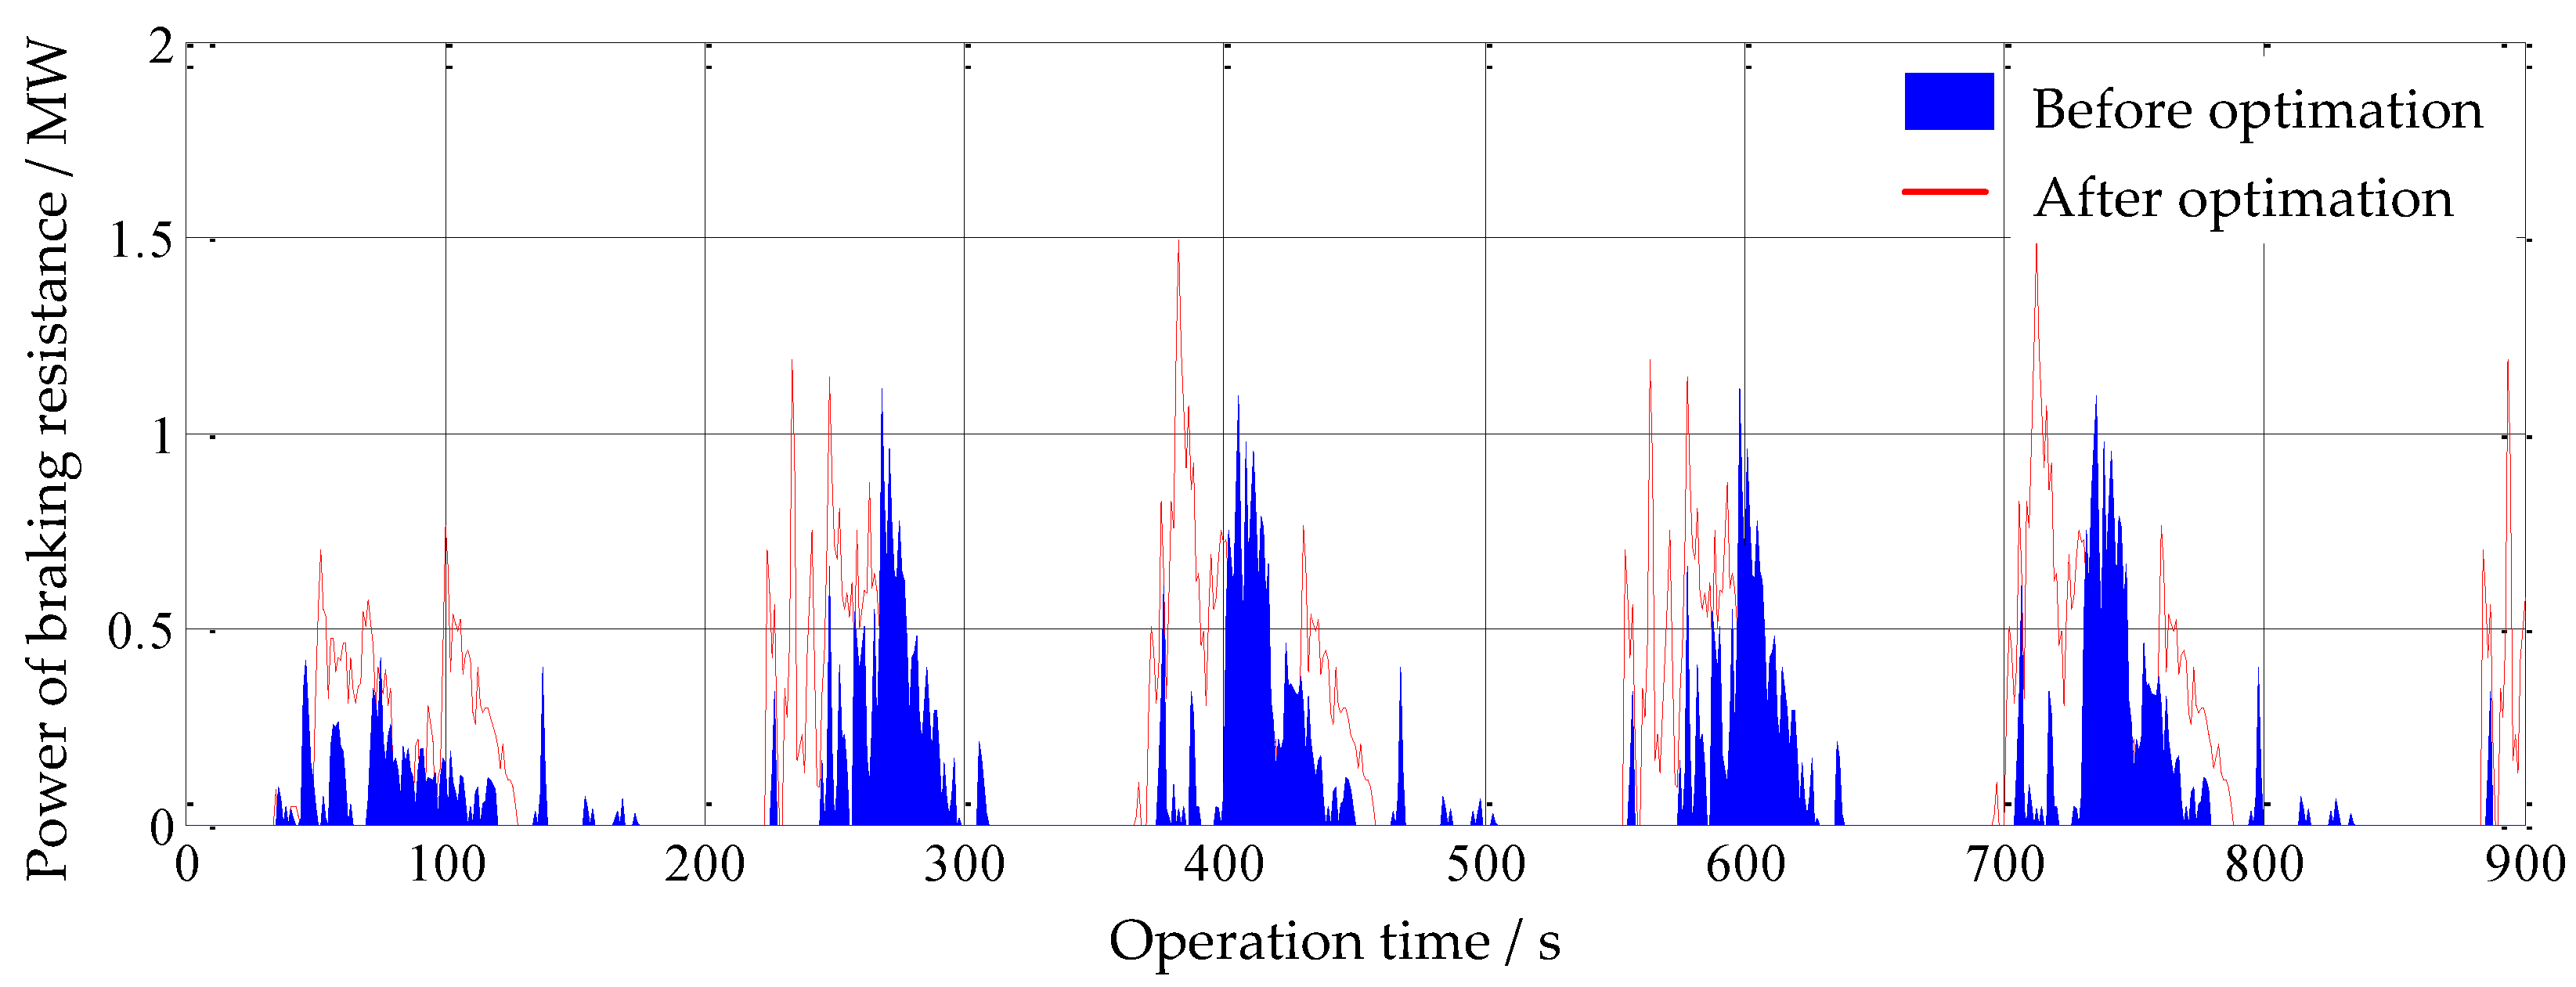
| Braking resistance absorption energy | 270 | 195 | |
| The line losses energy | 70 | 67 | |
| Utilization rate of regenerative braking | 71% | 79% | 8% |
© 2016 by the authors; licensee MDPI, Basel, Switzerland. This article is an open access article distributed under the terms and conditions of the Creative Commons by Attribution (CC-BY) license (http://creativecommons.org/licenses/by/4.0/).
Share and Cite
Lin, F.; Liu, S.; Yang, Z.; Zhao, Y.; Yang, Z.; Sun, H. Multi-Train Energy Saving for Maximum Usage of Regenerative Energy by Dwell Time Optimization in Urban Rail Transit Using Genetic Algorithm. Energies 2016, 9, 208. https://doi.org/10.3390/en9030208
Lin F, Liu S, Yang Z, Zhao Y, Yang Z, Sun H. Multi-Train Energy Saving for Maximum Usage of Regenerative Energy by Dwell Time Optimization in Urban Rail Transit Using Genetic Algorithm. Energies. 2016; 9(3):208. https://doi.org/10.3390/en9030208
Chicago/Turabian StyleLin, Fei, Shihui Liu, Zhihong Yang, Yingying Zhao, Zhongping Yang, and Hu Sun. 2016. "Multi-Train Energy Saving for Maximum Usage of Regenerative Energy by Dwell Time Optimization in Urban Rail Transit Using Genetic Algorithm" Energies 9, no. 3: 208. https://doi.org/10.3390/en9030208
APA StyleLin, F., Liu, S., Yang, Z., Zhao, Y., Yang, Z., & Sun, H. (2016). Multi-Train Energy Saving for Maximum Usage of Regenerative Energy by Dwell Time Optimization in Urban Rail Transit Using Genetic Algorithm. Energies, 9(3), 208. https://doi.org/10.3390/en9030208